Abstract
This study analyzed the health risks associated with the consumption of certain vegetables (carrot, onion, tomato, and pepper) grown in soils potentially polluted with metals (Cd, Cu, Mn, Ni, Pb, Zn) and metalloids (As) from 15 vegetable gardens in the Sasar locality. The research includes measurement of soil and plant metal concentrations, assessment of global pollution of soils with metals using Nemerow pollution index (PIN), calculation of the metal transfer factor (TF) from soil to vegetable, daily intake of metal dose (DIM) and health risk index (HRI) for both children and adults. The results (mean of 3 replicas ± standard deviation) show that the soil is moderately polluted with lead (28.39 ± 8.623 mg kg−1), nickel (23.17 ± 4.043 mg kg−1), and zinc (123.20 ± 26.918 mg kg−1), strongly polluted with copper (71.68 ± 22.463 mg kg−1), and cadmium (2.63 ± 0.881 mg kg−1). Copper exhibited the highest transfer factors (>0.08), followed by cadmium (~0.06), while zinc and nickel showed moderate values (0.02–0.03). Arsenic and manganese had relatively stable and lower levels, whereas lead displayed the lowest transfer rates (<0.01) across all vegetables. Although the calculated health risk index (HRI < 1) remains below the critical threshold, the findings emphasize the importance of moderate consumption and continuous monitoring of crops in polluted areas. The results can contribute to the integration of sustainable development principles into community policy, protecting the environment and ensuring the sustainable health of consumers.
1. Introduction
Soil pollution with metals is an environmental problem and a threat to the population’s health and fauna [1]. The metals that reach the soil do not biodegrade; there is the possibility of accumulation [2]. The plants grown on these soils can bioaccumulate these metals and transfer them into the food chain, affecting consumers’ health [3,4,5]. Studies have shown that, over time, the concentration of metals tends to decrease both in soil near industrial areas and in plants grown on polluted soils [6,7].
The soil in the Baia Mare area has been subjected to industrial pollution with metals caused by the mining exploitation and processing of non-ferrous ores and metallurgical activity. Processing these non-ferrous ores resulted in valuable metals such as gold, silver, lead, copper, zinc, and antimony. Because of outdated technology used in the past or a lack of interest, the mining and processing waste contains considerable metals that could be processed today [8,9,10]. Thus, following the non-ferrous ore processing activity, in the western of Baia Mare, close to the Sasar area, tailing ponds (Old Bozanta Tailing Pond, New Bozanta Tailing Pond, and Aurul Tailing Pond) were built containing high concentrations of metals: Pb 200–4571 mg kg−1, Cu 38.9–1435 mg kg−1, Zn 199–6734 mg kg−1, Cd 0.005–90.0 mg kg−1 [11]. Under the influence of meteorological factors, these heavy metals have been oxidized and transported by runoff and air currents, contaminating the surrounding areas [8]. Also, the metallurgical activity carried out in the past (over 150 years) by two large plants, such as Romplumb for lead production and Cuprom for copper production, led to high soil pollution with metals. These plants ceased their activity in 2008 (Romplumb) and 2012 (Cuprom), respectively [12,13,14]. Other research has revealed high concentrations of metal ions, such as Pb 32.59 mg kg−1 [15], 27,770 mg kg−1 [16], 87.8–23,300 mg kg−1 [2], Mn 593.33 ± 5.13 mg kg−1 [15], As 10–1725 mg kg−1 [17], and 5.5–295 mg kg−1 [18].
The presence of metals in soils above the permitted limit and their transfer into the human body through the ingestion of contaminated vegetables constitutes a risk for the exposed population [3,19,20,21,22]. Various vegetables grown on contaminated agricultural land absorb metals through their roots, which are then gradually transferred to the edible parts. Through the food chain, these metals enter the human body, where they can produce toxic effects [23,24]. Long-term consumption of vegetables containing metals can lead to nervous, bone, endocrine, cardiovascular, and immune system diseases, as well as cancer, etc. [5,25,26,27,28,29].
Therefore, assessing the health risks of vegetables grown in contaminated soil is essential. Over time, interest in evaluating the transfer of metal from soil to plants and the degree of risk to human health associated with consuming vegetables grown on soils potentially polluted with metal ions increased [3,4,20,30]. Human health risk assessments related to the consumption of vegetables grown in soils potentially contaminated with metals provided an effective evaluation of the health risks associated with such soil as a cultivation substrate. Assessments of the health risks associated with the consumption of vegetables (red amaranth, radish, Indian spinach, cauliflower, tomato, celery, onion, lettuce, eggplant, and pumpkin) harvested from potentially metal-contaminated land have shown that they differ depending on the soil, pollutant concentrations, and the type of investigated plants, noting that they may have a low health risk, moderate risk, and significant risk, respectively [19,22,31,32,33].
Studies have shown that the carcinogenic risk of ingestion by eating food contaminated with metals is higher for children than for adults because children’s immune systems are weaker than those of adults [34,35]. Thus, it was highlighted that significant risks are associated with exposure to Cd [32] and Ni [36].
To assess the level of soil pollution with heavy metals and the possibility of metals entering the food chain through the consumption of vegetables, it is necessary to calculate the global pollution index (PIN), the soil–plant transfer factors (TFs), the daily amount of ingested metal (DIM), and the human health risk index (HRI) [3,37,38]. The research results showed that in the case of vegetables (potatoes, onions, garlic, carrots, parsley, lettuce, tomatoes, and beans), Cd, Zn, and Ni had the highest transfer factor (TF > 1), and this reflects the high capacity of these vegetables to accumulate metals [14,33,39].
The present study aimed to assess the health risks associated with consuming vegetables (carrot, onion, tomato, and pepper) grown on potentially metal-polluted soils in the Sasar locality in the western vicinity of Baia Mare City, Romania. To make these assessments, metal concentrations in soil and plants were determined, and the global pollution index, the transfer factor, the daily metal intake, and the health risk index for both children and adults were calculated. The importance of the study is related to the consumption of vegetables in the investigated area and the impact on the local community and external consumers, as in the studied area, the main practice is growing vegetables, which often end up being sold in regional markets. The study contributes to a better understanding of the impact of soil pollution, highlighting the risks associated with consuming vegetables grown in contaminated environments. The sustainability of food systems and human health relies on soil quality. Therefore, this study provides data on contamination and health risks, aiding in the development of pollution mitigation strategies and long-term land management policies aligned with sustainability principles.
2. Materials and Methods
2.1. Presentation of the Study Area and Sampling
The studied area belongs to the Sasar locality, which is geographically in the northern part of Romania. It is neighbored to the northeast by Baia Mare City and to the north-northwest, at less than 1 km, by three mine tailings ponds: the Old Bozanta Tailing Pond (T1), the New Bozanta Tailing Pond (T2), and the Aurul Tailing Pond (T3). The first two mentioned tailing ponds have been closed, with vegetation installed on the slopes for the most part [40]. The Aurul tailing pond has the activity suspended. For the present study, 15 vegetable gardens were chosen (Figure 1), from which soil and vegetable samples were taken in July 2024.
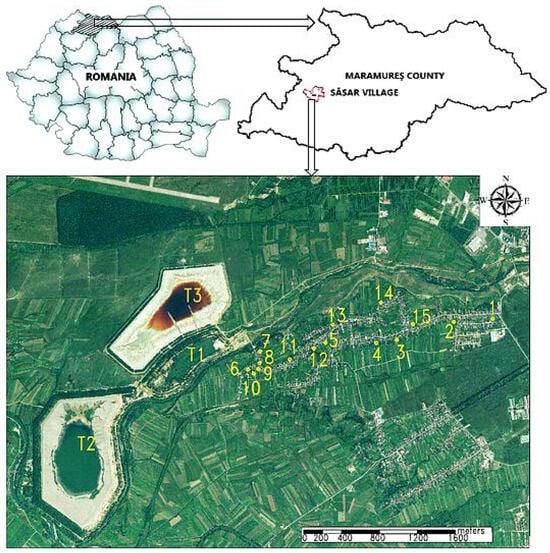
Figure 1.
The studied area is from the Sasar locality, Maramures County. Numbers 1–15 indicate the locations of the soil sampling points; T1—Old Bozanta tailing pond, T2—New Bozanta tailing pond, T3—Aurul tailing pond.
Soil samples were taken with a soil probe from 0–20 cm depth according to STAS 7184/1-84 [41]. From each garden, 3 soil samples of 250 g were collected from the place of each type of investigated vegetable, thus, a total of 12 soil samples were taken from one garden.
From each garden, 3 samples of each vegetable, about 100 g, were collected: carrot (Daucus carota), onion (Allium cepa), tomato (Solanum lycopersicum), and pepper (Capsicum annuum), thus obtaining 45 samples of each type of vegetable compared with the entire study area. The four vegetables analyzed were chosen because they are the most commonly grown and consumed in the study area.
Both the soil samples (180 samples) and the vegetable samples (180 samples) were packed in polythene zip bags, sealed, properly labeled, and preserved at (4 ± 1) °C in refrigerated boxes and later transported to the laboratory.
2.2. Preparation and Analysis of Samples
Once in the laboratory, the soil and vegetable samples were prepared for soil characterization and heavy metal concentration determination from both sample categories.
The soil samples were prepared and analyzed at the Office for Pedological and Agrochemical Studies of Maramureș County laboratory according to the standardized working methodology (Table 1), with the following parameters analyzed: pH, humus, hydrolytic acidity (VAh), the sum of exchangeable bases (SB), mobile phosphorus, and mobile potassium. Each analysis was replicated 3 times, and the paper presents their average with a deviation of ±2.

Table 1.
Pedological and agrochemical characteristics of soil [42,43,44,45,46,47,48].
The soil samples were taken using the quarter method after the prior removal of foreign bodies. A total of 100 g of each soil subsample was dried at ambient temperature (T = 23 ± 2 °C), milled, sieved through a 1 mm mesh sieve using the Retsch AS200 device (Retsch GmbH, Haan, Germany), and then weighed 1 ± 0.05 g of soil and subjected to mineralization in Teflon tubes, in the Millestone Ethos Easy microwave oven (Millestone, Milano, Italy). The mineralization was performed with a mixture of acids (18 mL HCI 37%, 6 mL HNO3 65% + 2 mL H2O2 30%) in 2 stages: (i) increasing the temperature to 200 °C (10 min) and (ii) maintaining the temperature at 200 °C (15 min) [50].
The inedible parts were removed from each vegetable as follows: the leaves of the carrot; the tail, the elbow, and the seeds of the peppers; the first leaves and roots of the onion; and the stem from the tomato. The vegetables were thoroughly washed and ground using a blender (Philips, Amsterdam, EU). From each type of vegetable, 15 ± 0.1 g were weighed and subjected to mineralization in Teflon tubes in a Milestone Ethos Easy microwave oven (Milestone, Milano, Italy), with a mixture of acids (1 mL of H2SO4 96%, 20 mL HNO3 65% + 4 mL H2O2 30%), in 2 stages: (i) increasing the temperature to 200 °C (10 min), and (ii) maintaining the temperature at 200 °C (20 min) [51].
The solution obtained after the mineralization of the soil and vegetable samples was transferred into 100 mL volumetric flasks, brought to the mark with ultrapure water and then analyzed with Flame and Electrothermal Atomization Technique using atomic absorption spectrometer Perkin Elmer Analyst 900T (PerkinElmer, Waltham, MA, USA) to determine the concentration of metals [52] in analytical conditions (Table 2).
Table 2.
Analytical conditions for the determination of metallic and metalloid elements.
The assurance of the validity of the results was performed by processing identically to the soil samples, a sample of the reference material traceable to NIST, type 2710a Montana I–Soil Highly Elevated Trace Element Concentrations (National Institute of Standards and Technology, Gaithersburg, MD, USA) for which the values of the metals of interest met the acceptability criteria from the quality certificate of the reference material (uncertainty, with k = 2), with a recovery rate of 95–105%.
2.3. Indices of Soil Pollution and Health Risk
To assess the degree of metal pollution in the investigated area, the single pollution index (PIi), the global pollution index Nemerow (PIN), the transfer factor (TF) of metals in vegetables (carrot, onion, onion, tomatoes, and peppers), the daily intake of metal (DIM), and the human health risk index (HRI) associated with vegetable consumption were calculated. To determine the pollution degree of the investigated area, the global pollution index Nemerow (PIN) was calculated using Equations (1) and (2) [53]:
where the following is true:
PIi—The single pollution index;
Csoil—The metal concentration in soil (mg kg−1);
Si—The reference value for the determined metal (mg kg−1),
PIave—The average pollution index;
PIimax—The maximum pollution index;
PIN—The global pollution index Nemerow.
For the risk assessment associated with the transfer of heavy metals into the food network, the transfer factors (TF) of the metals studied from soil to vegetables were calculated using Equation (3) [30,38,54]:
where the following is true:
—The transfer factor;
—The metal concentration in vegetables (mg kg−1);
—The metal concentration in soil (mg kg−1).
The daily intake of metal dose (DIM) by vegetable consumption is calculated with Equation (4) [38,55].
where the following is true:
Cveg—The metal concentration in vegetables (mg·kg−1);
Fconc.—Conversion factor (0.085);
Dfood—Daily intake of vegetables (adult: 0.345 [kg·inh−1·d−1]; child: 0.232 [kg·inh−1·d−1] [55];
CABM—The average body mass (child: 32.7 kg, adult: 70 kg) [55,56].
The health risk assessment, as a result of the penetration of metals into the human body by ingesting vegetables (carrots, onions, tomatoes, and peppers) harvested from the studied soil, was performed by calculating the human health risk index (HRI) for each metal (Equation (5)) [38]:
where the following is true:
—The daily intake of metal dose;
RDf—The reference oral dose.
The data in Table 3, according to the information in the literature, were used to calculate and interpret the results in this sub-chapter.
Table 3.
The values used in calculations.
Microsoft Office Excel was used to process statistical data on the metal content in soil and vegetables.
3. Results and Discussion
3.1. The Soil Characterization
The ranges of values for the determined agrochemical indicators for soils in the studied area are presented in Table 4.
Table 4.
Agrochemical indicators of the studied soils.
Analyzing the agrochemical indicators, humus, phosphorus supply, potassium, and nitrogen, and considering the levels of nutrient supply by the methodology, a characterization of the fertility status of the soils studied was performed [67].
The humus reserve varies depending on the sampling points, showing a low humus content of 2.07% in P–P12, a high content of 3.6% in P2–P4 and P13–P15, and a medium content of 2.7% in P1. The pH of the samples ranges between 6.10 and 6.85, indicating slightly acidic soil. The sum of exchangeable bases in soils varies between 8.26 and 28.26 me·100 g−1 soil. In P4 and P5, the value is very low, at 8.26 me·100 g−1 soil, suggesting a low content of exchangeable bases in the investigated soils. In contrast, the other samples show higher values, ranging from 11.53–28.26 me·100 g−1 soil, specific values of fertile soils.
The potassium is very low (PALc = 2–5 mg kg−1) in all soil samples. The soil supply with phosphorus is very weak (≤66 mg kg−1) in points P1, P2, P4, P9–P11, P14, and P15, weak (68–100 mg kg−1) in points P5–P8, P12, P13, and medium (174 mg kg−1) in P3. For the assessment of the nitrogen quantity, the hydrolytic acidity (VAh) was taken in the analysis, observing a good nitrogen supply in P2 (4.05), as opposed to the sampling points P4, P5, P9, and P10 for which there is a small nitrogen supply (1.36–1.96), and the rest of points where medium nitrogen is provided (2.1–3.62).
Following the characterization of the samples, it was found that the soil taken from P1 has a clay texture and angular polyhedral structure, which are the specific characteristics of Gleiosol-type soil. In most sampling points (P5–P12), a stagnant Luvosol soil with a sandy loam texture with an angular polyhedral structure was identified. In the case of points P2, P3, P4, and P13–P15, a soil of Stagnosol type was highlighted, having clayey loam texture and granular structure.
The results on the concentration of metals determined in soil samples (Table 5) were compared to the reference values, defined by Order 756/1997 [57], and it was observed that mean concentrations of all investigated metals: As (5.22 mg kg−1), Cd (2.63 mg kg−1), Cu (71.68 mg kg−1), Mn (992.70 mg kg−1), Ni (23.17 mg kg−1), and Pb (28.39 mg kg−1 and Zn (123.2 mg kg−1) exceed the normal value but do not exceed the alert threshold for sensitive use soils.
Table 5.
Descriptive statistics for metals concentration in soils.
The Skewness analysis shows the symmetry of the value string of the considered indicator. For most of the analyzed elements, the Kurtosis and Skewness analysis had values in the interval (−1 ÷ +1); thus, it can be regarded as a homogeneous distribution of the analyzed indicators in the considered area. The values of the Kurtosis and Skewness factors outside the range (−1 ÷ +1) denote punctual exceptions, which can be explained by using various ways of improving the agrochemical factors of the soil (fertilizers, composts from own sources, herbicides, pesticides). In soils, most metals have slightly asymmetric distributions and exhibit variability according to standard deviation (SD).
The concentrations determined for As, Pb, Ni, and Zn in soil have values below the alert threshold (Figure 2). In the case of As, the normal value (5 mg kg−1) is exceeded in nine of the 15 investigated points, but in seven of them, the exceedance is minimal. Only in three points are significantly higher concentrations recorded, above 6.33 mg kg−1, with a maximum of 7.06 mg kg−1 in P6 and P11. For Pb, most samples exceed normal values, and samples P11, P12, and P13 are close to the alert threshold (50 mg kg−1). The ion concentration of Ni (Figure 2) in samples P12 and P15 (32.3–38.3 mg kg−1) slightly exceeds the normal value, but otherwise, all samples fall below the alert threshold (75 mg kg−1). The same trend is observed in the case of Zn ions, where samples P8 and P15 (183 mg kg−1 and 165 mg kg−1) slightly exceed the normal value but are below the alert threshold (300 mg kg−1).
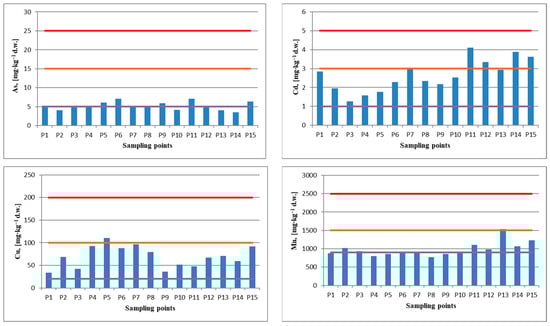
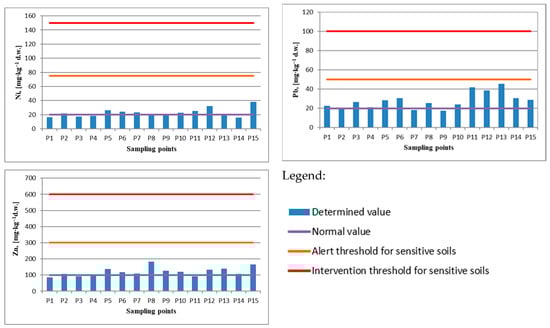
Figure 2.
The metal concentrations determined in soil samples.
In all 15 sampling points, the concentration of Cd and Cu has higher values than the reference normal value. Cu concentration slightly exceeded the alert threshold (100 mg kg−1) for sensitive soils in P5 (110.6 mg kg−1). In the case of Cd ions, it was found that in five points, the alert threshold for soils with sensitive uses (3 mg kg−1) was exceeded, up to 3.88 mg kg−1 (P14) and 4.11 mg kg−1 (P11), respectively. Of the 15 soil sampling points, in 10 points, the concentration of Mn exceeded the normal value, and in P13 (1538 mg kg−1), the alert threshold was slightly exceeded. In the points located neighboring the area of the tailing ponds the values of Cd (P11, P12, P14), Cu (P5), and Mn (P13) overrun the alert thresholds, and the values of Cd (P6–P8, P10, P13), Cu (P6–P8, P15), and Pb (P11–P13) are very close to the alert thresholds. These higher values could be influenced by occasional dust carried by air currents from the surface of the ponds in the area [8,40,68,69,70].
In P1, a link between the clay texture of the soil and its higher cation exchange capacity, which allows better retention of metal ions like Pb, Cd, and Ni, is noticed. The angular polyhedral soil structure improves soil aeration, which might affect the mobility of metals through oxidation. Being a Gleiosol-type soil, the mobility of Mn might be slow at this studied point,
For the sampling points P2, P3, P4, and P13–P15, having a clayey loam texture provides a balanced mix of sand, silt, and clay. This high cation exchange capacity allows better availability of metals/metalloids like Cu, Pb, and Zn, as well as Cd, Zn, and As. The granular soil structure might affect metal uptake by metal oxidation and microbial activity. Additionally, the mobility of Mn might be slow due to the poor drainage of the soil.
In the case of sampling points P5–P12, which have a sandy loam texture with an angular polyhedral structure, metals/metalloids such as Cu, Zn, Mn, and As exhibit better mobility due to good drainage and aeration. However, sometimes, roots and microbial activity might affect metal uptake.
In this study, the average concentrations of metals in soil samples Cu 71.68 mg kg−1 amd Cd 2.63 mg kg−1 were like those presented by other researchers in studies conducted in this area in the years 2010–2015: Cu: 22–118 mg kg−1 [71] Cd: 1.9–2.9 mg kg−1 [39]. In the case of Cd, similar values of 3.1–21 mg kg−1 [72] and 1.2–32 mg kg−1 [69] were registered, but they were smaller than 11.3 mg kg−1 [73] and 25.18 mg kg−1 [74]. The trend of decreasing concentrations was noted in the case of Pb 28.39 mg kg−1 and Zn 123.2 mg kg−1, for which there was a decrease in concentrations over the years: Pb 32–165 mg kg−1 [71] 154–231 mg kg−1 [39] and Zn 80–308 mg kg−1 [71], and 97–163 mg kg−1, respectively [39]. The average value for Pb in the studied soils is much lower than the value determined by Lacatusu et al. (2007) [72] and Bora et al. (2017) for this metal in the soils of Baia Mare 3290.18 ± 177.42 mg kg−1 [74] and 967 mg kg−1 [73], respectively. The same applies to Zn, with concentrations below 1941.55 ± 28.51 mg kg−1 [74] and 914 mg kg−1 [73].
Considering the closest points to the three tailings ponds, P6–P11, the comparative analysis of metal concentrations in the soil with those from other sampling points does not show a significant difference and, therefore, does not indicate a strong influence from the ponds. Thus, out of the 6 points, maximum values of the studied metals were identified only for three metals in 4 points, namely cadmium in P11 (4.11 mg kg−1), arsenic in P6 and P11 (7.06 mg kg−1), and zinc in P8 (183 mg kg−1). For the other studied metals, the values were close to the average values.
3.2. Vegetable Characterization
The concentrations of metals of interest (As, Cd, Cu, Mn, Ni, Pb, Zn) determined in the studied vegetables (carrot, onion, tomato, and pepper) are presented using descriptive statistical analysis (Table 6). The Kurtosis variability indicates outliers for metals such as Ni in carrots (5.75) or onions (3.46). Higher values for certain metals could involve sporadic contamination or a higher metal uptake in plants. Positive deformation and higher Kurtosis in some soil and vegetable metals highlight the potential for localized contamination or natural variability, suggesting the need for specific soil and crop tests to prevent adverse health effects.
Table 6.
Descriptive statistics for metals concentration in vegetables.
The research results from this study were compared to other studies to highlight the degree of metal accumulation in the plants investigated in correlation with other research. The mean values of Cd 0.15 mg kg−1 in carrots are close to those reported by Dziubanek et al. (2015), Islam and Hoque (2014), and Roba et al. (2015): 0.14–0.37 mg kg−1 [14], 0.10 mg kg−1 [75], and below the value of 0.460 mg kg−1 [76]. The average concentration of Pb 0.22 mg kg−1 is higher than the concentration of 0.10 mg kg−1 [75] but below the value of 0.99 mg kg−1 [76] and below the 2.0–2.6 mg kg−1 range [14]. Zn 2.76 mg kg−1 is markedly below the 14.2–32.54 mg kg−1 range reported by Roba et al. 2015 [14]. In onions, the mean values of Cd 0.15 mg kg−1 and Cu 5.48 mg kg−1 are close to those in the literature: Cd 0.05–0.24 mg kg−1 [14] and 0.05 mg kg−1 [75], Cu: 1.1–5.2 mg kg−1 [14]. Pb 0.25 mg kg−1 is also like 0.6–1.7 mg kg−1 [14] and 0.10 mg kg−1 [75], and Zn (2.77 mg kg−1) is below Zn 7.3–27.27 mg kg−1 [14].
For tomatoes, the values obtained for As (0.10 mg kg−1) are significantly higher than those obtained by Islam and Hoque (2014) (As 0.01 mg kg−1) [76]. By contrast, the value for Ni 0.45 mg kg−1 is considerably below the levels reported in the same study, where Ni 2.13 mg kg−1 [77]. Cd 0.08 mg kg−1, Cu 1.62 mg kg−1, and Pb 0.12 mg kg−1 are similar to previous data points Cu 1.2–3.1 mg kg−1 [14], Pb 0.2–0.5 mg kg−1 [14] and 0.10 mg kg−1 [75] but lower than Cu 17.50 mg kg−1 [77] and Pb 0.23 mg kg−1 [77], while Zn 1.62 mg kg−1 is below the values of Zn 4.5–8.7 mg kg−1 [14] and well below the value Zn 24.73 mg kg−1 [77]. For metals concentration in peppers, comparisons were made with the results obtained by Roba et al. (2015), showing that the concentration of Zn 2.85 mg kg−1 is similar to the previously reported values Zn 2.0–3.5 mg kg−1 [14]. The value for Pb 0.07 mg kg−1 is lower than Pb 0.1–0.2 mg kg−1, and the concentrations of Cd 0.11 mg kg−1 and Cu 2.58 mg kg−1 are higher than Cd 0.03–0.07 mg kg−1 and Cu 0.3–0.5 mg kg−1 [14].
Carrots and onions have relatively high Cd and Cu values, similar to those reported in the literature [14,77]. In the case of peppers, the concentrations of Cd and Cu are higher than those indicated in previous studies, while the concentration of Pb is lower. Tomatoes have moderate levels of Cd, Cu, and Pb, and for all vegetables, Zn concentrations are below the values reported in other studies. In all the analyzed vegetables, Cu, Zn, and Mn were found in the highest concentrations, while As, Cd, and Pb were present in the lowest concentrations.
3.3. Indices of Soil Pollution and Transfer Factors
According to the results obtained from the calculation of the global pollution index Nemerow (PIN) and the classification of results by the intervals established by Cheng et al. (2007), the studied surface is slightly polluted with As and Mn, moderately polluted with Pb, Ni, and Zn, respectively, heavily polluted with Cu and Cd (Table 7) [64].
Table 7.
The degree of metal pollution in the area studied.
The transfer factors of the interest metals from soil to vegetables (carrot, onion, tomato, pepper) are graphically represented in Figure 3. All transfer factors are subunits (Figures S1–S7), meaning that the metal concentration in the plant is lower than in the soil. Therefore, no phenomena of bio-amplification of metals in the studied vegetables occurred.
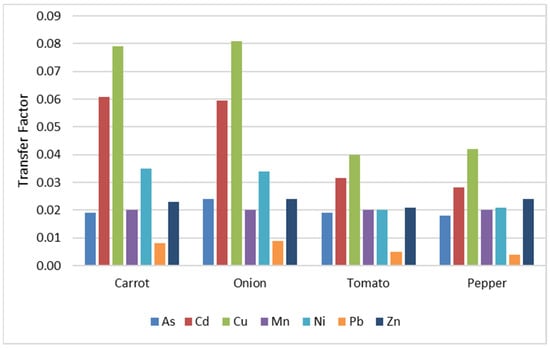
Figure 3.
The soil–plant transfer factor for studied metals.
The results highlight that Cu has the highest transfer factors, exceeding a value of 0.08 for carrot and onion. This indicates a high capacity of these vegetables to accumulate copper from the soil, which can be correlated with the increased mobility of this metal and its essential physiological role in plants.
The high value of Cd, which reaches approximately 0.06 in carrots and onions, places it close to the level of copper—a metal that usually has a high transfer factor (TF) due to its physiological role. These high TF values for Cd are concerning because Cd is a highly toxic metal, even at low concentrations, and is associated with serious adverse effects on human health, including renal and bone dysfunctions and carcinogenic effects. Thus, its significant accumulation in carrots and onions represents a potential risk of dietary exposure.
Zn and Ni present moderate values (0.02–0.03), while As and Mn have a relatively constant and slightly lower distribution, suggesting limited availability or a physiological barrier to their uptake. In contrast, Pb has the lowest values in all vegetables (below 0.01), indicating limited mobility and possible retention at the root level, which is a positive aspect in terms of its toxicity from a food safety perspective.
The data highlight significant differences in transfer factors (TFs) between plant species. Cu and Cd had the highest TFs, especially in carrots and onions, indicating a high bioaccumulation capacity. Elevated values of Cd are concerning due to its toxicity and require the careful monitoring of soils, especially in areas cultivated with frequently consumed vegetables.
In contrast, tomatoes and peppers showed lower TFs for all metals, which can be explained by physiological and structural particularities and specific absorption mechanisms. Zn and Ni had moderate values, while Pb had the lowest, suggesting low mobility in the soil and minimal accumulation in tissues.
The differences between plant species reflect physiological and biochemical variations, as well as the influence of soil characteristics. The results emphasize the need for monitoring Cd levels in agricultural soils and can guide crop selection depending on the level of contamination.
From those previously mentioned, it follows that all four vegetables have a predilection for copper and cadmium and less for manganese and lead, having the following order depending on the type of vegetable: carrot and onions: Mn < Pb < Zn < As < Ni < Cd < Cu; tomato and pepper: Mn < Pb < Ni < Zn < As < Cd < Cu. These results are similar to those obtained by Khan et al. (2008), who found that the transfer factor for copper and cadmium is higher than that for lead [53]. These results also point out that the transfer from the soil to the plant depends a lot on the metal concentration in the soil [14]. The data resulting from this study are consistent with what Roba et al. (2015) highlighted, indicating that Cu accumulates more in root vegetables because, in the case of carrots (5.39 mg kg−1) and onions (5.48 mg kg−1), copper ions are found in higher concentrations than in tomatoes (1.62 mg kg−1) or peppers (2.58 mg kg−1) [14].
It was also found that the transfer factor on carrots (Cu 0.04–0.08; Cd 0.03–0.06; Zn 0.02) is much lower compared with the values obtained by Abbas et al. (2023), Khan et al. (2023), Big et al. (2012), Mihali et al. (2012), Roba et al. (2015) (Cu 0.75; Cd 0.23; Zn 0.43) [39], (Cu 0.01–0.23; Cd 0.06–0.76; Zn 0.01–0.60) [14]; (Cu 0.44–0.57; Cd 1.28–1.46; Zn 0.24–0.34, Cd 0.375, Cd 0.088, Zn 0.088) [37], Cd 0.46–2.61 [38] and similar to those obtained by Mihali et al. (2012) (Cu 0.015) [13]. The results for Pb (0.004–0.009) and Ni (0.02) are consistent with the results obtained in other specific studies in Romania (Pb 0.001; Ni 0.02–0.35) [14,39], Pb 0.008 [13] but much smaller than Pb 0.16–0.45; Ni 0.26–0.56 [33], Ni 0.147 [9], or Pb 0.14–0.23; Ni 0.31–0.60 [38]. The values of Mn in carrot (0.002) are lower than Mn 0.009 [13], while those of As (0.018–0.024) are similar to As 0.012 [13]. The values for Cu 0.008 obtained in this study on the transfer of metals in onions were compared to those from the study conducted by Mihali et al. (2012) [13]. Thus, a higher accumulation was observed for As 0.018–0.024 and was similar in both studies, while for Cd 0.02–0.06, Mn 0.002, Ni 0.021–0.035, and Zn 0.021–0.024, smaller accumulations were present than previously reported (Cd 0.103, Mn 0.008, Ni 0.080, and Zn 0.076) [13].
3.4. Risk Index for Human Health
For each metal determined, the values were calculated for the daily intake of metal dose (DIM) investigated and the human health risk index (HRI) for both adults and children.
Thus, it was found that by eating the four studied vegetables, children ingest higher amounts of metals per day than adults. The daily intake dose of metals (DIM) is high in the case of carrot and onion consumption. Therefore, considerable amounts of Cd, Cu, and Ni enter the bodies of both children and adults. On the other hand, pepper consumption results in the lowest transfer of As, Cd, and Ni into the bodies of children and adults.
The DIM values for arsenic are very low and consistent across vegetables, with 0.00006 mg·kg−1·day−1 for children and 0.00004 mg·kg−1·day−1 for adults. Cadmium is more concentrated in carrots and onions, with higher DIM values for children (0.00009 mg·kg−1·day−1) compared with adults (0.00006 mg·kg−1·day−1). As a toxic metal, cadmium in vegetables may represent a significant source of environmental exposure.
Copper values are higher than those for other metals, especially for children, with 0.00325 mg·kg−1·day−1 in carrots for children and 0.00226 mg·kg−1·day−1 for adults. Manganese has moderate DIM values, with no large variations across vegetables, showing 0.00100 mg·kg−1·day−1 for children and 0.00070 mg·kg−1·day−1 for adults in carrots.
Nickel has low and relatively constant DIM values, with 0.00047 mg·kg−1·day−1 for children and 0.00032 mg·kg−1·day−1 for adults in carrots. Lead has relatively low values in vegetables, with 0.00013 mg·kg−1·day−1 for children and 0.00009 mg·kg−1·day−1 for adults in carrots. Zinc is present in moderate amounts in vegetables, with values varying little between vegetables, showing 0.00166 mg·kg−1·day−1 for children and 0.00116 mg·kg−1·day−1 for adults in carrots.
For an average body weight of 70 kg, it is recommended that zinc intake be in the range of 0.07–0.23 mg·kg−1·day−1, specifically 0.16 mg·kg−1·day−1 for men and 0.13 mg·kg−1·day−1 for women [58].
Vegetables, especially carrots and onions, contain significant amounts of metals such as cadmium and copper, which are more concentrated in children than in adults. These metals are important for health in small doses, but long-term exposure to heavy metals can have negative health effects, which is why monitoring them in food is crucial.
These DIM parameters indicate that although heavy metals are present in the vegetables analyzed, chronic exposure through consumption remains within acceptable limits without exceeding the reference values established by international authorities (Table 8).
Table 8.
The DIM values for children and adults.
Figure 4 shows the HRI values for the analyzed metals (As, Cd, Cu, Mn, Ni, Pb, Zn) in four frequently consumed vegetables—carrot, onion, tomato, and pepper—for both children and adults. In all cases, the HRI values are below the threshold of 1, indicating that, under the analyzed conditions, there is no significant health risk associated with consuming these vegetables. However, the higher HRI values observed in children compared with adults indicate an increased vulnerability among the young population.
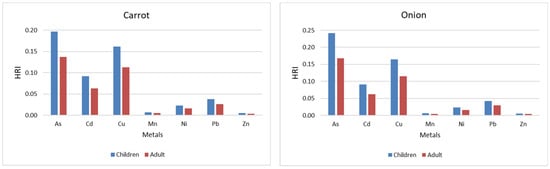
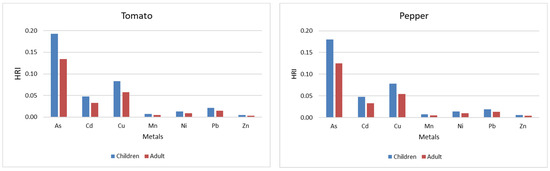
Figure 4.
HRI for children and adults depending on the vegetables.
Among the analyzed metals, the highest HRI values were presented in all vegetables, with maximum values in the case of onions and carrots. Cd and Cu recorded moderate values, especially in carrots and onions. Mn, Ni, Pb, and Zn, had minimal contributions, with consistently low HRI values. Compared with vegetables, pepper was found to have the lowest cumulative HRI value, while carrot and onion showed the highest risks, especial highly for children.
These results emphasize the need for continued monitoring of heavy metals in staple foods, with a focus on the potential impact on children, given their greater susceptibility to toxic contaminants, even at low doses.
The DIM and HRI values were lower than 1 in all cases analyzed, regardless of the type of metal or plant examined, indicating a low risk to human health. However, these values are consistently higher in children, reflecting a higher exposure to body weight. In particular, the HRI values highlight a potential increased vulnerability among children, especially in the case of carrot and onion consumption. The results also highlight the importance of continued surveillance, given the greater sensitivity of children to food contaminants.
Comparing the HRI obtained in this study with the results of other researchers, the risk for carrots, regardless of the metal, is significantly lower than that reported by Abbas et al. (2023) and Khan et al. (2023) [37,38]. However, a similarity indicates that HRI for children is higher than for adults for all studied metals [37,38]. Also, other research shows very high-risk index values for tomato and pepper consumption, with concentrations of metals such as Cd 1.4 ± 1.2, Cu 4.2 ± 10.9, Ni 1.5 ± 10, Pb 25 ± 7.4, and Zn 1.7 ± 0.7 [49].
Considering the health risk index (HRI) is less than 1 in this study, it follows that consuming vegetables such as carrots, onions, tomatoes, and peppers grown on the studied soils does not represent a major health risk.
Based on the data and research results, it can be concluded that there is currently a level of safety in the consumption of the studied vegetables cultivated in the Sasar area. However, the presence of tailings ponds near the studied area requires continuous monitoring of both the soil quality in the crop areas and the cultivated vegetables to ensure an optimal framework for food security and, consequently, to reduce the risks of illness among the population.
4. Conclusions
This study analyzed soil samples and vegetables taken from 15 gardens in the Sasar locality to assess the risks to human health in correlation with vegetable consumption. Physico-chemical analyses have shown that soil fertility and nitrogen supply vary significantly depending on location, with a slightly acidic reaction and a very low potassium and phosphorus level. Most of the metals investigated have concentrations in the soil that exceed the normal values, except for Cd (2.44 mg kg−1) and Cu (69.76 mg kg−1), which also exceed the alert threshold for sensitive soils. PIN results show that the studied surface is slightly polluted with As and Mn, moderately polluted with Pb, Ni, and Zn, respectively, and heavily polluted with Cu and Cd.
Investigations have highlighted that Cu and Cd had the highest concentrations, and As and Mn had the lowest for the studied vegetables. The TF analysis showed peaks for carrots and onions for most of the studied metals, followed by peppers and tomatoes, and the DIM and HRI < 1 show that through vegetable consumption, children ingest more metals than adults. Even if the research results do not indicate a major health risk, given the pollution of the soil, moderate consumption of vegetables and continuous monitoring of crops to prevent possible health risks is recommended.
Supplementary Materials
The following supporting information can be downloaded at https://www.mdpi.com/article/10.3390/su17094072/s1. Figure S1: The transfer factor of As from soil depending on the plant and the sampling point; Figure S2: The transfer factor of Cd from soil depending on the plant and the sampling point; Figure S3: The transfer factor of Cu from soil depending on the plant and the sampling point; Figure S4: The transfer factor of Mn from soil depending on the plant and the sampling point; Figure S5: The transfer factor of Ni from soil depending on the plant and the sampling point; Figure S6: The transfer factor of Pb from soil depending on the plant and the sampling point; Figure S7: The transfer factor of Zn from soil depending on the plant and the sampling point.
Author Contributions
Conceptualization, I.S., A.M., and V.M.; methodology, I.S., A.M., and I.M.S.; investigation, I.S., A.M., and A.C.M.; resources, I.S., A.M., and V.M.; writing—original draft preparation, I.S., A.M., V.M., and I.M.S.; writing—review and editing, I.S., A.M., V.M., I.M.S., and A.C.M. All authors have read and agreed to the published version of the manuscript.
Funding
This research received no external funding.
Institutional Review Board Statement
Not applicable.
Informed Consent Statement
Not applicable.
Data Availability Statement
The original contributions presented in this study are included in the article/Supplementary Materials. Further inquiries can be directed to the corresponding author.
Conflicts of Interest
The authors declare no conflicts of interest.
References
- Jolly, Y.N.; Islam, A.; Akbar, S. Transfer of metals from soil to vegetables and possible health risk assessment. SpringerPlus 2013, 2, 385. [Google Scholar] [CrossRef]
- Miclean, M.; Levei, E.A.; Senila, M.; Roman, C.; Cordos, E. Heavy metal contamination of soil in Baia Mare mining area. Stud. Chem. 2008, 53, 57–63. [Google Scholar]
- Mihali, C.; Oprea, G.; Michnea, A.; Jelea, S.G.; Jelea, M.; Man, C.; Grigor, L. Assessment of heavy metals content and pollution level in soil and plants in Baia Mare area, NW Romania. Carpathian J. Earth Environ. Sci. 2013, 8, 143–152. [Google Scholar]
- Kashif, S.R.; Akram, M.; Yaseen, M.; Ali, S. Studies on heavy metals status and their uptake by vegetables in adjoining areas of Hudiara drain in Lahore. Soil Environ. 2009, 28, 7–12. [Google Scholar]
- Mitra, S.; Chakraborty, A.J.; Tareq, A.M.; Emran, T.B.; Nainu, F.; Khusro, A.; Idris, A.M.; Khandaker, M.U.; Osman, H.; Alhumaydhi, F.A.; et al. Impact of heavy metals on the environment and human health: Novel therapeutic insights to counter the toxicity. J. King Saud Univ.-Sci. 2022, 34, 101865. [Google Scholar] [CrossRef]
- Gruszecka-Kosowska, A.; Kicińska, A. Long-Term Metal-Content Changes in Soils on the Olkusz Zn–Pb Ore-Bearing Area, Poland. Int. J. Environ. Res. 2017, 11, 359–376. [Google Scholar] [CrossRef]
- Kicińska, A. Arsenic, Cadmium, and Thallium Content in the Plants Growing in Close Proximity to a Zinc Works—Long-Term Observations. J. Ecol. Eng. 2019, 20, 61–69. [Google Scholar] [CrossRef]
- Modoi, O.C.; Ozunu, A.; Stezar, I.C. Risks Associated to Soil Pollution in the Proximity of Tailing Facilities in the Western Area of Baia Mare. ProEnvironment 2010, 3, 352–358. [Google Scholar]
- Bălănescu, S.; Achim, V.; Ciolte, A. History of Mining Management, Precious Non-Ferrous Metallurgy in North-West Romania; Gutinul: Baia Mare, Romania, 2002. (In Romanian) [Google Scholar]
- Nădișan, I.; Cherecheș, D.; Ieremia, G. The Pollution Scourge in Baia Mare—The “Gold” Event; Vasile Goldiș University Press: Arad, Romania, 2001. (In Romanian) [Google Scholar]
- Miclean, M.; Levei, E.-A.; Senila, M.; Roman, C.; Cordos, E.A. Assessment of Cu, Pb, Zn and Cd availability to vegetable species grown in the vicinity of tailing deposits from Baia Mare area. Rev. Chim. 2009, 60, 1–4. [Google Scholar] [CrossRef]
- Levei, E.; Frentiu, T.; Ponta, M.; Senila, M.; Miclean, M.; Roman, C.; Cordos, E. Characterisation of soil quality and mobility of Cd, Cu, Pb and Zn in the Baia Mare area Northwest Romania following the historical pollution. Int. J. Environ. Anal. Chem. 2009, 89, 635–649. [Google Scholar]
- Mihali, C.; Michnea, A.; Oprea, G.; Gogoaşa, I.; Pop, C.; Senila, M.; Grigor, L. Trace element transfer from soil to vegetables around the lead smelter in Baia Mare, NW Romania. J. Agric. Food Environ. 2012, 10, 828–834. [Google Scholar]
- Roba, C.; Rosu, C.; Pistea, I.; Baciu, C.; Costin, D.; Ozunu, A. Transfer of heavy metals from soil to vegetables in a mining/smelting influenced area (Baia Mare—Ferneziu, Romania). J. Environ. Prot. Ecol. 2015, 16, 891–898. [Google Scholar]
- Donici, A.; Bunea, C.I.; Călugăr, A.; Harsan, E.; Racz, I.; Bora, F.D. Assessment of heavy metals concentration in soil and plants from Baia Mare area, NW Romania. Bull. UASVM Hortic. 2018, 75, 127–132. [Google Scholar] [CrossRef]
- Berar, I.M.; Micle, V.; Oros, V.; Cociorhan, C.S.; Urs, A.M. Studies and research regarding the evaluation of the quality of the soils in the area SC Romplumb SA. Baia Mare in order to remediate polluted land. ProEnvironment 2010, 3, 472–476. [Google Scholar]
- Cordos, E.A.; Frentiu, T.; Ponta, M.; Marginean, I.; Abraham, B.; Roman, C. Distribution study of inorganic arsenic (III) and (V) species in soil and their mobility in the area of Baia-Mare, Romania. Chem. Speciat. Bioavailab. 2006, 18, 11–25. [Google Scholar] [CrossRef]
- Oprea, G.; Cristina, M.; Michnea, A.; Gabriela, O.; Roman, C.; Stela, J.; Butean, C.; Barz, C. Arsenic and antimony content in soil and plants from Baia Mare area, Romania. Am. J. Environ. Sci. 2010, 6, 33–40. [Google Scholar] [CrossRef]
- Hassan, J.; Rajib, M.M.R.; Khan, M.N.E.A.; Khandaker, S.; Zubayer, M.; Ashab, K.R.; Kuba, T.; Marwani, H.M.; Asiri, A.M.; Hasan, M.M.; et al. Assessment of heavy metals accumulation by vegetables irrigated with different stages of textile wastewater for evaluation of food and health risk. J. Environ. Manag. 2024, 353, 120206. [Google Scholar] [CrossRef]
- Kasa, E.; Contin, M.; Gjoka, F. Accumulation of heavy metals in vegetables from agricultural soils. Albanian J. Agric. Sci. 2015, 14, 169–175. [Google Scholar]
- Mihali, C.; Dippong, T.; Butean, C.; Goga, F. Heavy metals and As content in soil and in plants in the Baia Mare mining and metallurgical area (NW of Roumania). Rev. Roum. Chim. 2017, 62, 373–379. [Google Scholar]
- Mizan, A.; Mamun, M.A.H.; Islam, M.d.S. Metal contamination in soil and vegetables around Savar tannery area, Dhaka, Bangladesh: A preliminary study for risk assessment. Heliyon 2023, 9, 13856. [Google Scholar] [CrossRef]
- Liu, P.; Hu, W.; Tian, K.; Huang, B.; Zhao, Y.; Wang, X.; Zhou, Y.; Shi, B.; Kwon, B.O.; Choi, K.; et al. Accumulation and ecological risk of heavy metals in soils along the coastal areas of the Bohai Sea and the Yellow Sea: A comparative study of China and South Korea. Environ. Int. 2020, 137, 105519. [Google Scholar] [CrossRef] [PubMed]
- Manoj, S.R.; Karthik, C.; Kadirvelu, K.; Arulselvi, P.I.; Shanmugasundaram, T.; Bruno, B.; Rajkumar, M. Understanding the molecular mechanisms for the enhanced phytoremediation of heavy metals through plant growth promoting rhizobacteria: A review. J. Environ. Manag. 2020, 254, 109779. [Google Scholar] [CrossRef]
- Khan, S.; Farooq, R.; Shahbaz, S.; Khan, M.A.; Sadique, M. Health risk assessment of heavy metals for population via consumption of vegetables. World Appl. Sci. J. 2009, 6, 1602–1606. [Google Scholar]
- Lokeshappa, B.; Shivpuri, K.; Tripath, V.; Dikshit, A.K. Assessment of toxic metals in agricultural product. Food Pub. Heat. 2012, 2, 24–29. [Google Scholar] [CrossRef]
- Rai, P.K.; Lee, S.S.; Zhang, M.; Tsang, Y.F.; Kim, K.H. Heavy metals in food crops: Health risks, fate, mechanisms, and management. Environ. Int. 2019, 125, 365–385. [Google Scholar] [CrossRef] [PubMed]
- Bernard, A. Cadmium and its adverse effects on human health. Indian J. Med. Res. 2008, 128, 557–564. [Google Scholar]
- Genchi, G.; Carocci, A.; Lauria, G.; Sinicropi, M.S.; Catalano, A. Nickel: Human Health and Environmental Toxicology. Int. J. Environ. Res. Public Health 2020, 17, 679. [Google Scholar] [CrossRef] [PubMed]
- Cui, Y.-J.; Zhu, Y.G.; Zhai, R.H.; Chen, D.Y.; Huang, Y.Z.; Qiu, Y.; Liang, J.Z. Transfer of metals from soil to vegetables in an area near a smelter in Nanning, China. Environ. Int. 2004, 30, 785–791. [Google Scholar] [CrossRef]
- Agbor, E.; Besong, E.; Ebai, P.; Inyang, D.I.; Okon, L.E.; Ugar, S.; Nganje, T.N. Baseline assessment of the health risk of potentially toxic heavy metals in commonly consumed vegetables in parts of Mamfe, Southwest Region, Cameroon. J. Trace Elem. Miner. 2024, 8, 100115. [Google Scholar] [CrossRef]
- Shi, J.; Yang, Y.; Shen, Z.; Lin, Y.; Mei, N.; Luo, C.; Wang, Y.; Zhang, C.; Wang, D. Identifying heavy metal sources and health risks in soil-vegetable systems of fragmented vegetable fields based on machine learning, positive matrix factorization model and Monte Carlo simulation. J. Hazard. Mater. 2024, 478, 135481. [Google Scholar] [CrossRef]
- Afriyie, R.Z.; Arthur, E.K.; Gikunoo, E.; Baah, D.S.; Dziafa, E. Potential health risk of heavy metals in some selected vegetable crops at an artisanal gold mining site: A case study at Moseaso in the Wassa Amenfi West District of Ghana. J. Trace Elem. Miner. 2023, 4, 100075. [Google Scholar] [CrossRef]
- Zhang, X.; Yan, L.; Liu, J.; Zhang, Z.; Tan, C. Removal of different kinds of heavy metals by novel PPG-nZVI beads and their application in simulated stormwater infiltration facility. Appl. Sci. 2019, 9, 4213. [Google Scholar] [CrossRef]
- Su, C.; Wang, J.; Chen, Z.; Meng, J.; Yin, G.; Zhou, Y.; Wang, T. Sources and health risks of heavy metals in soils and vegetables from intensive human intervention areas in South China. Sci. Total Environ. 2023, 857, 159389. [Google Scholar] [CrossRef] [PubMed]
- Chinnannan, K.; Somagattu, P.; Yammanuru, H.; Reddy, U.K.; Nimmakayala, P. Health risk assessment of heavy metals in soil and vegetables from major agricultural sites of Ohio and West Virginia. Biocatal. Agric Biotechnol. 2024, 57, 103108. [Google Scholar] [CrossRef]
- Abbas, M.T.; Waddan, M.A.; Ullah, H.; Farooq, M. Bioaccumulation and Mobility of Heavy Metals in the Soil-Plant System and Health Risk Assessment of Vegetables Irrigated by Wastewater. Sustainability 2023, 15, 15321. [Google Scholar] [CrossRef]
- Khan, M.N.; Aslam, M.A.; Muhsinah, A.B.; Uddin, J. Heavy Metals in Vegetables: Screening Health Risks of Irrigation with Wastewater in Peri-Urban Areas of Bhakkar, Pakistan. Toxics 2023, 11, 460. [Google Scholar] [CrossRef]
- Big, C.L.; Lacatusu, R.; Damian, F. Heavy metals in soil-plant system around Baia Mare city, Romania. Carpathian J. Earth Environ. Sci. 2012, 7, 219–230. [Google Scholar]
- Security Report Iaz Aurul, SC Romaltyn Mining SRL Baia Mare; SC Ocon Ecorisc Ltd.: Bucharest, Romania, 2012; Available online: http://www.romaltyn.ro/autorizare-mediu/ (accessed on 26 April 2025). (In Romanian)
- STAS 7184/1-84; Soils. Sample Collection for Pedological and Agrochemical Studies. ASRO: Bucharest, Romania, 1984. (In Romanian)
- EN ISO 10523:2012; Water Quality. Determining pH. ISO: Geneva, Switzerland, 2012. (In Romanian)
- STAS 7184/21-82; Soils. Determination of Humus Content. ASRO: Bucharest, Romania, 1982. (In Romanian)
- STAS 7184/12-88; Soils. Determination of Cation Exchange Properties. ASRO: Bucharest, Romania, 1988. (In Romanian)
- STAS 7184/19-82; Soils. Determination of Extractable Phosphorus in Ammonium Acetate-Lactate. ASRO: Bucharest, Romania, 1982. (In Romanian)
- STAS 7184/18-80; Soils. Determination of Accessible and Potentially Accessible Potassium Content for Plants. ASRO: Bucharest, Romania, 1980. (In Romanian)
- Ministry of Agriculture and Rural Development (MARD), National Institute for Research—Development for Pedology. Agrochemistry and Environmental Protection, Methods of Chemical and Microbiological Analysis (Used in the Soil Monitoring System); Sintech Publishing House: Craiova, Romania, 2011. (In Romanian) [Google Scholar]
- The Methodology of Development of Pedological Studies (MDPS). National Institute for Research and Development in Pedology; Agrochemistry and Environmental Protection (ICPA): Bucharest, Romania, 1987. (In Romanian) [Google Scholar]
- STAS 7184/10-79; Soils. Determination of Granulometric Composition. ASRO: Bucharest, Romania, 1984. (In Romanian)
- Colnaghi, G.; Carnaroglio, D. Revolutionizing Elemental Analysis: A Comprehensive Guide to Microwave Digestion Technology, Milestone Microwave Laboratory System, Milestone SRL, September 2024, Milano, Italy. Available online: https://www.milestonesci.com/wp-content/uploads/2024/09/eBook-Revolutioning-Elemental-Analysis-9.2024.pdf (accessed on 26 April 2025).
- SR ISO 11047:1999; Soil Quality. Determination of Cadmium, Chromium, Cobalt, Copper, Lead, Manganese, Nickel and Zinc from Soil Extracts in Royal Water. Methods by Atomic Absorption Spectrometry in Flame and Electrothermal Atomization. ISO: Geneva, Switzerland, 1999.
- Hu, Y.; Liu, X.; Bai, J.; Shih, K.; Zeng, E.Y.; Cheng, H. Assessing heavy metal pollution in the surface soils of a region that had undergone three decades of intense industrialization and urbanization. Environ. Sci. Pollut. Res. 2013, 20, 6150–6159. [Google Scholar] [CrossRef]
- Khan, S.; Cao, Q.; Zheng, Y.M.; Huang, Y.Z.; Zhu, Y.G. Health risk of heavy metals in contaminated soils and food crops irrigated with wastewater in Beijing, China. Environ. Pollut. 2008, 152, 686–692. [Google Scholar]
- Wang, X.; Sato, T.; Xing, B.; Tao, S. Health risks of heavy metals to the general public in Tianjin, China via consumption of vegetables and fish. Sci. Total Environ. 2005, 350, 28–37. [Google Scholar] [CrossRef]
- Shokri, S.; Abdoli, N.; Sadighara, P.; Mahvi, A.H.; Esrafili, A.; Gholami, M.; Jannat, B.; Yousefi, M. Risk assessment of heavy metals consumption through onion on human health in Iran. Food Chem. 2022, 14, 100283. [Google Scholar] [CrossRef]
- Order No. 756 of 3 November 1997 for the Approval of the Regulation on Environmental Pollution Assessment. Eminent: Ministry of Waters, Forests and Environmental Protection. (Published in: Official Gazette no 303 bis of 6 November 1997). 1997. Available online: http://legislatie.just.ro/Public/DetaliiDocumentAfis/151788 (accessed on 10 March 2025). (In Romanian).
- Agency for Toxic Substances and Disease Registry (ATSDR). Toxicological Profile for Zinc. U.S. Department of Health and Human Services Public Health Service Agency for Toxic Substances and Disease Registry. Available online: https://www.atsdr.cdc.gov/ToxProfiles/tp60.pdf (accessed on 1 August 2024).
- United States Environmental Protection Agency (USEPA). Risk Assessment Guidance for Superfund, Vol. I: Human Health Evaluation Manual; Office of Emergency and Remedial Response: Washington, DC, USA, 1989. Available online: https://www.epa.gov/sites/default/files/2015-09/documents/rags_a.pdf (accessed on 15 September 2024).
- United States Environmental Protection Agency (USEPA). Risk-Based Concentration Table; Washington Agency, United States Environmental Protection Agency: Washington, DC, USA, 2000. Available online: https://archive.epa.gov/region9/superfund/web/html/index-23.html (accessed on 15 September 2024).
- United States Environmental Protection Agency (US EPA). Supplemental Guidance for Developing Soil Screening Levels for Superfund Sites; Office of Emergency and Remedial Response: Washington, DC, USA, 2002. Available online: https://semspub.epa.gov/work/HQ/175878.pdf (accessed on 15 September 2024).
- Song, D.; Zhuang, D.; Jiang, D.; Fu, D. Integrated Health Risk Assessment of Heavy Metals in Suxian County, South China. Int. J. Environ. Res. Public Health 2015, 12, 7100–7117. [Google Scholar] [CrossRef] [PubMed]
- Agency for Toxic Substances and Disease Registry (ATSDR). Toxicological Profile for Cadmium. U.S. Department of Health and Human Services Public Health Service. 2012. Available online: https://www.atsdr.cdc.gov/toxprofiles/tp5.pdf (accessed on 15 September 2024).
- Agency for Toxic Substances and Disease Registry (ATSDR). Toxicological Profile of Nickel. U.S. Department of Health and Human Services Public Health Service. 2024. Available online: https://www.atsdr.cdc.gov/toxprofiles/tp15.pdf (accessed on 20 October 2024).
- Cheng, J.-J.; Shi, Z.; Zhu, Y. Assessment and mapping of environmental quality in agricultural soils of Zhejiang Province, China. J. Environ. Sci. 2007, 19, 50–54. [Google Scholar] [CrossRef]
- Charles, V.E.; Polis, C.B.; Sridhara, S.K.; Blum, R.W. Abortion and long-term mental health outcomes: A systematic review of the evidence. Contraception 2008, 78, 436–450. [Google Scholar] [CrossRef] [PubMed]
- Borlan, Z.; Rauta, C. Methodology for Agrochemical Analysis of Soils to Establish the Need for Amendments and Fertilizers; Methods, Guidance Reports Series, ICPA 3; Research Institute for Soil Science and Agrochemistry (ICPA): Bucharest, Romania, 1981; Volume 1. (In Romanian) [Google Scholar]
- Jelea, O.C. The Effects of Acid Mine Drainage upon Vegetation in the Bozanta Tailings Pond (Maramureş County). Stud. UBB Ambient. 2015, 60, 57–70. [Google Scholar]
- Modoi, O.C.; Roba, C.; Török, Z.; Ozunu, A. Environmental Risks due to Heavy Metal Pollution of Water Resulted from Mining Wastes in NW Romania. Environ. Eng. Manag. J. 2014, 13, 2325–2336. [Google Scholar]
- Cordos, E.A.; Roman, C.; Ponta, M.; Frentiu, T.; Rautiu, R. Evaluation of soil pollution with copper, lead, zinc and cadmium in the mining area Baia Mare. Rev. Chim. 2007, 58, 470–474. [Google Scholar]
- Damian, G.; Damian, F.; Nasui, D.; Pop, C.; Pricop, C. The soils quality from the southern–eastern part of Baia Mare zone affected by metallurgical industry. Carpathian J. Earth Environ. Sci. 2010, 5, 139–147. [Google Scholar]
- Farkas, A.; Mereuti, F.; Butiuc-Keul, A.; Podar, D.; Roba, C.; Balc, R. Effects of Long-Term exposure to Heavy Metals upon Rhizosphere Bacteria from Baia Mare Area (Maramureş County, Romania). Geomicrobiol. J. 2020, 37, 867–876. [Google Scholar] [CrossRef]
- Lacatusu, R.; Kovacsovics, B.; Breaban, I.G.; Carstea, S.; Lungu, M.; Bretan, A. Abundance of heavy metals in urban soils as concerns genesis and polluting impact. Sci. Pap. Mag. Agron. Ser. USAMV Iasi 2007, 50, 141–149. [Google Scholar]
- Bora, F.D.; Mihaly-Cozmuța, L.; Mihaly-Cozmuța, A.; Peter, A.; Nicula, C.; Donici, A. A study on cadmium, lead, zinc and cobalt concentration in Baia Mare County, N-W Romania soils. AAB Bioflux 2015, 7, 227–240. [Google Scholar]
- Miclean, M.; Cadar, O.; Levei, L.; Senila, L.; Ozunu, A. Metal contents and potential health risk assessment of crops grown in a former mining district (Romania). J. Environ. Sci. Health B 2018, 53, 595–601. [Google Scholar] [CrossRef] [PubMed]
- Dziubanek, G.; Piekut, A.; Rusin, M.; Baranowska, R.; Hajok, I. Contamination of food crops grown on soils with elevated heavy metals content. Ecotoxicol. Environ. Saf. 2015, 118, 183–189. [Google Scholar] [CrossRef] [PubMed]
- Islam, M.S.; Hoque, M.F. Concentrations of heavy metals in vegetables around the industrial area of Dhaka city, Bangladesh and health risk assessment. Int. Food Res. J. 2014, 21, 2121–2126. [Google Scholar]
- Likuku, A.S.; Obuseng, G. Health Risk Assessment of Heavy Metals via Dietary Intake of Vegetables Irrigated with Treated Wastewater around Gaborone, Botswana. In Proceedings of the International Conference on Plant, Marine and Environmental Sciences PMES, Kuala Lumpur, Malaysia, 1–2 January 2015; pp. 32–37. [Google Scholar] [CrossRef]
Disclaimer/Publisher’s Note: The statements, opinions and data contained in all publications are solely those of the individual author(s) and contributor(s) and not of MDPI and/or the editor(s). MDPI and/or the editor(s) disclaim responsibility for any injury to people or property resulting from any ideas, methods, instructions or products referred to in the content. |
© 2025 by the authors. Licensee MDPI, Basel, Switzerland. This article is an open access article distributed under the terms and conditions of the Creative Commons Attribution (CC BY) license (https://creativecommons.org/licenses/by/4.0/).