Article

Spatiotemporal Characteristic and Driving Factors of Synergy on Carbon Dioxide Emission and Pollutants Reductions in the Guangdong–Hong Kong–Macao Greater Bay Area, China

1
State Key Laboratory for Regional and Urban Ecology, Institute of Urban Environment, Chinese Academy of Sciences, Xiamen 361021, China
2
University of Chinese Academy of Sciences, Beijing 100049, China
3
School of Ocean Engineering and Technology, Sun Yat-sen University, Zhuhai 519082, China
*
Author to whom correspondence should be addressed.
Sustainability 2025, 17(9), 4066; https://doi.org/10.3390/su17094066
Submission received: 20 March 2025 / Revised: 23 April 2025 / Accepted: 28 April 2025 / Published: 30 April 2025
(This article belongs to the Section Air, Climate Change and Sustainability)

Abstract

:
As an economically active region, the Guangdong–Hong Kong–Macao Greater Bay Area (GBA) faces dual challenges of carbon and air pollution reduction. Existing studies predominantly focus on single pollutants or engineering pathways, lacking systematic analyses of multi-scale synergistic effects. This study investigates the spatiotemporal distributions, driving factors, and synergistic effects of CO2 and volatile organic compounds (VOCs) at the multi-scale of urban agglomerations, cities, and industries, using global Moran’s index, standard deviational ellipse, logarithmic mean divisa index decomposition model, and Tapio decoupling model. The results show that the average annual growth rate of CO2 (7.4%) was significantly higher than that of VOCs (4.5%) from 2000 to 2020, and the industrial sector contributed more than 70% of CO2 and VOC emissions, with the center of gravity of emissions migrating to Dongguan. Industrial energy intensity improvement emerged as the primary mitigation driver, with Guangzhou and Shenzhen demonstrating the highest contribution rates. Additionally, CO2 and VOC reduction show two-way positive synergy, and the path of “energy intensity enhancement–carbon and pollution reduction” in the industrial sector is effective. Notably, the number of strong decouplings of the economy from CO2 (11 times) is much higher than the number of strong decouplings of VOCs (3 times), suggesting that the synergy between VOC management and economic transformation needs to be strengthened. This study provides scientific foundations for phased co-reduction targets and energy–industrial structure optimization, proposing regional joint prevention and control policy frameworks.

1. Introduction

As the world’s largest developing country, China’s carbon emission research provides key support and demonstration for the achievement of global carbon reduction targets. Nonetheless, atmospheric environmental governance confronts more complex and urgent challenges [1,2]. The energy-intensive development model has not only escalated greenhouse gas emissions but also triggered compound air pollution [3]. Notably, the emissions of volatile organic compounds (VOCs) increased by 18.74 Tg during 1990–2017 [4], forming complex secondary reaction mechanisms with particulate matter (PM) and nitrogen oxides (NOₓ), thereby exacerbating regional air quality challenges. China released the Action Plan for Continuous Improvement of Air Quality [5], which for the first time included synergistic control of VOCs, PM, and NOx in the core strategy and strengthened spatially differentiated measures. Within this context, synergistic emission reduction of air pollutants (VOCs, PM, NOx, etc.) and CO2 constitutes a key pathway for achieving green development and air quality improvement. Research on VOCs as precursors of O3 [6] is still in its beginning stages (Figure 1).
Established research has formed a theoretical system for carbon and pollution (CAP) synergy. Early research identified significant co-benefits from greenhouse gas mitigation technologies, with European studies confirming that the reduction of carbon emissions caused by energy structure adjustment can simultaneously reduce air-pollutant emissions [7]. Subsequent work revealed that air pollution control technologies also significantly reduce carbon emissions [8]. Post-Paris Agreement (2016), research shifted toward systematic synergy evaluation, integrating theoretical frameworks, measurement techniques, policy instruments, and institutional mechanisms [9,10]. Recent advancements focus on quantitative synergy metrics under climate change pressures [11,12,13,14,15]. Existing evaluation methodologies primarily encompass the coupling coordination model and indicator evaluation method. The coupling coordination model, as an analytical tool for assessing interaction intensity and mutual influences between systems, quantifies the degree of benign coupling among two or more interconnected systems [16]. The indicator evaluation method establishes a multidimensional index system to conduct quantitative assessments of alternative solutions or research objects, ultimately generating composite scores to facilitate optimal decision-making [17]. However, its application of standardization and normalization techniques across heterogeneous domains and indicators may compromise the intuitiveness and accuracy of comprehensive synergistic evaluations. Current research on CAP synergy necessitates paradigm shifts toward quantitative characterization and precision-oriented assessment frameworks.
Current studies on synergistic control of CAP primarily investigate three distinct geographical scales. Urban-scale research is suitable for in-depth analyses of specific issues within cities. Guan et al. (2023) employed the bivariate synergy index (BSI) and integrated synergy index (ISI) to quantify the synergistic relationship between urban-level CO2 and air-pollutant (PM2.5 and O3) emissions [18]. Xue et al. (2023) developed an index system comprising ISEC-AC (synergy evaluation composite index) with two sub-indices—IHI (industrial harmonization index) and ICE (carbon efficiency index)—to assess CAP synergy from energy structure, industrial composition, and spatial distribution perspectives [19]. Wang et al. (2024) constructed the degree of urban CAP reduction synergy (DUSR) from the three-part connotation of target synergy (T), path synergy (P), and management synergy (M) [20]. For provincial scales, Yi et al. (2022) applied a synergistic assessment model to calculate the coordinated air quality–carbon mitigation degree (CASD) across 30 Chinese provinces during 2005–2018 [21]. Moreover, cities within the urban agglomeration are geographically close to each other and have similar natural geographic environments, and there is a close industrial division of labor and collaboration among them, resulting in the formation of complete industrial chains and clusters. Urban agglomeration contains cities of different sizes and grades, forming a reasonable city system and realizing the complementary functions of large, medium, and small cities. EEach urban assumes different functional roles in the urban agglomeration, such as political, economic, cultural, scientific and technological, financial, and other functions, collaborating and supporting each other. The studies focused on the urban agglomerations have systematically examined metropolitan regions, including Beijing–Tianjin–Hebei, the Yangtze River Delta, and the Pearl River Delta, elucidating their distinct decarbonization pathways and spatial differentiation characteristics [22,23,24]. These multidimensional investigations have significantly advanced the scientific understanding of coordinated emission reductions for CAP.
To analyze the driving factors of synergistic emission reduction, scholars have explored urban agglomerations and urban-scale factors. Sectoral and regional analyses consistently demonstrate significant heterogeneity in emission patterns across electricity generation, industrial manufacturing, transportation, and residential sectors [25,26]. Key determinants encompass economic-development level, population density, GDP growth, urbanization rate, industrial output proportion, energy-consumption structure, and energy intensity [27,28,29,30,31,32,33]. At present, the research methods on the driving factors of carbon emissions and air pollutants are mainly divided into five categories: environmental Kuznets curve model, econometric and statistical model, Kaya equation, decomposition analysis model, and decoupling model [34,35,36,37,38,39]. Impacts by population, affluence, and technology model (IPAT) or stochastic impacts by regression on population, affluence, and technology model (STIRPAT) belong to the econometric statistical models. Structural decomposition analysis (SDA) and log mean dichotomy index (LMDI) are decomposition analysis models. These models are currently widely used. However, the quantitative regression analysis method based on IPAT model or STIRPAT model has some limitations in selecting driving factors. The SDA method is based on input–output analysis, and the analysis process is complex. The LMDI method is easier to analyze in detail. Under the premise of satisfying the reversibility of the factor, the residual and zero values are eliminated, and the accuracy is guaranteed. It is widely used in energy demand or to identify the driving factors of emission changes. If other methods are used instead of LMDI, residuals or improper residual decomposition may occur after the decomposition of explanatory variables, which cannot achieve the similar objective LMDI method. Therefore, in order to obtain reliable results, it is of great significance to analyze the influencing factors of carbon emissions via the LMDI method. The LMDI model has been widely used on a global scale [40], national scale [41], regional scale, and urban scale [42]. The research also involves decomposition analysis of carbon emissions at the industry or sector level, such as electricity, manufacturing, construction, transportation, residential life, etc. [43,44]. Despite systematic revelations about conventional pollutants (SO2, NOx, PM, and O₃) through spatiotemporal heterogeneity analyses, critical knowledge gaps persist regarding carbon–-VOC co-evolution dynamics. Crucially, achieving synergistic mitigation targets requires transcending the conventional environment–economy dichotomy paradigm through innovative policy-integration frameworks. While existing studies systematically revealed spatiotemporal variations in and driving factors of conventional pollutants like SO2, NOx, PM, and O3, systematic insights into the evolution of CAP remain scarce.
The Guangdong–Hong Kong–Macao Greater Bay Area (GBA), a pivotal region under China’s national development strategy, exemplifies high-intensity urbanization and industrial agglomeration. It generates 12.57% of national GDP on merely 0.6% of China’s land area [45], with an economic output density 20.9 times the national average. The traditional atmospheric pollutants (PM2.5 and SO2) in the GBA have crossed the turning point of Environmental Kuznets Curve (EKC), whereas O3 and VOCs are still in the rising phase of the EKC curve. This transitional state indicates that the region has not fully entered the post-inflection era characterized by sustained environmental-quality improvement, thereby remaining constrained by dual structural pressures from carbon emission-peaking commitments and compound atmospheric pollution challenges [46,47]. While achieving PM2.5 reductions (34% decline from 2015 to 2022), secondary pollution dominated by O3 has intensified, with ground-level concentrations rising from 44 μg/m3 (2015) to 61 μg/m3 (2022), exhibiting 3.8% annual growth [48]. The Implementation Plan for Building a Pioneer Zone of Beautiful China (2025) indicates a shift from single-target governance to systemic governance. However, trans-regional challenges persist in PM2.5 reduction, O3 control, and carbon peaking, underscoring the urgency of GBA-specific CO2-VOC co-governance research.
Building on the previous research, in order to promote the refined urban management of CAP emission reduction in the GBA, exploration of co-abatement driving mechanisms and decoupling analysis is urgently needed. The interaction between the driving factors determines the level and trend of CAP emissions. Characterizing the spatial–temporal differentiation of CAP and revealing evolution patterns in key cities/sectors provide a foundation for subsequent coordinated governance of CAP reduction in the country. This study investigates CAP synergy in the GBA across three scales: urban agglomeration, 9 + 2 cities, and key sectors (power, industry, transportation, and residential).
The main objectives of this study were to (1) assess the spatiotemporal evolution of CAP to identify emission hotspots across cities and sectors; (2) quantify the driving factors of CAP emissions; (3) analyze the difference between the driving effect of carbon reduction on pollution reduction and the driving effect of pollution reduction on carbon reduction; and (4) evaluate economy–emission disentanglement state. It provides theoretical reference and decision-making guidance for the coordinated emission reduction of carbon emissions and VOCs in urban agglomerations, cities, and industries.

2. Methods and Data

2.1. Research Methods of Spatiotemporal Evolution Characteristics of CAP

2.1.1. Spatial Autocorrelation Analysis

The first law of geography states that “Everything is related to everything else, but near things are more related than distant ones”, which has been proved to be applicable to CAP emissions in previous studies [49]. This indicates that CAP emissions in different cities will be synergistically affected by the surrounding areas [50]. To quantify the degree of spatial autocorrelation, the Global Moran’s I—characterized by its positive/negative values and significance levels—is commonly employed to evaluate the global agglomeration effects of CAP emissions across cities in the GBA. The statistical significance of the global Moran’s I is usually assessed through Monte Carlo simulations or approximate tests based on the normal distribution. A series of simulated values of the Moran’s I are calculated by randomly replacing the spatial locations of the observations several times, and then the actual calculated Moran’s I is compared with the simulated values to determine if it is significantly different from what would be expected in the case of a random distribution. If the actual Moran’s I falls in the extreme tails of the simulated values (usually at the 5 per cent or 1 per cent significance level), the original hypothesis can be rejected, and the observations can be considered to be spatially significantly autocorrelated. These can be expressed as follows:
I = i = 1 n j = 1 n W i j Y i Y ¯ S 2 i = 1 n j = 1 n W i j
S 2 = 1 n i = 1 n Y i Y ¯ 2
Y ¯ = 1 n i = 1 n Y i
In the formula, n represents the total number of samples of a variable; W i j is the weight matrix, which describes the spatial relationship between geographical units. In this paper, the binary adjacency matrix is used. Y i and Y j represent the observed values of region i and region j, respectively. The Moran’s I index is in a range of [−1, 1]. A positive value indicates positive spatial autocorrelation of the studied attribute across regions, with values approaching 1 signifying stronger spatial clustering and more significant agglomeration effects. Conversely, values approaching −1 indicate increasingly divergent spatial distributions. A value of 0 suggests no spatial correlation, meaning regions are independent of one another [51].

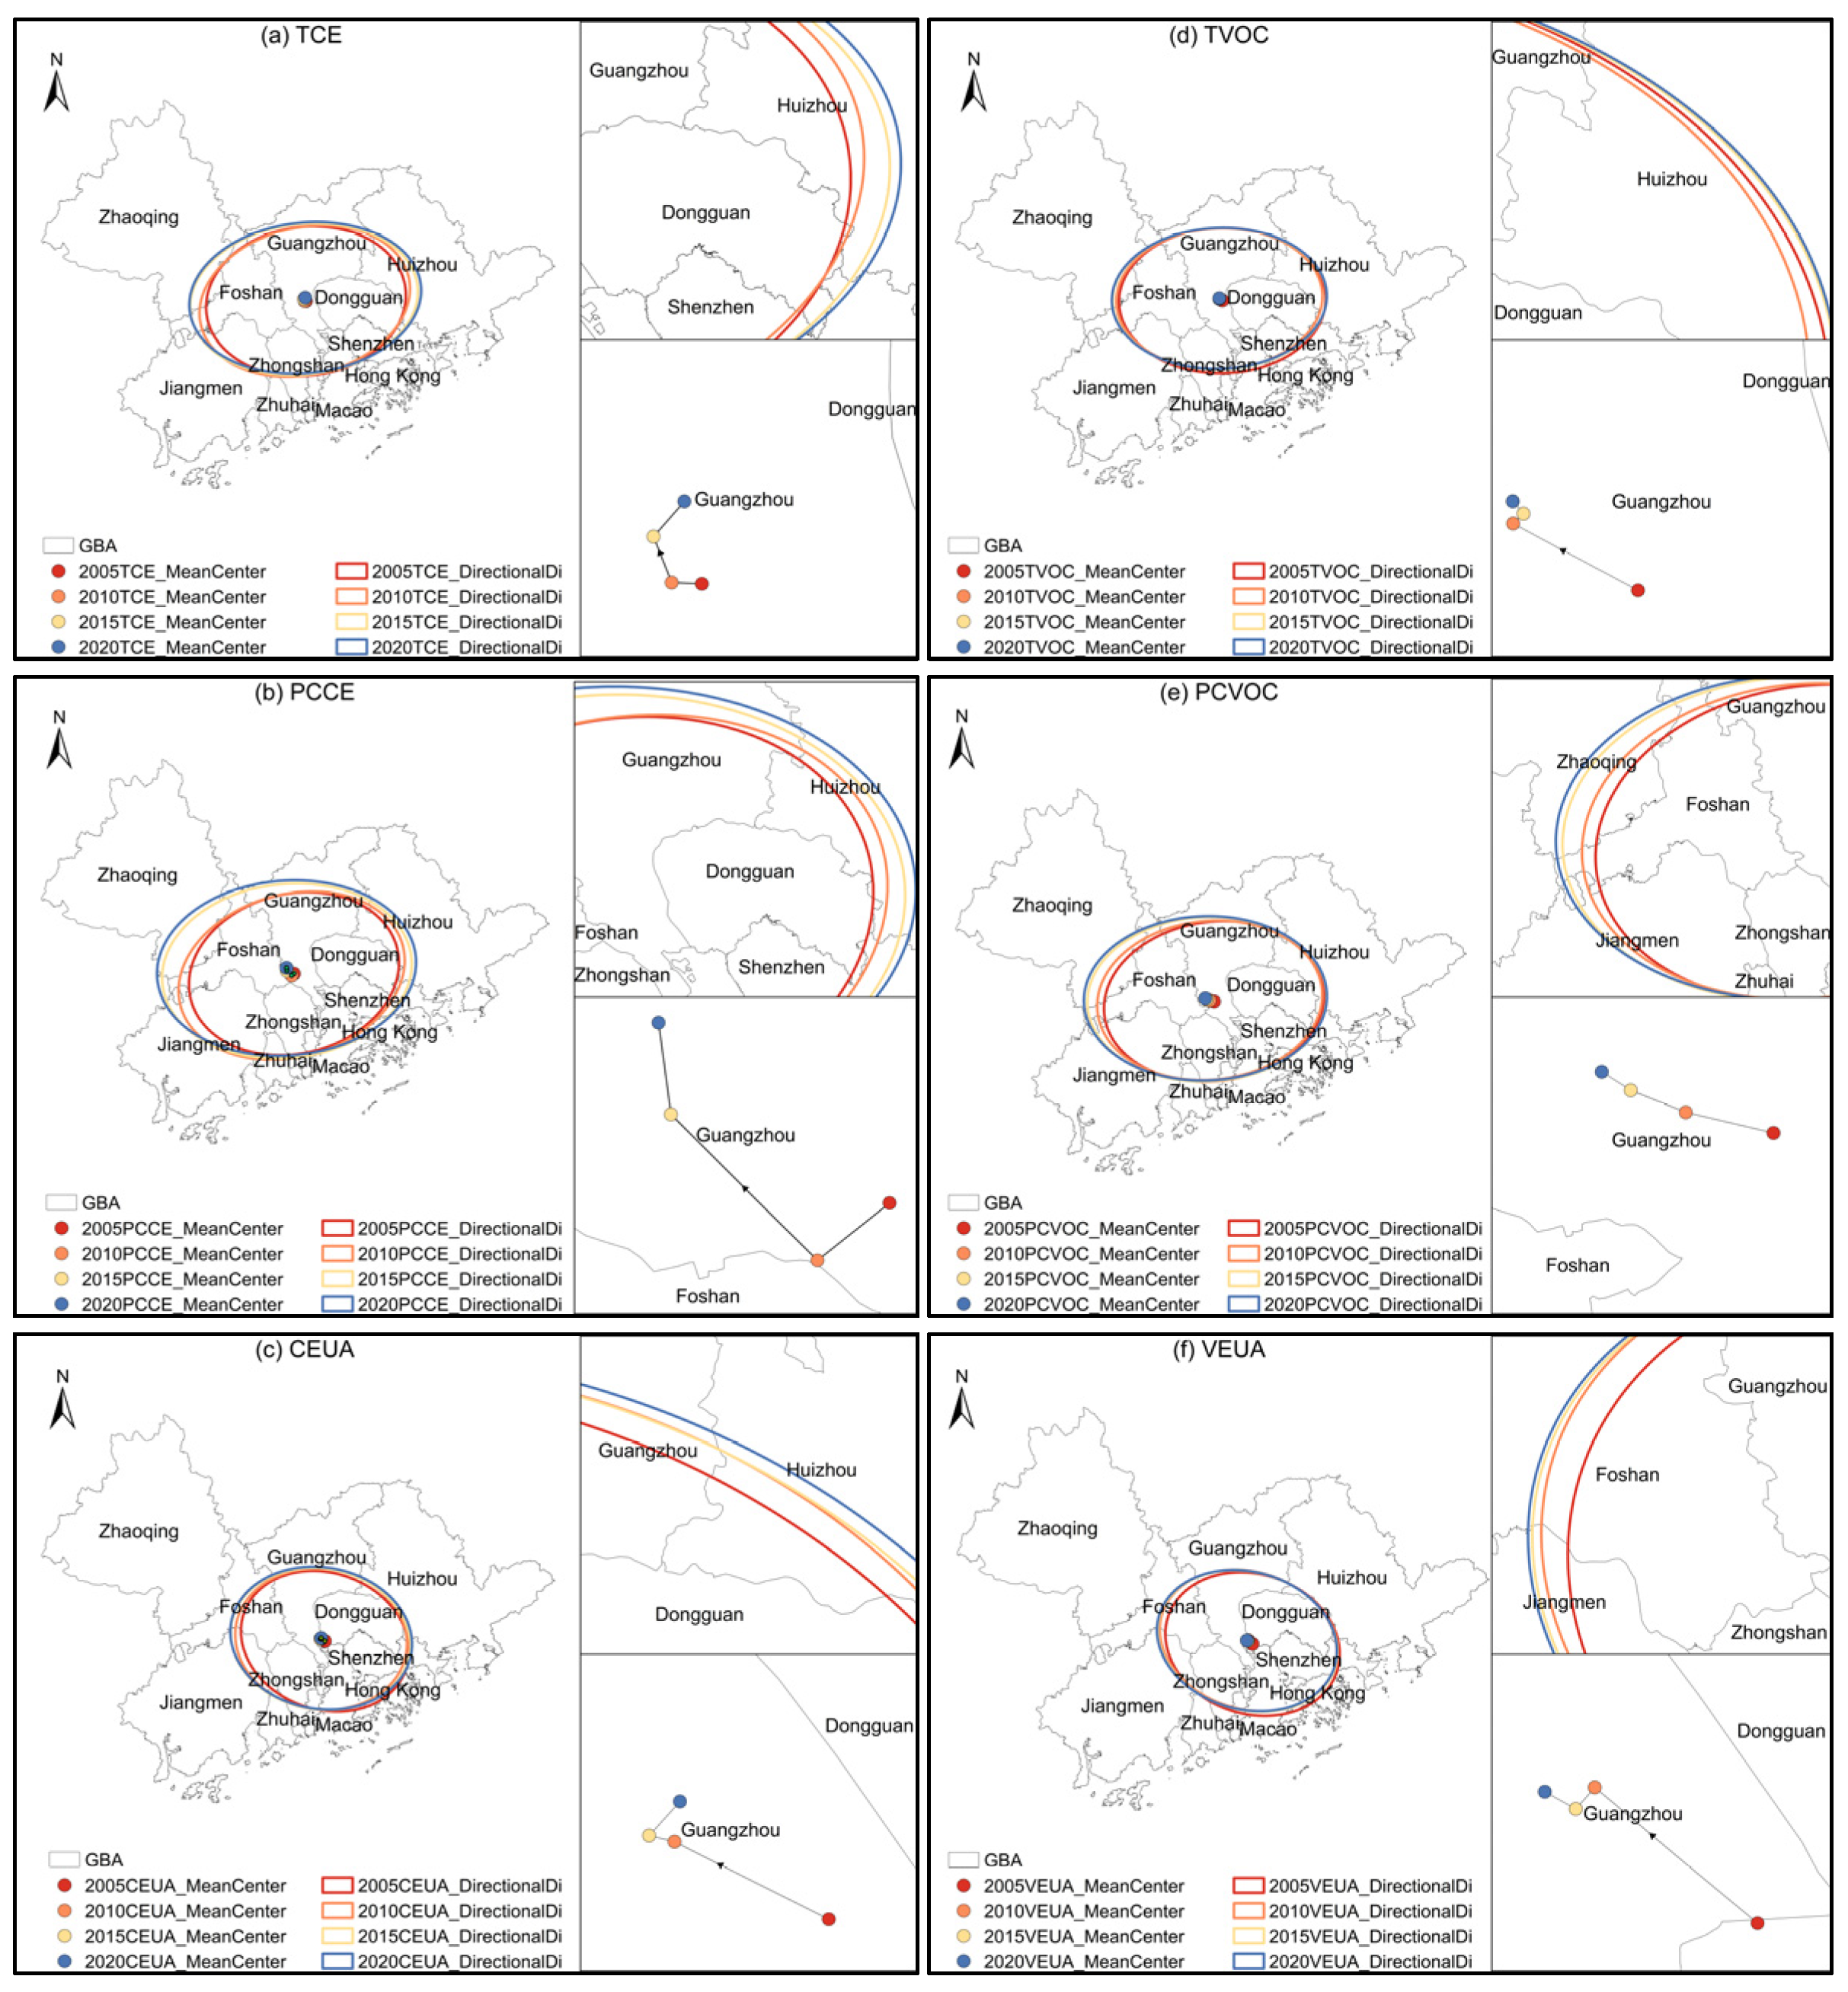
2.1.2. Standard Deviation Ellipse (SDE)

As a fundamental tool in exploratory spatial data analysis, the SDE enables systematic identification of spatial clustering patterns, directional heterogeneity, and non-uniform distribution characteristics of geographical elements [52].
SDE is centered on the center of gravity of the spatial distribution of the study object; the long axis of the ellipse indicates the direction of maximum dispersion of spatial elements, and the short axis indicates the direction of minimum dispersion of spatial elements. That is, the changes of the center of gravity, and the long and short axes of the standard deviation ellipse are used to reflect the spatial distribution and movement characteristics of carbon and VOCs. The area of the ellipse reflects the characteristics of emission distribution, and the smaller the area, the more aggregated the emission distribution [53]. The formula is as follows:
X w ¯ = i = 1 n w i x i i = 1 n w i ;   Y w ¯ = i = 1 n w i y i i = 1 n w i
t a n θ = i = 1 n x i ¯ 2 i = 1 n y i ¯ 2 i = 1 n x i ¯ 2 i = 1 n y i ¯ 2 2 + 4 i = 1 n x i ¯   y i ¯ 2 2 i = 1 n x i ¯   y i ¯
σ x = i = 1 n w i x i ¯ cos θ w i y i ¯ sin θ i = 1 n w i 2
σ y = i = 1 n w i x i ¯ sin θ w i y i ¯ cos θ i = 1 n w i 2
In the formula, ( x i , y i ) is the spatial location coordinates of the ith sampling point; w i is the weight; n is the number of cities; θ is the turning angle, representing the main trend of the spatial distribution of the research object; σ x represents the length of the long axis of the ellipse; σ y represents the length of the short axis of the ellipse; and the area of the standard deviation ellipse reflects the aggregation status of the distribution of carbon and VOC emissions. The standard deviation ellipse area reflects the aggregation of carbon and VOC distribution: the smaller area indicates the more aggregated emission distribution.

2.2. Decomposition of CAP Synergistic Emission Reduction Effect

2.2.1. CAP Emission Reduction Drive Decomposition Based on Kaya–LMDI Model

Combined with the spatial and temporal characteristics of CAP emissions in the GBA and the feasibility of factor quantification, the main factors affecting CAP emissions can be summarized as intensity factors (emission intensity, energy intensity, etc.), structural factors (energy structure, economic structure, etc.), and scale factors (economic development, population size, etc.) [54] (Figure 2).
In 1989, Japanese scholar Yoichi Kaya proposed Kaya’s constant equation to factorize carbon emissions in response to changes in carbon emissions [55]. The expression is:
C O 2 = C O 2 P E · P E G D P · G D P P O P · P O P
where C O 2 , P E , G D P , and P O P denote carbon emissions, energy consumption, gross domestic product, and population, respectively.
An improved Kaya identity combined with the LMDI method was used to construct a CAP-driven decomposition model for the GBA. This model decomposes total CAP emissions into sectoral contributions across the GBA’s 9 + 2 cities [56]:
C = i = 1 11 j = 1 4 C i j = i = 1 11 j = 1 C i j F i j F i j Y i j Y i j Y i Y i + i = 1 11 j = 2 4 C i j F i j F i j F i F i Y i Y i Y Y P P
In the formula, i represents 9 + 2 cities in the GBA, where i = 1, 2, 3, 4, 5, 6, 7, 8, 9, 10, 11; and j represents sectors, with j = 1 Industry, 2 Electricity, 3 Transportation, and 4 Residential.
Equation (9) can be further rearranged as follows:
C = i = 1 11 j = 1 E M I i j × I E I i j × I E S i j × Y i + i = 1 11 j = 2 4 E M I i j × E S i j × E I i × G S i × P G D P × P
The definitions of parameters involved in the model calculation process are provided in Table 1:
This study employs time-series data from 2005 to 2020 for the GBA, with statistical analysis of model variables provided in Table 2.

2.2.2. CAP Synergistic Emission Reduction Effect Model Based on Kaya–LMDI Model

The Kaya–LMDI model was also used for the decomposition of the drivers for CAP synergistic emission reduction effect, incorporating the synergistic carbon-pollutant reduction coefficient (Csyn) into the decomposition equation. This study investigated the contributions of the Csyn and CO2 reduction intensity (CY) to VOC emissions, as well as the reciprocal contributions of the Csyn and VOC reduction intensity (VY) to CO2 emissions.
V O C s = i = 1 11 j = 1 4 C i j = i = 1 11 j = 1 4 V O C s i j C O 2 i j C O 2 i j Y i Y i P i P i
C O 2 = i = 1 11 j = 1 4 C i j = i = 1 11 j = 1 4 C O 2 i j V O C s i j V O C s i j Y i Y i P i P i
C s y n = E R C O 2 E R V O C s or E R V O C s E R C O 2
In the formula, i and j denote the same indices as defined in previous equations; E R C O 2 represents CO2 emission reductions; E R P denotes synergistic air pollutant reductions; and C s y n   is the synergistic CAP reduction coefficient, defined as the CO2 emission reductions per unit of pollutant reduction.
Equations (12) and (13) can be further rearranged as follows:
V O C s = i = 1 11 C i = i = 1 11 C s y n i × C Y i × P G D P i × P i
C O 2 = i = 1 11 C i = i = 1 11 C s y n i × V Y i × P G D P i × P i
The definitions of each variable within the model can be found in Table 3.

2.3. Decoupling Analysis Method

Decoupling analysis has been extensively employed to quantify dynamic dissociation mechanisms between economic development trajectories and environmental pollution burdens. Early decoupling studies focused on linear relationships between single pollutants (e.g., SO2 and NOx) and economic growth, neglecting multi-pollutant interactions and regional heterogeneities [57,58]. Since the early 21st century, climate change agendas have driven research toward co-abatement pathways for carbon and air pollution, incorporating methods such as Tapio decoupling and LMDI decomposition to quantify dynamic decoupling mechanisms [59,60,61,62].
Decoupling analysis is a key tool for assessing whether economic growth can be achieved without exacerbating environmental pressures, such as carbon emissions or air pollution. The method quantifies the dynamic relationship between economic output (e.g., GDP) and environmental indicators (e.g., CO2 and VOCs). We applied the Tapio decoupling model ( D ) to analyze the relationships between economic growth and carbon emissions, as well as air pollution, in the GBA from 2005 to 2020 [63]. The formula is as follows:
D = E / E G D P / G D P = E i E i 1 1 G D P i G D P i 1 1
In the formula, i and i 1 denote the final period and base period, respectively; E represents the CAP emission increment; G D P denotes the GDP increment; and D is the decoupling elasticity coefficient, reflecting the change trend of CAP emissions relative to economic growth between periods (i.e., decoupling state). Based on different degrees of decoupling, decoupling states can be classified into four categories: strong decoupling, weak decoupling, recessionary decoupling, and negative decoupling. Among these, strong decoupling represents the most desirable state, where economic growth occurs concurrently with declining carbon emissions. Conversely, negative decoupling is the most undesirable state, indicating a maladjusted relationship between economic development and carbon emissions [64]. Table 4 presents eight decoupling states for carbon-pollutant emissions.

2.4. Data Sources

2.4.1. CAP Emission Data Sources

The data for this study were derived from the Multi-Resolution Emission Inventory Model for Climate and Air Pollution Research (MEIC, http://meicmodel.org.cn). The MEIC dataset is compiled using provincial energy statistics, unit-based power plant emissions, population density, transportation networks, and updated emission factors. This dataset provides annual CO2 and VOC emission data for electricity, industrial, residential, and transportation sectors, covering chemical mechanisms such as SAPRC07, CB05, and SAPRC99 [65]. It offers comprehensive and continuously updated data support to ensure timeliness and accuracy.
Version 1.4 of the MEIC database (developed in 2021) was employed, which systematically simulates the impacts of structural adjustments and pollution control measures implemented under China’s Three-Year Action Plan for Winning the Blue Sky Defense War on emission changes. The carbon emission inventory and air pollutant data were updated through 2020. Monthly CO2 and VOC raster data for electricity, industrial, residential, and transportation sectors from 2000 to 2020 were extracted at a spatial resolution of 0.25°.
To minimize zoning statistical errors caused by raster resolution, resampling operations were performed to reduce grid cell size by 100 times. Using ArcGIS 10.7 software’s zonal statistics function, average emissions for each prefecture-level city were batch-extracted.

2.4.2. Socioeconomic Population Data Sources

The data employed in this study primarily consist of energy, economic, and population datasets. Energy data encompass city-specific energy production, consumption, and structural information across different periods, which are used to evaluate energy utilization efficiency and explore energy transition pathways. Economic data detail the economic development trajectories of cities over the past decade, providing a foundation for studying the synergistic development between the economy and environment. Population data are critical for analyzing energy demand, environmental pollution, and social development, as analyzing population-change trends allows for evaluating the pressures exerted by population growth on energy and the environment.
Energy, economic, and population data were sourced from city statistical yearbooks (2005–2020), the National Bureau of Statistics of the People’s Republic of China (https://data.stats.gov.cn), the Census and Statistics Department of the Hong Kong Special Administrative Region (https://www.censtatd.gov.hk/sc/), and the Statistics and Census Service of the Macao Special Administrative Region (https://www.dsec.gov.mo/zh-MO/).

3. Result

3.1. Analysis of Spatial and Temporal Evolution Characteristics of CAP in the GBA

3.1.1. Spatiotemporal Aggregation Trend of CAP Emissions

(1)
Urban agglomeration scale
Figure 3 reveals the spatiotemporal variations in CAP characteristics in the GBA.
The total carbon emissions (TCE) of the GBA reached 84.433 million tons in 2000, growing to 216.155 million tons by 2020, representing an average annual growth rate of 7.4%. Per capita carbon emissions (PCCE) peaked at 3.8 tons in 2011 before declining gradually to 2.5 tons in 2020. Although the GBA has made progress in reducing per capita emissions, this metric remains higher than that of advanced international bay areas (e.g., California and New York), indicating significant room for improvement in low-carbon development.
Total VOC emissions (TVOC) in the GBA increased from 541,000 tons in 2000 to 1,048,000 tons in 2020, with an average annual growth rate of 4.5%. Despite high aggregate emissions, per capita VOC (PCVOC) levels remained relatively low, primarily attributed to the GBA’s efforts in industrial restructuring and pollution control.
The temporal trends of carbon emissions per unit area (CEUA) and VOC emissions per unit area (VEUA) generally mirrored those of total emissions.
(2)
Urban scale
Figure 4 illustrates the spatiotemporal characteristics of carbon emissions and VOC pollution across the GBA’s 9 + 2 cities. From 2000 to 2020, significant disparities were observed in the urban distributions of total emissions, per capita emissions, and emissions per unit area for both carbon and VOCs.
In the GBA, the nine cities in the Pearl River Delta (PRD) contributed 89% of the total carbon emissions, with Guangzhou, Foshan, and Dongguan having consistently high emissions throughout the study period (Figure 4a). Similarly, VOC emissions in the region are mainly concentrated in the core cities of the PRD, and their spatial distribution bears a remarkable resemblance to carbon emissions (Figure 4d). In addition, there were differences in the trends of carbon emission changes among the cities in the GBA: the total carbon emissions of Guangzhou, Foshan, and Zhongshan gradually stabilized after initial growth; those of Shenzhen and Dongguan rose first and then showed a downward trend; and those of Huizhou and Jiangmen maintained a steady growth throughout the period. In contrast, Shenzhen, Hong Kong, and Macao accounted for a relatively low share of total carbon emissions and VOC emissions, and their emission characteristics were significantly different from those of the other nine cities in the PRD (see Figure 4b,e). The per capita carbon emissions and VOC emissions of Hong Kong and Macao were also at a relatively low level. Comparatively, Dongguan, Foshan, and Zhongshan have higher carbon emissions and VOC emissions per unit area (Figure 4c,f). Future studies should explore in depth the impacts of economic structure and emission reduction policies on CO2 and VOC emissions in these cities, so as to understand more comprehensively the differences in regional emission characteristics and their evolutionary trends.

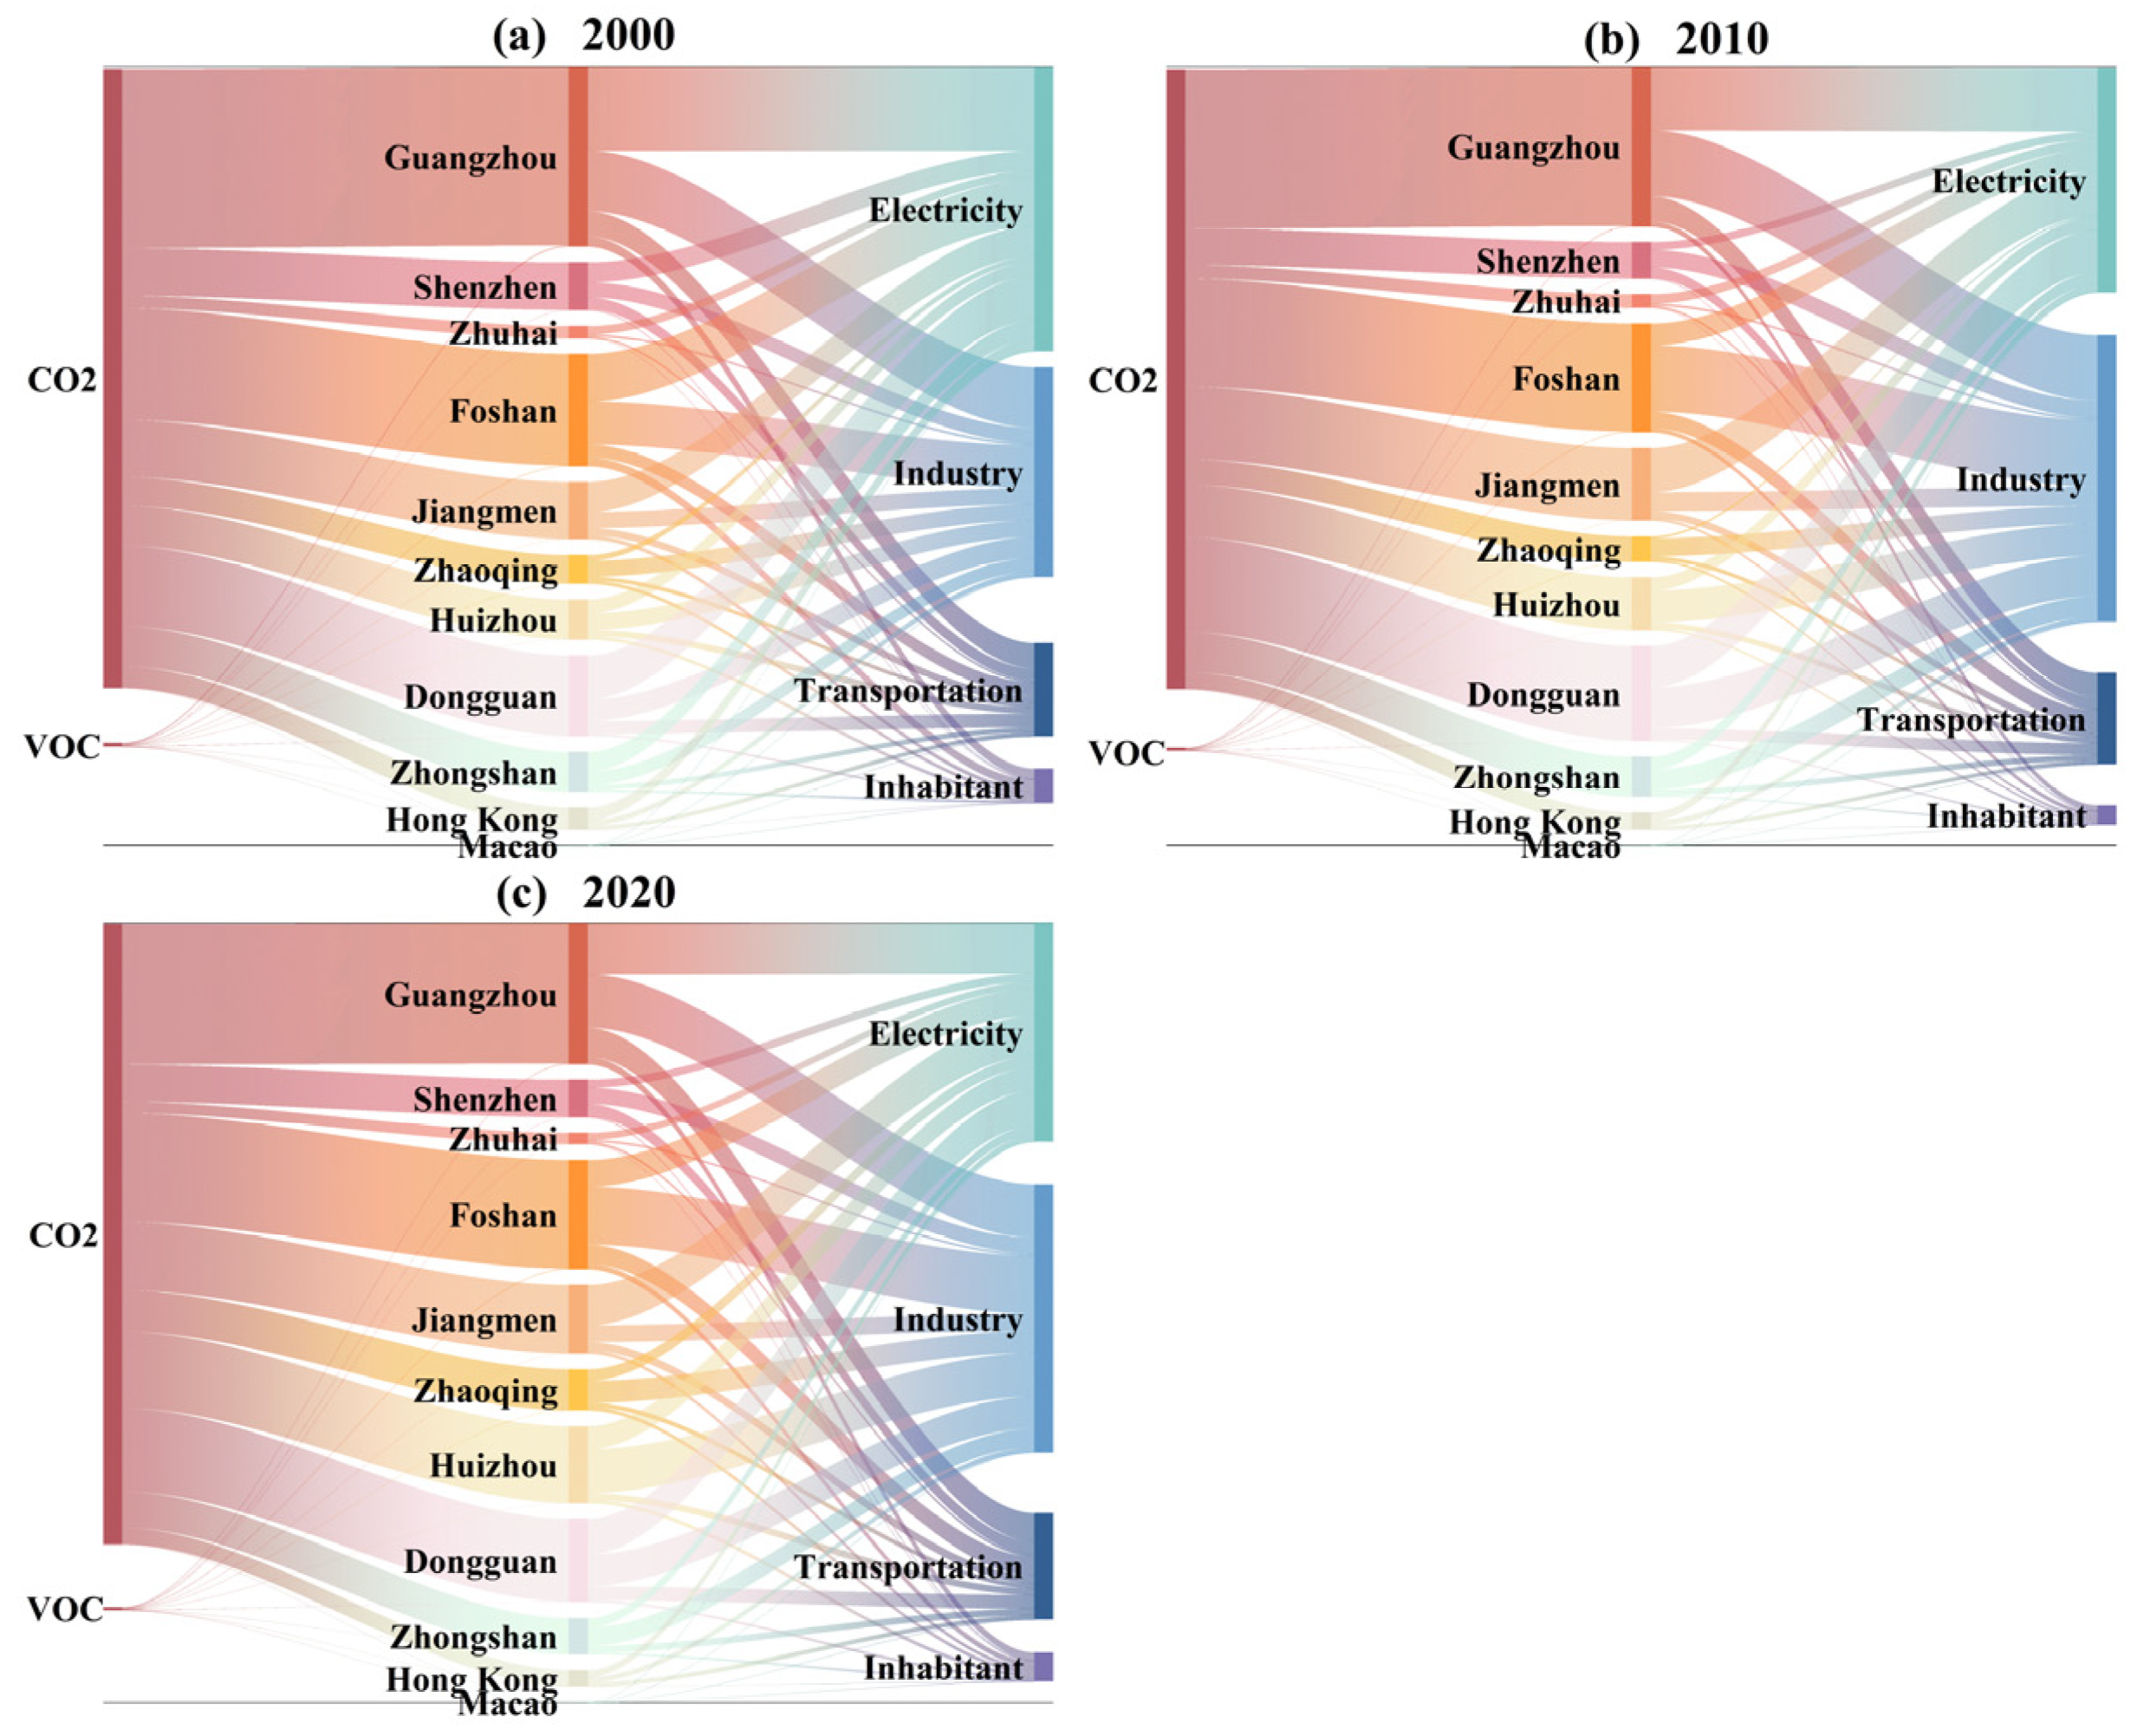
3.1.2. Analysis of CAP Emission Key Cities

Regional disparities in urban energy resource endowments and development policies have led to spatiotemporal agglomeration trends in carbon and VOC emissions. Using ArcGIS 10.7, GeoDa 1.14, and R 4.4.3 software, this study computed Moran’s I indices to explore the distribution characteristics of carbon and VOC emissions. The results of Moran’s I index show that the regional aggregation characteristics of carbon and VOC emissions in the GBA can be divided into two distinct phases (Figure 5).
The first stage is before 2014. During this period, the Moran’s I of carbon emissions in the GBA increased rapidly from 0.28 in 2005 to 0.39 in 2014, indicating a significant increase in the spatial aggregation of carbon emissions among cities. Meanwhile, the Moran’s I of VOC emissions increased from 0.31 in 2005 to 0.36 in 2014. The second stage is 2014–2020, during which the Moran’s I of carbon and VOC emissions in the GBA shows a small fluctuating upward trend, reaching 0.41 and 0.36 by 2020, respectively. The spatial correlation of carbon emissions increases slightly in this stage.
To further visualize the spatial agglomeration characteristics and dynamic evolution trends of carbon and VOC emissions, this study conducted a standard deviational ellipse analysis (Figure 6). The left part of each sub-picture shows the standard deviation ellipse and the focus-shift trajectory, the top right image is a zoomed-in view of the standard deviation ellipse, and the bottom right image is a zoomed-in view of the focus-shift trajectory.
Analysis results show that the spatial distribution of carbon and VOC emissions in the GBA exhibited specific directional patterns in 2005, 2010, 2015, and 2020. Specifically, the spatial distribution of total emissions and per capita emissions of CO2 and VOCs mainly presents an “east–west” pattern, indicating that the high-value areas of emissions have strong extensibility in the east-west direction (Figure 6a,b,d,e). The spatial distribution of emissions per unit area shows a pattern of “southeast–northwest”, reflecting the significant difference in emission intensity per unit area in this direction (Figure 6c,f). In addition, the spatial polarization effect of carbon emissions is stronger than that of VOC emissions; that is, the inter-city difference of carbon emissions is greater than that of VOC emissions. In the GBA, the spatial distribution of carbon emissions is more uneven, and the contribution of some cities to the total carbon emissions is more significant, whereas VOC distributions were relatively more homogeneous.
The area of the standard deviational ellipse expanded continuously from 2005 to 2020, indicating increasing spatial dispersion of carbon and VOC emissions. This phenomenon suggests that high-emission zones are no longer confined to specific regions but are gradually diffusing to surrounding cities. Concurrently, the ellipse’s centroid shifted northwestward overall, indicating a gradual concentration of the GBA’s carbon and VOC emission activities in this direction.

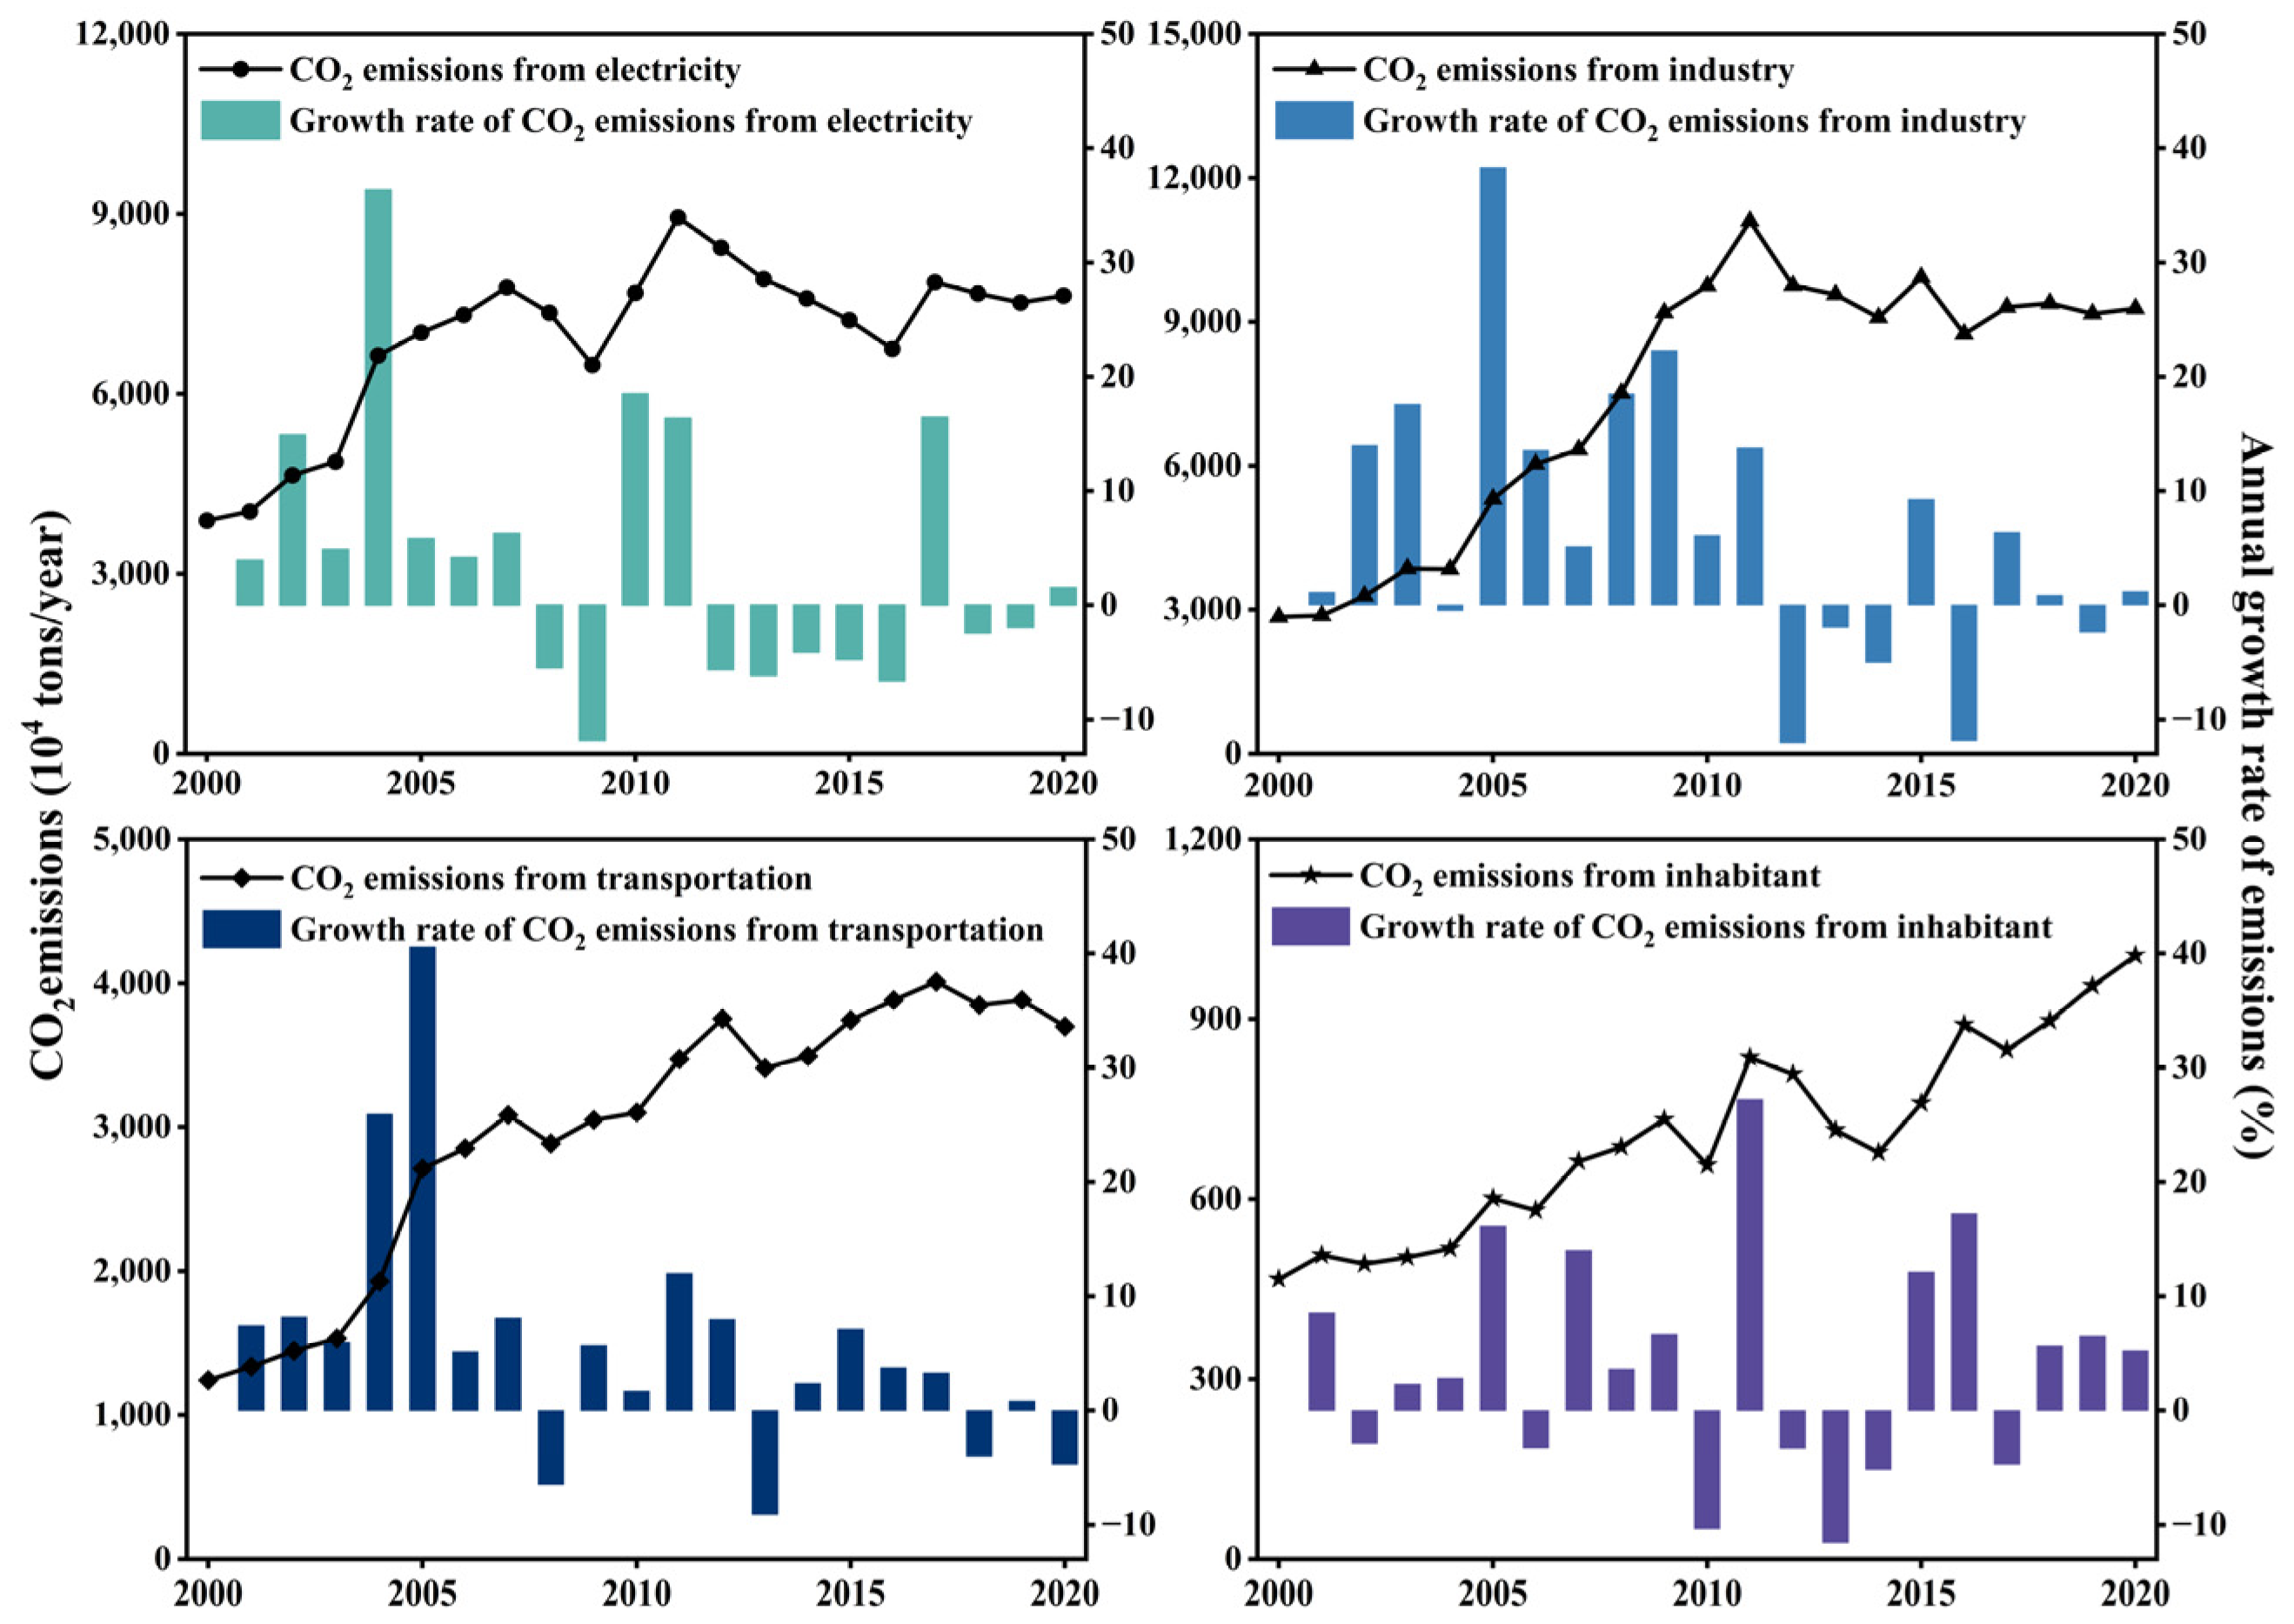
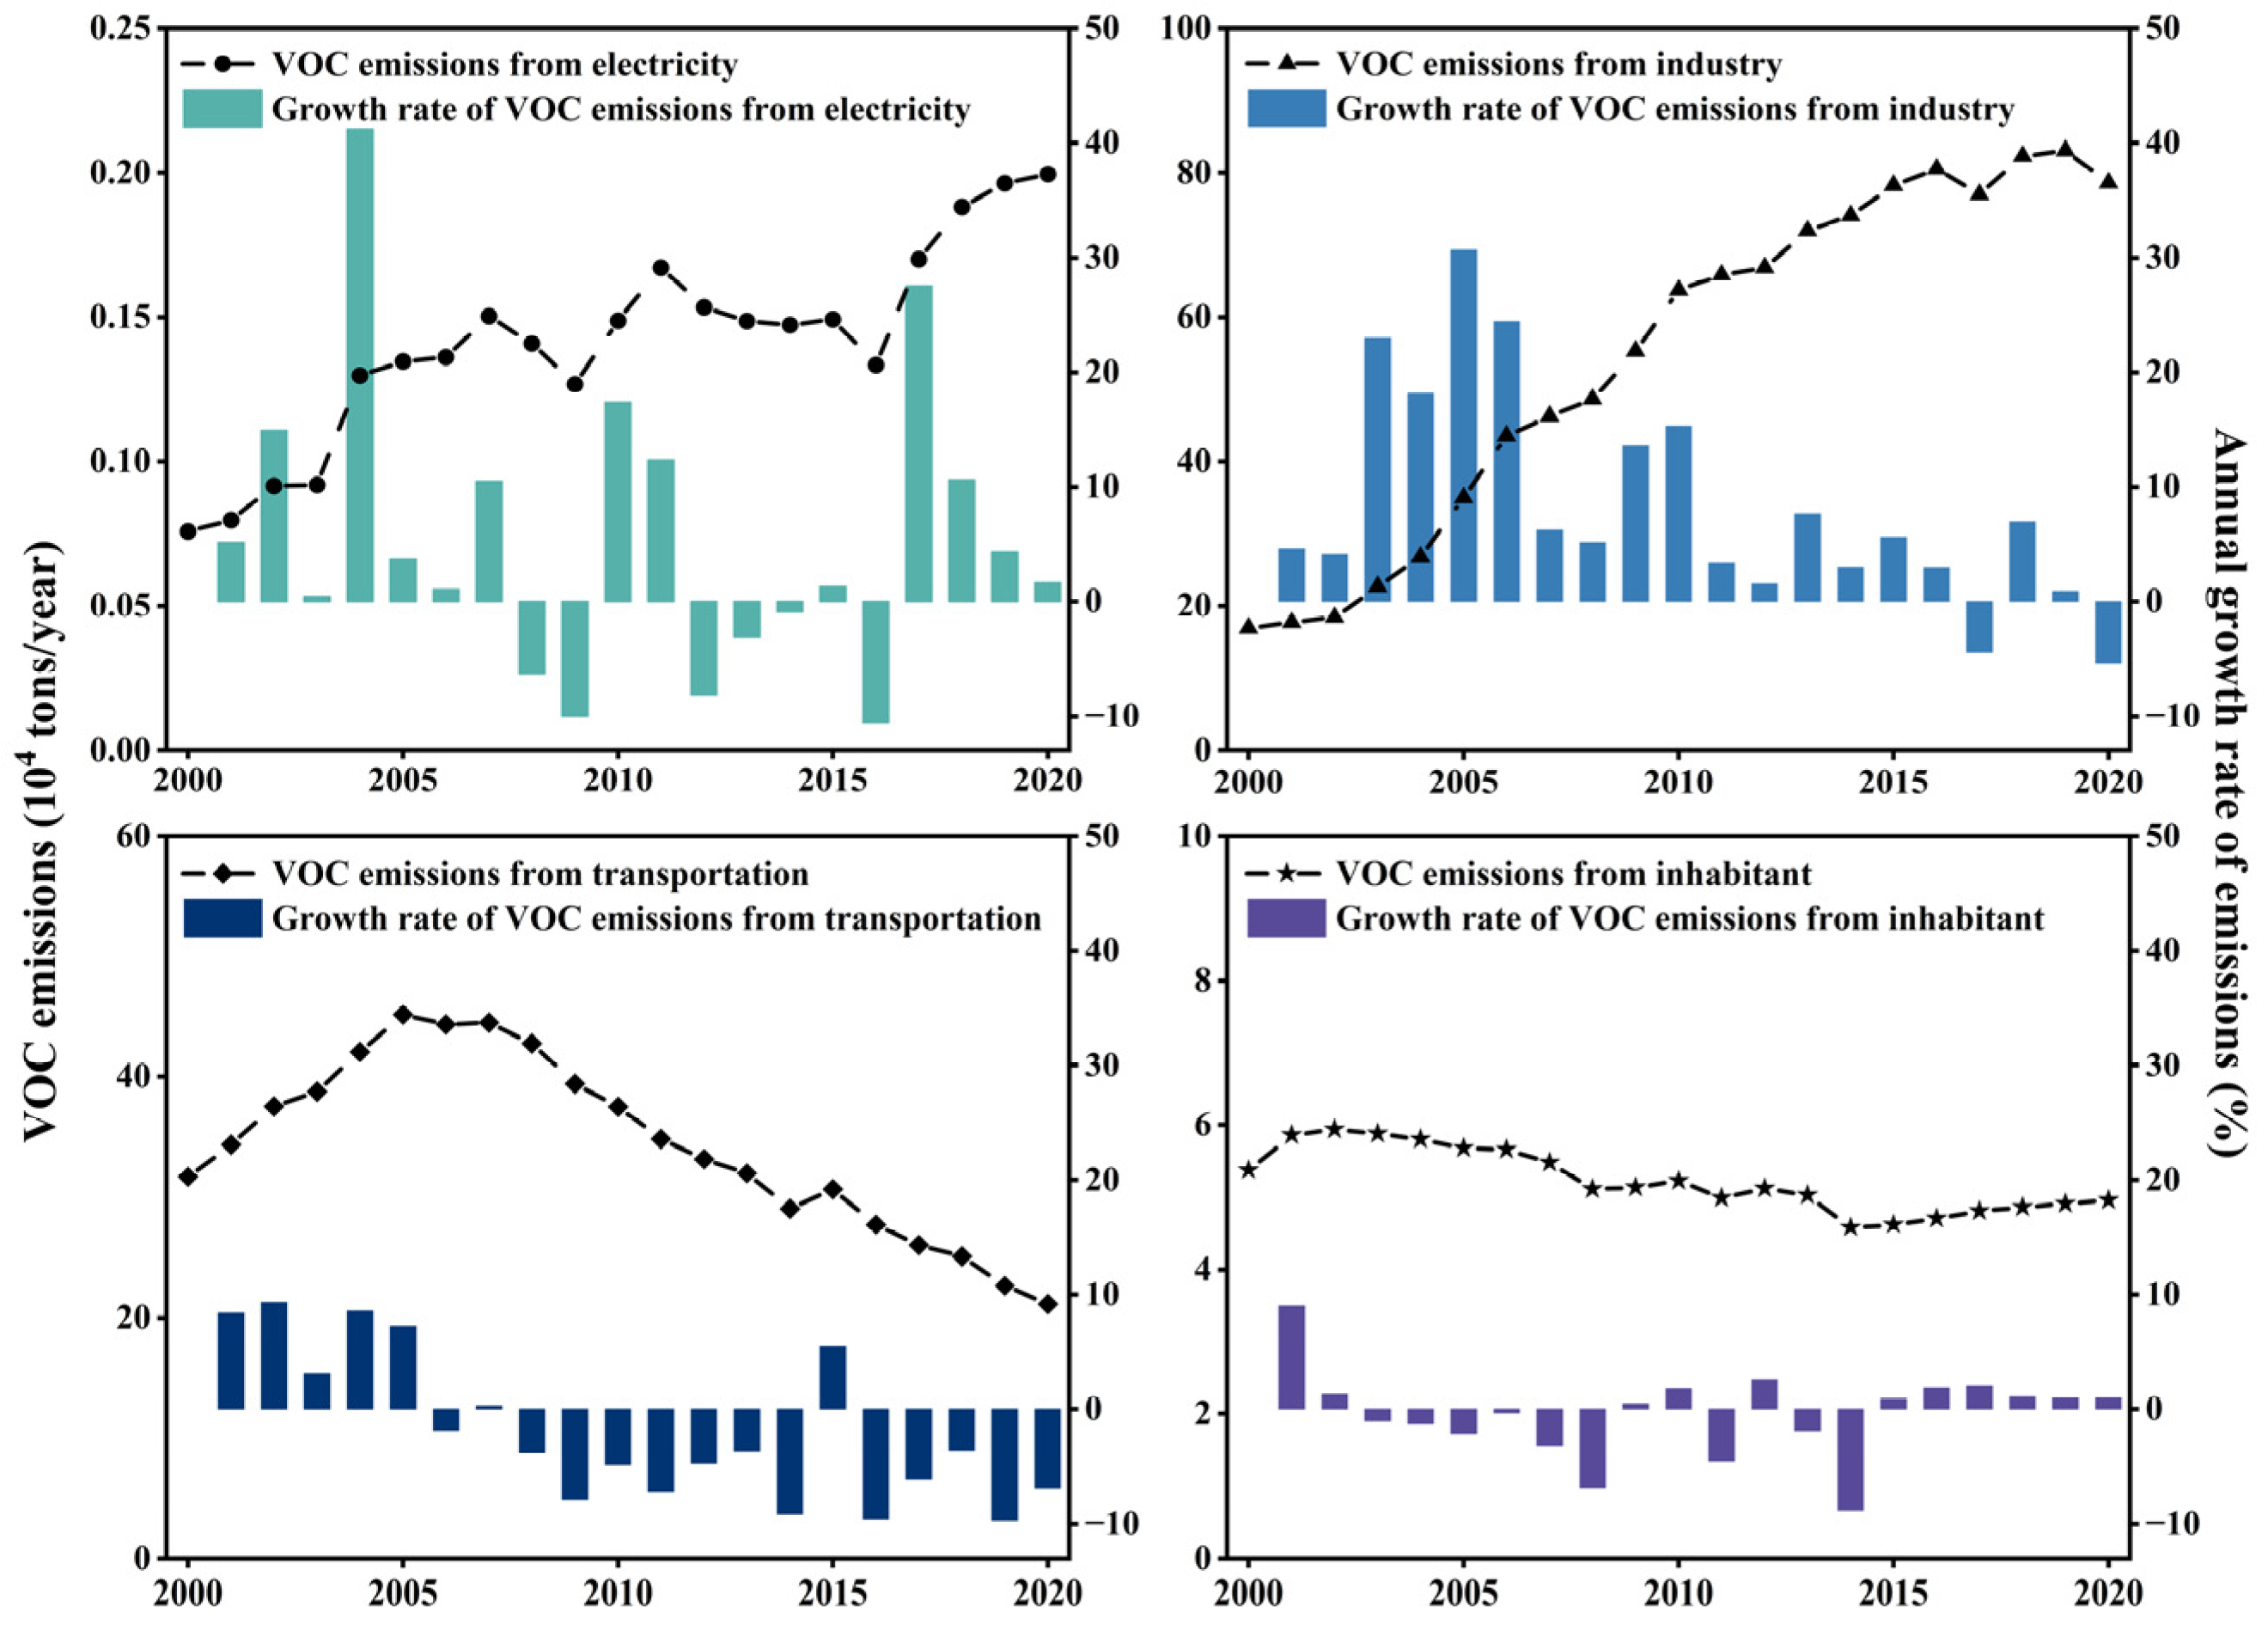
3.1.3. Analysis of CAP Emission Key Sectors

From 2000 to 2020, significant disparities in carbon emissions were observed across major sectors in the GBA (Figure 7).
From a sectoral decomposition perspective over time, the industrial and electricity sectors were primary sources of CO2 emissions, with their emissions peaking in 2011 before showing a downward trend. This shift was likely closely associated with industrial restructuring, energy efficiency improvements, and clean energy replacement policies implemented in the GBA after 2010 [66]. For instance, the industrial sector reduced energy consumption through technological upgrades and capacity optimization, while the electricity sector decreased coal dependence by increasing natural gas and renewable energy usage.
In contrast, CO2 emissions from transportation and residential sectors exhibited moderate growth trends, collectively accounting for approximately 20% of the GBA’s total CO2 emissions (Figure 8). The growth in transportation emissions may be attributed to sustained increases in motor-vehicle ownership, while residential-sector growth reflects rising energy demand driven by population growth and improving living standards.
Figure 9a–c illustrate the dynamic changes in city-level and sectoral carbon and VOC emissions across the GBA in 2000, 2010, and 2020.
Figure 9 shows that Guangzhou, Foshan, and Dongguan consistently ranked among the top three cities in carbon emissions, with their distributions highly aligned with key cities of VOCs. As economic cores of the GBA, their high emissions primarily stemmed from intensive industrial activities, heavy traffic volume, and high energy consumption. From a sectoral perspective, carbon and VOC emissions from the electricity sector declined annually, closely linked to the GBA’s recent energy structure optimization policies—such as increasing natural gas and renewable energy adoption while phasing out high-pollution, high-energy-consuming coal-fired power plants. However, reduced electricity sector emissions did not significantly lower total emissions, instead coinciding with a shift in emission contributions to the industrial sector. The industrial sector has emerged as the primary source of both carbon and VOC emissions in recent years. Rising emissions in this sector may be attributed to rapid manufacturing expansion, increased chemical production activities, and escalating industrial energy consumption.

3.2. Analysis of Driving Factors of CAP Emissions

In order to reveal the regional and sectoral differences of CO2 and VOC pollution in urban agglomerations and cities in the GBA, this study employed the LMDI model to conduct a driving factor analysis of CO2 and VOC emissions. The investigation focused on the current situation of industrial energy consumption, industrial energy intensity, industrialization level, proportion of non-industrial energy consumption, regional economic development balance, and population size in 9 + 2 cities and their impact on carbon emission reduction.

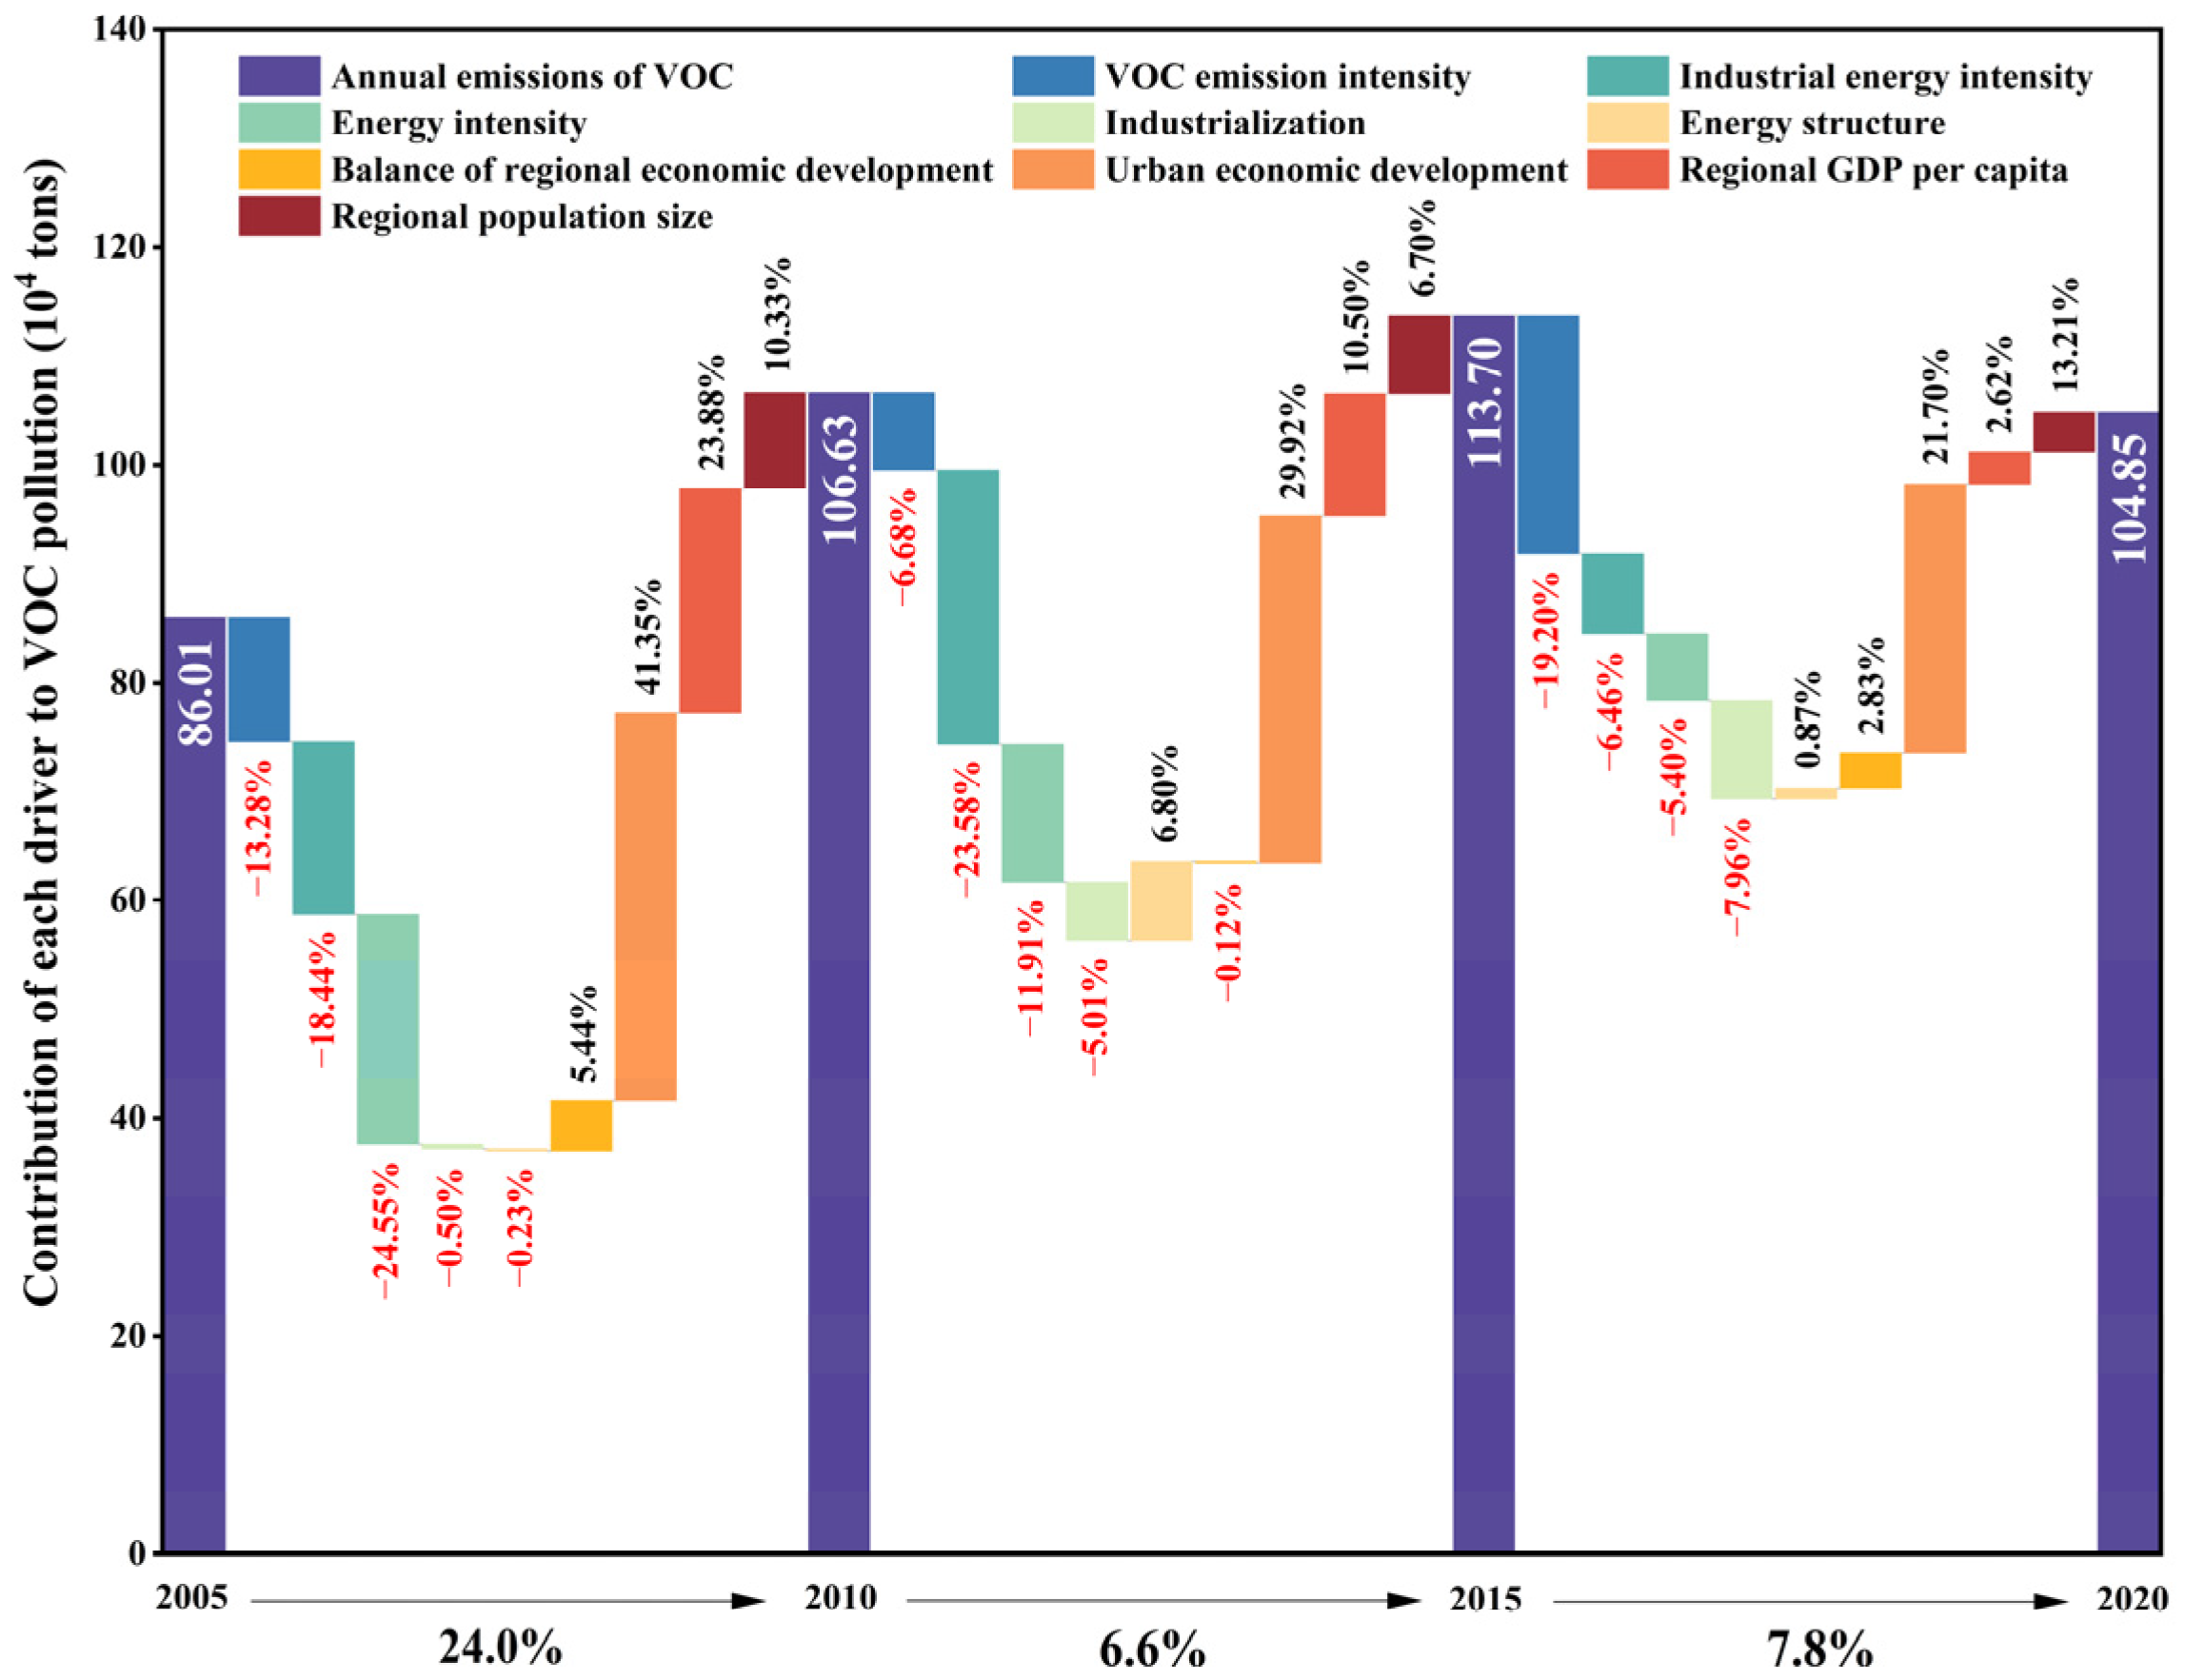
3.2.1. Analysis of Driving Factors of CAP Emission in Urban Agglomeration Scale

To analyze the impacts of driving factors on carbon and VOC reductions over 16 years in a more intuitive manner, this study divided the research period into three phases (2005–2010, 2010–2015, and 2015–2020).
First, the LMDI method was employed to quantitatively analyze the contribution levels of the driving factors of CO2 emissions in the GBA (Figure 10). The results show that the growth rate of CO2 emissions declined significantly over the period 2005–2020. Among them, it was 35.4% in 2005–2010, and it decreased to 2.2% in 2010–2015, with the first negative growth (−0.2%) in 2020. This trend indicates that the GBA has achieved initial successes in carbon reduction.
Positive driving factors for carbon reduction (promoting emission reductions) include industrial energy intensity, energy intensity, and regional economic development balance. Among these, reduced industrial energy intensity was one of the primary driving factors for CO2 reductions, accounting for more than 20% of the emission reduction. This indicates that technological upgrades and energy efficiency improvements in the industrial sector significantly reduced energy consumption per unit of output. Declining energy intensity also played a positive role in emissions reductions, with a contribution rate comparable to industrial energy intensity, reflecting overall energy efficiency improvements in the GBA—likely due to clean energy replacement and optimized energy management. Additionally, improvements in regional economic development balance positively impacted carbon reductions during 2010–2015, suggesting that narrowing regional economic gaps and promoting coordinated development helped lower aggregate carbon emissions.
Negative driving factors for carbon reduction (increasing emissions) include industrialization level, urban economic development, regional per capita GDP, and population size. During 2005–2010, the industrialization level did not facilitate emission reductions; instead, it caused a 1.03% increase in carbon emissions. This may be attributed to rapid industrial-scale expansion and a high proportion of energy-intensive industries during this phase. Rising urban economic development levels also increased emissions, indicating that economic growth remains reliant on energy-intensive industries and high-carbon development models. Furthermore, growth in per capita GDP exerted a positive driving effect on emissions, reflecting increased energy demand from improving living standards. Expanding population size further exacerbated emissions, highlighting sustained pressures from population growth on energy consumption and carbon emissions.
Next, the study analyzed the driving factors and contribution levels of VOC emissions (Figure 11). Our results showed that industrial energy intensity, energy intensity, VOC emission intensity, and industrialization level made positive contributions to VOC reductions, whereas economic development emerged as the primary factor driving increased VOC emissions.
Positive driving factors for VOC reduction (promoting emission reductions) include industrial energy intensity, energy intensity, VOC emission intensity, and industrialization level. Among them, industrial energy intensity’s contribution to VOC reductions decreased from 23.58% in 2010 to 6.46% in 2020, indicating that early technological upgrades and energy efficiency improvements in the industrial sector played a significant role, though their impact diminished over time. Energy intensity’s contribution declined from 24.55% in 2005 to 5.40% in 2020, reflecting the positive effect of overall energy efficiency improvements in the GBA on VOCs’ reductions, albeit with decreasing contribution rates. VOC emission intensity’s contribution rose from 13.28% in 2005 to 19.20% in 2020, demonstrating that technological advancements and enhanced end-of-pipe pollution control measures significantly reduced VOC emissions per unit of economic output. The industrialization level’s control effect on VOC reductions gradually strengthened, suggesting that industrial structural optimization and phasing out high-pollution industries positively impacted emissions.
The negative driving factor for VOCs’ reduction (increasing emissions) was economic development, though its contribution rate trended downward. This shift indicates that under the context of low-carbon economic transformation, the GBA’s economic growth has become progressively less dependent on VOC emissions, leading to improved environmental quality.

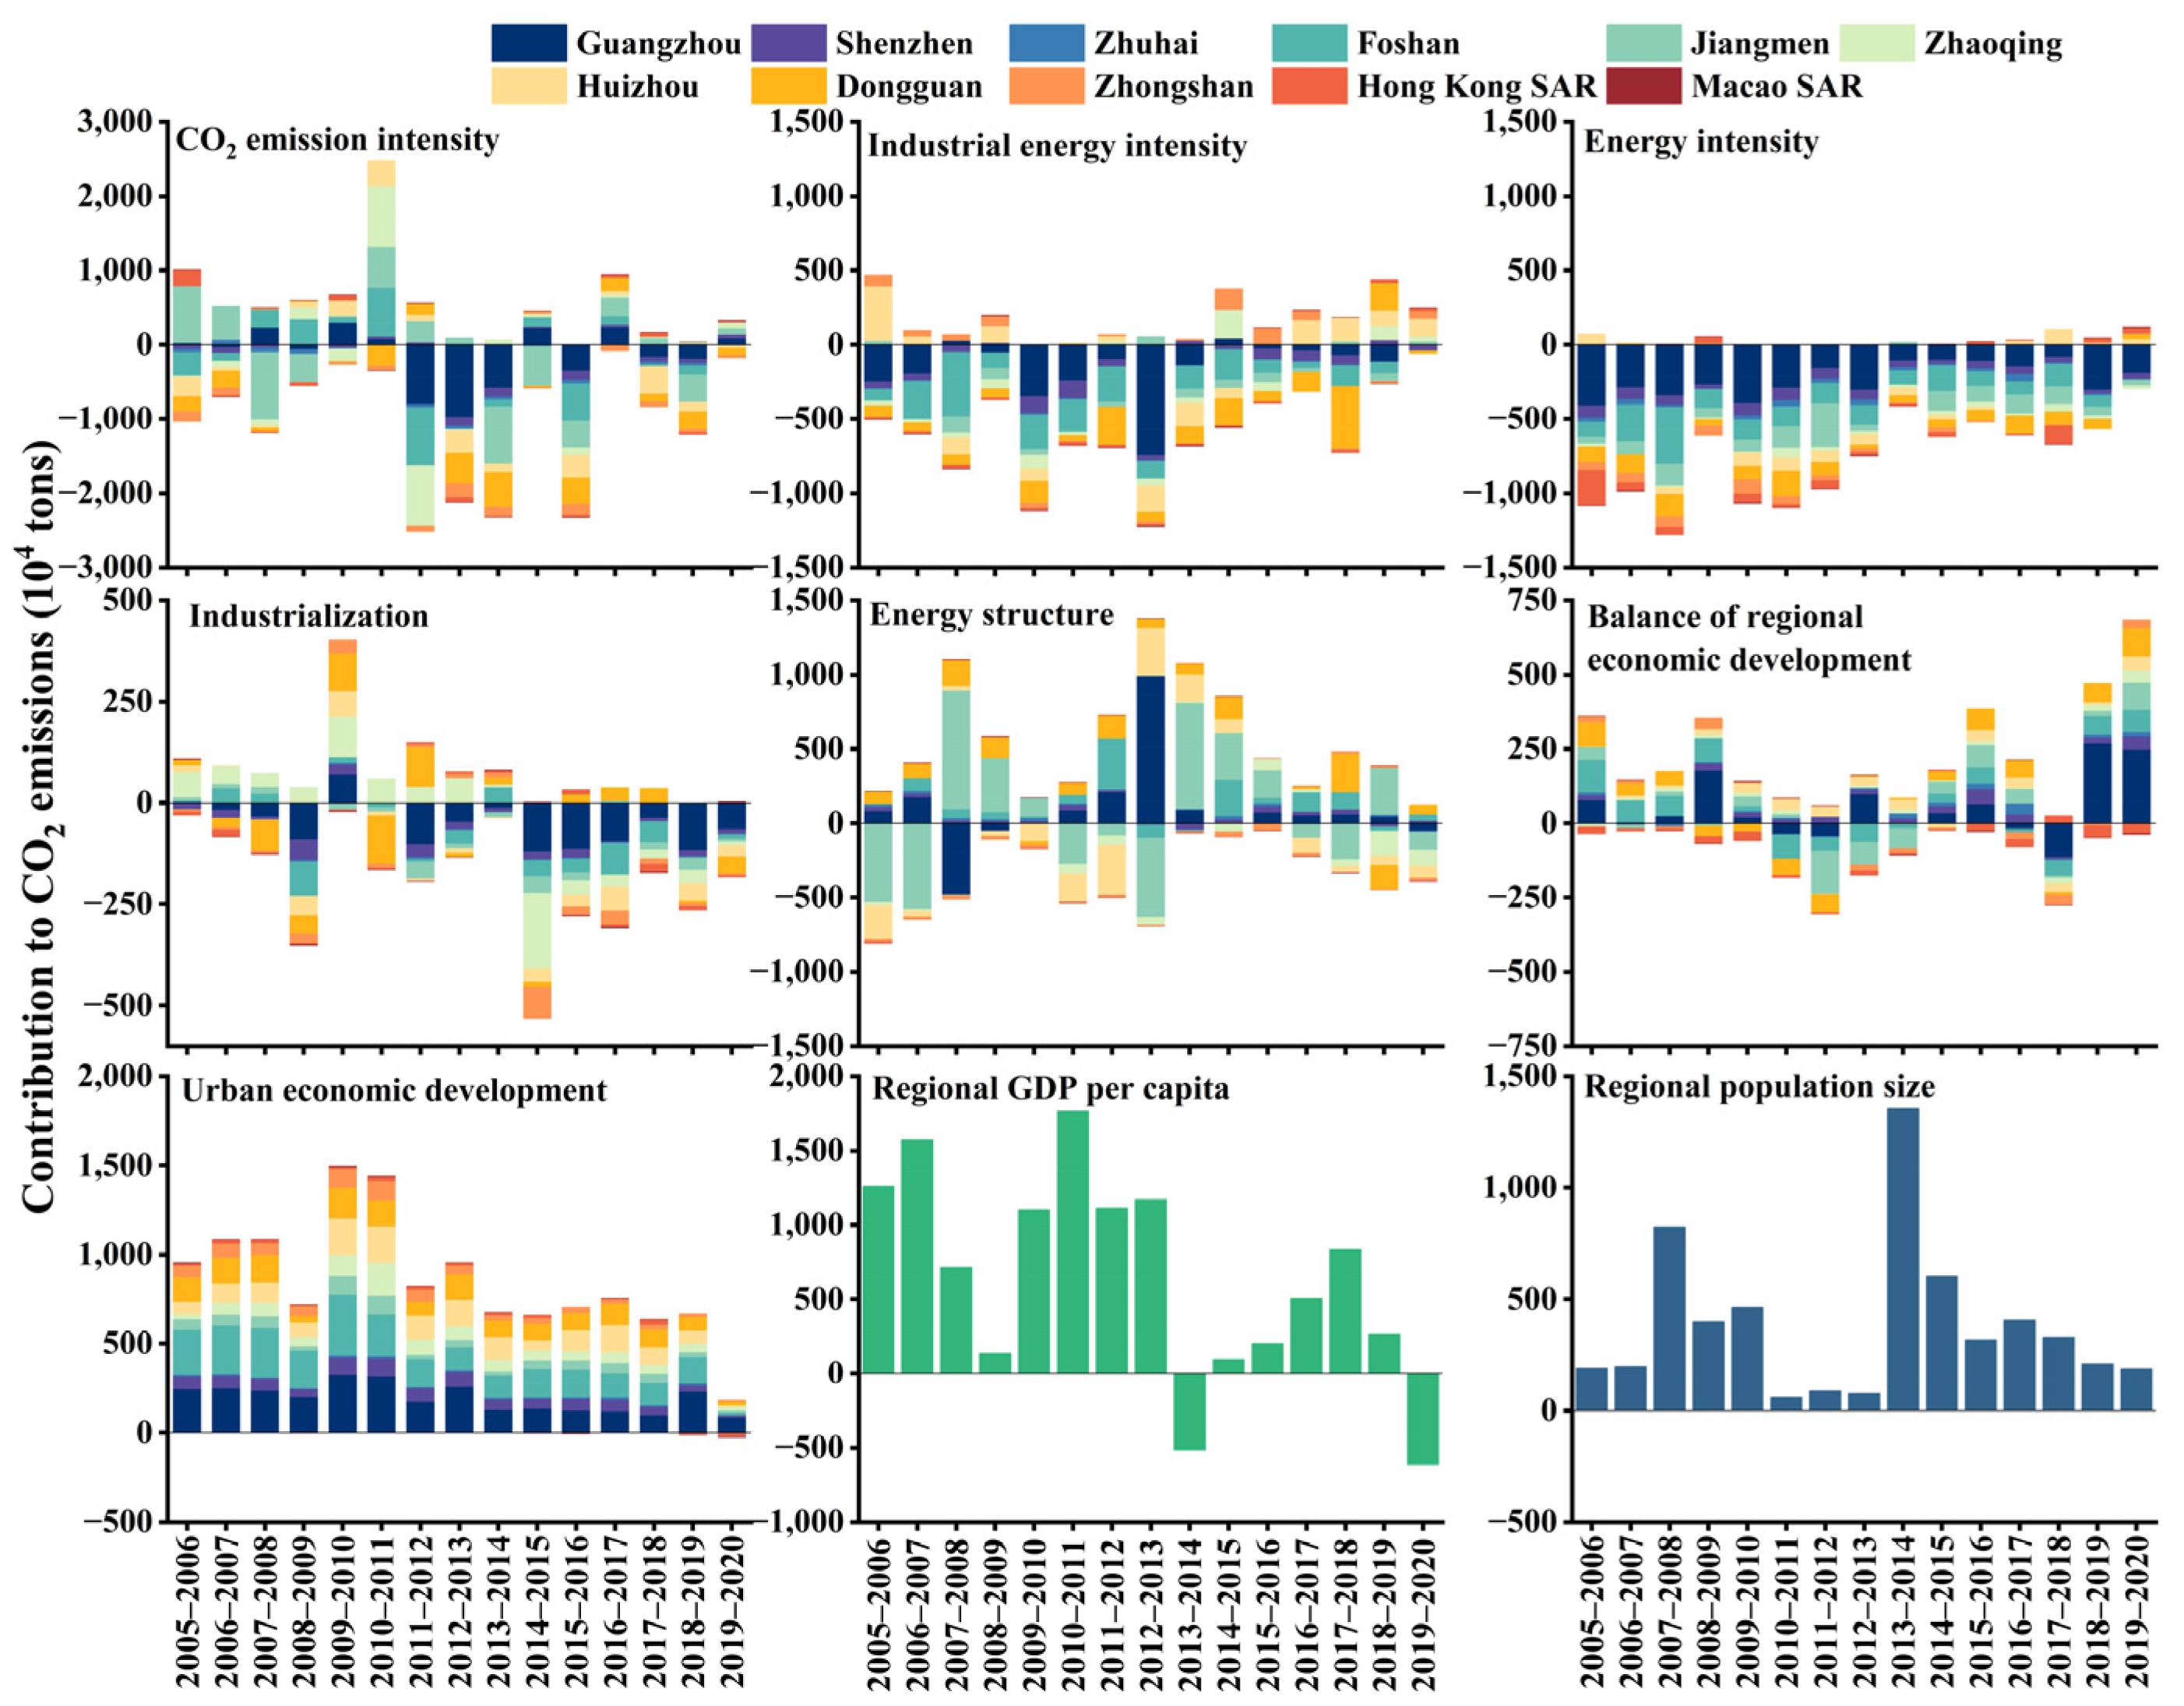
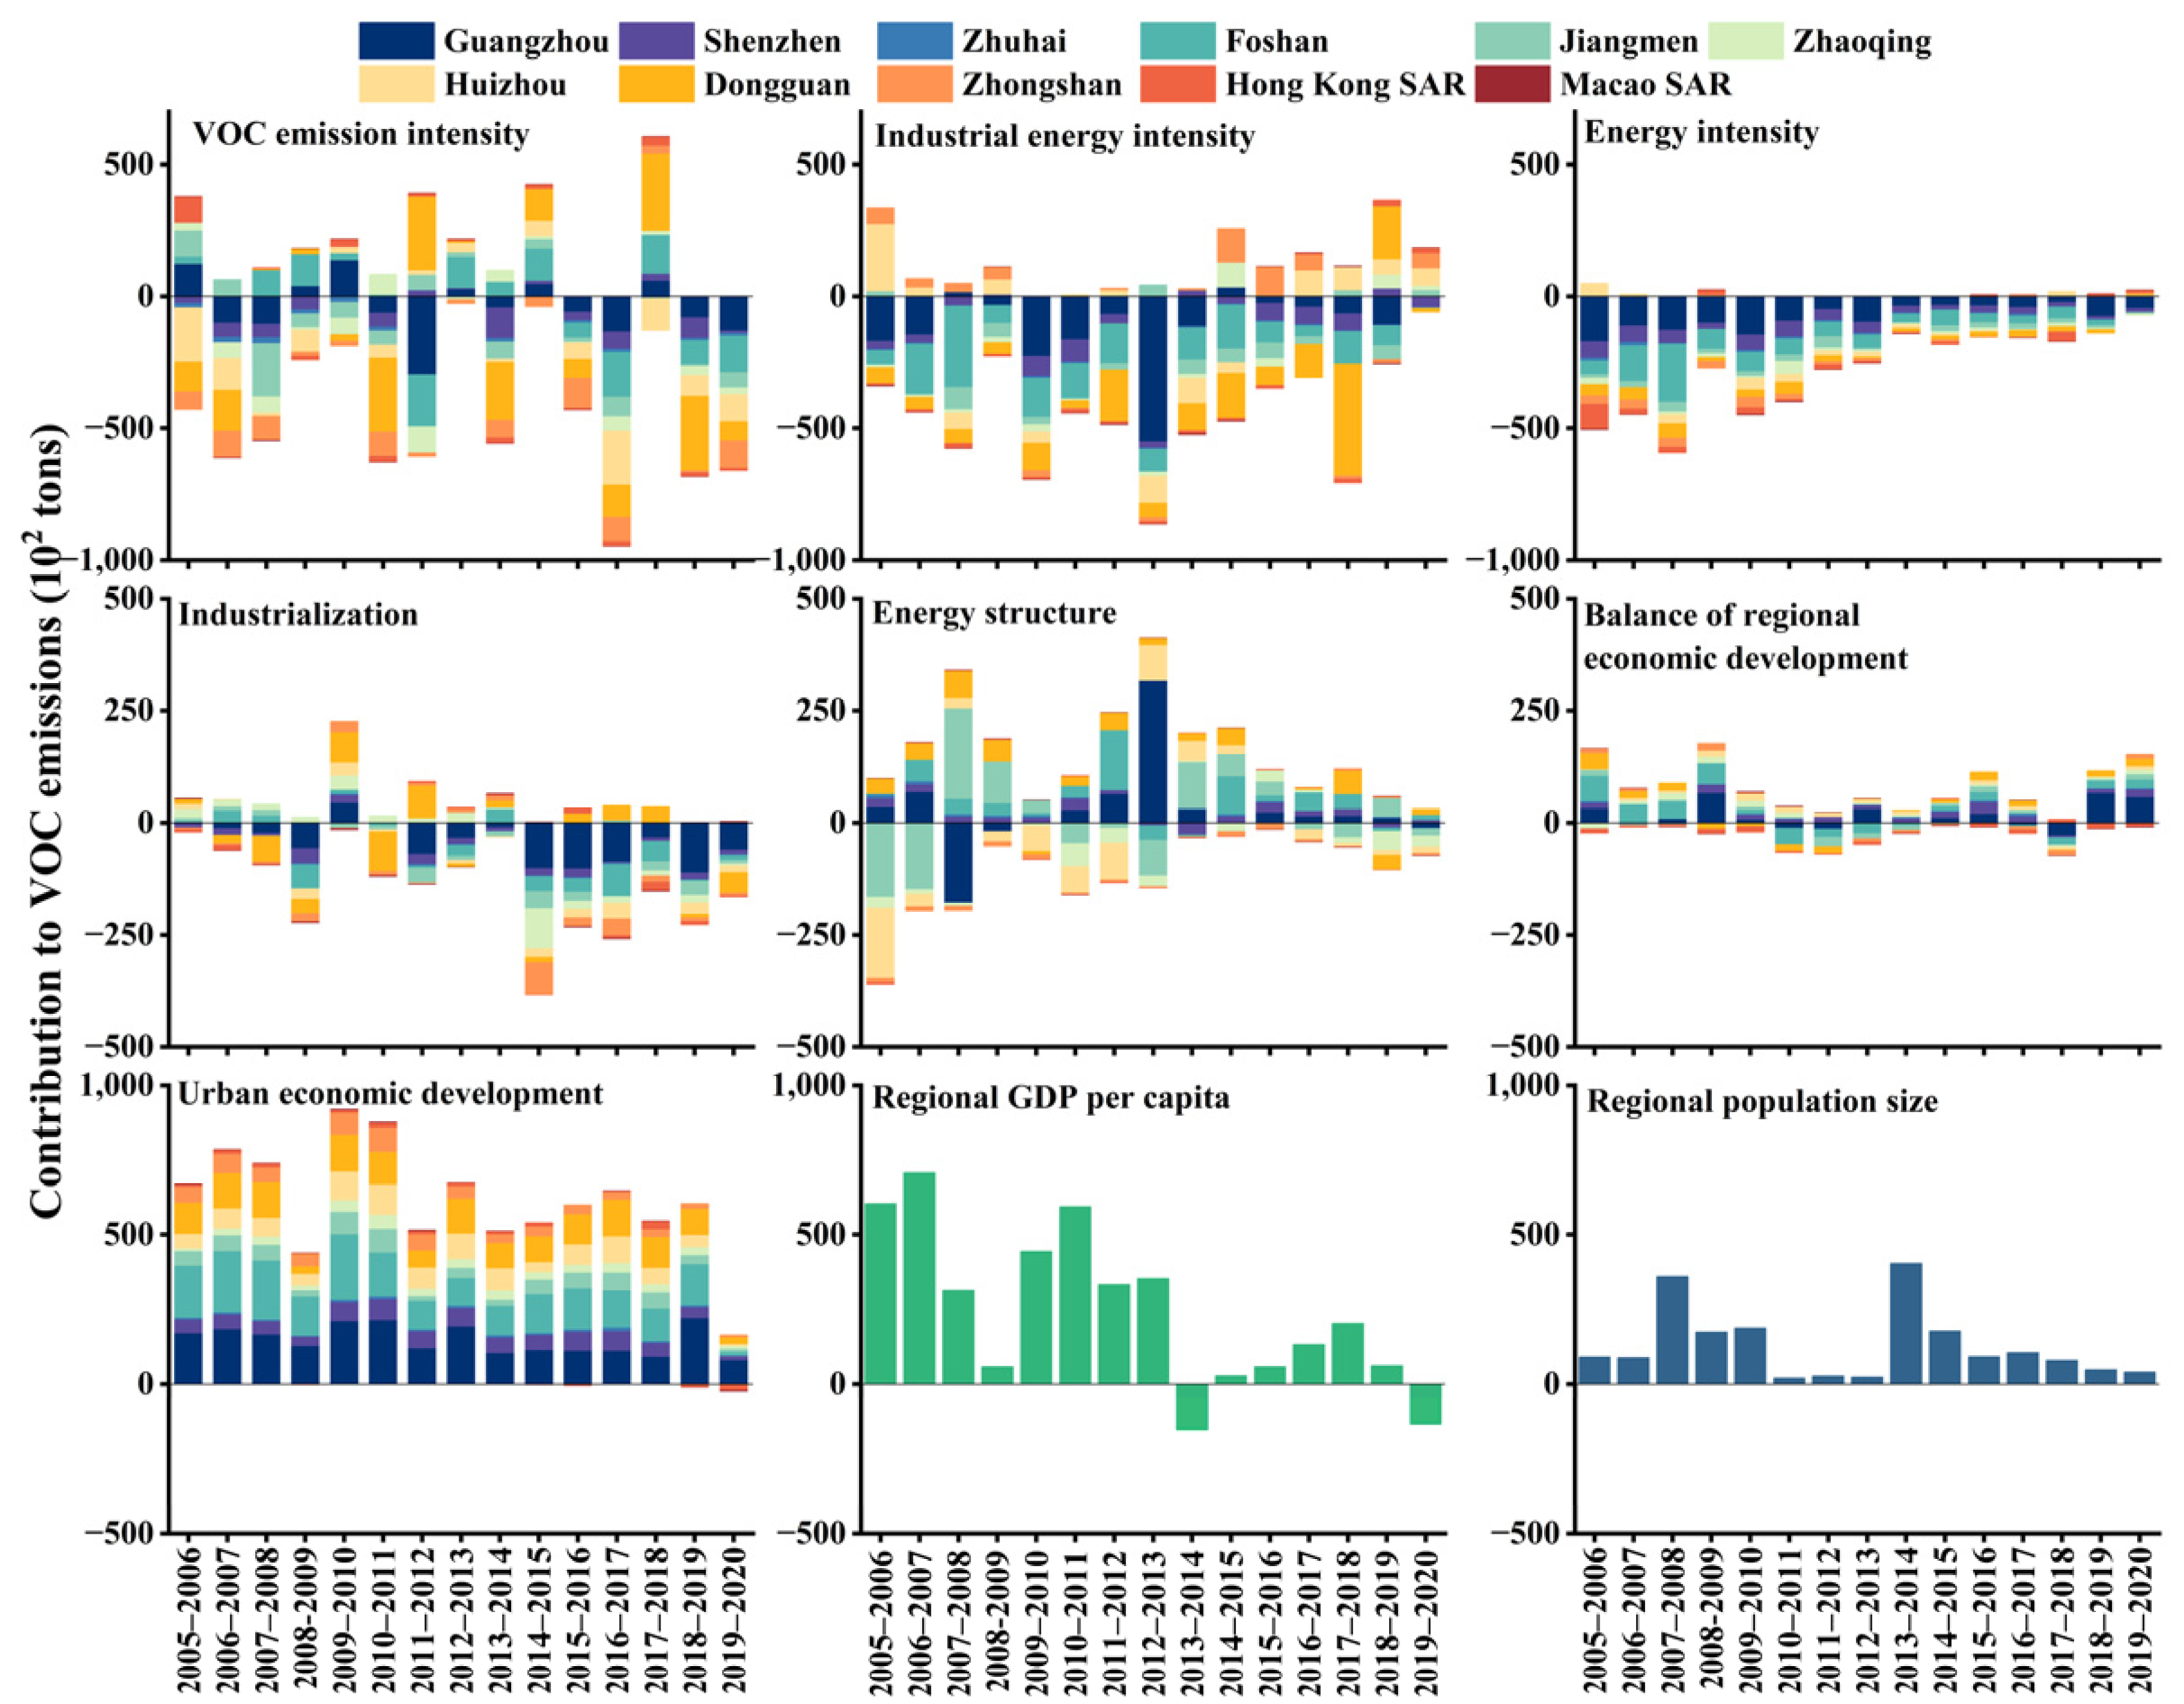
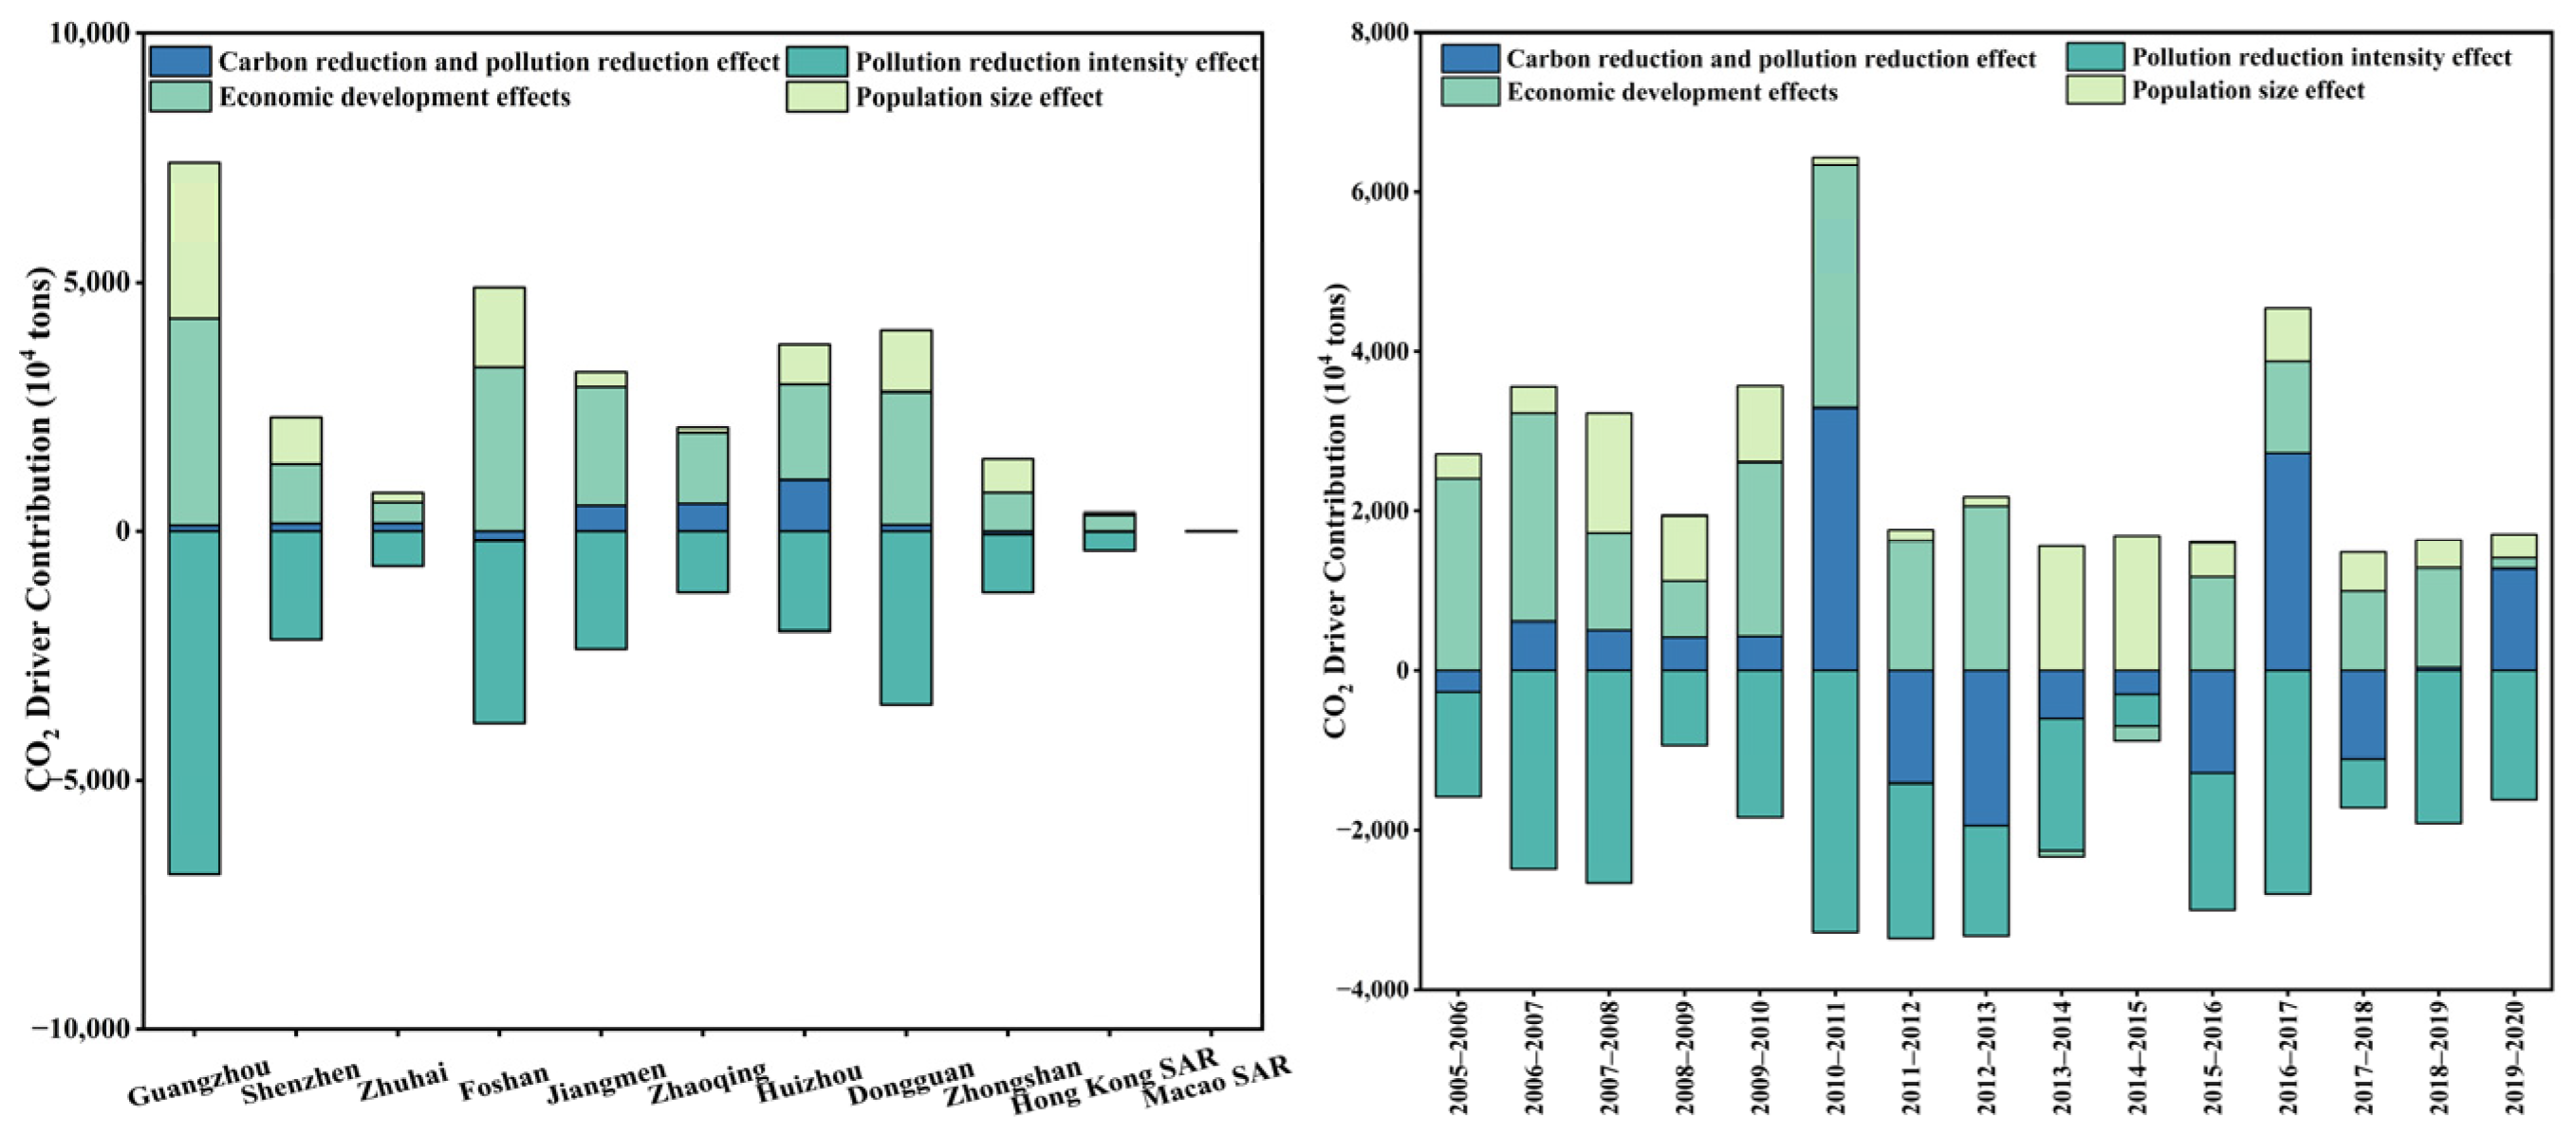
3.2.2. Analysis of the Absolute Contribution of Driving Factors for CO2 and VOC Emission Reduction at Urban Scale

Based on data analysis of the GBA’s 9 + 2 cities from 2005 to 2020, this study further quantified the absolute contributions of various factors to CO2 reductions (Figure 12).
Our results indicate that urban economic development, regional per capita GDP, and regional population size were negative driving factors for CO2 reduction, significantly increasing carbon emissions. Conversely, industrial energy consumption intensity and energy consumption intensity served as positive driving factors for CO2 reduction. Among these, energy consumption intensity demonstrated the most significant carbon reduction contribution, nearly offsetting the emission increase caused by economic growth.
Figure 13 illustrates the influence effects of various driving factors on VOC emissions in the GBA’s 9 + 2 cities from 2005 to 2020.
The results of the driving-force decomposition analysis for VOC emissions mirrored those for CO2 emissions, including urban economic development, regional per capita GDP, and regional population size, which exerted negative effects in VOC reductions in most areas, while industrial energy intensity, energy intensity, and industrialization level had a positive effect on VOC reductions in most cities. Among these, declining energy intensity had the most significant impact on VOC reductions.
In summary, Guangzhou, Foshan, Dongguan, Huizhou, and Zhongshan showed larger negative effect of economic development on both the reduction of both CO2 and VOCs, indicating their continued reliance on high-energy-consuming and high-emission industrial models, which drive sustained emission increases. Optimizing industrial structures and reducing the proportion of energy-intensive industries represent critical pathways for achieving emission reduction targets in these cities. Moreover, Guangzhou and Shenzhen demonstrated significant positive effects of energy intensity and industrial energy intensity on CO2 and VOC reductions. These cities effectively reduced emissions while maintaining economic growth through improved energy efficiency and optimized industrial energy consumption structures. Thus, lowering energy intensity serves as an effective entry point for achieving urban pollution and carbon reduction goals, enabling reduced energy use while ensuring economic benefits and advancing green and low-carbon urban development.

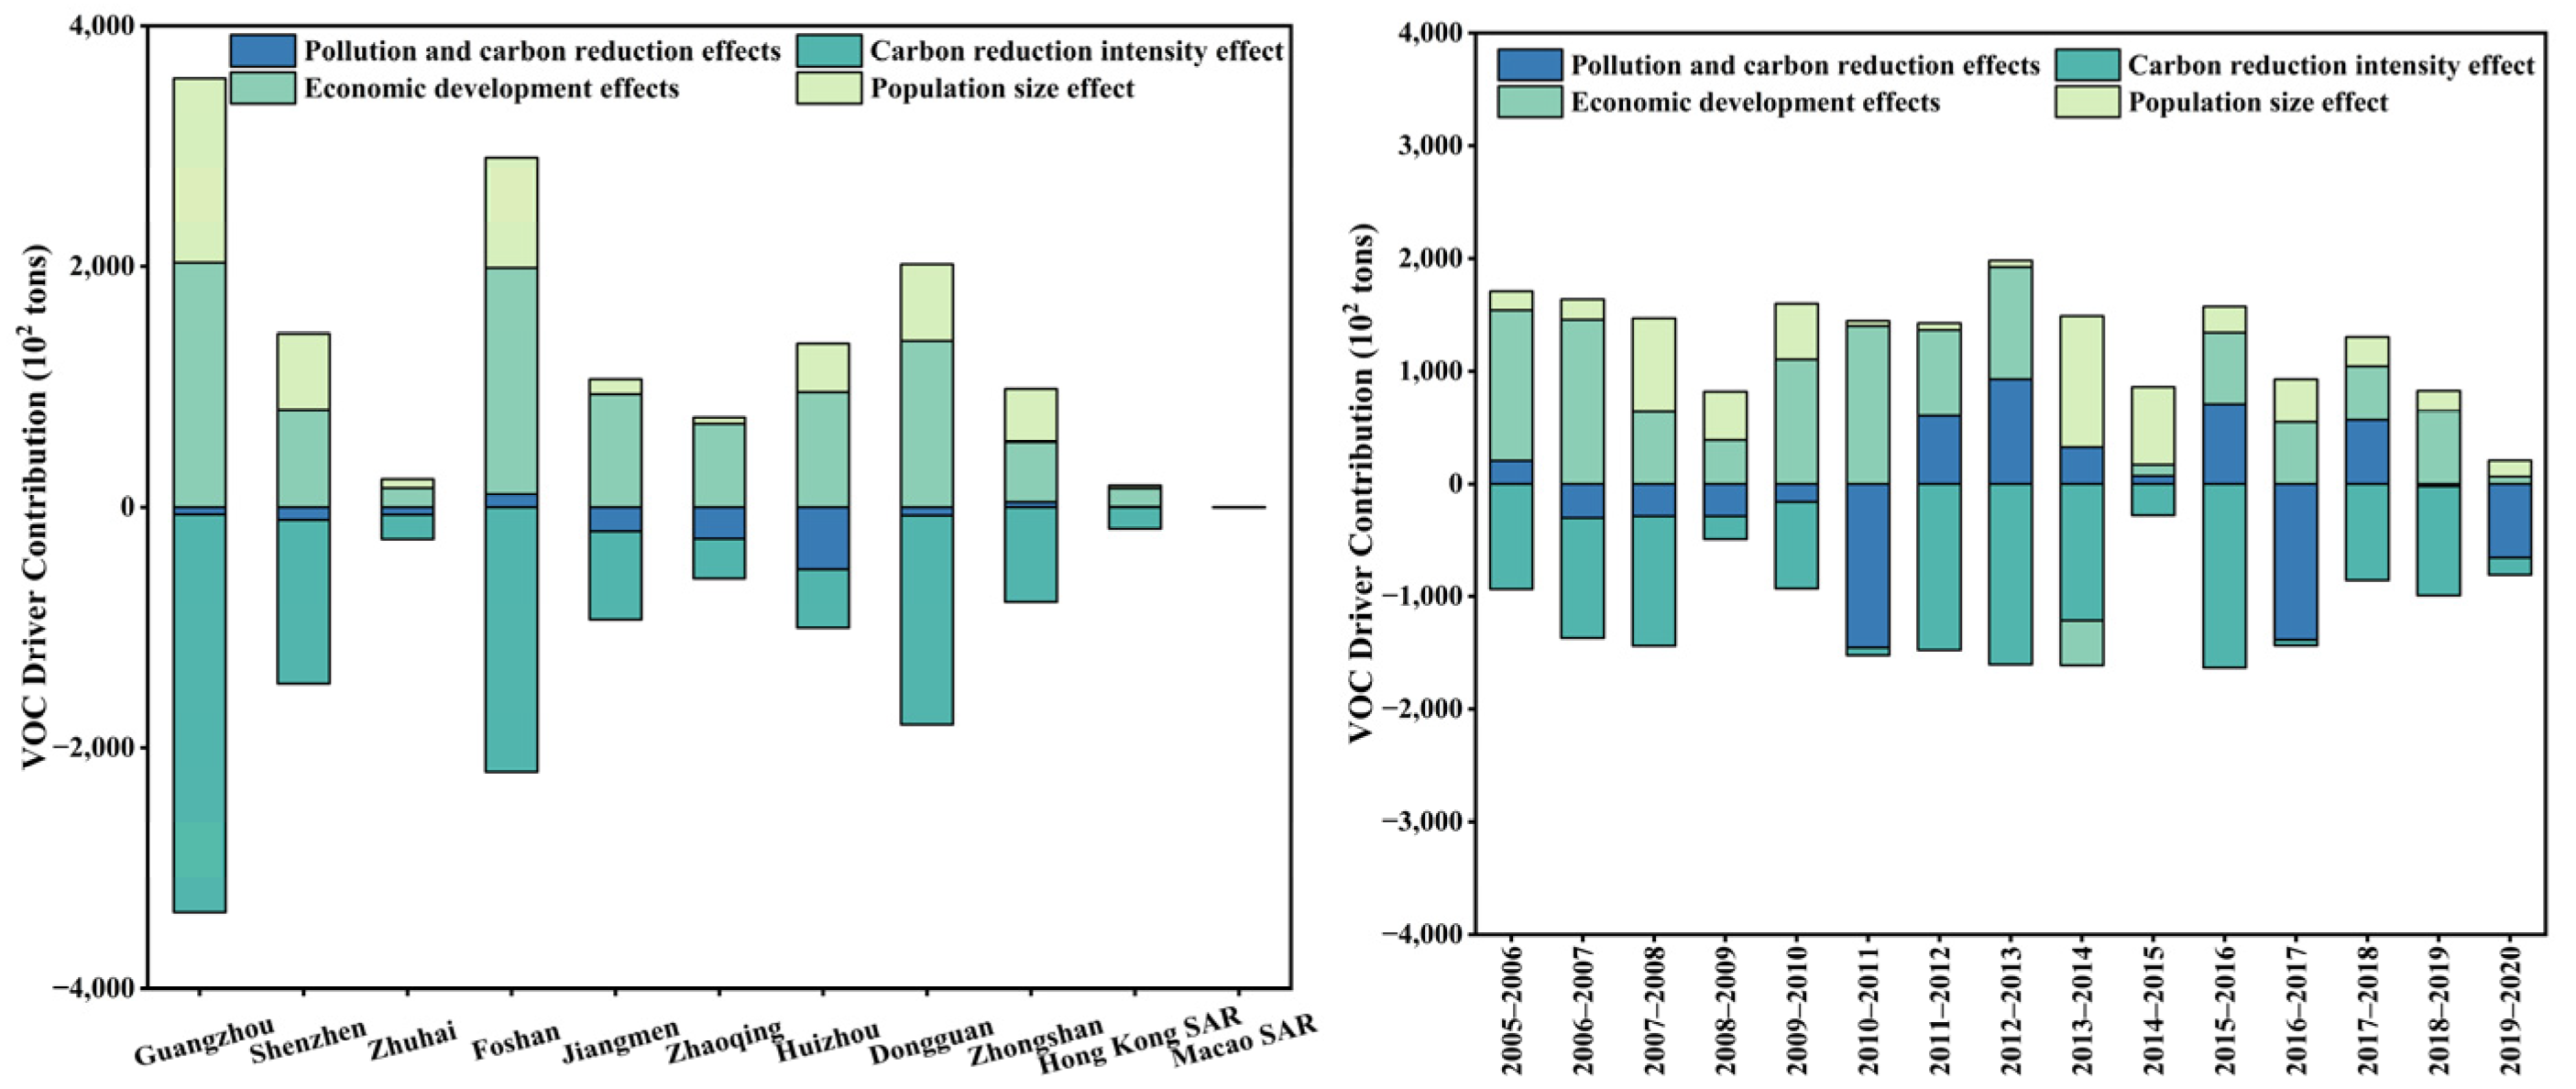
3.3. Analysis of CAP Collaborative Driving Factors

3.3.1. Analysis of the Contribution Level of CR to PR

Based on the calculation results of the CAP synergistic emission reduction effect decomposition model (Figure 14), this study quantified the contribution levels of CO2 reductions to VOC emission reductions.
Our results indicate that the carbon reduction intensity effect exerted a significant positive impact on VOC’ reductions, indicating that reducing carbon emissions can effectively drive down VOC pollution. However, economic development and population size remained the primary driving factors contributing to increased VOC pollution. Regional heterogeneity analysis revealed that carbon reduction intensity had more pronounced pollution reduction contributions in Guangzhou, Foshan, Dongguan, and Shenzhen. From an annual variation perspective, the contribution of carbon reduction to VOC reductions fluctuated between 2005 and 2020. The most significant pollution reduction outcomes occurred during 2012–2013 and 2015–2016, while the pollution reduction effects of carbon reduction were relatively weak during 2010–2011 and 2016–2017.

3.3.2. Analysis of the Contribution Level of PR to CR

Based on the calculation results of the CAP synergistic emission reduction effect decomposition model (Figure 15), this study quantified the contribution levels of VOC reductions to CO2 reductions.
Our results show that the pollution reduction intensity effect exerted a significant positive impact on CO2 reductions, indicating that reducing VOC pollution can effectively drive down CO2 emissions. However, economic development and population size remained the primary driving factors contributing to increased CO2 emissions. Regional heterogeneity analysis revealed that pollution reduction intensity had more pronounced carbon reduction contributions in Guangzhou, Foshan, Dongguan, and Jiangmen. From an annual variation perspective, the contribution of pollution reduction to CO2 reductions remained relatively stable between 2005 and 2020. The most significant carbon reduction outcomes occurred during 2010–2011, coinciding with a phase when carbon reduction’s pollution reduction effects were relatively weak.

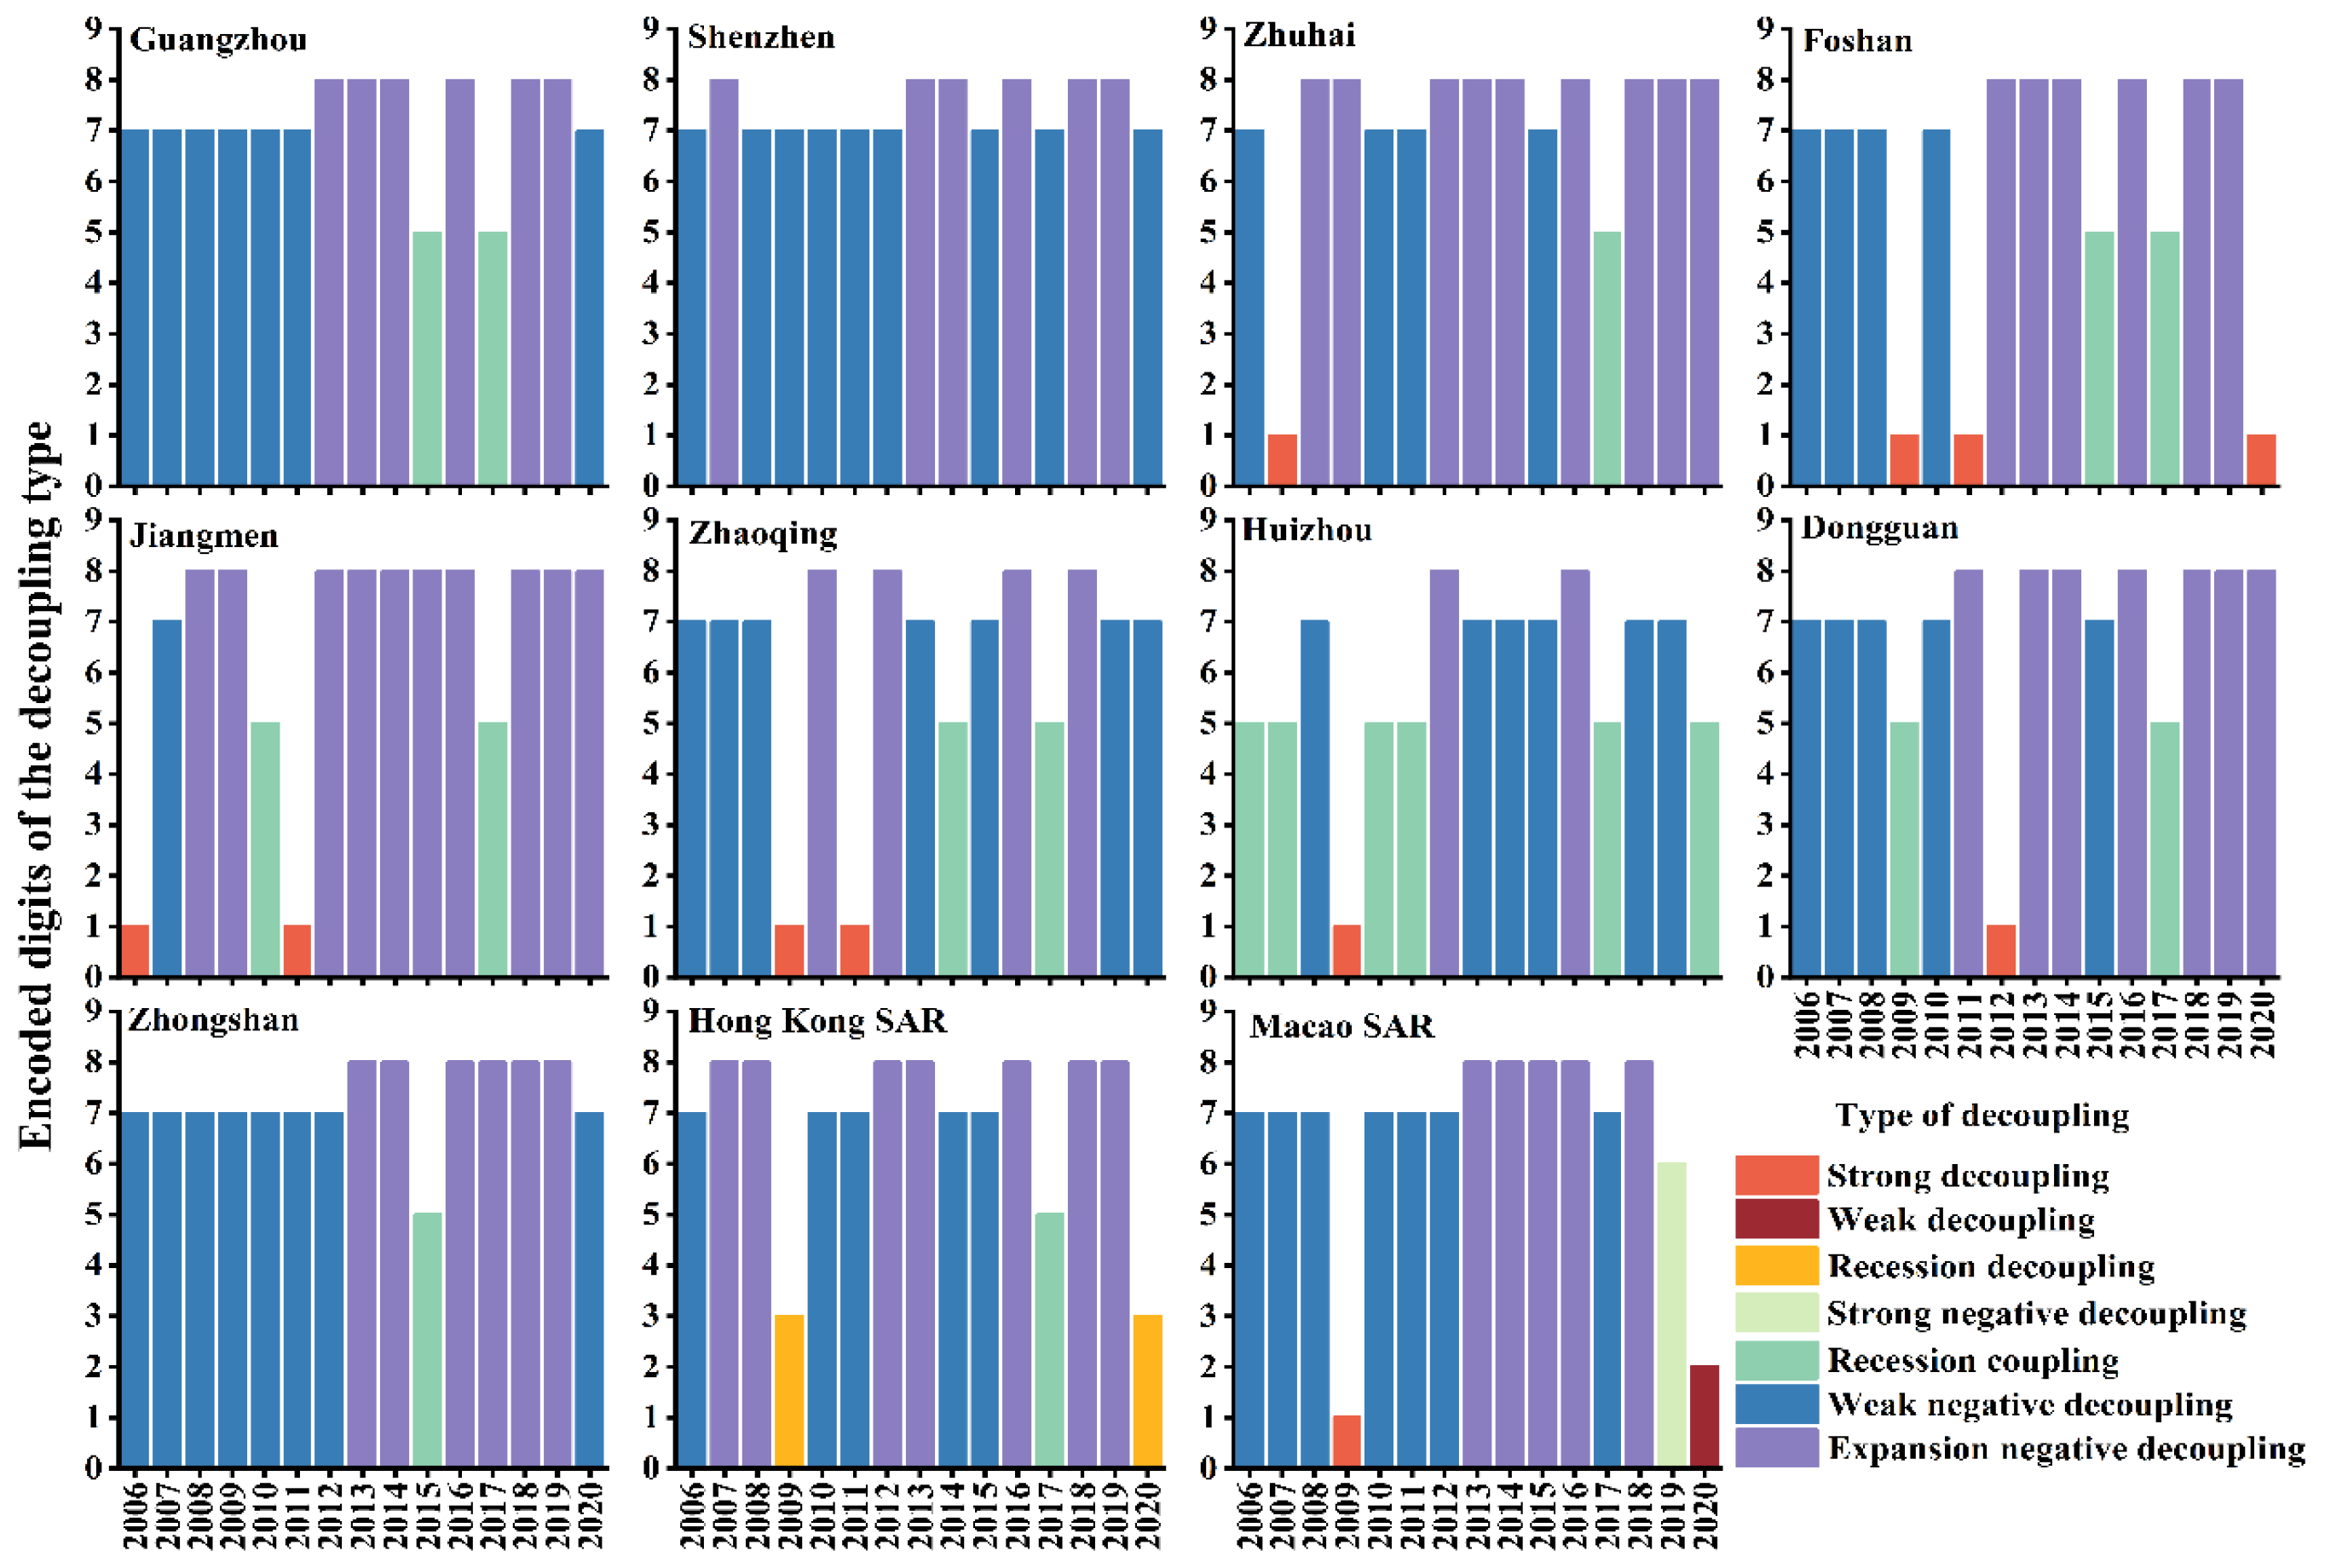
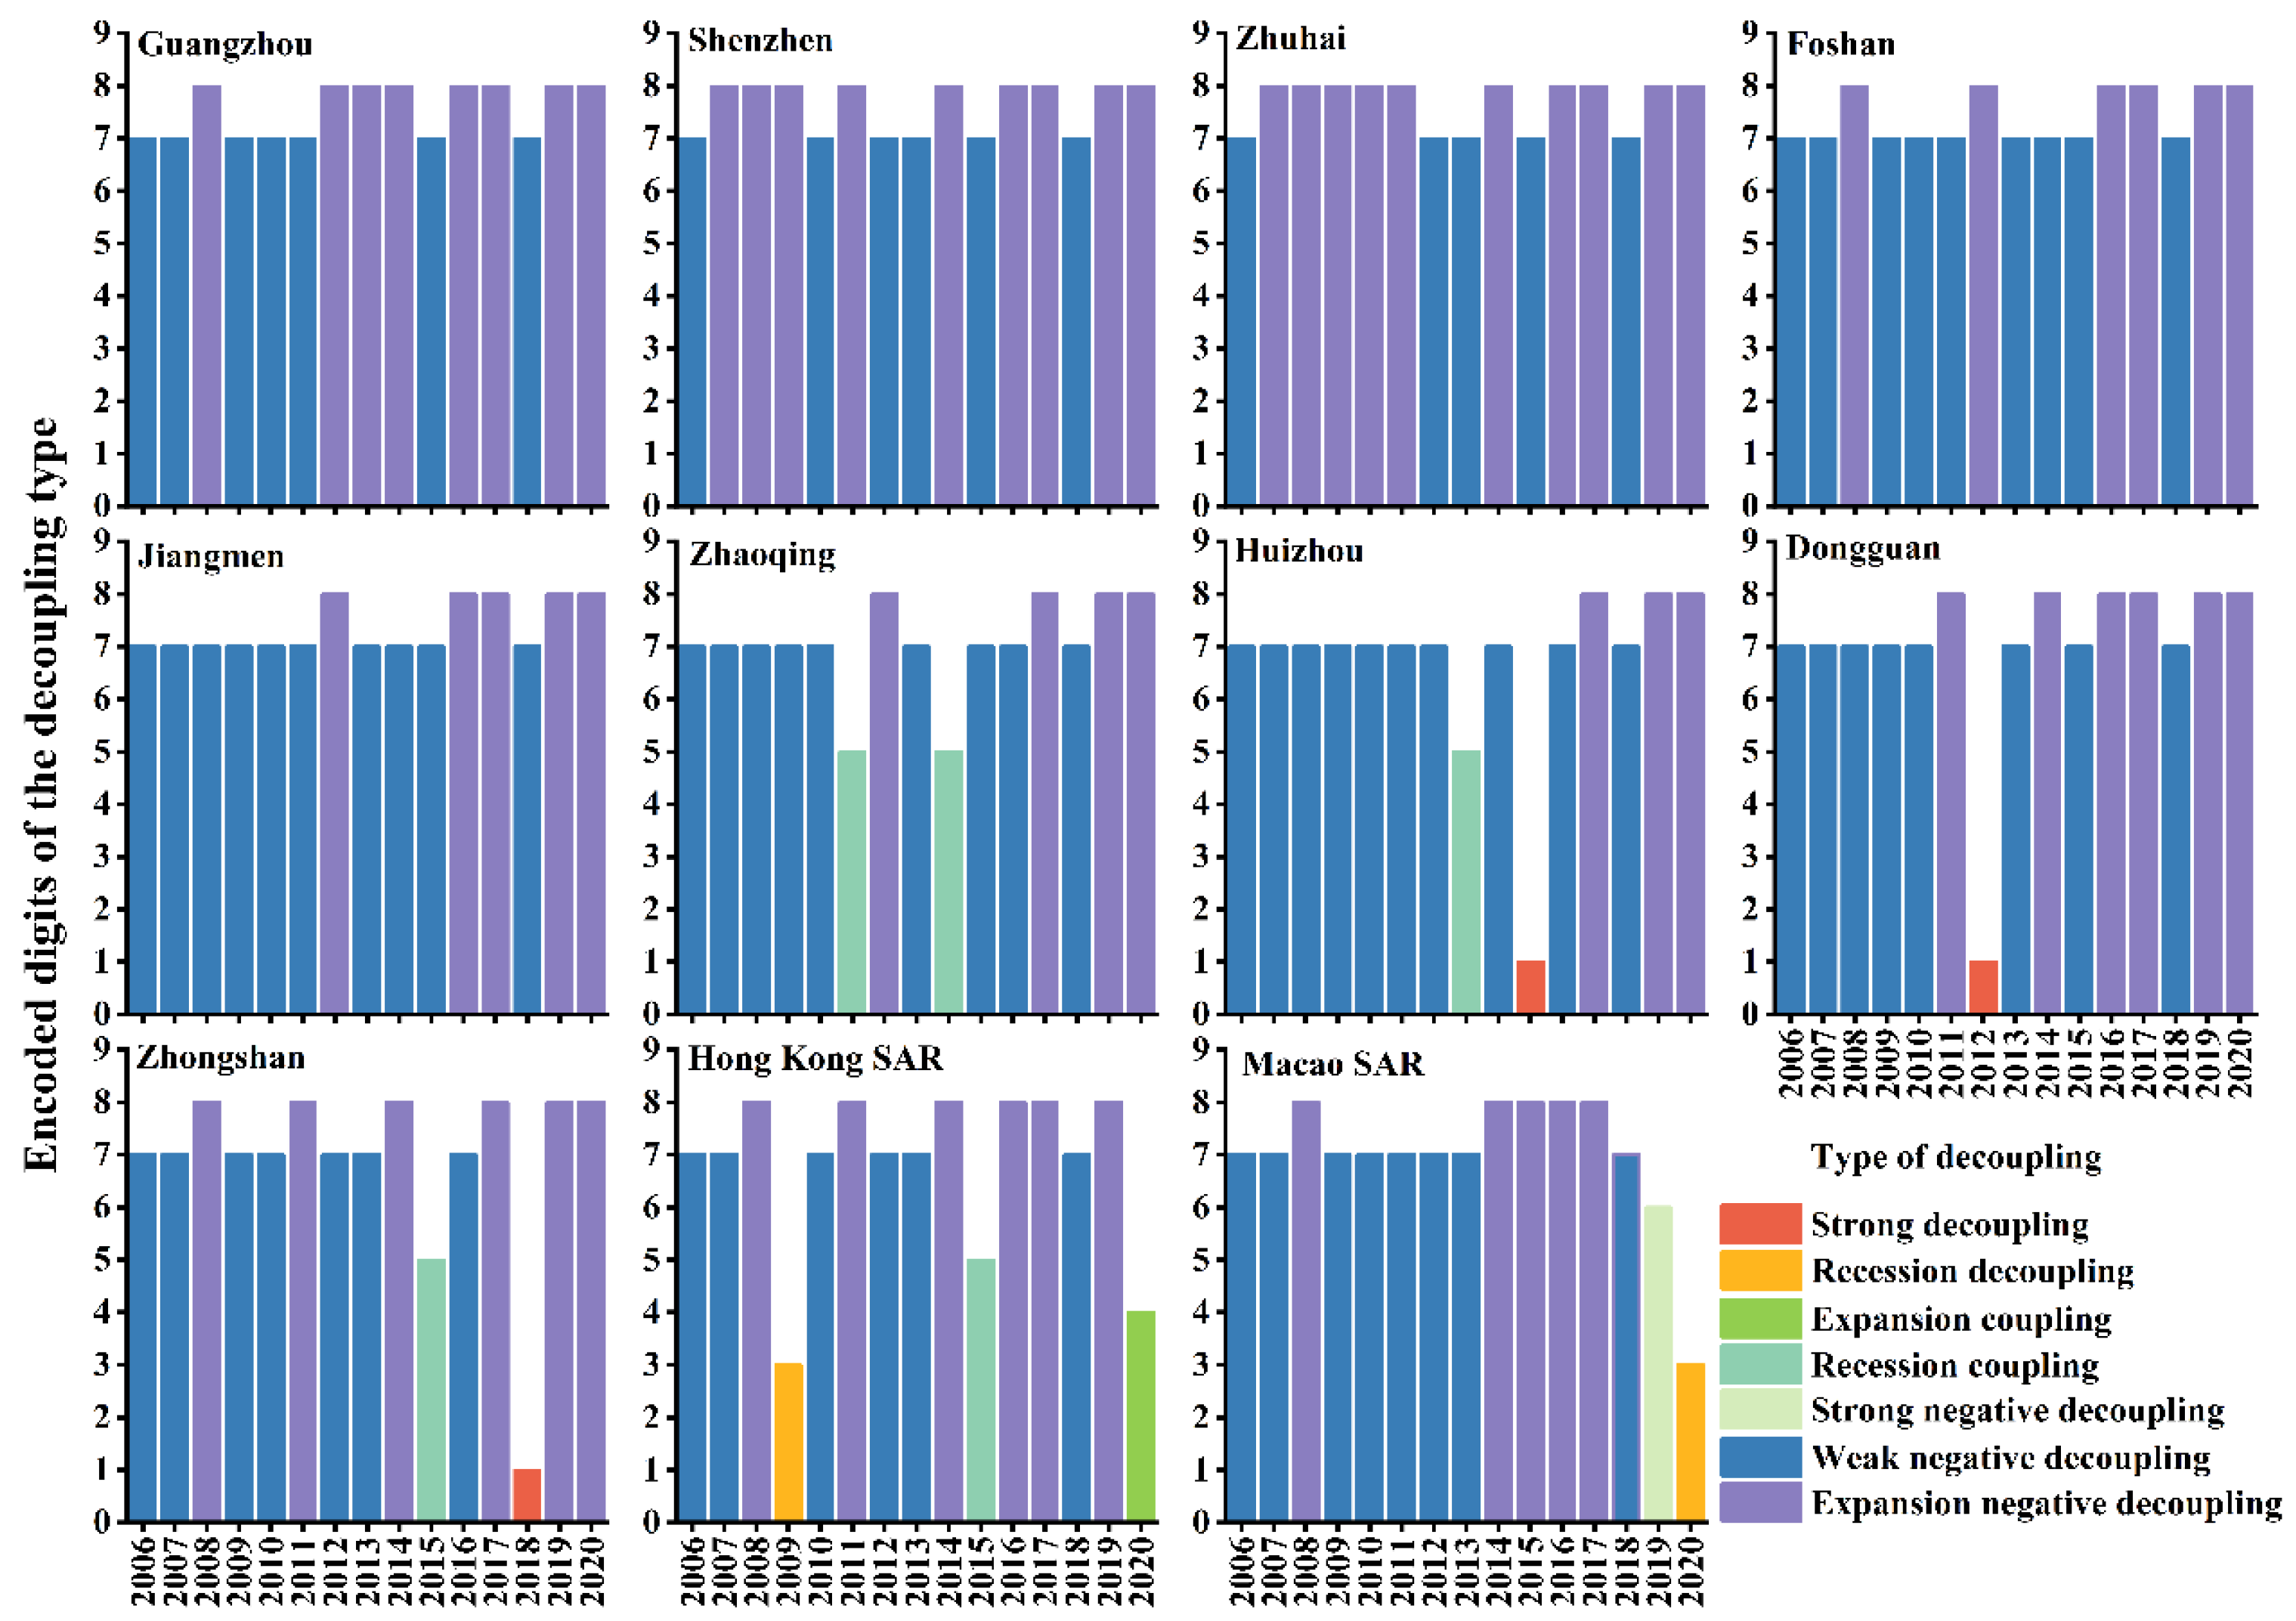
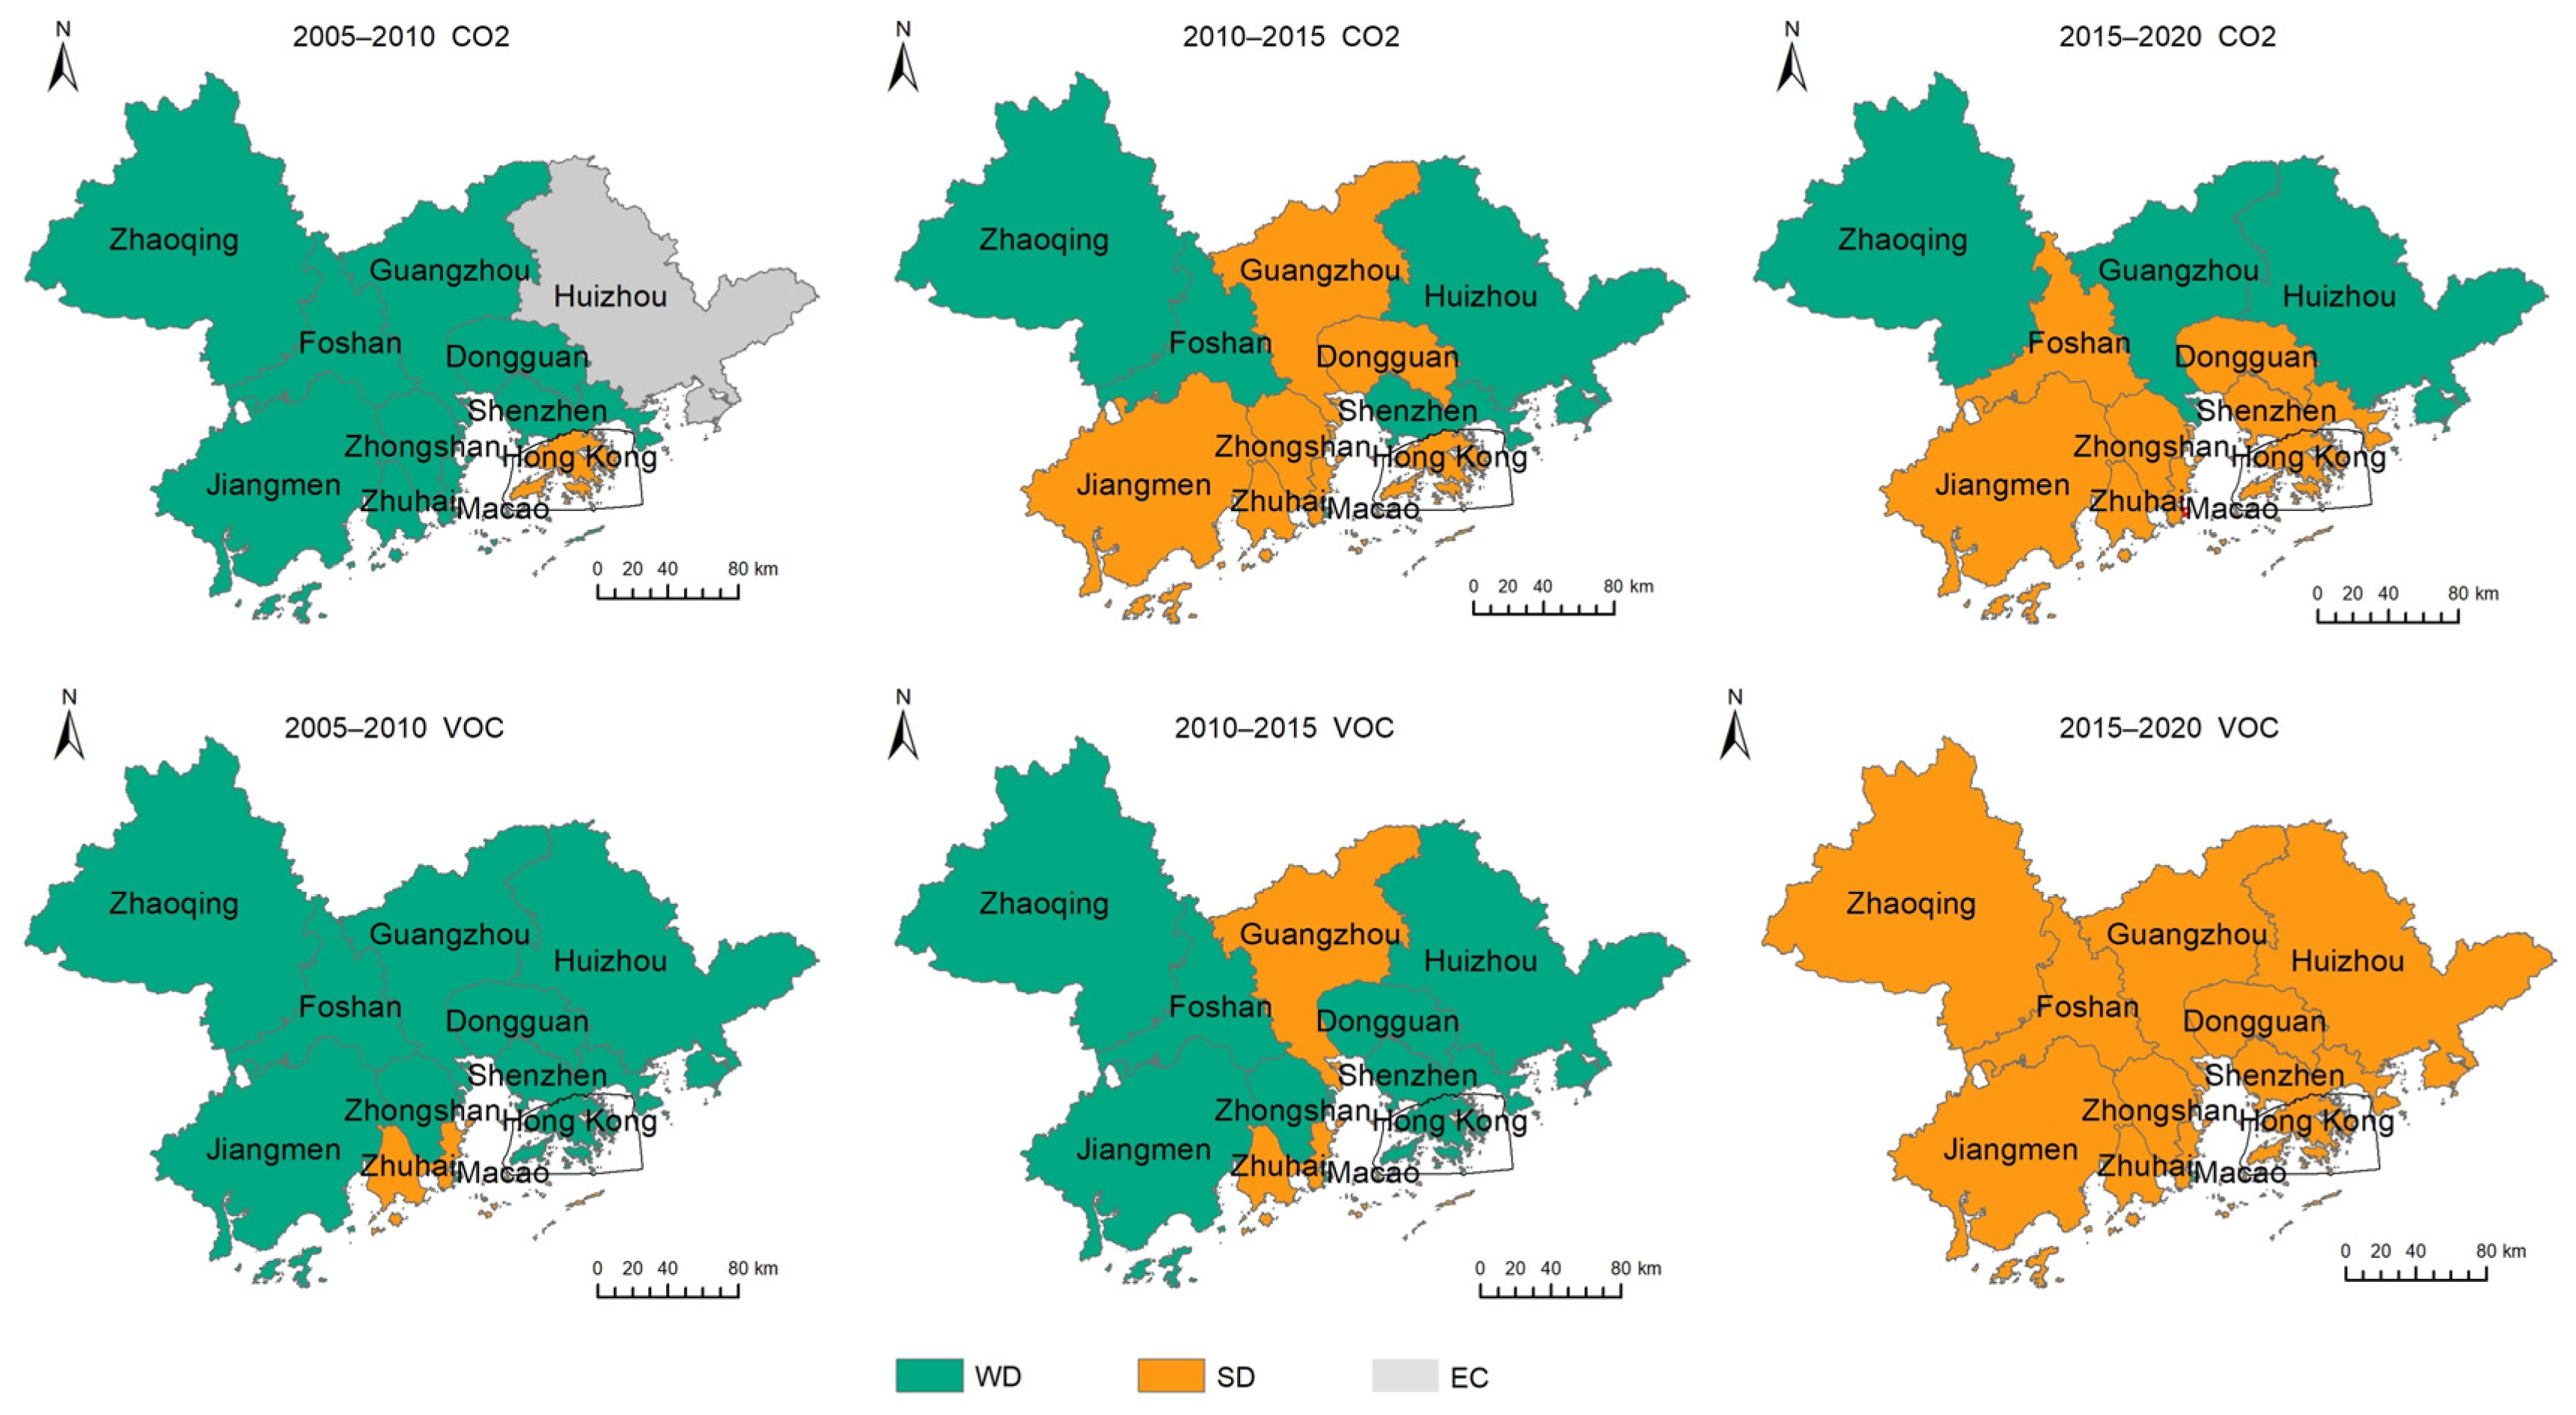
3.4. Decoupling Analysis

To clarify the decoupling status between economic development and CAP emissions during the economic growth process, this study applied the Tapio decoupling model to analyze the decoupling relationships between economic development and CO2 and VOC emissions in the GBA’s 9 + 2 cities from 2005 to 2020 (Figure 16 and Figure 17).
Our results show that over the 15-year period, strong decoupling and weak decoupling between economic development and carbon emissions occurred 11 and 1 times, respectively, in the GBA’s 9 + 2 cities, while only 3 instances of strong decoupling were observed for VOC emissions. This indicates that VOC emissions currently face stronger constraints in decoupling from economic growth compared to carbon emissions.
Figure 18 illustrates the decoupling analysis results between CO2 and VOC emissions and economic growth in the GBA’s 9 + 2 cities during 2005–2010, 2010–2015, and 2015–2020.
The decoupling status of the 9 + 2 cities in the GBA is relatively favorable, with weak decoupling and strong decoupling accounting for a higher proportion—with strong decoupling being the optimal state. Specifically, except for Macao, which experienced a decrease in GDP during 2015–2020, the rest of the regions showed growth in GDP during the study period. During 2005–2010, VOC emissions generally increased, with only Hong Kong showing a negative growth rate in CO2 emission. Guangzhou and Zhuhai showed a negative growth rate in CO2 emissions during 2010–2015. Between 2015 and 2020, VOC emissions generally decreased, while CO2 emissions increased slightly in Guangzhou, Zhaoqing, and Huizhou.

4. Discussion

4.1. The Spatiotemporal Characteristics of CAP in the GBA

Similar to the experiences of most developed countries during early industrialization and urbanization, China’s rapid economic growth has been accompanied by substantial pollution emissions and environmental degradation [2]. Prior to 2011, CO2 emissions and VOC pollution in the GBA showed annual increases. In 2009, Guangdong, Hong Kong, and Macao jointly formulated the Coordinated Development Plan for the Greater Pearl River Delta Urban Agglomeration, aiming to build a world-class city cluster with global competitiveness. In 2010, the Notice on Launching Low-Carbon Province and City Pilot Projects was released, designating Guangdong Province and eight cities, including Shenzhen, as low-carbon pilot areas. During China’s 11th Five-Year Plan (2006–2010), a target of reducing energy consumption per unit of GDP by approximately 20% was set, laying the groundwork for carbon reduction through measures such as restructuring energy-intensive and high-pollution industries and phasing out backward production capacity.
Under this backdrop, the GBA actively responded to emission reduction initiatives, achieving significant progress in CO2 and VOC reductions between 2011 and 2020. Specifically, CO2 emissions peaked in 2011, followed by fluctuating declines from 2012 to 2020. The electricity and industrial sectors demonstrated particularly notable carbon reduction achievements. While transportation and residential CO2 emissions rose overall, they declined in 2020. VOC emissions fluctuated but also decreased in 2020. Industrial VOC emissions, though increasing in earlier years, also dropped in 2020—a change likely influenced by the COVID-19 pandemic [67,68]. China’s strict epidemic control measures, including self-quarantine and transportation restrictions [69], temporarily suppressed industrial production and transportation activities, thereby reducing atmospheric pollutant emissions.

4.2. Sectoral Emission Variance of CAP in the GBA

This study analyzed changes in CO2 and VOC emissions across sectors in the GBA from 2000 to 2020. Results indicate significant disparities in emission trends among industries, likely closely associated with sectoral energy structures, production processes, and policy interventions [65].
Industry is the primary source of both CO2 and VOC emissions in the GBA, making it a key focus for pollution reduction and carbon mitigation, which aligned with those reported in previous studies [70]. Synergistic emission reductions can be achieved through technological innovation and industrial upgrading to build efficient, low-carbon, and circular industrial systems that reduce energy and resource consumption at the source [71]. While the electricity sector contributes minimally to VOC pollution, its CO2 emissions account for over 35% of total emissions [72]. Expanded development and utilization of clean energy, combined with improved energy conversion efficiency, are critical for this sector. Additionally, transportation and residential sectors are significant sources of carbon and air pollutants, underscoring the need for comprehensive governance measures.
Overall, the GBA has achieved notable progress in CO2 and VOC reductions, but it still faces many challenges. There is a need to further strengthen policy guidance and technology research and development, and to formulate more targeted emission reduction strategies for different industries. For the industrial and electric power industries, we should continue to promote the optimization of energy-structure and production-process upgrading, and strengthen the monitoring and treatment of VOC emissions. For the transportation and civil sectors, it is necessary to accelerate the popularization of new energy vehicles, raise residents’ awareness of environmental protection, and promote green travel and lifestyles, so as to achieve the goal of continuous improvement of air quality and sustainable development in the GBA.

4.3. Synergistic Driving Factors and Decoupling Status of CAP in the GBA

Industrial energy intensity, energy intensity, VOC emission intensity, and industrialization level made positive contributions to CO2 and VOC reductions in the GBA, while urban economic development, regional per capita GDP, and population size acted as negative driving factors for emission reductions across the GBA and its cities. Among these, Guangzhou, Foshan, Dongguan, and Huizhou—key carbon-pollution-emitting cities—exhibited larger contributions of economic development to CO2 and VOC emissions. Rapid economic growth and population expansion, such as through large-scale infrastructure construction, industrial production, and household consumption, led to substantial energy consumption and subsequent increases in carbon emissions and air pollution [73].
The significant contribution of VOC reductions to CO2 reductions during 2010–2011 indicates that stringent VOC emission reduction measures have played an important role in driving CO2 reduction. Moving forward, strengthened implementation of VOC reduction policies is essential to ensure their alignment with carbon reduction goals. The relatively stable contributions of VOC reductions to CO2 reductions in other years demonstrate the sustained effectiveness of pollution control measures in promoting CO2 reductions. Future efforts should focus on optimizing pollution reduction measures—such as promoting clean production technologies and low-VOC raw material substitutions—to enhance their leveraging effect on CO2 reductions. Overall, a synergistic relationship exists between CAP reduction in the GBA. Notably, Guangzhou, Foshan, and Dongguan, as key CO2 and VOC emitters in the GBA, achieved the most significant synergistic emission reduction outcomes, though economic development and population size remain primary barriers to integrated emission reductions.
Additionally, the GBA has generally achieved relative or absolute decoupling between economic growth and CAP emissions, reflecting the effectiveness of energy efficiency improvements, clean energy adoption, and end-of-pipe pollution control measures. However, some cities still face expansive coupling or expansive negative decoupling between economic growth and emissions, indicating that their economic growth models require further optimization to achieve more efficient green and low-carbon development.

4.4. Limitation

This study has several limitations. In terms of data timeliness, the CO2 emission data in the MEIC database had been updated up to 2021, whereas the VOC emission data only cover up to 2020. Given the synergistic effect of CO2 and VOCs, it is essential to maintain consistency in the statistical caliber of the data. Consequently, the data source for this study spans from 2005 to 2020, and we will continue to monitor and update the data in a timely manner. Although the contribution of PR to CR was quantified based on the decomposition model of CAP synergistic emission reduction effects, some factors (intensity of industrial pollution control, etc.) could not be included in the analysis due to the lack of data on pollutant charging and sewage charges for specific industries in Hong Kong and Macao. Future research could improve analytical precision through field monitoring and multi-model comparisons to address these uncertainties. Additionally, this study did not fully account for the specific implementation effects of policies. Future research could expand the framework of drivers of synergistic emission reduction to comprehensively examine the influencing factors and their synergistic effects of synergistic emission reduction of CAP in urban agglomerations. Additionally, considering policies as a carrier of energy socioeconomic factors, the impacts of policies on energy production, consumption, and socioeconomic development can be assessed in depth by quantifying the effects of policies and their implementation.

5. Conclusions and Policy Proposal

This study analyzed the spatiotemporal distribution characteristics, urban and sectoral evolution patterns, emission reduction driving factors, synergistic effects, and decoupling status of CO2 and VOCs in the GBA’s 9 + 2 cities from 2000 to 2020. CO2 and VOC emissions in the GBA exhibited significant spatiotemporal disparities. The nine Pearl River Delta cities served as the primary emission sources within the GBA, with Guangzhou, Foshan, and Dongguan consistently recording higher total emissions than other cities. The spatial distribution of carbon-pollutant emissions demonstrated a clustered pattern, with the CO2 emission centroid shifting northeastward from Southern Guangzhou, while the VOC emission centroid migrated westward from the Guangzhou–Dongguan border into the interior of Guangzhou. Second, the industrial sector constituted the dominant driving factor in both CO2 and VOC emissions in the GBA. Reducing both energy intensity and industrial energy intensity emerged as critical a pathway for achieving emission reductions. Notably, Guangzhou and Shenzhen require particular attention to the impacts of energy intensity and industrial energy intensity on carbon emissions, though their effects on VOC emissions were relatively minor. Against the backdrop of rapid urban agglomeration development, economic growth exerted a significant driving effect on CO2 and VOC emissions, particularly in Guangzhou, Foshan, Dongguan, Huizhou, and Zhongshan, where urban economic expansion is more prone to emission increases. Finally, the GBA’s 9 + 2 cities generally achieved a favorable decoupling status between economic development and emissions, reflecting sustainable development trends in the region. However, some cities still face expansive coupling or expansive negative decoupling between economic growth and emissions, underscoring the necessity for further optimization of their economic growth models.
The main policy proposals for achieving synergistic CO2 and VOC reductions are as follows:
(1)
Address the negative driving effects of economic development and population size on emissions by promoting decoupling between economic growth and CO2/VOC emissions. Specific measures include optimizing industrial structure, developing green industries, promoting low-carbon technologies, and strengthening end-management measures.
(2)
Leverage successful pollution and carbon reduction experiences from Guangzhou, Foshan, Dongguan, and Jiangmen for replication in other cities. Enhance regional collaborative governance to achieve holistic improvements in environmental quality.
(3)
Expand clean energy adoption, optimize industrial structures, and improve energy efficiency to realize win-win outcomes between economic growth and environmental quality improvement.

Author Contributions

S.H., writing—original draft, visualization, methodology, formal analysis, data curation, and conceptualization; Y.J., writing—review and editing, validation, software, and data curation; Q.L., writing—review and editing, software, and data curation; L.S., writing—review and editing, supervision, project administration, and funding acquisition; L.G., writing—review and editing, supervision, project administration, and funding acquisition. All authors have read and agreed to the published version of the manuscript.

Funding

This research was funded by the National Key Research and Development Program (2022YFF1301201).

Institutional Review Board Statement

Not applicable.

Informed Consent Statement

Not applicable.

Data Availability Statement

Publicly available datasets were analyzed in this study. This data can be found here: http://meicmodel.org.cn//ljgao@iue.ac.cn.

Acknowledgments

The authors thank the MEIC team at Tsinghua University for providing the base emission data.

Conflicts of Interest

The authors declare that they have no known competing financial interests or personal relationships that could have appeared to influence the work reported in this paper.

References

  1. Lin, J.T.; Nielsen, C.P.; Zhao, Y.; Lei, Y.; Liu, Y.; Mcelroy, M.B. Recent Changes in Particulate Air Pollution over China Observed from Space and the Ground: Effectiveness of Emission Control. Environ. Sci. Technol. 2010, 44, 7771–7776. [Google Scholar] [CrossRef]
  2. Guan, D.B.; Liu, Z.; Geng, Y.; Lindner, S.; Hubacek, K. The gigatonne gap in China’s carbon dioxide inventories. Nat. Clim. Change 2012, 2, 672–675. [Google Scholar] [CrossRef]
  3. Zhang, C.Y.; Yu, B.Y.; Chen, J.M.; Wei, Y.M. Green transition pathways for cement industry in China. Resour. Conserv. Recycl. 2021, 166, 105355. [Google Scholar] [CrossRef]
  4. Li, K.; Jacob, D.J.; Liao, H.; Shen, L.; Zhang, Q.; Bates, K.H. Anthropogenic drivers of 2013-2017 trends in summer surface ozone in China. Proc. Natl. Acad. Sci. USA 2019, 116, 422–427. [Google Scholar] [CrossRef] [PubMed]
  5. SCC (State Council of China). Action Plan for Sustained Improvement of Air Quality (State Council of China). 2023. Available online: https://www.gov.cn/zhengce/content/202312/content_6919000.htm (accessed on 7 December 2023).
  6. Wang, T.; Xue, L.; Brimblecombe, P.; Lam, Y.F.; Li, L.; Zhang, L. Ozone pollution in China: A review of concentrations, meteorological influences, chemical precursors, and effects. Sci. Total Environ. 2017, 575, 1582–1596. [Google Scholar] [CrossRef] [PubMed]
  7. Li, R.R.; Wang, Q.; Liu, Y.; Jiang, R. Per-capita carbon emissions in 147 countries: The effect of economic, energy, social, and trade structural changes. Sustain. Prod. Consump. 2021, 27, 1149–1164. [Google Scholar] [CrossRef]
  8. Fu, J.Y.; Yuan, Z.L. Effect evaluation and expansion mechanism analysis of synergistic emission reduction in China’s power industry. China Ind. Econ. 2017, 2, 17. (In Chinese) [Google Scholar]
  9. Liu, D.; Cheng, R.K.; Li, X.R.; Zhao, M.M. On the driving factors of China’s provincial carbon emission from the view of periods and groups. Environ. Sci. Pollut. 2021, 28, 51971–51988. [Google Scholar] [CrossRef]
  10. Zhang, G.X.; Gao, Y.; Li, J.X.; Su, B.; Chen, Z.L.; Lin, W.C. China’s environmental policy intensity for 1978–2019. Sci. Data 2022, 9, 181. [Google Scholar] [CrossRef]
  11. Chen, S.Y.; Tan, Z.X.; Mu, S.Y.; Wang, J.Y.; Chen, Y.Y.; He, X.W. Synergy level of pollution and carbon reduction in the Yangtze River Economic Belt: Spatial-temporal evolution characteristics and driving factors. Sustain. Cities Soc. 2023, 98, 104859. [Google Scholar] [CrossRef]
  12. Zeng, Q.H.; He, L.Y. Study on the synergistic effect of air pollution prevention and carbon emission reduction in the context of “dual carbon”: Evidence from China’s transport sector. Energy Policy 2023, 173, 113370. [Google Scholar] [CrossRef]
  13. Cui, L.Z.; Sun, W. Synergistic impacts of clean energy demonstration policy on air pollution and carbon reduction. Sustainability 2014, 16, 9928. [Google Scholar] [CrossRef]
  14. Xu, M.L.; Li, H.M.; Deng, X.H. Measuring the Synergistic Effect of Pollution and Carbon Reduction in China’s Industrial Sector. Sustainability 2024, 16, 1048. [Google Scholar] [CrossRef]
  15. Zhang, X.P.; Wei, Y.J.; Wang, T.Y.; Shen, J.L.; Zhao, T.; Dong, L. Spatial correlation network on synergy between carbon reduction and pollution control in key areas for air pollution prevent and control. J. Clean. Prod. 2025, 491, 144777. [Google Scholar] [CrossRef]
  16. Li, Y.F.; Li, Y.; Zhou, Y.; Shi, Y.L.; Zhu, X.D. Investigation of a coupling model of coordination between urbanization and the environment. J. Environ. Manag. 2012, 98, 127–133. [Google Scholar] [CrossRef] [PubMed]
  17. Wu, Y.N.; Liao, M.J.; Hu, M.Y.; Xu, C.B.; Tao, Y.; Zhou, J.L. Effectiveness assessment of air pollution prevention and control under collaborative supervision in the Beijing-Tianjin-Hebei region based on combination weights and grey fuzzy synthetic evaluation analysis. Sustain. Cities Soc. 2021, 64, 102543. [Google Scholar] [CrossRef]
  18. Guan, Y.; Xiao, Y.; Rong, B.; Kang, L.; Zhang, N.N.; Chu, C.J. Heterogeneity and typology of the city-level synergy between CO2 emission, PM2.5, and ozone pollution in China. J. Clean. Prod. 2023, 405, 136871. [Google Scholar] [CrossRef]
  19. Xue, W.B.; Lei, Y.; Liu, X.; Shi, X.R.; Liu, Z.Y.; Xu, Y.L.; Chen, X.J.; Song, X.H.; Zheng, Y.X.; Zhang, Y.; et al. Synergistic assessment of air pollution and carbon emissions from the economic perspective in China. Sci. Total Environ. 2023, 858, 159736. [Google Scholar] [CrossRef]
  20. Wang, M.; Yang, R.P.; Li, L.P. Research on construction and application of evaluation index system of synergistic degree of urban pollution reduction and carbon reduction. Adv. Clim. Change Res. 2024, 20, 242–252. (In Chinese) [Google Scholar]
  21. Yi, H.R.; Zhao, L.J.; Qian, Y.; Zhou, L.X.; Yang, P.L. How to achieve synergy between carbon dioxide mitigation and air pollution control? Evidence from China. Sustain. Cities Soc. 2022, 78, 103609. [Google Scholar] [CrossRef]
  22. Wei, Z.Y.; Li, J.M.; Wang, Z.Y.; Zhou, A.Q.; Li, M.H. County carbon emissions in the Yangtze River Delta region: Spatial layout, dynamic evolution and spatial spillover effects. Front. Environ. Sci. 2022, 10, 977198. [Google Scholar] [CrossRef]
  23. Jin, Y.Z.; Zhang, K.R.; Li, D.Y.; Wang, S.Y.; Liu, W.Y. Analysis of the spatial-temporal evolution and driving factors of carbon emission efficiency in the Yangtze River economic Belt. Ecol. Indic. 2024, 165, 112092. [Google Scholar] [CrossRef]
  24. Xia, X.C.; Sun, H.; Yang, Z.D.; Zhu, S.S. Evaluation on evolution of spatial relationship between carbon emissions and economic growth in Beijing-Tianjin-Hebei region. Environ. Sci. Pollut. 2024, 31, 8453–8466. [Google Scholar] [CrossRef]
  25. Wang, J.; Li, Z.M.; Wu, T.; Wu, S.Y.; Yin, T.W. The decoupling analysis of CO2 emissions from power generation in Chinese provincial power sector. Energy 2022, 255, 124488. [Google Scholar] [CrossRef]
  26. Liu, C.J.; Lyu, W.; Zang, X.H.; Zheng, F.; Zhao, W.C.; Xu, Q.; Lu, J.Y. Exploring the factors effecting on carbon emissions in each province in China: A comprehensive study based on symbolic regression, LMDI and Tapio models. Environ. Sci. Pollut. 2023, 30, 87071–87086. [Google Scholar] [CrossRef]
  27. Li, W.; Sun, S. Air pollution driving factors analysis: Evidence from economically developed area in China. Environ. Prog. Sustain. 2016, 35, 1231–1239. [Google Scholar] [CrossRef]
  28. Ma, Y.R.; Ji, Q.; Fan, Y. Spatial linkage analysis of the impact of regional economic activities on PM2.5 pollution in China. J. Clean. Prod. 2016, 139, 1157–1167. [Google Scholar] [CrossRef]
  29. Khan, H.; Liu, W.; Khan, I.; Zhang, J.F. The nexus between natural resources, renewable energy consumption, economic growth, and carbon dioxide emission in BRI countries. Environ. Sci. Pollut. 2023, 30, 36692–36709. [Google Scholar] [CrossRef]
  30. Lin, B.Q.; Agyeman, S.D. Assessing Sub-Saharan Africa’s low carbon development through the dynamics of energy-related carbon dioxide emissions. J. Clean. Prod. 2020, 274, 122676. [Google Scholar] [CrossRef]
  31. Huang, Y.Z.; Matsumoto, K. Drivers of the change in carbon dioxide emissions under the progress of urbanization in 30 provinces in China: A decomposition analysis. J. Clean. Prod. 2021, 322, 129000. [Google Scholar] [CrossRef]
  32. Duan, C.C.; Zhu, W.J.; Wang, S.G.; Chen, B. Drivers of global carbon emissions 1990–2014. J. Clean. Prod. 2022, 371, 133371. [Google Scholar] [CrossRef]
  33. An, M.; Fan, M.; Xie, P. Synergistic relationship and interact driving factors of pollution and carbon reduction in the Yangtze River Delta urban agglomeration, China. Environ. Sci. Pollut. 2023, 30, 118677–118692. [Google Scholar] [CrossRef]
  34. Li, Z.R.; Song, Y.; Zhou, A.N.; Liu, J.; Pang, J.R.; Zhang, M. Study on the pollution emission efficiency of China’s provincial regions: The perspective of Environmental Kuznets curve. J. Clean. Prod. 2020, 263, 121497. [Google Scholar] [CrossRef]
  35. Xu, F.J.; Huang, Q.X.; Yue, H.B.; He, C.Y.; Wang, C.B.; Zhang, H. Reexamining the relationship between urbanization and pollutant emissions in China based on the STIRPAT model. J. Environ. Manag. 2020, 273, 111134. [Google Scholar] [CrossRef]
  36. Yang, J.; Miao, Y.M.; Li, Y.F.; Li, Y.W.; Ma, X.X.; Xu, S.C.; Wang, S.X. Decomposition Analysis of Factors that Drive the Changes of Major Air Pollutant Emissions in China at a Multi-Regional Level. Sustainability 2020, 11, 7713. [Google Scholar] [CrossRef]
  37. Song, C.; Zhao, T.; Wang, J. Analyzing driving forces of China’s carbon emissions from 1997 to 2040 and the potential emission reduction path: Through decomposition and scenario analysis. Clean Technol. Environ. Policy 2022, 24, 1219–1240. [Google Scholar] [CrossRef]
  38. Guo, S.; Liu, G.L.; Liu, S.X. Driving factors of NOx emission reduction in China’s power industry: Based on LMDI decomposition model. Environ. Sci. Pollut. 2023, 30, 51042–51060. [Google Scholar] [CrossRef]
  39. He, G.Y.; Jiang, W.; Gao, W.D.; Lu, C. Unveiling the Spatial-Temporal Characteristics and Driving Factors of Greenhouse Gases and Atmospheric Pollutants Emissions of Energy Consumption in Shandong Province, China. Sustainability 2024, 16, 1304. [Google Scholar] [CrossRef]
  40. Dong, K.Y.; Hochman, G.; Timilsina, G.R. Do drivers of CO2 emission growth alter overtime and by the stage of economic development? Energy Policy 2020, 140, 111420. [Google Scholar] [CrossRef]
  41. Huang, Y.M.; Wang, Y.; Peng, J.T.; Li, F.; Zhu, L.; Zhao, H.H.; Shi, R. Can China achieve its 2030 and 2060 CO2 commitments? Scenario analysis based on the integration of LEAP model with LMDI decomposition. Sci. Total Environ. 2023, 888, 164151. [Google Scholar] [CrossRef]
  42. Mousavi, B.; Lopez, N.S.A.; Biona, J.B.M.; Chiu, A.S.F.; Blesl, M. Driving forces of Iran’s CO2 emissions from energy consumption: An LMDI decomposition approach. Appl. Energy 2017, 206, 804–814. [Google Scholar] [CrossRef]
  43. Goh, T.; Ang, B.W.; Su, B.; Wang, H. Drivers of stagnating global carbon intensity of electricity and the way forward. Energy Policy 2018, 113, 149–156. [Google Scholar] [CrossRef]
  44. Wang, Z.J.; Lv, D.H. Analysis of Agricultural CO2 Emissions in Henan Province, China, Based on EKC and Decoupling. Sustainability 2022, 14, 1931. [Google Scholar] [CrossRef]
  45. Wang, X.G.; Yan, F.Q.; Su, F.Z. Impacts of urbanization on the ecosystem services in the Guangdong-Hong Kong-Macao greater bay area, China. Remote Sens. 2020, 12, 3269. [Google Scholar] [CrossRef]
  46. Wang, S.Y.; Pan, M.X.; Wu, X.L. Sustainable development in the export trade from a symbiotic perspective on carbon emissions, exemplified by the case of Guangdong, China. Sustainability 2023, 15, 9667. [Google Scholar] [CrossRef]
  47. Zhou, Y.; Li, K.J.; Liang, S.; Zeng, X.L.; Cai, Y.P.; Meng, J.; Shan, Y.L.; Guan, D.B.; Yang, Z.F. Trends, Drivers, and Mitigation of CO2 Emissions in the Guangdong-Hong Kong-Macao Greater Bay Area. Engineering 2023, 23, 138–148. [Google Scholar] [CrossRef]
  48. Guangdong Provincial Eco-Environmental Monitoring Center. Guangdong-Hong Kong-Macao Pearl River Delta Regional Air Monitoring Network 2022 Monitoring Results Report [R/OL]. Available online: https://gdee.gd.gov.cn/attachment/0/528/528233/4199318.pdf (accessed on 7 April 2023).
  49. Tobler, W. On the first law of geography: A reply. Ann. Am. Assoc. Geogr. 2004, 94, 304–310. [Google Scholar] [CrossRef]
  50. Anselin, L. Local indicators of spatial association-LISA. Geogr. Anal. 1995, 27, 93–115. [Google Scholar] [CrossRef]
  51. Shen, T.; Zhou, W.S.Q.; Yuan, S.; Huo, L. Spatiotemporal Characterization of the Three-Dimensional Morphology of Urban Buildings Based on Moran’s I. Sustainability 2024, 16, 6540. [Google Scholar] [CrossRef]
  52. Lefever, D.W. Measuring geographic concentration by means of the standard deviational ellipse. Am. J. Sociol. 1926, 32, 88–94. [Google Scholar] [CrossRef]
  53. Zhao, Z.W.; Zhao, Z.Q.; Zhang, P. A new method for identifying industrial clustering using the standard deviational ellipse. Sci. Rep. 2023, 13, 578. [Google Scholar] [CrossRef]
  54. Chen, J.D.; Wang, P.; Cui, L.B.; Huang, S.; Song, M.L. Decomposition and decoupling analysis of CO2 emissions in OECD. Appl. Energy 2018, 231, 937–950. [Google Scholar] [CrossRef]
  55. Kaya, Y. Impact of Carbon Dioxide Emission Control on GNP Growth: Interpretation of Proposed Scenarios; IPCC Energy and Industry Subgroup: Paris, France, 1989. [Google Scholar]
  56. To, W.M.; Lai, T.M.; Lo, W.C.; Lam, K.H.; Chung, W.L. The growth pattern and fuel life cycle analysis of the electricity consumption of Hong Kong. Environ. Pollut. 2012, 165, 1–10. [Google Scholar] [CrossRef] [PubMed]
  57. Dong, L.; Liang, H.W. Spatial analysis on China’s regional air pollutants and CO2 emissions: Emission pattern and regional disparity. Atmos. Environ. 2014, 92, 280–291. [Google Scholar] [CrossRef]
  58. Li, J.; Hou, L.P.; Wang, L.; Tang, L.N. Decoupling Analysis between Economic Growth and Air Pollution in Key Regions of Air Pollution Control in China. Sustainability 2021, 13, 6600. [Google Scholar] [CrossRef]
  59. Li, R.R.; Li, L.J.; Wang, Q. The impact of energy efficiency on carbon emissions: Evidence from the transportation sector in Chinese 30 provinces. Sustain. Cities. Soc. 2022, 82, 103880. [Google Scholar] [CrossRef]
  60. Duman, Z.; Mao, X.Q.; Cai, B.F.; Zhang, Q.Y.; Chen, Y.P.; Gao, Y.B.; Guo, Z. Exploring the spatiotemporal pattern evolution of carbon emissions and air pollution in Chinese cities. J. Environ. Manag. 2023, 345, 118870. [Google Scholar] [CrossRef]
  61. Liu, B.; Lv, J.H. Spatiotemporal Evolution and Tapio Decoupling Analysis of Energy-Related Carbon Emissions Using Nighttime Light Data: A Quantitative Case Study at the City Scale in Northeast China. Energies 2024, 17, 4795. [Google Scholar] [CrossRef]
  62. Su, C.; Zha, X.X.; Ma, J.Y.; Li, B.Y.; Wang, X.P. Dynamic Optimal Control Strategy of CCUS Technology Innovation in Coal Power Stations Under Environmental Protection Tax. Systems 2025, 13, 193. [Google Scholar] [CrossRef]
  63. Wu, Y.; Tam, V.W.Y.; Shuai, C.Y.; Shen, L.Y.; Zhang, Y.; Liao, S.J. Decoupling China’s economic growth from carbon emissions: Empirical studies from 30 Chinese provinces (2001–2015). Sci. Total Environ. 2019, 656, 576–588. [Google Scholar] [CrossRef]
  64. Zhou, X.; Zhang, M.; Zhou, M.H.; Zhou, M. A comparative study on decoupling relationship and influence factors between China’s regional economic development and industrial energy-related carbon emissions. J. Clean. Prod. 2017, 142, 783–800. [Google Scholar] [CrossRef]
  65. Chen, X.H.; Zhang, C. A dynamic analysis of a green closed-loop supply chain with different on-line platform smart recycling and selling models. Comput. Ind. Eng. 2025, 200, 110748. [Google Scholar] [CrossRef]
  66. Zheng, B.; Tong, D.; Li, M.; Liu, F.; Hong, C.P.; Geng, G.N.; Li, H.Y.; Li, X.; Peng, L.Q.; Qi, J.; et al. Trends in China’s anthropogenic emissions since 2010 as the consequence of clean air actions. Atmos. Chem. Phys. 2018, 18, 14095–14111. [Google Scholar] [CrossRef]
  67. Yao, Y.; Pan, J.H.; Wang, W.D.; Liu, Z.X.; Kan, H.D.; Qiu, Y.; Meng, X.; Wang, W.B. Association of particulate matter pollution and case fatality rate of COVID-19 in 49 Chinese cities. Sci. Total Environ. 2020, 741, 140396. [Google Scholar] [CrossRef] [PubMed]
  68. Kong, X.S.; Liu, F.; Wang, H.B.; Yang, R.F.; Chen, D.B.; Wang, X.X.; Lu, F.M.; Rao, H.Y.; Chen, H.S. Prevention and control measures significantly curbed the SARS-CoV-2 and influenza epidemics in China. J. Virus. Erad. 2021, 7, 100040. [Google Scholar] [CrossRef]
  69. Wang, Z.; Uno, I.; Yumimoto, K.; Itahashi, S.; Chen, X.S.; Yang, W.Y.; Wang, Z.F. Impacts of COVID-19 lockdown, Spring Festival and meteorology on the NO2 variations in early 2020 over China based on in-situ observations, satellite retrievals and model simulations. Atmos. Environ. 2020, 244, 117972. [Google Scholar] [CrossRef]
  70. Li, Y.; Mei, Y.R.; Zhang, T.; Xie, Y.B. Paths to carbon neutrality in China’s chemical industry. Front. Environ. Sci. 2022, 10, 999152. [Google Scholar] [CrossRef]
  71. Wang, G.Z. Research on synergistic mechanism of carbon reduction and pollution prevention. Energy Conserv. 2022, 6, 84–86. (In Chinese) [Google Scholar]
  72. Li, B.; Wang, W.L.; Yao, X. Study on the impact of coal power emission reduction on air pollutant emission control in China. Electr. Power 2019, 52, 110–117. (In Chinese) [Google Scholar]
  73. Chen, J.D.; Wang, B.; Huang, S.; Song, M.L. The influence of increased population density in China on air pollution. Sci. Total Environ. 2020, 735, 139456. [Google Scholar] [CrossRef]
Figure 1. Mechanisms of VOCs involved in O3 formation.
Sustainability 17 04066 g001
Figure 2. A driving framework for the spatial and temporal characteristics of CAP in the GBA.
Sustainability 17 04066 g002
Figure 3. CO2 and VOC emissions in the GBA, 2000–2020.
Sustainability 17 04066 g003
Figure 4. CO2 and VOC emissions from 9 + 2 cities in the GBA from 2000 to 2020.
Sustainability 17 04066 g004
Figure 5. Moran’s I index of CAP reduction in the GBA from 2000 to 2020.
Sustainability 17 04066 g005
Figure 6. The trajectory of TCE (a), PCCE (b), CEUA (c) and TVOC (d), PCVOC (e), VEUA (f) emissions’ center-of-gravity migration in the GBA from 2000 to 2020.
Sustainability 17 04066 g006
Figure 7. CO2 emissions from sectors in the GBA from 2000 to 2020.
Sustainability 17 04066 g007
Figure 8. VOC emissions from sectors in the GBA from 2000 to 2020.
Sustainability 17 04066 g008
Figure 9. CAP sectoral emission path in the GBA from 2000 to 2020.
Sustainability 17 04066 g009
Figure 10. Contribution of drivers to CO2 emissions in the GBA. Note: The selected periods are 2005–2010, 2010–2015, and 2015–2020. The height of histogram bars reflects the contribution level of each factor to total CO2 emissions during each phase.
Sustainability 17 04066 g010
Figure 11. Contribution of drivers to VOC emissions in the GBA. Note: The selected periods are 2005–2010, 2010–2015, and 2015–2020. The height of histogram bars reflects the contribution level of each factor to total VOC emissions during each phase.
Sustainability 17 04066 g011
Figure 12. Contribution of various influencing factors on CO2 emissions in the GBA from 2005 to 2020.
Sustainability 17 04066 g012
Figure 13. Contribution of various influencing factors on VOC emissions in the GBA from 2005 to 2020.
Sustainability 17 04066 g013
Figure 14. The contributions of carbon reduction to VOC’ reduction in the GBA.
Sustainability 17 04066 g014
Figure 15. The contributions of VOC reduction to carbon reduction in the GBA.
Sustainability 17 04066 g015
Figure 16. Decoupling of economic development and carbon emissions in 9 + 2 cities in the GBA from 2005 to 2020.
Sustainability 17 04066 g016
Figure 17. Decoupling between economic development and VOC emissions in 9 + 2 cities in the GBA from 2005 to 2020.
Sustainability 17 04066 g017
Figure 18. Spatial distribution of decoupling status between economic development and carbon and VOC emissions in 9 + 2 cities in the GBA from 2005 to 2020.
Sustainability 17 04066 g018
Table 1. Symbols and meanings of variables in the model.
SymbolsMeaningsSymbolsMeanings
C CO2/VOC total emissions E M I i j CO2/VOC emission intensity of the j sector in City i
C i j CO2/VOC emissions of the j sector in City i I E I i j Energy consumption intensity of industrial sectors
F i j Energy consumption I E S i j Level of industrialization of City i
Y i j Output value of the j sector in City i E S i j Energy consumption structure of the j sector in City i
Y i Economic output of City i E I i Energy intensity of City i
Y Gross regional product (GDP) G S i Proportion of the economic output of City i
P Number of permanent residents P G D P Per capita GDP
Table 2. Summary statistics for the model variables.
VariablesUnitMeanStandard
Deviation
MinMax
Total energy consumptionTons of standard coal19,972.073322.7314,287.7524,933.67
Industrial added valueHundred million yuan25,350.299016.0910,622.1938,031.49
Gross regional productHundred million yuan79,592.9729,957.6732,711.41124,690.17
Gross domestic product per capitaTen thousand yuan/person11.142.656.2014.66
PopulationTen thousand person7025.691093.085279.358634.52
Table 3. Symbols and meanings of variables in collaborative model.
SymbolsMeaningsSymbolsMeanings
V O C Total VOC emissions C s y n i Cooperative emission reduction coefficient of CO2 and VOCs
C O Total CO2 emissions C Y i CO2 emission reduction intensity of City i
C i j CO2/VOC emissions of the j sector in City i V Y i VOC emission reduction intensity of City i
Y i Economic output of City i P G D P Per capita GDP
P Number of permanent residents
Table 4. Decoupling state and decoupling index.
Decoupling StateDecoupling TypeEnvironmental Pressure Growth Rate ( E / E )Economy Driven Growth Rate ( G D P / G D P )Decoupling Index, D
DecouplingStrong decoupling (SD)(− , 0)(0, + ) D < 0
Weak decoupling (WD)(0, + )(0, + ) 0 D < 0.8
Recession decoupling (RD)(− , 0)(− , 0) D > 1.2
CouplingExpansion coupling (EC)(0, + )(0, + ) 0.8 D 1.2
Recession coupling (RC)(− , 0)(− , 0) 0.8 D 1.2
Negative decouplingStrong negative decoupling (SND)(0, + )(− , 0) D < 0
Weak negative decoupling (WND)(− , 0)(− , 0) 0 D < 0.8
Expansion negative decoupling (END)(0, + )(0, + ) D > 1.2
Disclaimer/Publisher’s Note: The statements, opinions and data contained in all publications are solely those of the individual author(s) and contributor(s) and not of MDPI and/or the editor(s). MDPI and/or the editor(s) disclaim responsibility for any injury to people or property resulting from any ideas, methods, instructions or products referred to in the content.

