Article

A Study on the Spatiotemporal Heterogeneity and Driving Factors of Mariculture Pollution in the Bohai Rim Region, China

1
Tianjin Eco-Environmental Monitoring Center, Tianjin 300191, China
2
Tianjin Key Laboratory of Aqua-Ecology and Aquaculture, College of Fisheries, Tianjin Agricultural University, Tianjin 300392, China
*
Author to whom correspondence should be addressed.
Sustainability 2025, 17(9), 4063; https://doi.org/10.3390/su17094063
Submission received: 31 March 2025 / Revised: 27 April 2025 / Accepted: 29 April 2025 / Published: 30 April 2025

Abstract

The rapid expansion of mariculture in the Bohai Rim Region, a key marine economic zone in North China, has led to various environmental challenges. This study evaluated the spatiotemporal heterogeneity of emission fluxes and identified the primary influencing factors of mariculture in the Bohai Rim Region during 2014–2023. The findings hold both theoretical and practical significance for promoting the sustainable development of the nearshore environment. On the basis of mariculture data, the pollution coefficient method (PCM) was applied to quantify emission fluxes, whereas the logarithmic mean Divisia index (LMDI) model and Spearman rank correlation were used to analyze influencing factors. The results indicate that (1) the spatiotemporal heterogeneity of mariculture pollution discharge was influenced primarily by mariculture taxa and policy regulations and that (2) the filtration capabilities of shellfish suggest that an integrated mariculture strategy involving shellfish and other taxa could significantly mitigate pollution. The optimization of breeding structures and advancements in technology play crucial roles in reducing mariculture-related pollution emissions. (3) A significant decline in pollutant levels was observed following the implementation of the Action Plan for Comprehensive Management of the Bohai Sea (CMAP-BS). These findings provide a scientific basis for transforming the environmental management of mariculture in coastal regions of China.

1. Introduction

As one of the world’s leading producers of aquatic products, China has made remarkable progress in mariculture in recent decades [1]. The sector has generated substantial economic benefits, reaching a production value of USD 67 billion and a total yield of 23,955,970 tons in 2023. While the expansion of mariculture enhances coastal economic benefits, it also poses significant challenges to ecological sustainability. The Bohai Rim Region, a rapidly developing coastal economic zone in North China, contributed USD 26 billion from mariculture, accounting for 38% of the total production value in 2023. However, its rapid development has led to several environmental, human health, and safety concerns [2,3]. Discharged feed waste and the decomposition of organic matter in offshore areas have contributed to rising pollution levels [3,4,5]. This issue is particularly pronounced in intensive cultivation systems, where dissolved nutrients and solid waste surpass natural ecosystem capacities [6]. Additionally, large-scale sea reclamation for mariculture has compromised coastal wetland functions and disrupted coastal aquatic ecosystems [7]. The expansion of mariculture has exacerbated marine ecological pollution and eutrophication, introducing excess nutrients such as nitrogen and phosphorus into coastal waters [8,9]. To ensure the sustainable development of mariculture and protect the coastal ecosystems of the Bohai Sea region, it is essential to examine the spatiotemporal heterogeneity of pollution emissions and identify the primary influencing factors.
As a typical semi-enclosed shallow marine system, the Bohai Sea has limited water exchange and a low self-purification capacity because of its landlocked nature on three sides, which restricts hydrodynamic circulation and environmental carrying capacity [10]. Long-term coastal development has further reduced the bay’s ability to sustain its resources, leading to a decline in fishery stocks. In recent years, frequent green tide events have been observed [11,12], while seagrass meadows and subtidal reef communities have continued to degrade due to human activities [13,14]. Although the implementation of the Action Plan for Comprehensive Management of the Bohai Sea (CMAP-BS) has mitigated some of these environmental pressures, challenges in nutrient management persist, particularly in regions with intensive mariculture activities. Given the significant contribution of mariculture to seafood production and its adverse effects on the local marine ecosystem, it is essential to assess the spatiotemporal heterogeneity of pollution loads from aquaculture and identify the key driving factors influencing these emissions.
Existing studies on mariculture pollution have focused primarily on pollutant discharges, nutrient removal technologies [3,15,16,17], and governance regulations [3,15,16,17]. The pollution coefficient method (PCM), which is based on activity levels and emission coefficients, is widely used for assessing pollution loads and quantifying pollutant emissions [18,19,20]. During China’s first comprehensive national pollution source assessment in 2007, the PCM employed a set of location-specific coefficients [21]. This method has been extensively applied in estimating rural nonpoint source pollution and air pollutant emissions [22,23]. For example, an improved entropy weight method using PCM was utilized to assess the environmental burden of aquaculture in Zhuhai, Guangdong Province [20]. By confining emissions to highly granular environmental management units, this approach effectively quantifies environmental mass loads, accounting for both positive and negative emissions. PCMs have also been employed to estimate nitrogen and phosphorus loads from mariculture at the provincial level in China [19], providing crucial insights for environmental management strategies. However, the PCM has limitations in capturing the spatiotemporal heterogeneity of pollution loads. Most studies that use PCM rely on static or aggregated assessments, overlooking the dynamic and spatially varying characteristics of pollution emissions. This limitation impairs the formulation of region-specific pollution control strategies, highlighting the need for refined methodologies that account for spatial and temporal variations in mariculture pollution.
The logarithmic mean Divisia index (LMDI) method has been widely utilized to examine the driving factors of mariculture pollution because of its strong theoretical foundation, flexibility, and ability to eliminate residuals and zero values, ensuring high accuracy while satisfying the requirement of factor reversibility [24,25,26]. Several studies have applied the LMDI approach to analyze the key driving forces behind mariculture, including the expansion of China’s mariculture industry [27] and the efficiency of mariculture-related carbon sequestration [28,29,30]. Despite its widespread application, the integration of LMDI with spatiotemporal analysis remains limited, particularly in exploring the heterogeneity of pollution trends across various regions and time periods. This gap weakens the effectiveness of policy recommendations, as regional disparities in influencing factors are not adequately addressed. A more comprehensive approach that incorporates both spatial and temporal dimensions could increase the precision of pollution control strategies and improve the sustainability of mariculture management.
While substantial progress has been made in pollution assessment and analysis of driving forces, many studies do not fully account for the spatial and temporal variations in mariculture-related pollution loads. Understanding these variations is crucial for recognizing regional disparities and dynamic pollution trends. Additionally, there is a lack of integration between pollution assessment methodologies (e.g., PCM) and driving factor analysis (e.g., LMDI) in the context of spatiotemporal heterogeneity. To promote sustainable mariculture development and protect coastal ecosystems in the Bohai Rim Region, it is necessary to examine the types of pollutants discharged from mariculture and the factors influencing these emissions.
This study addresses these research gaps by pursuing three specific objectives: (1) analyzing the spatiotemporal heterogeneity of pollution emission fluxes of TN, TP, NH3–N, and COD in the Bohai Rim Region over the past decade; (2) identifying the underlying causes and driving factors influencing the spatial distributions of these pollutants; and (3) assessing the impacts of different mariculture taxa on the emission fluxes of these four major pollutants. The findings of this study will offer valuable insights for researchers and environmental management agencies in the Bohai Rim Region, contributing to the improvement of environmental policies and the formulation of effective strategies to foster green and sustainable aquaculture practices.

2. Materials and Methods
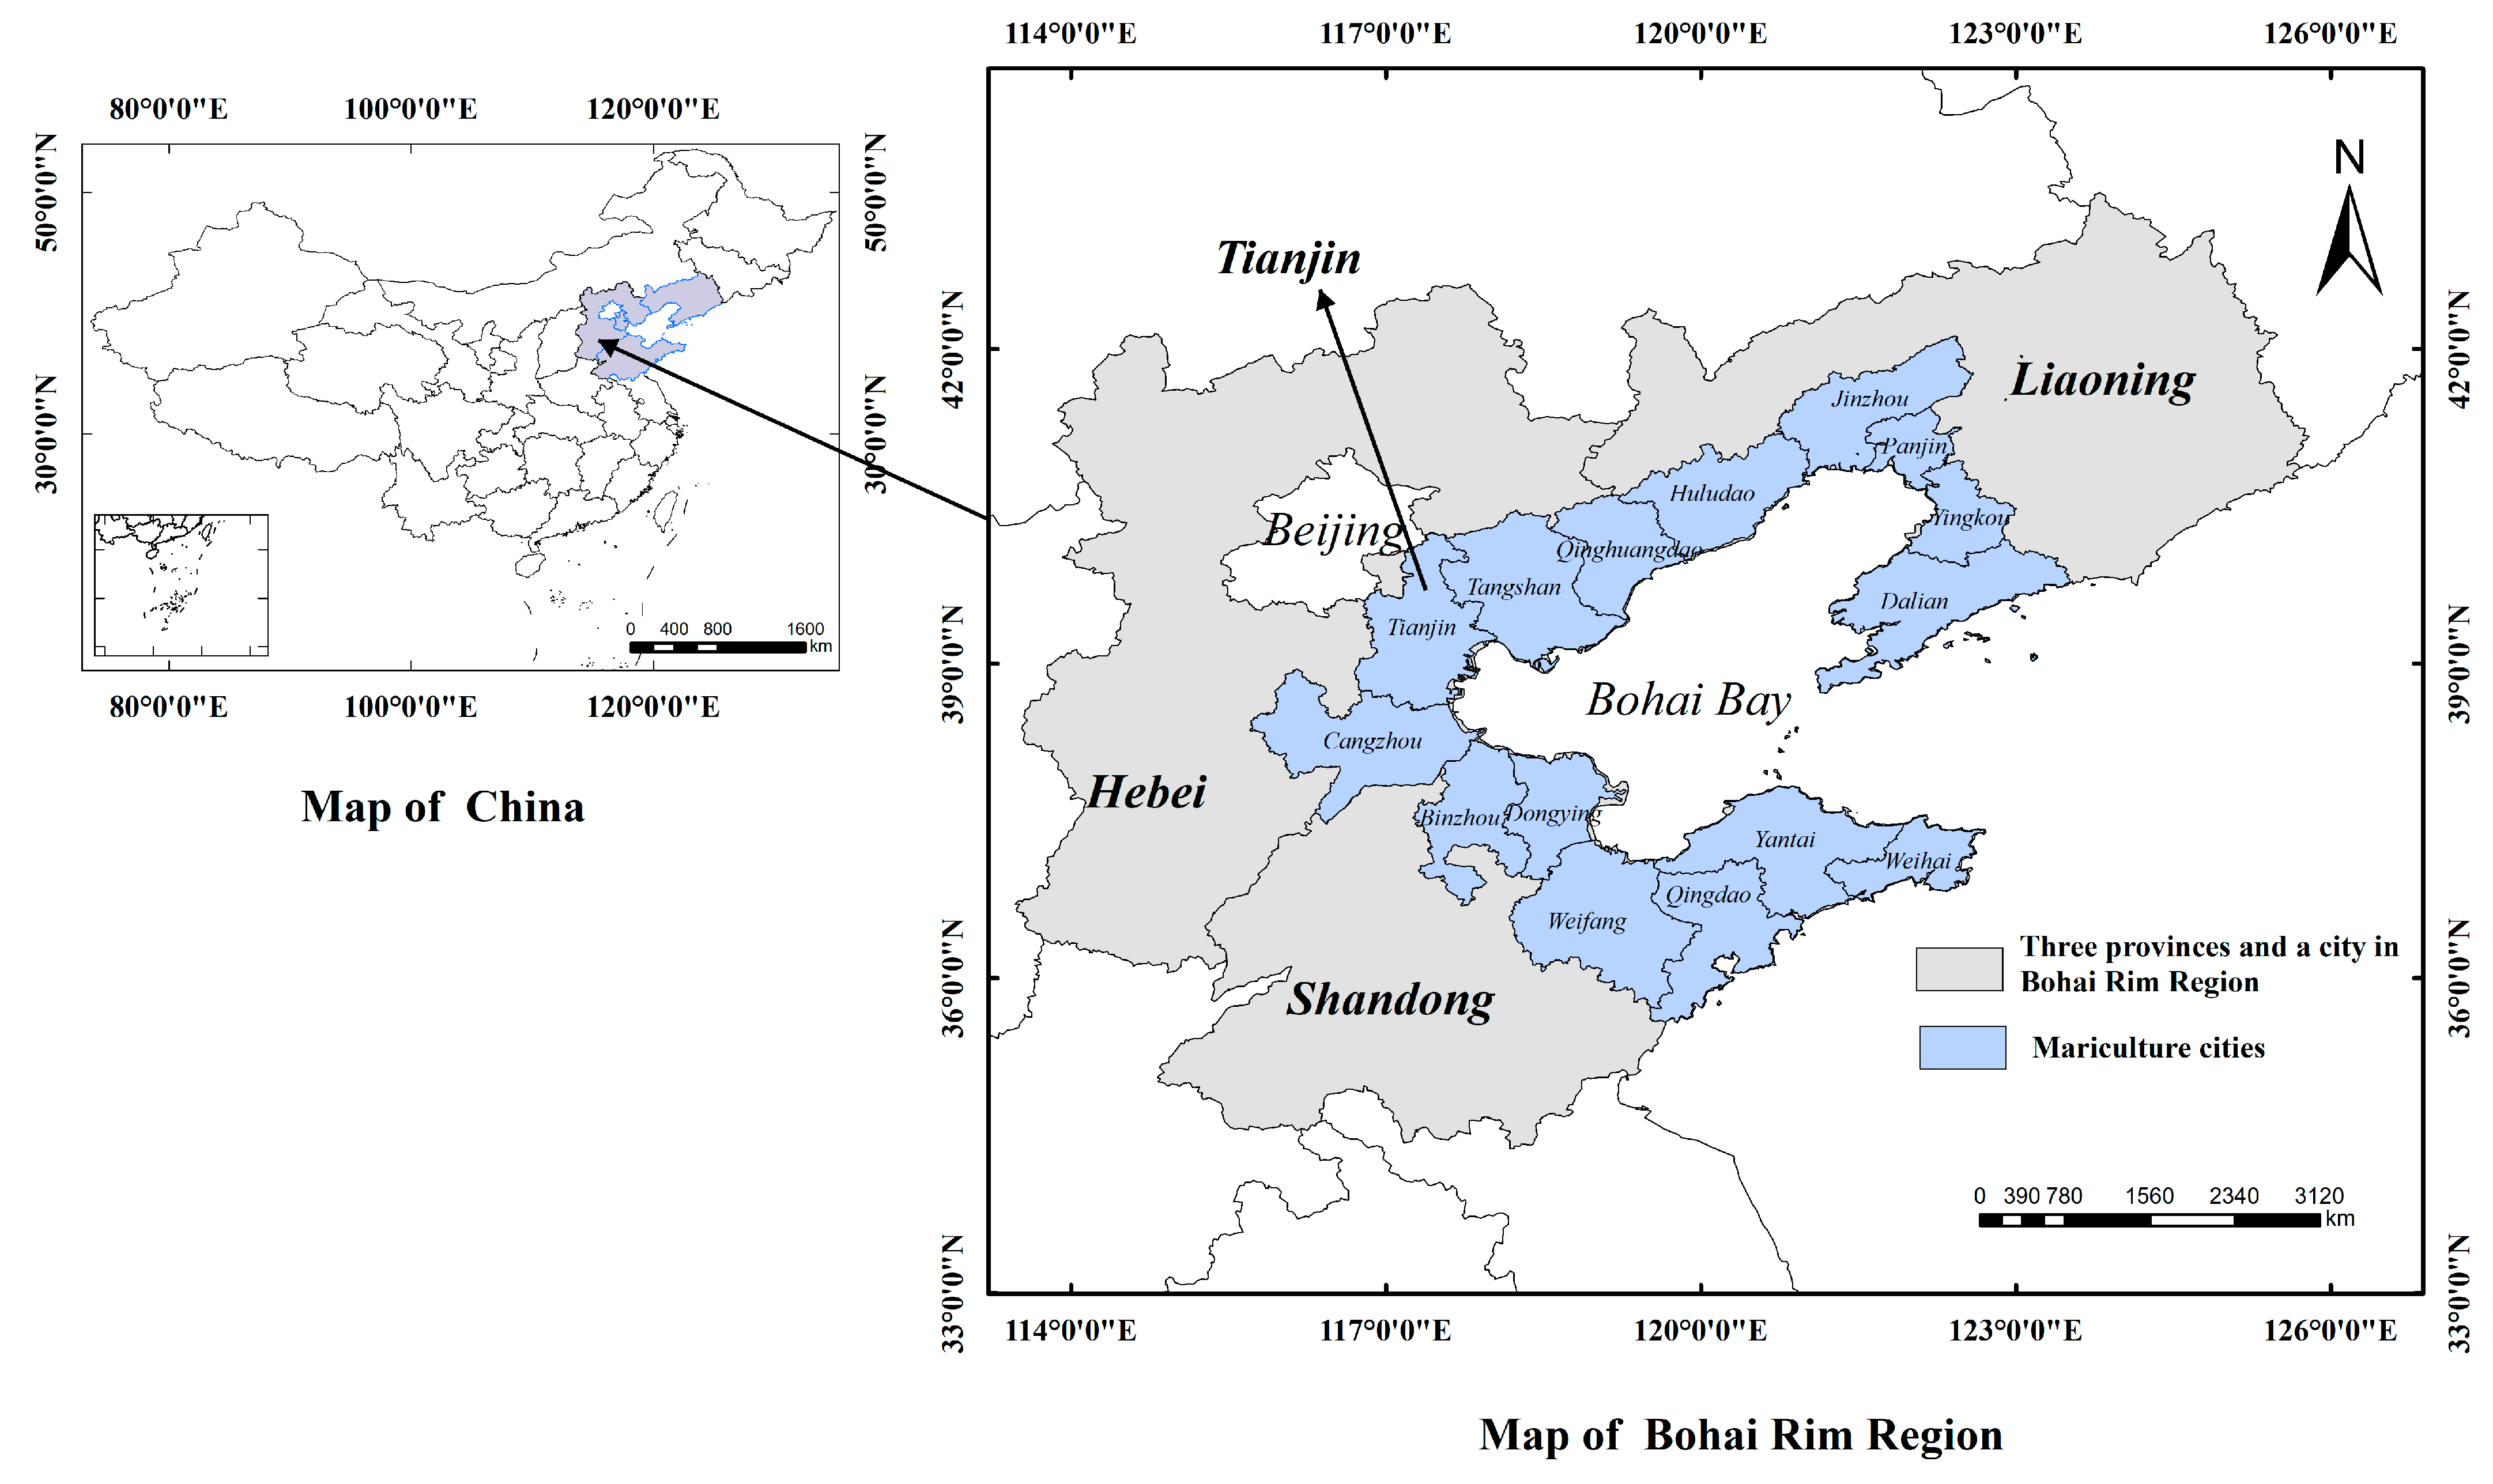
2.1. Study Area

As China’s only inland sea, the Bohai Rim Region is a key maritime economic zone in northern China. It is located between 37°07′ and 40°56′ N and between 117°33′ and 122°08′ E, and it encompasses three provinces (Liaoning, Shandong, and Hebei) and one municipality (Tianjin). Figure 1 illustrates the geographic location of the Bohai Rim Region in China and its mariculture cities. As of 2023, the region has played a significant role in China’s mariculture industry, producing 9.9965 million tons, accounting for 41.73% of the national total. Additionally, its mariculture area covers 14,012.57 km2, representing 28% of the country’s total mariculture area. According to statistical data from the Chinese Fishery Statistical Yearbook, 2015–2024 (MAC, 2015–2024), Shandong and Liaoning are the leading provinces in marine fishery production. In the Bohai Rim Region, mariculture in Tianjin is concentrated in the Binhai New Area, whereas in Hebei, it is located mainly in Tangshan, Cangzhou, and Qinhuangdao. In Shandong, mariculture activities are dominant in Rizhao, Dongying, Binzhou, Weifang, Qingdao, Yantai, and Weihai. Moreover, in Liaoning, mariculture is primarily found in Dalian, Huludao, Yingkou, Panjin, Dandong, and Jinzhou, covering a total of 17 cities. Mariculture techniques in the Bohai Rim Region include pond culture, cage culture (both standard and deep-water cages), raft culture, bottom sowing culture, and factory culture. The primary mariculture taxa include fish, crustaceans, shellfish, macroalgae, and other species [15]. As macroalgae belong to natural nutrient-based farming systems, their growth process continuously absorbs nitrogen and phosphorus from water, making macroalgae a relatively environmentally friendly aquaculture method [31,32]. Therefore, in the estimation of mariculture-related pollution fluxes in the study area, four major economic taxa are considered: fish, crustaceans, shellfish, and other species (Apostichopus japonicus, Echinoidea, Rhopilema esculentum, etc.), as they contribute significantly to the discharge of TN, TP, NH3–N, and COD.

2.2. Data Resources

This study utilized data from three provinces and one city from 2014 to 2023. The data sources included the China Statistical Yearbook (National Bureau of Statistics, 2015–2024), the China Fishery Statistical Yearbook (Fisheries and Fisheries Administration Bureau of the Ministry of Agriculture, 2015–2024), and various regional statistical yearbooks. These included the Tianjin Statistical Yearbook (Survey Office of the National Bureau of Statistics in Tianjin, 2015–2024), the Hebei Statistical Yearbook (Survey Office of the National Bureau of Statistics in Hebei, 2015–2024), the Shandong Statistical Yearbook (Survey Office of the National Bureau of Statistics in Shandong, 2015–2024), and the Liaoning Statistical Yearbook (Survey Office of the National Bureau of Statistics in Liaoning, 2015–2024). Additionally, statistical bulletins from 2014 to 2023 and relevant explanations regarding tailwater pollutant discharge standards for mariculture in the study area were incorporated. The pollutant discharge coefficient values were derived from the Manual of Emission Coefficients for the Second National Census of Pollution Sources (Second National Census of Pollution Source Office of the Ministry of Ecology and Environment, 2020) [18].

2.3. Methods

2.3.1. PCM

In this study, PCM was applied to quantify the fluxes of TN, TP, NH3-N, and COD emissions from mariculture activities into coastal regions. This method is primarily based on the Manual of Emission Coefficient for the Second National Census of Pollution Sources [18]. The approach accounts for various mariculture methods, distinguishing between enclosed-water mariculture and open-water mariculture. The formula for the contamination coefficient in enclosed-water mariculture is as follows:
k j = V s u m × ( P ¯ o u t P ¯ i n ) W o u t W i n
where k j is the pollution coefficient of the jth mariculture variety (g kg−1); V s u m is the sum of the drainage of the mariculture cycle (m3); W o u t   a n d   W i n are the o u t p u t   q u a l i t y   a n d   i n p u t   q u a l i t y , respectively (kg); and P ¯ o u t   a n d   P ¯ i n are the average concentrations of effluent and inflow, respectively (mg L−1).
The formula for the TN and TP coefficients in open-water mariculture is as follows:
k j = 10 3 × ( P ¯ f × W f ) ( W o u t W i n ) × P ¯ m h × X ¯ W o u t W i n
where k j represents the pollution coefficient of the jth mariculture variety (g kg−1); X represents the diffusion coefficient of the feed in the range of 0–1.0; P ¯ f   and   P ¯ m h represent the unit feed input and unit mariculture harvest, respectively (mg L−1); W o u t and W i n represent the o u t p u t   q u a l i t y   a n d   i n p u t   q u a l i t y , respectively (kg); W f is the quality of the input feed (kg), and the mariculture mode without feeding W f = 0 .
The coefficients for NH3-N and COD in the open-water mariculture formula are as follows:
k j = i = 1 n = 3 V × (   P ¯ c a g e   i P ¯ c o n t r o l   i ) / 3 W o u t W i n
where k j is the pollution coefficient of the jth mariculture variety (g kg−1); V is the volume of water in the cage (L); P ¯ c a g e   i and P ¯ c o n t r o l   i are the monitoring index concentrations of the samples in the cages and control groups, respectively (mg L−1); and W o u t p u t   and   W i n p u t are the output quantity and input quantity, respectively (kg). The Manual of Emission Coefficient for the Second National Census of Pollution Source delineates the pollution coefficients for several mariculture methods according to the attributes of mariculture taxa. The discharge coefficients are displayed in Table 1. Importantly, Table 1 does not differ between the locations and forms of mariculture. The discharge coefficients for various locations and forms can be found in the Manual of Emission Coefficient for the Second National Census of Pollution Sources [18]. The percentage of various mariculture methods for the same aquaculture taxa correspond to the percentage of harvest from those different mariculture methods. The proportions were derived from the China Fishery Statistical Yearbook (2015–2024).
The coefficient handbook presents the calculation formula for the emission of aquaculture pollutants, including TN, TP, NH3-N, and COD, in Equation (4):
Q = i = 1 n W i × γ × k i × 10 3
where Q represents the emission of an aquaculture pollutant ( t ); W i represents the bioproduction of the mariculture mode ( t ), which in this study takes place through the production of mariculture with negligible seedling quantity; i represents the mariculture mode; and k i represents the pollution coefficient of the mariculture varieties in the ith mode (g kg−1), which indicates that the pollutants discharged into the external water environment are produced by 1 kg aquatic product each.
The total amount of pollutant discharge is shown in Equation (5):
Q s u m = i = 1 n Q f i s h + i = 1 m Q c r u s t a c e a n + i = 1 j Q s h e l l f i s h + i = 1 l Q o t h e r s
where Q s u m represents the total amount of pollutant discharge ( t ); Q represents the amount of pollutant discharge of different mariculture varieties (t); and n , m , and j   and   l represent the numbers of fish, crustaceans, shellfish, and other taxa, respectively.

2.3.2. Equivalent Pollution Load Method

The equivalent pollution load method was applied to evaluate the total mariculture pollution. This approach primarily reflects the potential pollution level of the source and is widely used in pollution assessments [24,33]. The method is based on emission standard limits for various pollutants as the analytical benchmark. By standardizing the pollutant data, the equivalent standard pollution load of each pollutant is calculated, allowing for direct comparisons on a uniform scale. In this study, different pollutants were converted into the equivalent quantity of medium required to meet the same emission standards, enabling a systematic assessment of the total pollution impact of marine aquaculture. The total pollutant discharge and equivalent pollution load were determined via the following formulas:
E u , n = Q T N + Q T P + Q N H 3 N + Q C O D
E n = u E u , n / K u
where E u , n is the total amount of pollutant discharge of TN, TP, NH3-N, and COD; E n is the equivalent pollution load of the mariculture of the provinces and city; and K u is the concentration from Class II of tailwater pollutants in the discharge standard of three provinces and a city (Table 2).

2.3.3. Logarithmic Mean Divisia Index

The logarithmic mean Divisia index (LMDI) method was employed to analyze the driving factors of mariculture pollution from 2014 to 2023. Considering the actual mariculture conditions in the Bohai Rim Region, the effects of these driving factors were classified into three main categories: the mariculture scale effect, the mariculture structure effect, and the mariculture technology effect.
E = i E i = i Y Y i Y E i Y i = i I s c a I s t r I t e c
where E represents the total equivalent pollution load of mariculture; E i represents the equivalent pollution load of the different mariculture taxa; Y represents the total production of mariculture; Y i denotes the production of different mariculture taxa; I s c a is the driving factor of the mariculture scale effect; I s t r is the driving factor of the mariculture structure effect; and I t e c represents the driving factor of the mariculture technology effect. Thus, the difference E is decomposed into its components in additive form, as illustrated in Equation (9):
E = E t + 1 E t = E s c a + E s t r + E t e c
E s c a = i E i T E i 0 l n E i T l n E i 0 l n ( I s c a T I s c a 0 )   E s t r = i E i T E i 0 l n E i T l n E i 0 l n ( I s t r T I s t r 0 )   E t e c = i E i T E i 0 l n E i T l n E i 0 l n ( I t e c T I t e c 0 )
where E s c a represents the mariculture scale variable in year t; E s t r represents the mariculture structure variable in year t; E t e c represents the mariculture technology variable in year t; and E i T represents the equivalent pollution load during the T period. If the variable of a certain effect is positive, it indicates that an increase in the variable has a negative influence on the improvement of mariculture pollution; in contrast, it indicates a positive impact on improving mariculture pollution.

2.3.4. Statistical Analysis

All the statistical studies were conducted with Excel 2019 and Origin 2021 software. For geographical distribution, the spatial analyst modeling tool (ArcGIS 10.3) was used to visualize the spatial heterogeneity of the variations in emission flux and pollution status in the study area via the Kriging interpolation method. The impacts of mariculture taxa were analyzed via Spearman rank correlation with a circular heatmap.

3. Results and Discussion

3.1. Overview of Mariculture in the Bohai Rim Region

According to research findings on mariculture in the Bohai Rim Region from 2014 to 2023 (Figure 2a), the ranking of the annual average mariculture yield in the region is as follows: Shandong (58.9%) > Liaoning (35.1%) > Hebei (5.9%) > Tianjin (0.1%). The implementation of the CMAP–2002 in 2018 led to a decline in the annual average yield in the study area from 2018 to 2019 [34]. On the basis of the spatial distribution of the four pollutants in the Bohai Rim Region (Figure 3), Tianjin presented the lowest average mariculture yield, while the average concentrations of the four pollutants were the highest. The average concentrations of TN (3.14 mg L−1) and TP (3.14 mg L−1) were 1–2 times and 1.7–4.5 times higher, respectively, than those in other provinces. Inorganic nitrogen and phosphorus, which primarily originate from excess feed and excretions, contribute to harmful algal blooms [4,35,36,37]. Furthermore, the mariculture species cultivated in Tianjin were limited to fish and crustaceans (Figure 2b), accounting for 18.24% and 81.76% of the total mariculture output in Tianjin, respectively. These findings indicate that mariculture pollution is influenced not only by yield and species composition but also by additional factors.
Shandong and Liaoning are the two leading mariculture provinces in China, with differences observed in the average emission fluxes of TN and TP. The average TN emission flux was 760.4 kg a−1 in Shandong and 141.7 kg a−1 in Liaoning, whereas the average TP emission fluxes were 81.7 kg a−1 and 268.6 kg a−1, respectively. Compared with Liaoning, Shandong had a significantly greater TN emission flux and a relatively lower TP emission flux. According to the spatial distribution of NH3-N (Figure 3c), apart from Tianjin, variations in NH3–N unit emissions among other provinces were minimal, with relatively high unit emissions in Tianjin. The COD emission flux was negative in both Hebei and Liaoning, with average values of −1699.8 t a−1 and −5753.8 t a−1, respectively, and significantly lower in Shandong than in Tianjin. The dominant bivalve species cultured in this region, such as scallops and mussels, can filter and uptake nutrients from seawater, thereby contributing to the reduction in COD, NH3–N, and other pollutant emissions. As filter feeders, bivalves actively remove particulate organic matter and dissolved nutrients from seawater, leading to a net reduction in ambient pollutant concentrations. This ecological function is well documented in studies demonstrating their bioremediation potential [38,39,40,41]. As shown in Figure 2b, the proportion of shellfish production exceeded 80% of the total mariculture output in these provinces. This suggests a potential correlation between the reduction in COD emission flux and shellfish farming.

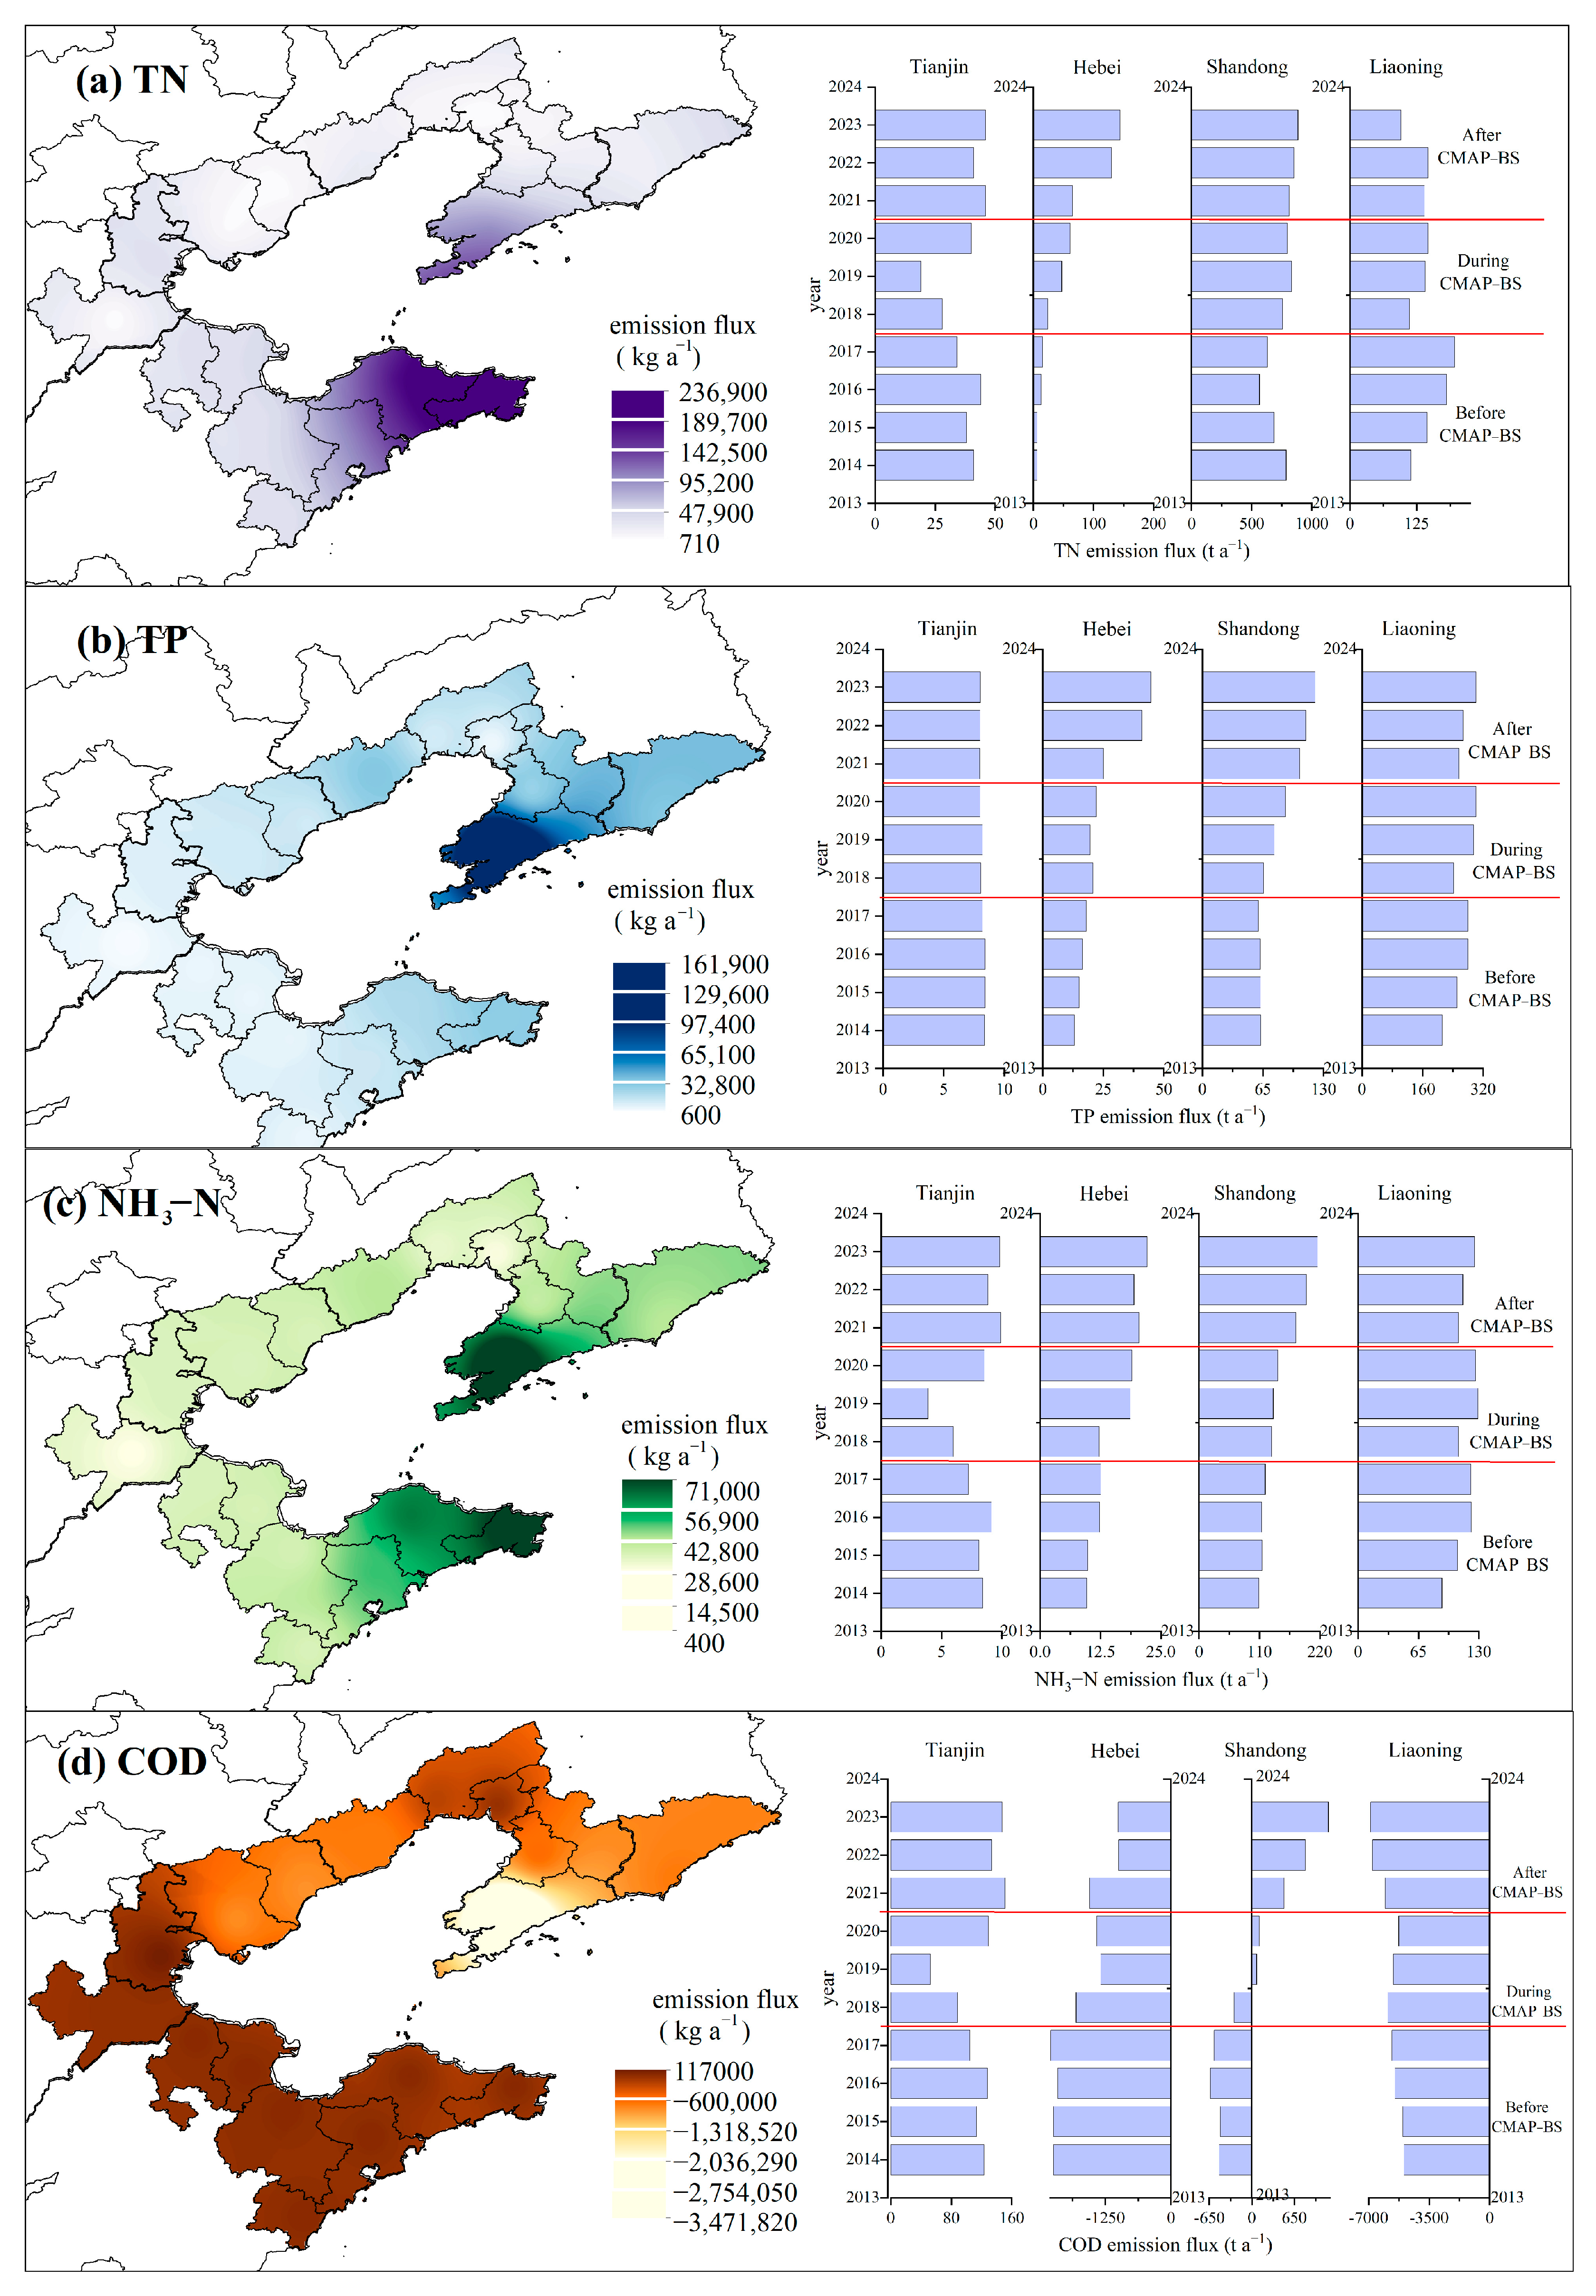
3.2. The Spatiotemporal Heterogeneity of Mariculture Pollution Discharge

Owing to the heterogeneous spatiotemporal characteristics of TN, TP, NH3–N, and COD emission fluxes in the mariculture area of the Bohai Rim Region over the past decade (Figure 4), changes in mariculture yield and policy interventions have had significant impacts on pollutant discharge. Yantai and Weihai, two high-yield mariculture regions in Shandong Province, presented the highest TN emission levels (Figure 4a). The expansion of intensive aquaculture for Lateolabrax japonicus and Penaeus vannamei progressively increased in these cities. The highest TP emissions were recorded in Daling, Liaoning Province (Figure 4b), with an average emission flux of 161.914 t a−1, which corresponds to a relatively high Rhopilema esculentum production. According to the spatial distribution of NH3–N (Figure 4c), higher emission fluxes were primarily observed in Liaoning and Shandong, with NH3–N emissions closely aligning with mariculture yields across various provinces and cities. The COD emission flux was negative in Liaoning and Hebei, with the most significant reduction occurring in Dalian (Figure 4d). Investigations indicate that the large-scale aquaculture of Argopecten irradians, Mytilus edulis, and Magallana gigas in this region has contributed positively to COD emission reduction. Changes in pollution emission fluxes often coincide with the issuance of key policies or plans.
As illustrated in Figure 4, TN, TP, NH3–N, and COD emission fluxes over the past decade can be categorized into three distinct phases: before CMAP-BS deployment (2014–2016), during its implementation (2017–2019), and after its implementation (2020–2023). The data indicate that both the annual growth rate of pollutant emissions and the mariculture yield in Tianjin exhibited negative trends. After 2022, except for TP, the emission fluxes of the other three pollutants increased, likely due to a rising market demand for mariculture products, which led to a continuous increase in pollutant discharge. Mariculture in Tianjin is primarily concentrated in the Binhai New Area, where intensive farming techniques relying on artificial feeding are predominant and where mariculture taxa are relatively limited. Consequently, pollution levels in Tianjin have been substantially influenced by policy interventions. During CMAP-BS implementation, most pollutant emission fluxes also decreased significantly across the other three provinces, with the average emission flux rate declining to 4.98% [34].

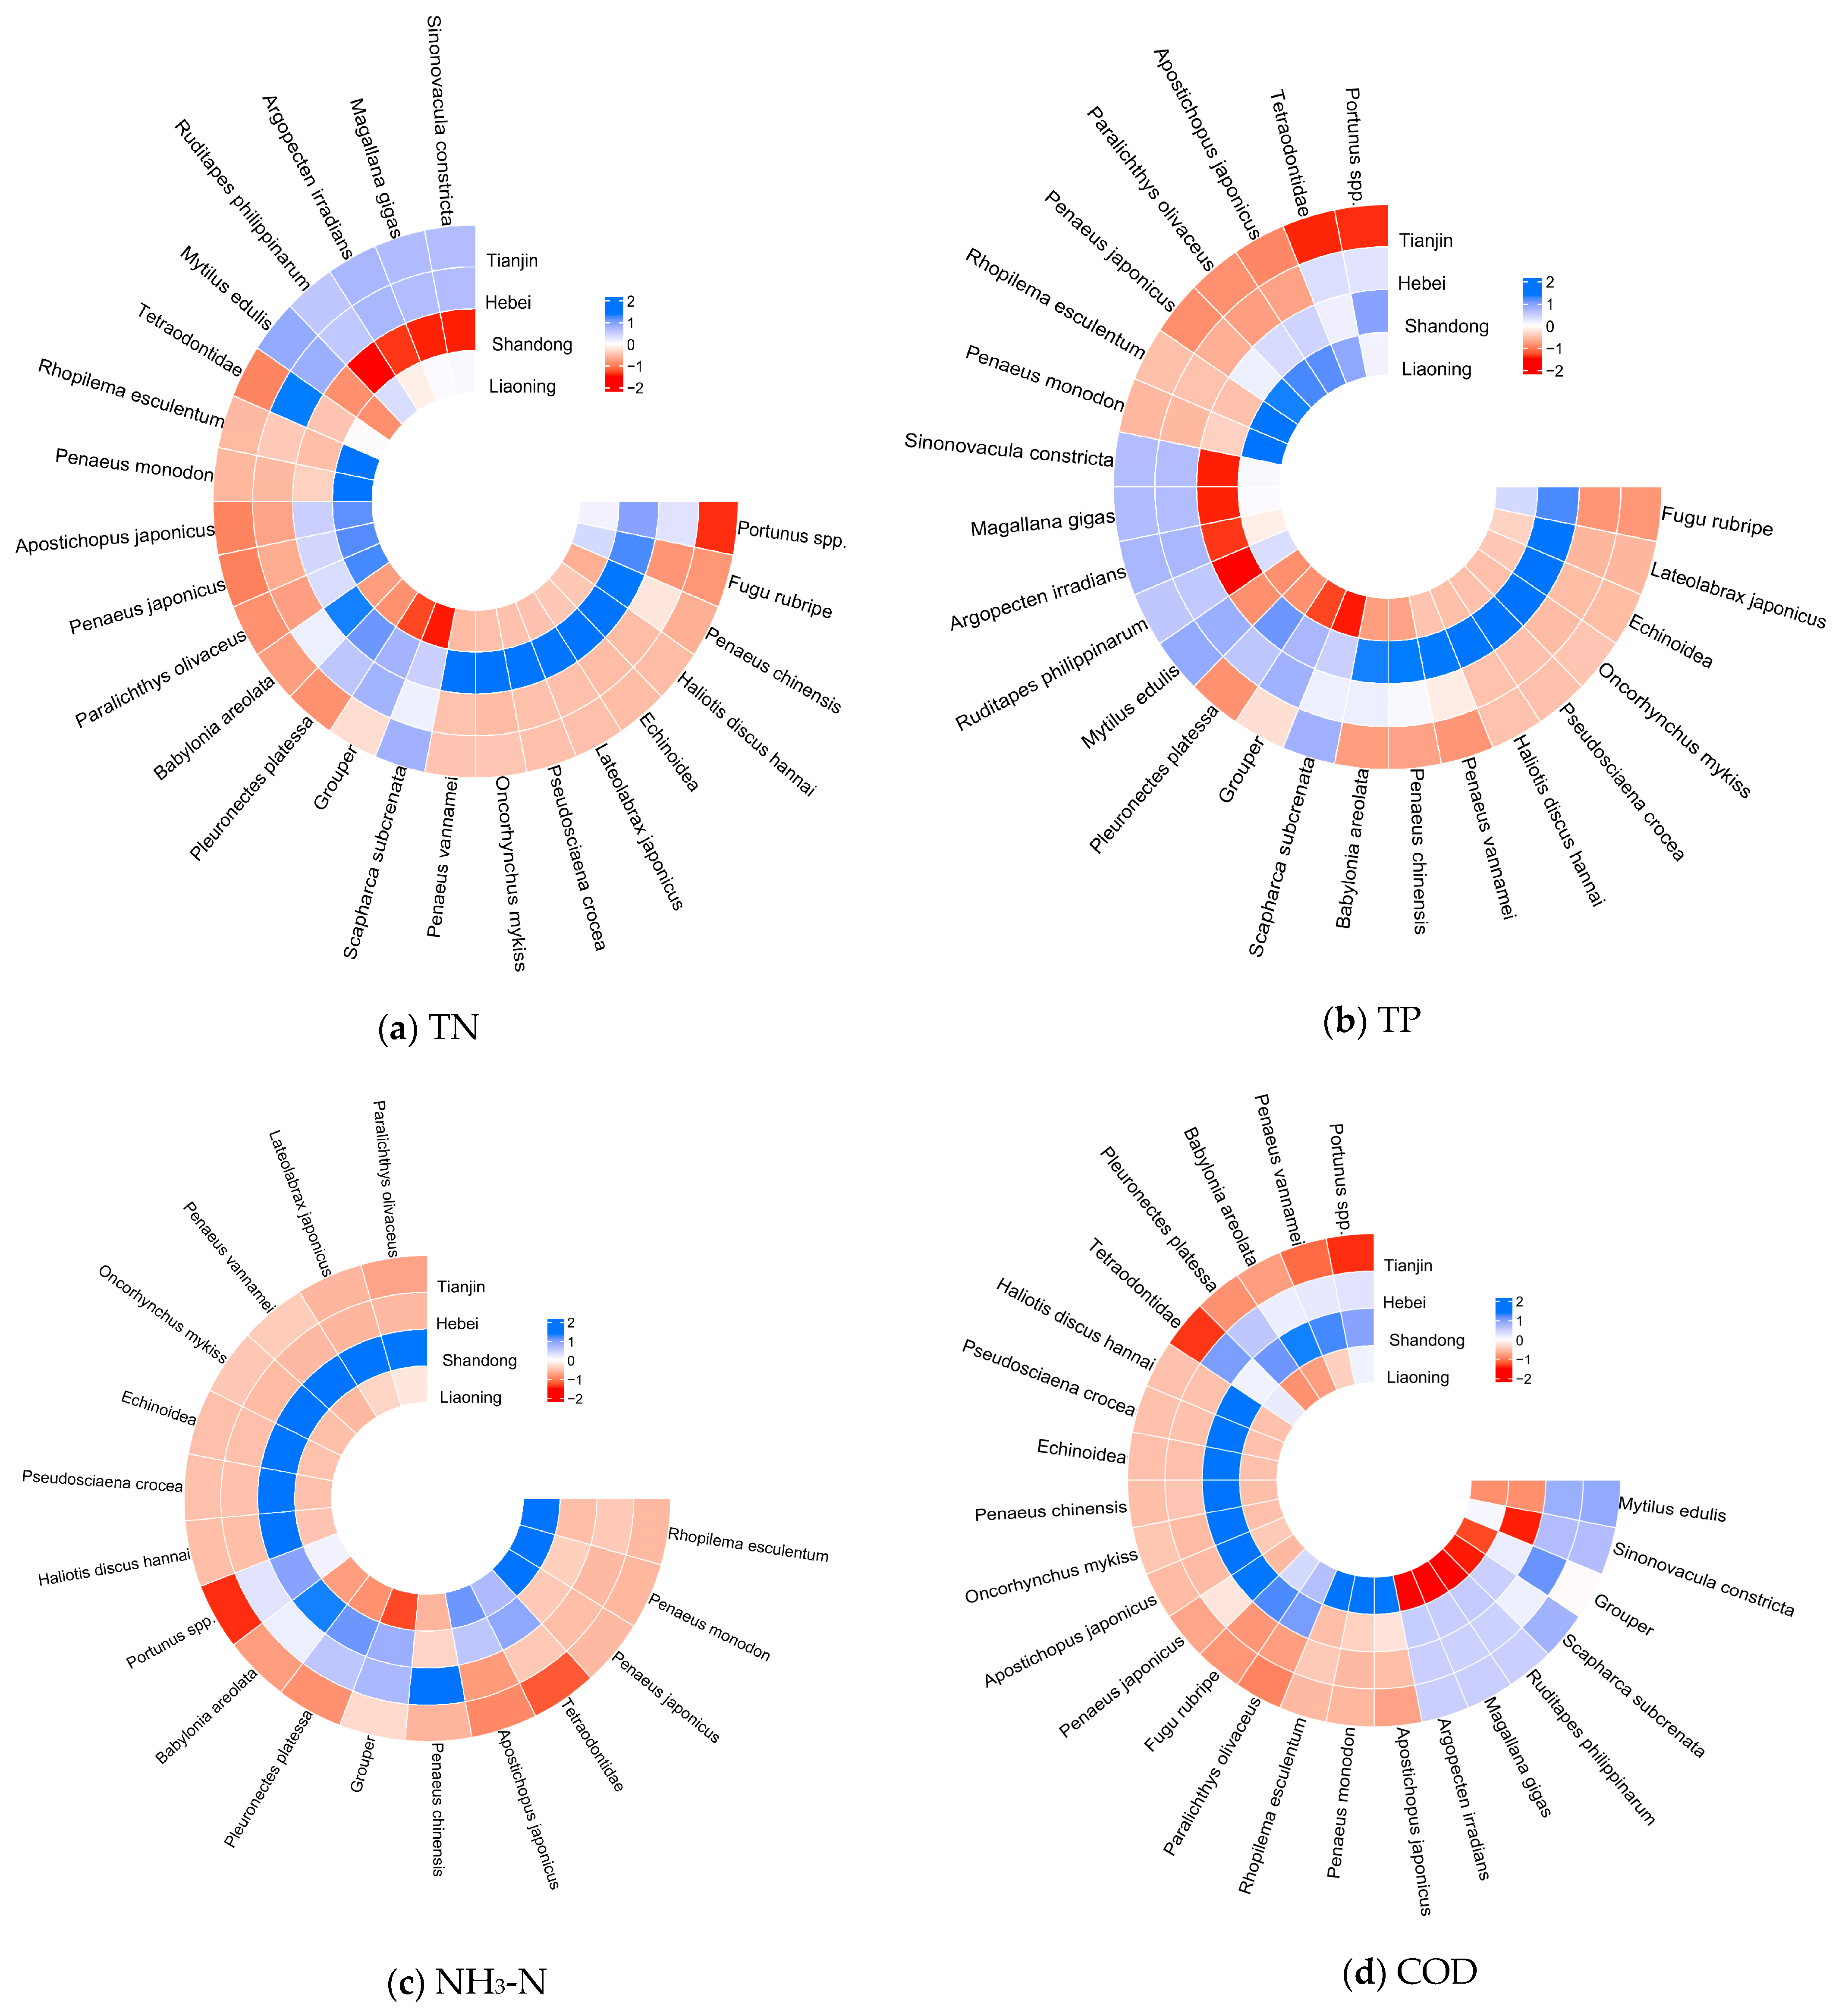
3.3. Impact of Mariculture Taxa on Pollution Emissions

Figure 5 shows the impacts of different mariculture taxa on the emission fluxes of TN, TP, NH3–N, and COD in the Bohai Rim Region. Nitrogen and phosphorus, which are derived primarily from surplus feed and excretions, are major pollutants that contribute to harmful algal blooms [4]. Figure 5a,b illustrates the substantial variation in TN and TP emissions, despite Liaoning having a lower mariculture output. TN emissions in Shandong are primarily associated with fish farming, whereas TP emissions in Liaoning are linked predominantly to Rhopilema esculentum farming. The TN emission flux from Lateolabrax japonicus in Shandong is 83.9 times greater than that in Liaoning, whereas the TP emission flux from Rhopilema esculentum in Shandong accounts for only 0.11% of that in Liaoning. NH3–N emissions in the region are attributed mainly to fish and crustacean farming (Figure 5c). In Tianjin and Shandong, NH3–N emissions primarily originate from Penaeus vannamei, whereas in Hebei, they are associated mainly with Pleuronectes platessa. Liaoning NH3–N emissions are largely derived from Penaeus japonicus and Paralichthys olivaceus. Compared with Liaoning, intensive aquaculture practices contribute to elevated emissions, with Shandong exhibiting significantly higher TN emissions but lower TP emissions. Despite having a smaller mariculture scale, Tianjin records high NH3–N emissions due to the prevalence of intensive fish and crustacean farming in ponds and factory-based systems. Studies indicate that 57% of the nitrogen in intensive Penaeus monodon farming is discharged, with 132.5 kg of nitrogen and 25.0 kg of phosphorus released per ton of fish produced [17], explaining the disproportionately high NH3–N emissions in Tianjin.
In the Bohai Rim Region, the primary shellfish species cultivated are scallops and mussels. Several studies have demonstrated that shellfish aquaculture can mitigate excessive nutrient loading in marine ecosystems [38,39,40]. Shellfish rely on the natural feed available in the water, thereby assisting in water filtration and contributing to negative COD and other pollutant emissions [41]. This explains why the annual COD emission fluxes in Hebei and Liaoning were negative and remained low in Shandong. However, not all shellfish farming reduces COD emissions. For example, Haliotis discus hannai cultivated through mudflat aquaculture has a pollution discharge coefficient of −0.01 g kg−1. However, in Shandong, where pond and factory aquaculture methods are used, the pollution discharge coefficient is 8.12 g kg−1. This variation primarily accounts for the significantly greater average COD emission flux in Shandong than in Liaoning.

3.4. Decomposition of the Driving Factors of Mariculture Pollution

According to the Mann–Kendall significance test results in Table 3, the equivalent pollution load emissions of the four pollutants in Hebei Province exhibit significant trends (p < 0.05), indicating a strong influence of policy interventions. In Shandong Province, all pollutants except TN also have strong policy impacts. In Tianjin, aside from the equivalent standard pollution load of TN, which is near the significance level, no significant policy effects are observed for the other pollutants. In Liaoning Province, none of the pollutants demonstrate a significant influence on policy.
The transformation characteristics of the driving factors behind changes in mariculture pollution are illustrated in Figure 6. Although the expansion of the mariculture scale typically results in an increase in the equivalent pollution load, the implementation of the action plan led to a reduction in the mariculture scale. During this period, the growth rate of mariculture pollutant discharge was lower than the expansion rate of the mariculture scale, suggesting that the conflict between pollution emissions and mariculture growth was partially mitigated. However, pollution levels remain considerable, and mariculture in the Bohai Rim Region continues to have a significant environmental impact [16]. The CMAP-BS action plan has played a key role in reducing regional mariculture pollution, particularly by promoting structural adjustments and technological advancements. For example, in Shandong and Liaoning, a shift toward mixed cultivation practices has contributed to pollution mitigation [42]. Filter-feeding shellfish, which utilize natural bait in water, effectively reduce pollution emissions [41]. In regions with high pollutant production and intensive mariculture, mixed cultivation involving algae, fish, and shellfish has been effective in reducing pollution and limiting the flow of pollutants into marine environments. Advancements in mariculture technology have improved the correlation between yield and pollution, helping to counterbalance the negative environmental impacts associated with mariculture expansion. In Tianjin, over 50% of mariculture facilities underwent technical upgrades during the CMAP-BS policy enforcement period, leading to reduced pollutant emissions. This reduction was particularly evident with the rapid adoption of recirculating mariculture systems and advanced feeding technologies.
Despite these improvements, mariculture pollution in the Bohai Rim Region remains a significant challenge compared with other global mariculture areas. To mitigate the environmental impact of mariculture tailwater discharge, various countries have implemented technological and policy measures. In the United States, several states have adopted best management practices (BMPs) for resource utilization and aquaculture tailwater management [43,44]. The “Aquaculture Management Standards” set the COD emission limit at 8 mg L−1 [45], which is considerably lower than the levels observed in the Bohai Rim Region. The European Union mandates the environmental monitoring of aquaculture farms, including assessments of organic matter, nutrients, microplastics, and antibiotic residues in aquaculture tailwater [46]. On the basis of LMDI decomposition analysis of pollution-driving factors, although CMAP-BS has achieved significant progress in adjusting the scale, structure, and technology of mariculture, further efforts are needed to incorporate lessons from other countries to address ongoing pollution challenges. The continuous adaptation of mariculture practices and the integration of innovative technologies are essential for achieving a more sustainable balance between mariculture development and environmental protection.

4. Conclusions

This study employed the PCM approach, equivalent pollution load method, LMDI method, kriging interpolation method, and Spearman rank correlation analysis to assess the spatiotemporal heterogeneity of TN, TP, NH3–N, and COD emission fluxes from mariculture activities and to determine the primary driving factors in the Bohai Rim Region over the past decade. The key findings are as follows:
(1) The emission fluxes of TN, TP, NH3–N, and COD continuously increased, with average values of 990.62 t a−1, 381.98 t a−1, 284.67 t a−1, and −7315.59 t a−1, respectively. During the study period, TN and TP were identified as the primary pollutants released from mariculture in this region.
(2) Significant differences were observed in the spatiotemporal heterogeneity of mariculture pollution discharge in the Bohai Rim Region. These variations were influenced primarily by mariculture taxa and policy interventions. The impact of mariculture taxa was more pronounced in the spatial dimension, whereas policies played a dominant role in the temporal dimension. For example, in Hebei and Liaoning, the COD emission flux was negative. Shellfish farming has been shown to alleviate nutrient overloading in marine environments, particularly by reducing COD levels. In areas with high pollutant production and intensive mariculture, the mixed cultivation of algae, fish, and shellfish has proven effective in mitigating pollution and reducing pollutant discharge into marine ecosystems.
(3) The implementation of the CMAP-BS plan has successfully reduced the overall pollutant discharge into the ocean while simultaneously increasing mariculture production through modifications in agricultural development models. In Tianjin, where mariculture farming is extensive, a series of technological innovations have been introduced to support these objectives. As a result, regulated sea enclosure and reclamation measures have contributed to improvements in the marine ecological environment of the Bohai Rim, progressively restoring its ecological functions.
On the basis of the characteristics of the mariculture pollution across the Bohai Rim region, this study proposes a series of integrated management measures for regulatory authorities and policymakers. Agricultural departments should priority the adoption of integrated, mixed cultivation systems to effectively mitigate pollutant discharge, particularly in eutrophication-sensitive coastal areas of Liaoning and Shandong Provinces. Concurrently, governments should implement ecological aquaculture subsidy programs, including tax incentives for farmers. Financial departments must establish dedicated funding mechanisms to support research and development and the implementation of advanced tailwater treatment technologies. Environmental protection agencies should strengthen the enforcement of mariculture tailwater discharge standards while developing a dynamically updated pollutant emission database. Furthermore, we recommend incorporating a specialized Bohai Rim monitoring program into the next national pollution source census to provide robust scientific support for targeted pollution control strategies.
Compared with other maritime regions, the natural marine habitat in the Bohai Rim is relatively low in quality, highlighting the pressing environmental challenges associated with mariculture in this area. In late 2023, a discharge standard for tailwater pollutants from mariculture activities in the Bohai Rim Region was introduced, with the expectation of effectively reducing pollution and fostering the sustainable development of mariculture. While this study offers valuable insights into the spatiotemporal heterogeneity and driving factors of mariculture pollution in the region, further research is needed to analyze long-term trends. Additionally, to better understand regional variations and develop targeted management strategies, future studies should incorporate higher spatial resolution and more detailed investigations into tailwater discharge from typical mariculture zones. These investigations should not only focus on the quality of tailwater and nearshore water pollution but also consider the influence of historical policy changes, economic transitions, and technological advancements on mariculture pollution dynamics. Improving the accuracy of the PCM, which currently relies entirely on emission coefficients, remains a priority. A critical challenge for future research will be integrating monitoring data with multisource pollution contribution analysis to dynamically refine PCM emission coefficients. Enhancing the spatial resolution and temporal sensitivity of the model will be essential in achieving this goal. This approach strengthens the foundation for applying LMDI decomposition to identify pollution-driving factors, ultimately leading to a more comprehensive understanding of the complex interactions among socioeconomic, environmental, and policy influences.

Author Contributions

Conceptualization, H.Y.; methodology, H.Y. and Y.T.; software, H.Z. and S.H.; validation, S.H., H.Z., and Y.L.; investigation, H.Z.; resources, S.H. and Y.L.; data curation, J.L. and H.Z.; writing—original draft preparation, H.Y.; writing—review and editing, H.Y.; visualization, J.L.; supervision, H.Z. and H.Y.; project administration, J.L.; funding acquisition, J.L. All authors have read and agreed to the published version of the manuscript.

Funding

This research received no external funding.

Institutional Review Board Statement

Not applicable.

Informed Consent Statement

Not applicable.

Data Availability Statement

Data are contained within the article. The original contributions presented in this study are included in the article. Further inquiries can be directed to the corresponding author.

Acknowledgments

The work was jointly supported by grants from the Tianjin Government Procurement Project (SZTJ-GK-2021-026), the Revision Plan of the Local Standard System (2022-41), and the National Natural Science Foundation of China (No. 52270151).

Conflicts of Interest

The authors declare that they have no known competing financial interests or personal relationships that could have influenced the work reported in this paper.

References

  1. Yu, J.-K.; Li, Y.-H. Evolution of marine spatial planning policies for mariculture in China: Overview, experience and prospects. Ocean Coast. Manag. 2020, 196, 105293. [Google Scholar] [CrossRef]
  2. Cao, L.; Wang, W.; Yang, Y.; Yang, C.; Yuan, Z.; Xiong, S.; Diana, J. Environmental impact of aquaculture and countermeasures to aquaculture pollution in China. Env. Sci. Pollut. R 2007, 14, 452–462. [Google Scholar]
  3. Wang, X.; Cuthbertson, A.; Gualtieri, C.; Shao, D. A Review on Mariculture Effluent: Characterization and Management Tools. Water 2020, 12, 2991. [Google Scholar] [CrossRef]
  4. Bouwman, L.; Beusen, A.; Glibert, P.M.; Overbeek, C.; Pawlowski, M.; Herrera, J.; Mulsow, S.; Yu, R.; Zhou, M. Mariculture: Significant and expanding cause of coastal nutrient enrichment. Environ. Res. Lett. 2013, 8, 044026. [Google Scholar] [CrossRef]
  5. Boudouresque, C.-F.; Blanfuné, A.; Pergent, G.; Pergent-Martini, C.; Perret-Boudouresque, M.; Thibaut, T. Impacts of marine and lagoon aquaculture on macrophytes in Mediterranean benthic ecosystems. Front. Mar. Sci. 2020, 7, 218. [Google Scholar] [CrossRef]
  6. Honkanen, T.; Helminen, H. Impacts of fish farming on eutrophication: Comparisons among different characteristics of ecosystem. Int. Rev. Hydrobiol. A J. Cover. All Asp. Limnol. Mar. Biol. 2000, 85, 673–686. [Google Scholar] [CrossRef]
  7. Liang, Y.; Cheng, X.; Zhu, H.; Shutes, B.; Yan, B.; Zhou, Q.; Yu, X. Historical evolution of mariculture in China during past 40 years and its impacts on eco-environment. Chin. Geogr. Sci. 2018, 28, 363–373. [Google Scholar] [CrossRef]
  8. Feng, Y.Y.; Hou, L.C.; Ping, N.X.; Ling, T.D.; Kyo, C.I. Development of mariculture and its impacts in Chinese coastal waters. Rev. Fish Biol. Fish. 2004, 14, 1–10. [Google Scholar] [CrossRef]
  9. Dong, Z.; Kuang, C.; Gu, J.; Zou, Q.; Zhang, J.; Liu, H.; Zhu, L. Total maximum allocated load of chemical oxygen demand near Qinhuangdao in Bohai sea: Model and field observations. Water 2020, 12, 1141. [Google Scholar] [CrossRef]
  10. Li, X.; Jia, C.; Zhao, H.; Teng, Y.; Zhang, Y.; Zhang, P. Investigation on the influence of the Bohai Sea Geological Environment on the submarine stratum stability based on data mining: An intelligent prediction model. Environ. Sci. Pollut. Res. 2023, 30, 11617–11633. [Google Scholar] [CrossRef]
  11. Zeng, B.; Sun, Y.; Song, W.; Wang, Z.; Zhang, X. Recurrence of the green tide in the Bohai Sea, China: A green tide caused by coastal reclamation projects. J. Sea Res. 2023, 191, 102333. [Google Scholar] [CrossRef]
  12. Song, W.; Han, H.; Wang, Z.; Li, Y. Molecular identification of the macroalgae that cause green tides in the Bohai Sea, China. Aquat. Bot. 2019, 156, 38–46. [Google Scholar] [CrossRef]
  13. Min, X.; Yi, Z.; Xiao-Jing, S.; Yun-Ling, Z.; Hai-Peng, Z. The distribution of large floating seagrass (Zostera marina) aggregations in northern temperate zones of Bohai Bay in the Bohai Sea, China. PLoS ONE 2019, 14, e0201574. [Google Scholar] [CrossRef]
  14. Xu, M.; Xu, Y.; Yang, J.; Li, J.; Zhang, H.; Xu, K.; Zhang, Y.; Otaki, T.; Zhao, Q.; Zhang, Y. Seasonal variations in the diversity and benthic community structure of subtidal artificial oyster reefs adjacent to the Luanhe River Estuary, Bohai Sea. Sci. Rep. 2023, 13, 17650. [Google Scholar] [CrossRef] [PubMed]
  15. Marinho-Soriano, E.; Nunes, S.; Carneiro, M.; Pereira, D. Nutrients’ removal from aquaculture wastewater using the macroalgae Gracilaria birdiae. Biomass Bioenergy 2009, 33, 327–331. [Google Scholar] [CrossRef]
  16. Chen, Y.; Ma, Y.; Wang, Y.; Sun, Z.; Han, Y. Impact of China’s marine governance policies on the marine ecological environment—A case study of the Bohai rim. Ocean Coast. Manag. 2023, 246, 106913. [Google Scholar] [CrossRef]
  17. Islam, M.S. Nitrogen and phosphorus budget in coastal and marine cage aquaculture and impacts of effluent loading on ecosystem: Review and analysis towards model development. Mar. Pollut. Bull. 2005, 50, 48–61. [Google Scholar] [CrossRef]
  18. Census, N.P.S. Emission factors Were Derived from the Manual of Emission Coefficient for the Second National Census of Pollution Source; The Second National Census of Pollution Source Office of the Ministry of Ecology and Environment: Beijing, China, 2020. (In Chinese) [Google Scholar]
  19. Zhang, J.; Wu, W.; Li, Y.; Liu, Y.; Wang, X. Environmental effects of mariculture in China: An overall study of nitrogen and phosphorus loads. Acta Oceanol. Sin. 2022, 41, 4–11. [Google Scholar] [CrossRef]
  20. Xing, Y.; Zhang, Z.; Zhao, W.; Liao, Y.; Zhao, Z. Estimation and evaluation of aquaculture mass load based on inventory and improved entropy weight: The case of Zhuhai City, China. Ecol. Indic. 2023, 157, 111205. [Google Scholar] [CrossRef]
  21. Zhao, H.; Cui, J.; Wang, S.; Lindley, S. Customizing the coefficients of urban domestic pollutant discharge and their driving mechanisms: Evidence from the Taihu Basin, China. J. Environ. Manag. 2018, 213, 247–254. [Google Scholar] [CrossRef]
  22. Chen, L.; Zhou, S.; Wu, S.; Wang, C.; Li, B.; Li, Y.; Wang, J. Combining emission inventory and isotope ratio analyses for quantitative source apportionment of heavy metals in agricultural soil. Chemosphere 2018, 204, 140–147. [Google Scholar] [CrossRef] [PubMed]
  23. Banerjee, S.; Khan, M.A.; Ul Husnain, M.I. Searching appropriate system boundary for accounting India’s emission inventory for the responsibility to reduce carbon emissions. J. Environ. Manag. 2021, 295, 112907. [Google Scholar] [CrossRef]
  24. Wu, S.; Tang, M.; Wang, Y.; Ma, Z.; Ma, Y. Analysis of the spatial distribution characteristics of livestock and poultry farming pollution and assessment of the environmental pollution load in Anhui province. Sustainability 2022, 14, 4165. [Google Scholar] [CrossRef]
  25. Liu, G.; Hao, Y.; Zhou, Y.; Yang, Z.; Zhang, Y.; Su, M. China’s low-carbon industrial transformation assessment based on Logarithmic Mean Divisia Index model. RCR Resour. Conserv. Recycl. 2016, 108, 156–170. [Google Scholar] [CrossRef]
  26. Ozturk, I.; Khan, S.; Majeed, M.T. Environmental impact of economic activities: Decoupling perspective of Singapore using log mean Divisia index decomposition technique. Geol. J. 2023, 58, 3720–3733. [Google Scholar] [CrossRef]
  27. Xu, Y.; Zhang, Y.; Ji, J.; Xu, L.; Liang, Y. What drives the growth of China’s mariculture production? An empirical analysis of its coastal regions from 1983 to 2019. Env. Sci. Pollut. R 2023, 30, 111397–111409. [Google Scholar] [CrossRef]
  28. Shi, X.; Xu, Y.; Dong, B.; Nishino, N. Mariculture carbon sequestration efficiency in China: Its measurement and socio-economic factor analysis. Sustain. Prod. Consum. 2023, 40, 101–121. [Google Scholar] [CrossRef]
  29. Guo, S.; Nie, H. Estimation of Mariculture Carbon Sinks in China and Its Influencing Factors. J. Mar. Sci. Eng. 2024, 12, 724. [Google Scholar] [CrossRef]
  30. Gu, Y.; Lyu, S.; Wang, L.; Chen, Z.; Wang, X. Assessing the carbon sink capacity of coastal mariculture shellfish resources in China from 1981–2020. Front. Mar. Sci. 2022, 9, 981569. [Google Scholar] [CrossRef]
  31. Hernández, I.; Martínez-Aragón, J.; Tovar, A.; Pérez-Lloréns, J.; Vergara, J. Biofiltering efficiency in removal of dissolved nutrients by three species of estuarine macroalgae cultivated with sea bass (Dicentrarchus labrax) waste waters 2. Ammonium. J. Appl. Phycol. 2002, 14, 375–384. [Google Scholar] [CrossRef]
  32. Neori, A.; Chopin, T.; Troell, M.; Buschmann, A.H.; Kraemer, G.P.; Halling, C.; Shpigel, M.; Yarish, C. Integrated aquaculture: Rationale, evolution and state of the art emphasizing seaweed biofiltration in modern mariculture. Aquaculture 2004, 231, 361–391. [Google Scholar] [CrossRef]
  33. Zhang, Y.; Ji, J. The decoupling and influencing factors analysis of blue granary Eco-Economy system. J. Agrotech. Econ. 2020, 4, 94–106. [Google Scholar]
  34. Environment and Ocean [2018] No. 158, Action Plan for Comprehensive Management of the Bohai Sea, Central People’s Government of the People’s Republic of China. Available online: https://www.gov.cn/gongbao/content/2019/content_5377134.htm (accessed on 30 March 2025).
  35. Uchimura, M. Ecological studies of green tide, Ulva spp. (Chlorophyta) in Hiroshima Bay, the Seto Inland Sea. Jpn. J. Phycol. 2004, 52, 17–22. [Google Scholar]
  36. Ye, N.-H.; Zhang, X.-W.; Mao, Y.-Z.; Liang, C.-W.; Xu, D.; Zou, J.; Zhuang, Z.-M.; Wang, Q.-Y. ‘Green tides’ are overwhelming the coastline of our blue planet: Taking the world’s largest example. Ecol. Res. 2011, 26, 477–485. [Google Scholar] [CrossRef]
  37. Qi, L.; Hu, C.; Wang, M.; Shang, S.; Wilson, C. Floating algae blooms in the East China Sea. Geophys. Res. Lett. 2017, 44, 11,501–11,509. [Google Scholar] [CrossRef]
  38. Petersen, J.K.; Saurel, C.; Nielsen, P.; Timmermann, K. The use of shellfish for eutrophication control. Aquacult. Int. 2016, 24, 857–878. [Google Scholar] [CrossRef]
  39. Ferreira, J.; Bricker, S. Goods and services of extensive aquaculture: Shellfish culture and nutrient trading. Aquacult. Int. 2016, 24, 803–825. [Google Scholar] [CrossRef]
  40. He, Y.; Sen, B.; Shang, J.; He, Y.; Xie, N.; Zhang, Y.; Zhang, J.; Johnson, Z.I.; Wang, G. Seasonal influence of scallop culture on nutrient flux, bacterial pathogens and bacterioplankton diversity across estuaries off the Bohai Sea Coast of Northern China. Mar. Pollut. Bull. 2017, 124, 411–420. [Google Scholar] [CrossRef]
  41. Rice, M.A. Environmental impacts of shellfish aquaculture: Filter feeding to control eutrophication. In Marine Aquaculture and the Environment: A Meeting for Stakeholders in the Northeast; Cape Cod Press: Falmouth, MA, USA, 2001; pp. 77–86. [Google Scholar]
  42. Tian, H.; Sun, S.; Li, W.; Qiao, Z. Assessment of Carbon Sink Capacity and Economic Value of Maricultured Shellfish and Algae in China. Pol. J. Environ. Stud. 2025, 34, 1311–1320. [Google Scholar] [CrossRef]
  43. EPA USA. Federal Register: Environmental Protection Agency, 40 CFR Part 745; Lead; Identification of Dangerous Levels of Lead; Final Rule; EPA USA: Washington, DC, USA, 2001. [Google Scholar]
  44. Rubino, M.C. Policy considerations for marine aquaculture in the United States. Rev. Fish Sci. Aquac. 2023, 31, 86–102. [Google Scholar] [CrossRef]
  45. Yokoyama, H. Environmental quality criteria for aquaculture farms in Japanese coastal areas: A new policy and its potential problems. Bull. Natl. Res. Inst. Aquacult. 2000, 29, 123–134. [Google Scholar]
  46. European Commission. Strategic Guidelines for a More Sustainable and Competitive EU Aquaculture for the Period 2021 to 2030; European Commission: Brussels, Belgium, 2021. [Google Scholar]
Figure 1. Location of the study area in the Bohai Rim Region, China.
Sustainability 17 04063 g001
Figure 2. Characteristics of mariculture yield and type in the Bohai Rim Region from 2014 to 2023. (a) Mariculture yield; (b) proportions of mariculture taxa in three provinces and one city.
Sustainability 17 04063 g002
Figure 3. Overview of mariculture pollution in the Bohai Rim Region: (a) TN; (b) TP; (c) NH3–N; (d) COD.
Sustainability 17 04063 g003
Figure 4. Spatial-temporal distributions of the (a) TN, (b) TP, (c) NH3–N, and (d) COD emission fluxes of mariculture in the Bohai Rim Region from 2014 to 2023.
Sustainability 17 04063 g004
Figure 5. Characteristics of the impacts of mariculture taxa on pollutant emissions: (a) TN; (b) TP; (c) NH3–N; (d) COD.
Sustainability 17 04063 g005
Figure 6. Decomposition of the driving factors of changes in mariculture pollution from 2014 to 2023.
Sustainability 17 04063 g006
Table 1. Discharge coefficient of the mariculture varieties in Bohai Rim Region (unit: g kg−1).
Mariculture TaxaMariculture
Species
TNTPNH3-NCOD
FishPseudosciaena crocea4.590.680.9934.23
Paralichthys spp.5.870.500.000.55
Pleuronectes platessa5.870.501.180.55
Oncorhynchus mykiss15.011.990.001.87
Fugu rubripe1.99~48.680.45~5.630.09~0.313.80~13.36
Lateolabrax japonicus0.78~68.0316.270.9539.64
Tetraodontidae1.990.450.313.80
Paralichthys olivaceus0.47~17.590.04~1.430.01~0.770.46~4.89
Grouper 1.70~5.870.21~0.500.070.55~1.75
CrustaceanPenaeus monodon0.270.070.012.62
Penaeus vannamei1.39~4.490.46~0.880.01~0.9712.88~42.96
Penaeus japonicus0.270.070.012.62
Penaeus chinensis0.270.070.012.62
Portunus spp.1.99~3.600.38~1.270~1.441.55~5.4
ShellfishHaliotis discus hannai0.74~2.51−0.08~0.960.02~0.07−0.01~8.12
Sinonovacula constricta−0.10−0.010.00−1.64
Ruditapes philippinarum−0.10−0.010.00−1.64
Scapharca subcrenata−0.10−0.010.00−1.64
Babylonia areolata0.760.000.092.22
Magallana gigas−0.17−0.010.00−7.24~0.02
Argopecten irradians−0.17~0.74−0.01~0.160~0.07−7.24~2.18
Mytilus edulis−0.17−0.010.00−7.24~0.02
OthersApostichopus japonicus0.74~10.940.05~1.740.01~0.343.09~15.76
Echinoidea1.30~10.940.2~1.740.01~0.348.78
Rhopilema esculentum1.950.241.5314.46
Others3.53~23.040.76~4.680.00~3.410.02~20.40
Table 2. Concentrations of mariculture tailwater pollutants in the discharge standards of three provinces and a city in the Bohai Rim Region (unit: mg L−1).
NameTNTPNH3–N COD
Tianjin8.0 (10.0) 0.8(1.0) 2.020
Hebei8.01.020
Shandong6.01.020
Liaoning8.01.020
① With the exception of Tianjin, the concentration of NH3—N is not included in the standards of the other three provinces. Therefore, the concentration of NH3—N was replaced by the Tianjin standard of 2.0 mg L−1 when the pollution load was calculated. ② The concentration in parentheses is the standard for the circulating water process in Tianjin. This concentration is only within Tianjin’s standard. As the effluent discharge of circulating water mariculture methods accounts for only 20% of that of traditional methods, this situation is ignored in the statistical process.
Table 3. Mann–Kendall significance test results for equivalent standard pollution load of pollutants.
NameTNTPNH3-NCOD
Tianjin0.490 0.059 0.490 0.4902
Hebei0.003 0.003 0.007 0.0099
Shandong0.219 0.014 0.014 0.0025
Liaoning0.697 0.219 0.219 0.3576
Disclaimer/Publisher’s Note: The statements, opinions and data contained in all publications are solely those of the individual author(s) and contributor(s) and not of MDPI and/or the editor(s). MDPI and/or the editor(s) disclaim responsibility for any injury to people or property resulting from any ideas, methods, instructions or products referred to in the content.

