Article

Be Smart, but Not Humanless? Prioritizing the Improvement of Service Attributes in Smart Hotels Based on an Online Reviews-Driven Method

by
Zeyu Chen
1,
Stephanie Hui-Wen Chuah
2,* and
Kandappan Balasubramanian
1
1
School of Hospitality, Tourism, and Events, Taylor’s University, Subang Jaya 47500, Selangor, Malaysia
2
Faculty of Economics and Management, Universiti Kebangsaan Malaysia, Bangi 43600, Selangor, Malaysia
*
Author to whom correspondence should be addressed.
Sustainability 2025, 17(9), 4036; https://doi.org/10.3390/su17094036
Submission received: 24 March 2025 / Revised: 27 April 2025 / Accepted: 29 April 2025 / Published: 30 April 2025

Abstract

Although integrating smart technologies into service encounters can provide hoteliers with a competitive advantage, managing customer satisfaction in smart hotels remains challenging due to limited knowledge of how to prioritize improvements across smart service and traditional service. Therefore, the study aims to evaluate customer satisfaction with both smart and non-smart technology attributes in smart hotels, identify attributes with high improvement priorities, and uncover factors contributing to customer dissatisfaction. This study proposes a prioritization method for service improvement in smart hotels by analyzing online reviews from 42 smart hotels. The findings reveal that customers’ technological needs are well met in smart hotels, but smart hotels need to promptly address three key issues: long check-in wait times, staff attitude and competence, and breakfast quality. To maximize customer satisfaction, managers should adopt a hybrid service model that strikes the right balance between technology and human interaction.

1. Introduction

As the typical scenario for the application of smart technologies, smart hotels have emerged as a trendy accommodation option [1,2]. Compared to traditional human-staffed hotels, smart hotels can deliver convenience and unique interactive experiences to customers [3]. For instance, upon arrival at smart hotels, guests are assisted by service robots to check in through self-service kiosks or facial recognition, and then enter their rooms through the keyless system [4,5]. During their stay, they can use smart speakers or AI assistants to control room settings such as lighting, temperature, and entertainment systems, offering a more personalized experience [5,6]. In addition, smart hotels offer significant advantages in terms of operations, revenue [7,8], and sustainability [9]. Smart technologies are recognized as critical enablers for advancing eco-efficient innovations [9], which can help to monitor energy and water consumption [10], and improve operational efficiency [11]. These advancements align directly with SDG 9 (industry, innovation, and infrastructure), while also extending to SDG 11 (sustainable cities and communities) via the promotion of resource-efficient buildings and SDG 12 (responsible consumption and production) [9].
Meanwhile, with the development of the Internet and the rise of digital platforms, online reviews have become a major source of information for managers to understand customers’ needs and satisfaction [12,13]. Prior studies on smart hotels have capitalized on online reviews to gain customer insights, but they focus predominantly on customers’ perceptions of smart technologies and the association between these smart technologies and customer satisfaction [14,15]. Smart services and amenities are becoming an important attribute for hotel choice [16], but customers’ experience of other non-smart attributes should not be ignored. To set the right priorities in customer satisfaction management, the satisfaction and improvement prioritization of different attributes must be well understood [17]. Therefore, it is critical to understand the relative performance and importance of both smart and non-smart service attributes in smart hotels.
The purposes of this study are to evaluate customer satisfaction with both smart and non-smart technology attributes in smart hotels, identify attributes with high improvement priorities, and uncover factors contributing to customer dissatisfaction. Therefore, this study proposed a smart hotel service improvement prioritization method based on online reviews. Specifically, (i) 16,964 online reviews of four famous smart hotel brands, including 42 smart hotels, were collected from two popular Chinese online travel agency (OTA) platforms, namely Ctrip and Qunar; (ii) the service attributes of the smart hotels were identified using the topic modeling technique LDA; (iii) a sentiment analysis was implemented to obtain the customer satisfaction/dissatisfaction level of the smart hotel attributes; (iv) the opportunity algorithm was used to quantify the improvement benefits of different attributes, and an opportunity landscape map was drawn to show the improvement priority order; (v) finally, by mining the co-occurrence relationship between sub-attributes and negative-sentiment words and conducting a link analysis, effective service improvement strategies for smart hotels were formulated to enhance customer satisfaction.

2. Literature Review

2.1. Smart Hotels

Smart hotels refer to hotels that leverage cutting-edge information and communication technologies (ICTs) and artificial intelligence (AI) into their service concepts to enhance customer experiences [15,18]. The previous literature on smart hotels has spent considerable effort exploring the factors that influence customers to adopt smart hotel products or visit smart hotels. For instance, Kim and Han’s [19] findings suggest that both perceived ease of use and perceived usefulness of technology in smart hotels have a positive impact on customer attitudes, which in turn lead to favorable behavioral intentions. Unlike Kim and Han’s [19] findings, Yang et al. [18] found that perceived usefulness has a positive effect on visit intention, while perceived ease of use has a negative effect on visit intention. Yang et al. [18] suggested that one reason for this difference is that the majority of respondents in their study were young and early-middle-aged, with young to early-middle-aged customers choosing smart hotels because they were more eager to try out smart amenities that were new, complex, and difficult to use. In contrast, the respondents in Kim and Han’s [19] study were middle-aged and older customers who preferred easy-to-use and practical smart amenities. Besides that, the respondents of Yang et al.’s [18] study were Chinese travelers, while the vast majority (84.6%) of Kim and Han’s [19] study respondents were Caucasian/White in the US. Therefore, another possible reason for the gap in respondents’ attitudes toward smart technologies between the two studies is cultural differences [20]. For example, for people from low-context cultures (e.g., Europeans and Americans), communication tends to be explicit, so they rely more on the direct and easily understandable verbal expressions of the service robot. But people from high-context cultures (e.g., Asians) expect to see more contextual cues, such as the body language of the service robot [21,22].
Recent studies have further explored the impact of smart attributes on customer experience in smart hotels. Kim and Han [23] identified four key functional attributes of smart hotels: convenience and control, maintenance and security, contactless environment, and personalization as having an important role in customer experience. Yan et al. [24] used a mixed-method approach to analyze the drivers of choosing smart hotels from the perspective of silver travelers (over 50 years old). Their study found that security and personalization were still important for silver travelers. However, perceived convenience had a negligible effect on the attitudes of silver travelers, which may be because older adults no longer value convenience after getting used to using smart devices over time, while emphasizing other factors. Dai et al. [25] then extended the characterization of smart attributes through qualitative analysis by expanding the perspective to two emotional dimensions, namely hedonic and trendiness. They found that under the influence of the epidemic, customers paid more attention to these two emotional dimensions than the above four functional attributes.
Although the above literature has provided the necessary foundation for understanding customers’ antecedents of their behavioral intentions and service experiences in smart hotels, most studies have focused on attributes related to smart technologies while ignoring the customers’ experience of other service attributes in smart hotels. However, customers’ responses to hotel stays are driven by all the service experiences they accumulate during their stay, which means that they take a comprehensive approach to the entire journey when evaluating their hotel stay [26]. Therefore, while smart service experience is important for customers, understanding customers’ evaluations of other non-smart attributes such as price and food is also indispensable for improving services and increasing customer satisfaction in smart hotels.

2.2. Service Attribute Improvement Priority

Customer satisfaction is defined as an overall assessment of product or service attributes by customers [27]. As customers’ expectations vary across market segments, the importance of different types of hotel attributes and their impact on satisfaction are also different [27,28]. To gain a competitive edge in the fiercely competitive market, prioritizing service attributes is an important way for managers to improve services [17,29]. Prioritizing service attributes can facilitate the rational allocation of resources, improve key attribute performance, and maximize customer satisfaction [30].
In this research, the opportunity algorithm is employed to determine the strategy for improving smart hotel attributes from the customers’ perspective. The opportunity algorithm was originally proposed by Ulwick [31] alongside the outcome-driven innovation (ODI) methodology. It uses importance and satisfaction as two factors to compute an opportunity score on a scale of 0–10. Ulwick posits that innovation opportunities arise when a need is important but not well satisfied; the opportunities for value creation increase as the importance of the need arises and customer satisfaction decreases. These opportunities enable commercial organizations to defend customer loyalty by closing the loyalty gap between merely satisfied and fully satisfied customers [17]. Consequently, the needs that are most important but least satisfied are given the highest priority [32].
Compared to other methods, the opportunity algorithm evaluates both the importance of attributes and their performance and further provides a quantitative opportunity score to determine the priority of attribute improvements [17]. This algorithm identifies attributes perceived as highly important but associated with low satisfaction levels. Additionally, it detects attributes where resources have been overly invested [32]. When consumers perceive certain attributes as unimportant but are highly satisfied with them, this situation may present an opportunity to reallocate resources from these attributes to those with greater importance and lower satisfaction [29].

2.3. Text Analysis of Online Reviews

The online reviews, as a representative form of user-generated content (UGC), provide genuine expressions of customers’ experiences and sentiments following their consumption of products and services. These reviews serve multiple purposes: assisting potential consumers in making informed purchase decisions and enabling managers to identify key attributes influencing satisfaction levels [33]. Studying these reviews can provide novel insights into service attributes that have been widely explored in the hospitality industry [17,34]. However, as online reviews are unstructured textual data with fuzziness and randomness, they first need to be converted into analyzable data [12]. More and more scholars have shown considerable interest in text analysis techniques of online reviews, with a primary focus on attribute extraction and sentiment analysis [12,35].

2.3.1. Attribute Extraction

Attribute extraction refers to identifying topics and commonly mentioned topic-related keywords within online reviews [36]. It aims to extract the attributes that customers care about from online reviews by analyzing them and laying the foundation for subsequent sentiment analysis. The attribute extraction methods can be categorized into rule-based and statistical-based methods [37]. Compared to statistical-based methods, rule-based methods have the advantage of not relying on corpus construction and are more efficient in extracting product attributes [35]. However, the rule-based approach requires significant human involvement and may not be flexible enough. In addition, it ignores the indirect dependency between product features and viewpoint words, leading to the loss of recall [35].
Therefore, this research uses a topic modeling technique, namely LDA, to extract the hotel attributes. Topic modeling is a statistical model that can be used to understand the distribution of topics per online review and the distribution of words per topic [38]. LDA is the most common approach to topic modeling [39]. Essentially, LDA assumes that the words in each review are drawn independently from a bag, each containing a set of words. Each bag contains words extracted from a vocabulary, i.e., a distribution of topic words. Topics may be shared by all comments. Each comment will have its proportion of topic mixtures. Topic modeling using LDA can discover potential topics from large amounts of unstructured text data (big data) [40,41]. Compared to other techniques like the probabilistic latent semantic analysis (PLSA) and Gibbs Sampling Dirichlet Multinomial Mixture (GSDMM), LDA provides enhanced scalability, improved interpretability, and quicker training processes [42]. By applying LDA to a given set of online reviews, researchers can obtain the distribution of topics in each review and the distribution of words within each topic, thus inferring the main topics of online reviews [39,43].

2.3.2. Sentiment Analysis
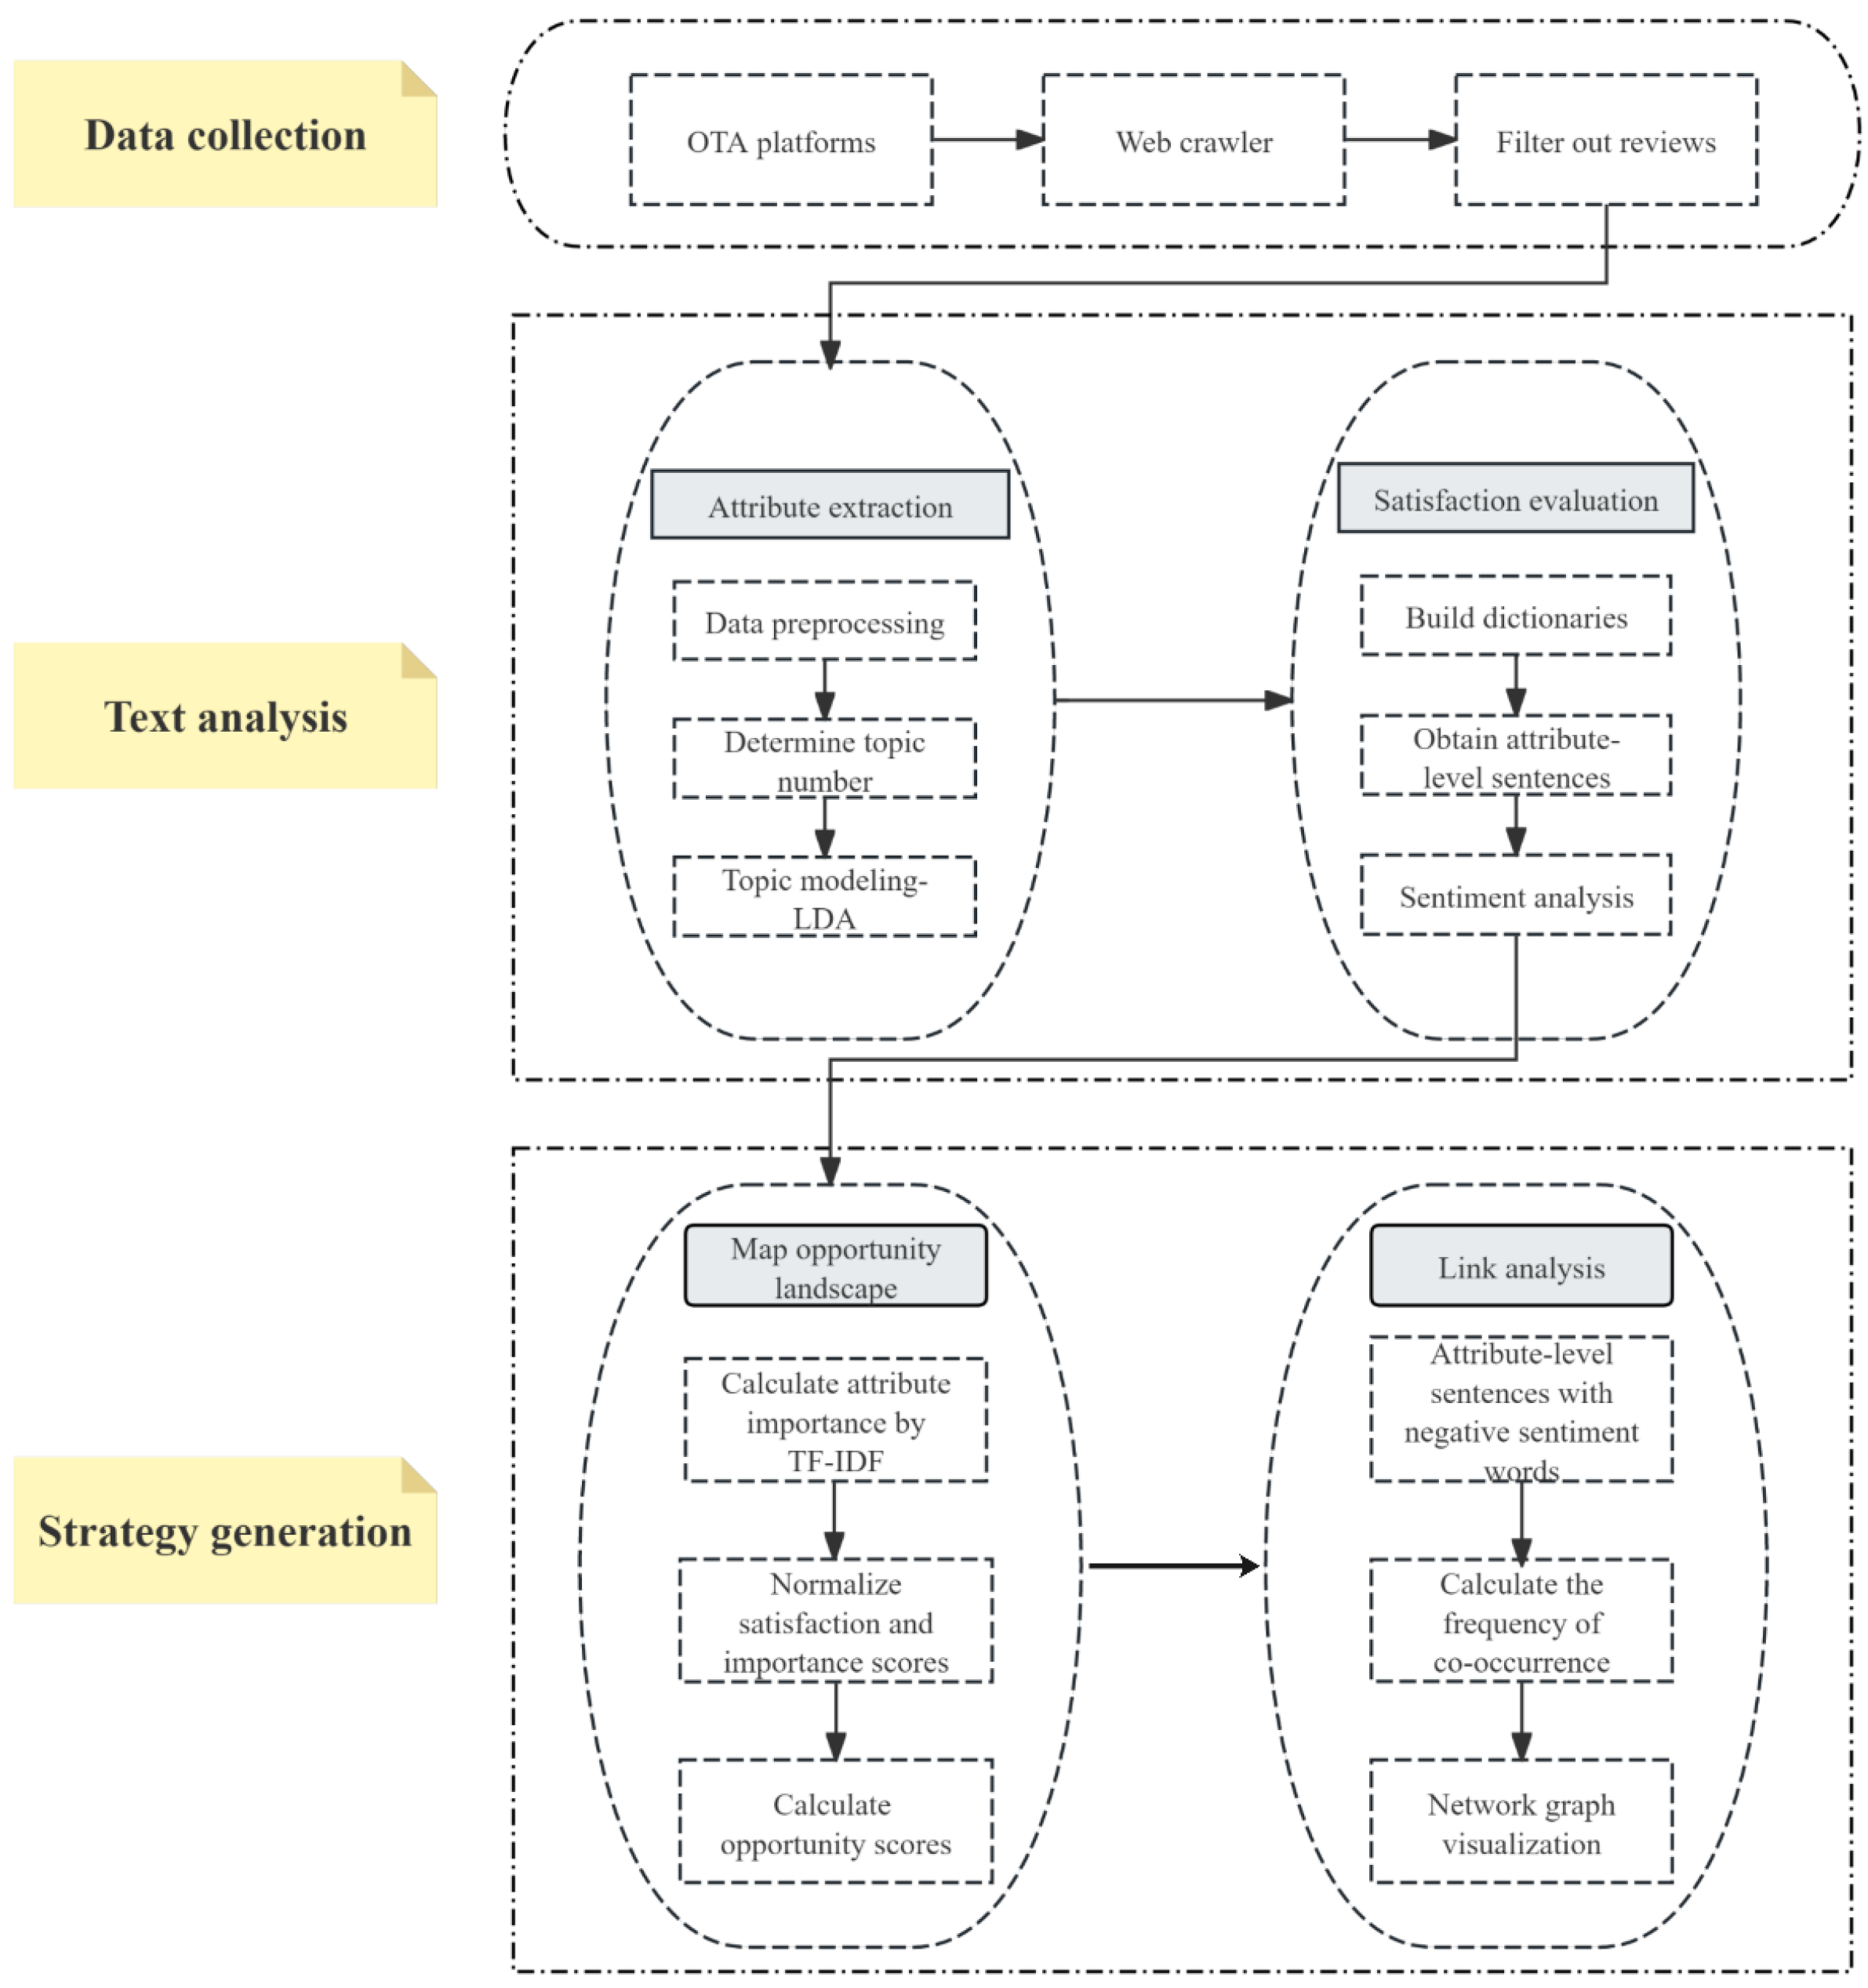
Although the attribute extraction technique helps to identify key service attributes, it cannot reflect the customers’ actual perceptions [44]. Therefore, sentiment analysis is used to mine the sentiment information to help managers gain a comprehensive understanding of customer satisfaction/dissatisfaction with product or service attributes [13,45]. Liu and Zhang [46] stated that the computational study of people’s opinions, appraisals, attitudes, and sentiments towards entities, individuals, issues, events, topics, and their attributes is referred to as sentiment analysis or opinion mining.
For a long time, the accuracy and applicability of sentiment analysis methods have presented significant challenges [47]. Existing research suggests that machine learning methods trained with specific features on specific datasets can provide more successful sentiment recognition [48], but it requires a large body of data and extensive training to provide the machine learning model with sufficient examples for learning [49,50]. Smart hotels, as an emerging field, may not be able to collect enough reviews from them for training machine learning algorithms. Moreover, machine learning has limitations in extracting semantic relationships within the context of words [50], while the dictionary-based approaches incorporate both lexical and syntactical details of linguistic content to refine sentiment valence. This means that the negation, intensification, and rhetorical functions of text segments are considered during sentiment scoring [51]. In summary, using a dictionary-based sentiment analysis approach is more suitable for this study.

3. Methodology

3.1. Research Framework

In this section, a conceptual framework is proposed to provide detailed service improvement strategies for smart hotels. As shown in Figure 1, the framework consists of three main parts, which are composed of five steps: in the first step, online reviews are collected and preliminarily filtered; in the second step, smart hotel service attributes and attribute feature words (sub-attributes) are extracted by using the topic modeling technique LDA; in the third step, customer satisfaction is evaluated by a dictionary-based sentiment analysis; in the fourth step, the attribute importance is computed by TD-IDF and combined with the opportunity algorithm to obtain the opportunity score, thereby mapping the opportunity landscape; and in the fifth step, the factors leading to customer dissatisfaction are further revealed through link analysis.

3.2. Data Collection

To obtain the most representative data for this study, we selected popular OTA platforms (Ctrip and Qunar) as data sources and used web-scraping software to extract online travel reviews. Ctrip (http://www.ctrip.com) and Qunar (http://www.qunar.com) are both well-known OTA platforms and have frequently been used as data sources in similar studies [52,53,54]. Ctrip is the largest online travel agency in China [55], allowing customers to share their authentic experiences, opinions, and comments about hotels and destinations. The platform strictly verifies that only consumers who have stayed at the hotels can rate and comment, removing any irrelevant or manipulated reviews. Qunar is one of the most popular travel platforms in China with more than 600 million users and it requires that only real consumers who have stayed at the hotel can rate and comment [53]. These stringent measures ensure the authenticity and objectivity of the reviews on Ctrip and Qunar, making these two platforms become reliable sources for data collection in this study.
In this study, the online reviews of a total of 42 smart hotels, including four representative smart hotel brands, i.e., Flyzoo (1), Lyz (4), Henn-na (22), and Yotel (15), were used as samples. These four hotel brands were chosen because they are widely recognized as smart service providers in the hotel industry and have frequently been selected as representative samples in high-tech hotel studies [5,14,56,57]. Table 1 contains their geographical distribution.
In May 2024, 16,964 initial online reviews were collected from Ctrip and Qunar through a reliable data-crawling software, namely Octopus [44]. The initial online reviews were then screened in the following three ways: (i) duplicate reviews were removed, (ii) reviews automatically given by the platform system, e.g., “user has rated it positively”, (iii) reviews with fewer than two Chinese words were deleted as they usually did not provide useful information. Finally, we obtained 16,744 online reviews for data analysis.

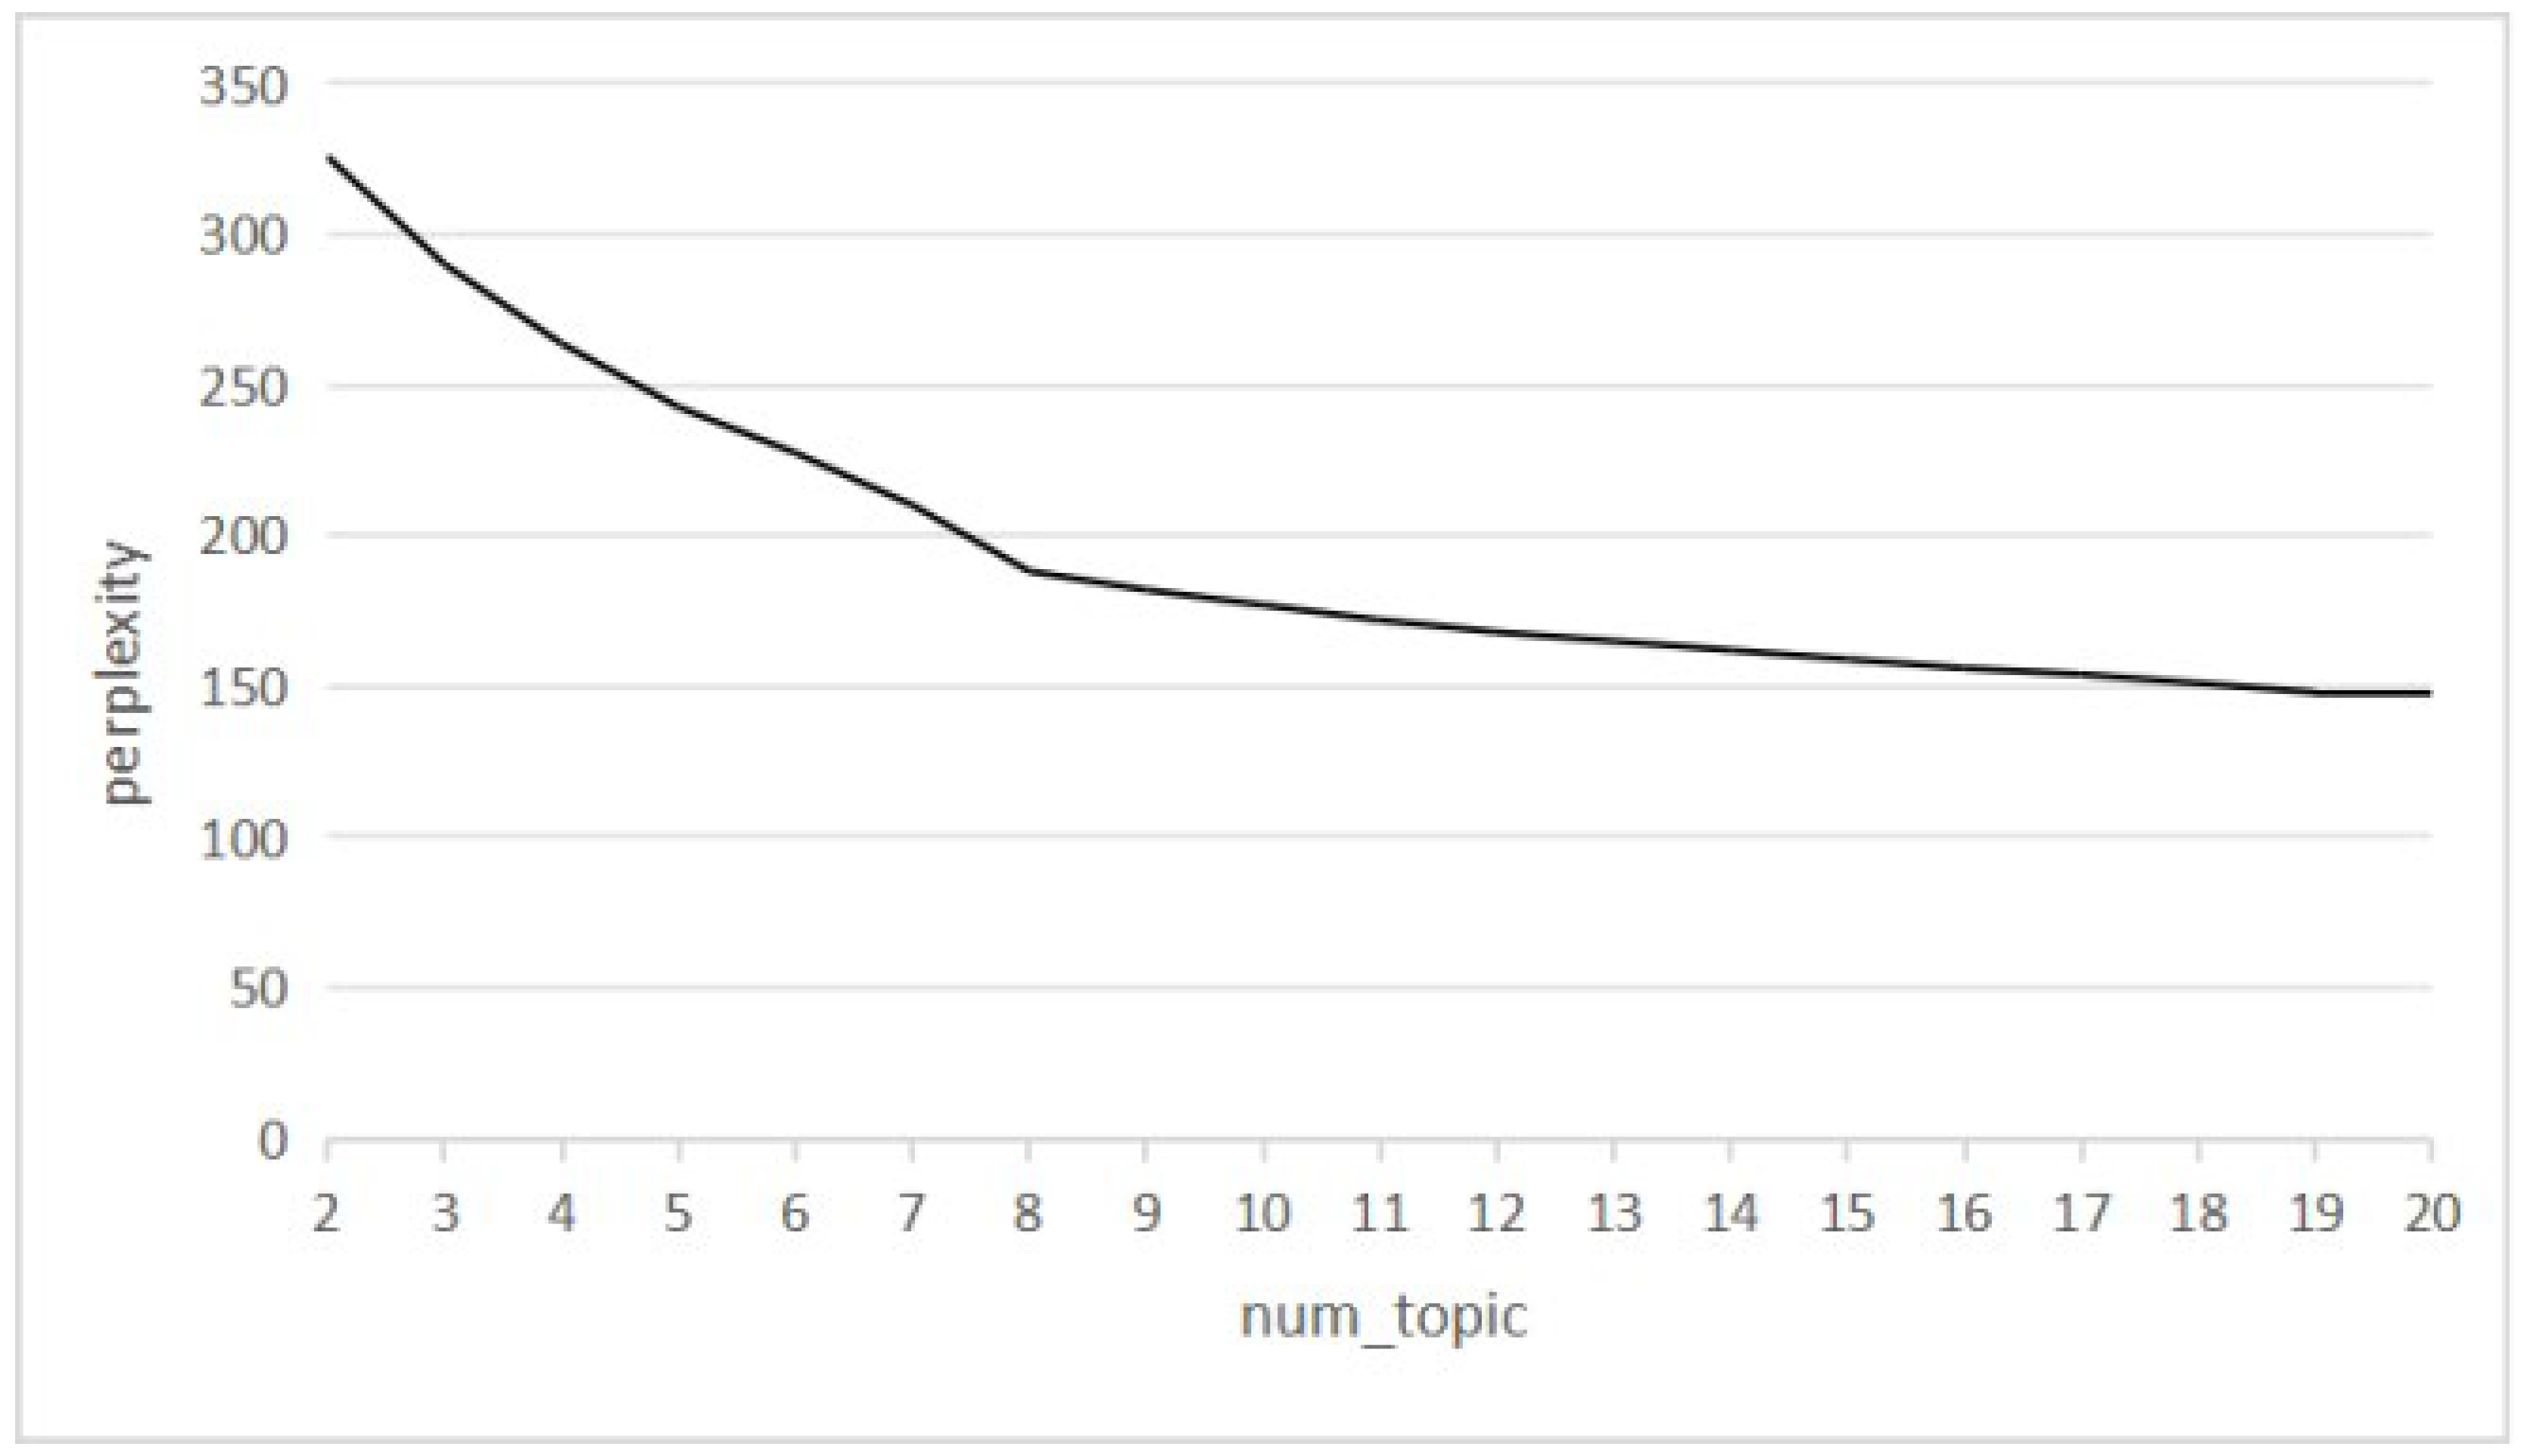
3.3. Topic Modeling Approach

This study applied a topic modeling tool, LDA, to identify the smart hotel attribute and the corresponding feature words of the attributes from the review dataset. With the LDA approach, researchers can quickly discover themes (i.e., attributes that affect hotel customer satisfaction) from a large number of documents (i.e., online reviews). The LDA model is implemented by using the Gensim module in Python3.10.
Before using LDA for topic modeling, we performed the following two steps: preprocessing of data and determination of the number of topics. The online review preprocessing consisted of three parts: word segmentation, part-of-speech tagging (POST), and word removal. To improve the quality of the topics and the accuracy of the model, we also removed terms that appeared in more than 80% of the comments. This is because terms that occur too frequently cannot be used to distinguish topics [58], and they also increase the computational effort required to run the program [59,60]. Python’s Jieba library was used to implement text preprocessing.
When using LDA for topic modeling, the number of topics needs to be given in advance [61]. The results of LDA model clustering are strongly influenced by the number of topics. Too many topics will result in many topics with no obvious semantic pointers, and vice versa with multiple layers of semantic information overlaid on top of each other [62]. This study uses perplexity as an evaluation metric to determine the appropriate number of topics. Perplexity is a common metric used in topic modeling to evaluate how well the model fits a given dataset [63,64,65,66]. Theoretically, the lower perplexity score signifies improved generalization performance [39]. However, the perplexity value will decrease when the number of topics increases, leading to topic redundancy and complicating subsequent analysis. Thus, the number of topics is determined by the inflection point on the line chart in practice [67,68].

3.4. Dictionary-Based Sentiment Analysis

This research adopts a dictionary-based sentiment analysis to explore customers’ satisfaction and dissatisfaction with smart hotel attributes. There are many publicly available sentiment dictionaries for Chinese texts, e.g., the HowNet sentiment dictionary, Li Jun’s commendatory and derogatory dictionary of Tsinghua University, and the National Taiwan University sentiment dictionary (https://github.com/ppzhenghua/SentimentAnalysisDictionary) (accessed on 30 May 2024). However, online reviews contain a lot of sentiment words in the field of smart hotels, such as ‘futuristic’ and ‘effortless’. Therefore, we decided to build a sentiment dictionary based on the HowNet sentiment dictionary that can be used to filter the sentiments contained in customers’ online reviews of smart hotels. In the study, we found that there are 93 duplicates in the sentiment dictionary of the HowNet sentiment dictionary, so we first de-emphasized them. Secondly, considering that hotel reviews are mostly expressed as nouns, adjectives, and adverbs [69], we implemented recognition and counted word frequencies for the word items labeled as the above lexical properties in the corpus. On this basis, the reference to Li Jun’s commendatory and derogatory dictionary of Tsinghua University supplements the HowNet sentiment dictionary with 492 new commendatory words and 991 new derogatory words. The final complete sentiment dictionary for smart hotels contains 9059 positive words and 8639 negative words.
In addition to improving the accuracy of sentiment orientation to the online reviews, the consideration of degree words and negation words is also important because these words affect the sentiment value [12,70]. Degree words refer to words that do not have an emotional tendency by themselves but can enhance or diminish the intensity of emotion. The HowNet degree word dictionary classifies degree words into six levels, namely, most, over, very, more, -ish, and insufficient, totaling 220 words. Each degree adverb in the dictionary is assigned a modification weight based on its effect of strengthening or weakening. To be specific, degree adverbs like very, too much, and extremely are assigned a modification weight of 2 as they amplify the sentiment intensity of sentiment words. Conversely, adverbs like slightly, a little, and a bit weaken the sentiment intensity, thus receiving a modification weight of 0.5. In summary, modification weights are assigned to the degree adverbs by their impact on sentiment strength. Negative adverbs such as no, not, never, and seldom can reverse sentiment orientation. Hence, their modification weights are set to −1. We merged several negative dictionaries and collected a total of 91 negative adverbs.
After building the sentiment word dictionary, the degree adverb dictionary, and the negative adverb dictionary. We referred to the work of Hu et al. [71], cutting online reviews into sentences, and then matching the sentences with attribute feature words to determine which attribute they belong to obtain attribute-level sentences. Finally, according to the following Equation (1), the sentiment score of the attribute feature word t i is calculated, where t is the number of negation words; degree(k) is the weight of degree word k; and sen(j) is the sentiment value of sentiment word j.
S e n t i = j n 1 t d e g r e e k s j

3.5. Opportunity Algorithm

In this step, the opportunity algorithm is used to combine the importance and satisfaction scores of hotel attributes to evaluate their opportunity potential and generate an opportunity landscape map. The attribute satisfaction is obtained through the sentiment analysis in the previous step, while the attribute importance is calculated by using the Term Frequency–Inverse Document Frequency (TF-IDF) algorithm. The TF-IDF algorithm serves as an effective technique for determining the importance of attributes within the hotel sector [66]. It adeptly eliminates non-essential words while pinpointing the key aspects that are most valued by individuals. The importance of each sub-attribute ti to a customer can be calculated by the equation below.
T F I D F t i = T F I D F = n i , j k n k , j l o g D j : t l d j + 1
For the opportunity score calculation, we also need to normalize the sentiment scores (satisfaction) and TF-IDF scores(importance) of all sub-attributes [72]. According to the opportunity algorithm, hotel attributes that are most important but least satisfied present the highest improvement opportunity. Equations (3) and (4) illustrate how to normalize the satisfaction and importance of the sub-attribute, and finally, the opportunity score of each sub-attribute can be calculated by Equation (5).
S a t i s f a c t i o n t i ¯ = S e n t i S e n M i n S e n M a x S e n M i n
I m p o r t a n c e t i ¯ = T F I D F t i T F I D F M i n T F I D F M a x T F I D F M i n
O p p o r t u n i t y t i = I m p o r t a n c e t i ¯ + M a x I m p o r t a n c e t i ¯ S a t i s f a c t i o n t i ¯ , 0

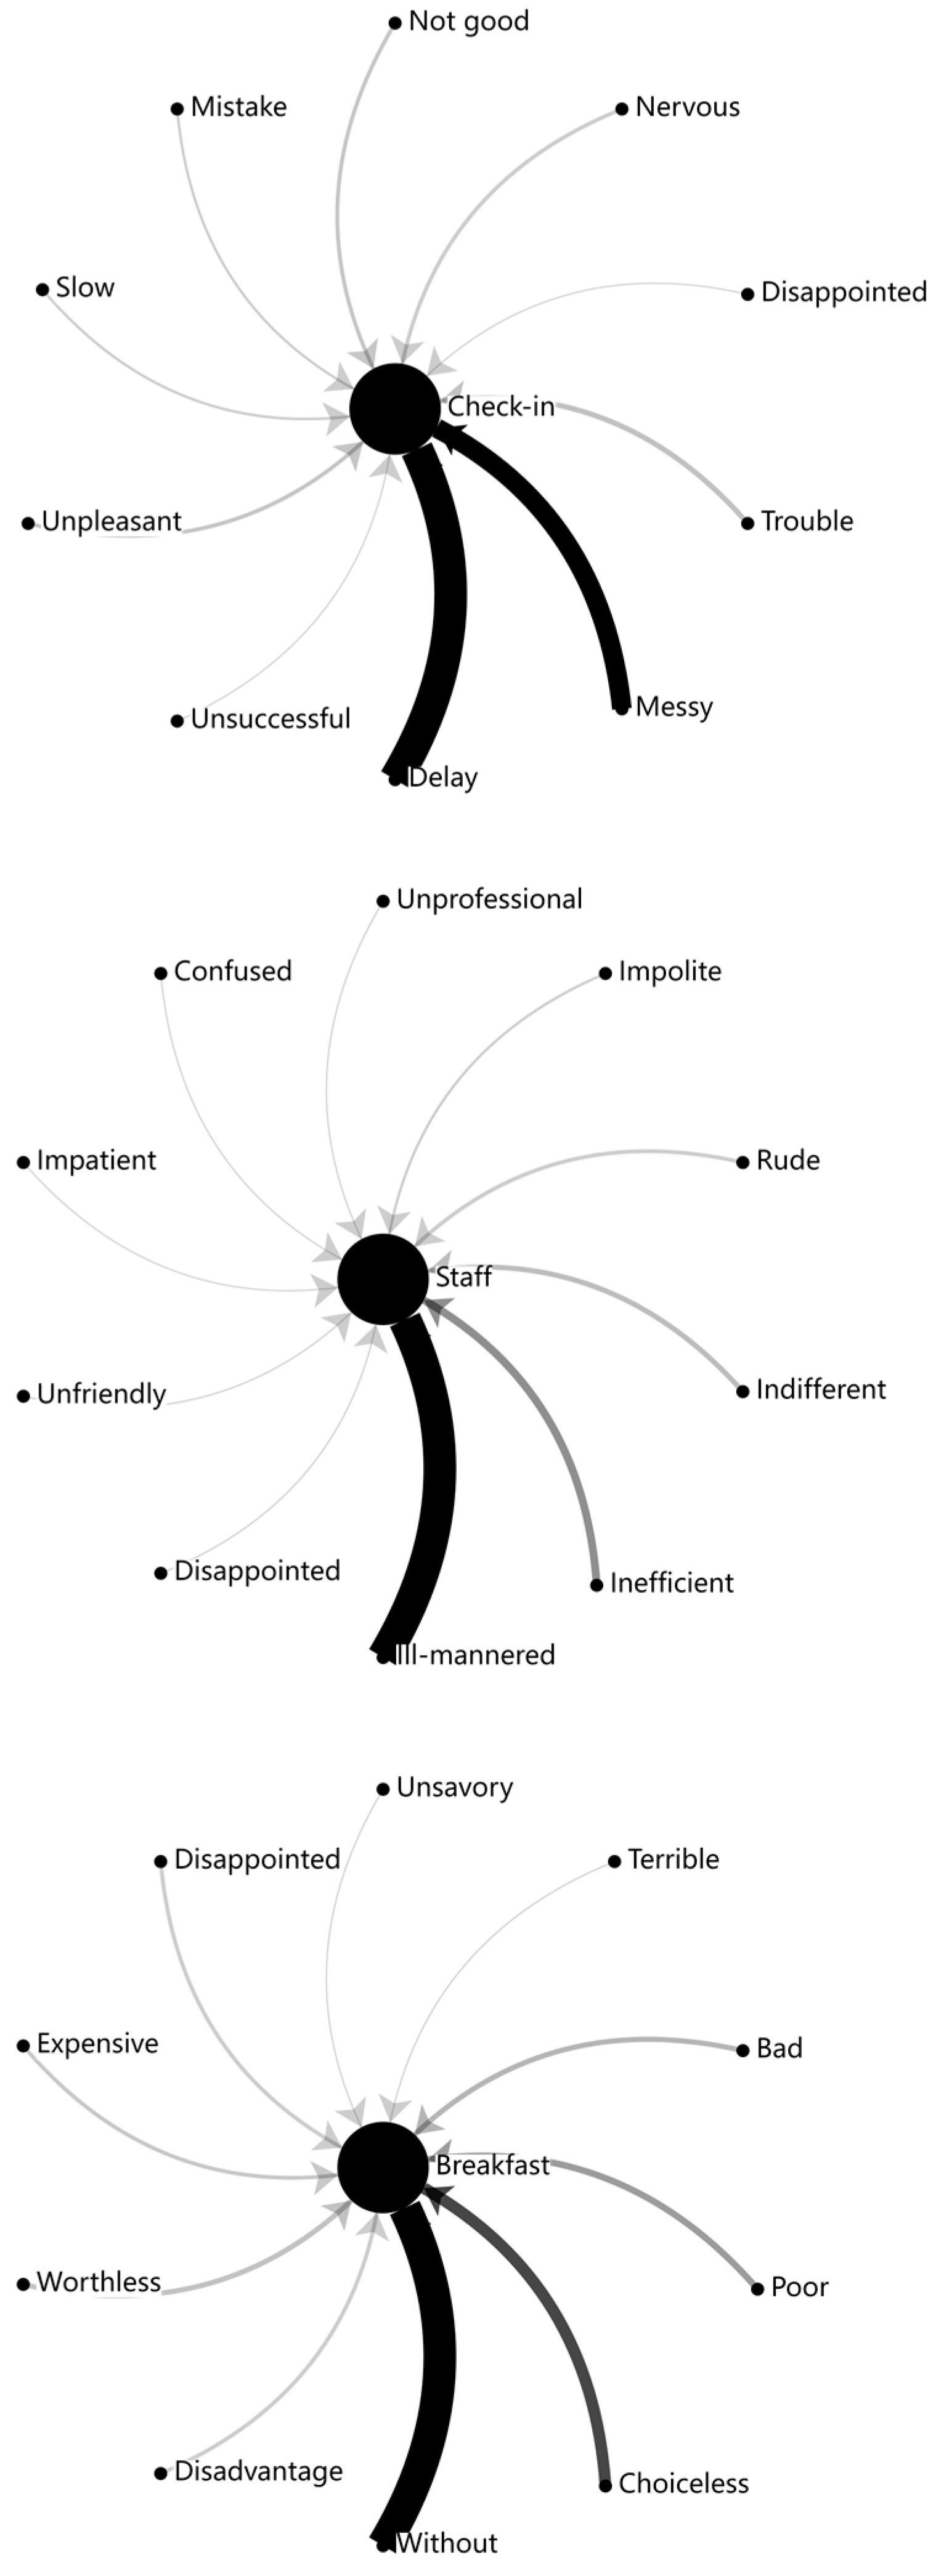
3.6. Link Analysis of Dissatisfaction Factors and Hotel Attributes

The opportunity algorithm can quantify the improvement benefits of different attributes to specify a prioritization strategy. However, to develop specific service improvement strategies, we also need to identify the reasons for customer dissatisfaction. Therefore, this section mines the co-occurring relationships between attribute feature words and negative sentiment words and constructs a link analysis to determine which factors contribute to customers’ negative sentiment towards this attribute.
Link analysis can visualize the linking relationships between multiple words and terms as well as the strength of the links [72]. The frequency of co-occurrence of attribute words with sentiment words is counted by iterating over reviews containing attribute feature words, and finally, the links between sentiment and attribute words are visualized through a network graph.

4. Findings

4.1. LDA Results

With the method proposed in Section 3.3, perplexity was computed for topic counts ranging from 2 to 20, with topic models with 8 topics obtaining the most favorable perplexity scores from the comment set, as shown in Figure 2. LDA allows feature words to overlap between topics, i.e., high-frequency feature words can appear on more than one topic [12,39]. Therefore, the output may contain some similar topics or noise words, and the final topics and related feature words need to be manually adjusted [12,43]. For each topic, 10 feature words with high frequency were selected as sub-attributes, and the naming of the topic was based on the semantic relationship between these feature words. One researcher performed the initial naming of each topic and then confirmed by another researcher [40,61]. The final topics are the hotel attributes that managers need to focus on, while the feature words under the attributes are the customers’ 10 most concerned sub-attributes [12]. Table 2 illustrates the attributes of smart hotels and the corresponding sub-attributes.

4.2. Computing Satisfaction Degree of Smart Hotel Attributes

After building the dictionaries, the satisfaction degree of each sub-attribute is calculated by performing sentiment analysis. Since some comments involve multiple sub-attributes, the study divided the comments into attribute-level sentences to improve the accuracy of sentiment analysis. We retained the comments containing the sub-attributes and finally collected 45,209 sentences. According to Liu et al. [49], a review is considered positive when the sentiment score is greater than 0, and the higher the score, the higher the customer satisfaction. If the sentiment score of a review is less than 0, the review is labeled as negative, and the lower the score, the higher the level of customer dissatisfaction. A neutral review indicates that the review’s final positive score is equal to the negative score or that no sentiment words were identified. According to the above rules and Equation (1) in Section 3.4, the number of positive and negative comments and average sentiment scores for the sub-attributes under each attribute can be found in Appendix A.1. Table 3 shows the number of positive and negative comments for each attribute, as well as the average sentiment scores.
By calculating the sentiment scores for the attribute-level sentences, we can obtain the number of positive and negative comments under each attribute and the satisfaction level (average sentiment score) for each attribute. As shown in Figure 3, the Human Service attribute received both the most positive and negative comments. The Smart attribute, which is distinct from the traditional hotel attributes, did not gain lots of reviews and only ranked fifth. But its proportion of positive reviews ranked second among all attributes, and combined with the data in Appendix A.1, the other smart sub-attributes had far more positive than negative reviews, except for the sub-attribute Dinosaur Robots.

4.3. Improvement Strategy Generation

4.3.1. Opportunity Landscape Map

Following the equations mentioned in Section 3.5, we calculated the opportunity scores of all sub-attributes and ranked them in order from highest to lowest (found in Appendix A.2) and then mapped the opportunity landscape of smart hotel attributes (Figure 4) by SPSS Statistics 27. The opportunity landscape map, derived from the importance and satisfaction values, is divided into three areas: served-right, over-served, and underserved. Needs in the served-right area are considered appropriately satisfied, those in the over-served area are deemed excessively satisfied, and those in the underserved area are viewed as less satisfied relative to their importance [32]. The reference points on the horizontal and vertical axes are the mean values of I m p o r t a n c e ¯ and S a t i s f a c t i o n ¯ .
According to the landscape map, three sub-attributes have high opportunity scores and are located in the under-served category: ‘check-in’, ‘staff’, and ‘breakfast’. Combined with the data from Table A2 (found in Appendix A.2), these 3 sub-attributes rank first, second, and fourth out of 80 sub-attributes in terms of importance to smart hotel customers, but the satisfaction performance is all just at the average level. Therefore, improvements in these three sub-attributes will help smart hotels generate more effective benefits, especially when resources are limited.

4.3.2. Specific Improvement Directions

Although three sub-attributes located in the under-served category were identified using the opportunity landscape map, there is still a need for specific improvement directions. Therefore, the link analysis method proposed in Section 3.5 is utilized to extract the negative sentiment words mentioned by customers for these three sub-attributes. As shown in Figure 5, the ten most frequent negative sentiment words mentioned by customers under these three sub-attributes are displayed, with the width of the line indicating the co-occurrence frequency.
The link analysis shows that for the sub-attribute ‘check-in’, which is under the Human-Service attribute, the long wait is the most dissatisfying sub-attribute for customers, with many customers commenting “The disadvantage is that check-in is a bit crowded, and delays are too long”, “check-in is too messy and the wait is too long”, and so on. Another sub-attribute ‘staff’ which is also under the Human Service attribute, has problems with the service attitude and ability. Customers reported that some staff in the smart hotels were ill-mannered and could not help when they had problems with the smart equipment. And for the ‘breakfast’ sub-attribute, the key issues for smart hotels are the absence of offering as well as limited options.

5. Discussion and Conclusions

5.1. Discussion

This study contributes to the existing literature on smart hospitality and tourism by extracting insights from online reviews of smart hotels from a customer perspective. The novel analytical framework proposed in this study can be a valuable tool for stakeholders to understand customers’ preferences and needs. Smart technologies can help hotels reduce the negative impact on the environment [10], but it is also necessary for smart hotels to meet customer expectations to ensure the long-term sustainability of the smart hotel industry [9]. The study’s findings are beneficial for managers in crafting effective and actionable service improvement strategies for smart hotels.
Through the LDA model, this study identified eight service attributes that matter to guests in smart hotels. It is worth noting that while smart hotels are known for their high-tech and automated services, they are not yet capable of being completely ‘unmanned’ in reality. Although smart technologies are gradually transforming hotel operations through automation, some traditional hotel attributes cannot be fully replaced by machines. As the results in Figure 3 indicate, the Human Service attribute received the most comments. This finding is consistent with previous research [22,73]; although tourists have a positive attitude toward the use of smart technology in the tourism and hospitality industry, a wide variety of occasions still require human service staff.
Next, sentiment analysis of online reviews effectively revealed the performance of smart hotels at the attribute level. While most smart services are praised rather than complained about by customers, managers still need to understand the double-edged sword effect of technology and remedy the failure of smart services in time [74,75]. As shown in Appendix A.1, the dinosaur robots at the front desk have the lowest ranking among smart technologies, with the number of complaints exceeding the number of positive comments. This suggests that managers should avoid using dinosaur robots at reception counters, as their appearance may mismatch with hospitality standards of professionalism and warmth, making some guests feel uneasy and unwelcome. This finding is also consistent with previous research [76], where the perception of robots’ warmth positively impacts customer value co-creation. Thus, robots that do not meet the standards in hospitality (e.g., hospitableness and warmth) will result in value co-destruction, which could harm the customer experience.
Finally, although previous studies have used online reviews to explore the factors that influence the customer experience in smart hotels [77,78], they have been unable to provide prioritization of improvements as well as provide actionable indicators of service improvement. According to the opportunity algorithm and the opportunity landscape map, this study identified three sub-attributes of smart hotels—namely, ‘check-in’, ‘staff’, and ‘breakfast’—that should be prioritized for improvement. The link analysis results identified specific factors that contribute to customer dissatisfaction, providing valuable insights for managers to develop targeted service improvement strategies. For example, customer dissatisfaction with the sub-attribute ‘check-in’ is mainly due to the long waiting times. With the development of various technologies in the hotel industry, long waits and slow responses are unacceptable to customers [33]. Therefore, smart hotels that have not yet been equipped with automated kiosks are urged to install them to optimize customer experience [57]. Moreover, managers should train employees on how to provide appropriate alternatives when faced with smart amenity failures, such as providing manual scanning when self-service kiosks are unable to recognize customer identification information, thereby compensating for smart service failures.

5.2. Theoretical Implications

First, this study extends customer satisfaction research in the context of smart hotels. While previous studies have primarily examined satisfaction with smart technology-related attributes and their link to overall satisfaction [14,15], they have largely overlooked customers’ experience with non-smart attributes in smart hotels. Effective implementation of smart technologies can significantly improve customer experience and satisfaction [79], while neglecting customers’ non-technological needs can lead to serious negative consequences. The findings of this study indicate that non-smart attributes are still important indicators for customers to evaluate the goodness of smart hotel services as well as influencing customer satisfaction. It also reveals a dire need for improvement in non-smart attributes, particularly the “human service” attribute.
Second, this study introduces a new domain-specific sentiment dictionary for the hospitality and tourism industry. By pre-generating the sentiment dictionary for the specific domain, sentiment analysis was performed on smart hotel reviews, providing insights into guest satisfaction with each attribute of the smart hotel. Hence, it makes a significant contribution to text analysis in hospitality and tourism research.
Finally, as one of the first studies to quantify the benefits of improving hotel attributes using the opportunity algorithm, this research provides smart hotel scholars with a novel quantitative approach for prioritizing service enhancements.

5.3. Managerial Implications

In addition to theoretical contributions, this study also provides practical insights that can be applied to managerial practices in smart hotels. This study analyzes customer-generated big data (online reviews) to gain insights into customers’ needs and satisfaction with smart hotel products and services, thereby improving service quality and meeting customer expectations. Analyzing online reviews can also enable hotels to optimize operations and reduce operational costs [80].
The findings reveal that even for well-known smart hotel brands, some of their smart hotels are not equipped with self-service kiosks, which has led to the dissatisfaction of many customers. Given that some non-smart hotels are already equipped with self-service terminals and mobile check-in, current smart hotels need to standardize their level of smartness, clarify their uniqueness and competitiveness, and highlight their advantages [81].
Our study’s findings also provide valuable guidance for smart hotel managers on resource allocation. While smart technologies such as self-service systems and robotics have positively impacted hotel financial performance [82], the initial investment required to implement these technologies, along with the additional update costs due to the rapid pace of technological change, presents a formidable financial challenge for hotel management. Therefore, when customers perceive a smart technology as unimportant but are highly satisfied with it, managers should reallocate resources from this technology to one of higher importance and lower satisfaction. Meanwhile, due to rapid technological development, the technological competencies of employees need to be adapted and updated, as it directly affects the competitiveness of hospitality organizations [83].
Moreover, to maximize customer satisfaction, managers should adopt a hybrid service model that strikes the right balance between technology and human interaction. For example, they can utilize smart check-ins, delivery robots, and voice assistants for room temperature control to enhance efficiency and convenience. On the other hand, human staff should remain available to provide appropriate customer service, such as addressing technical failures and offering emotional support.

5.4. Limitations and Future Research

First, although the data sources chosen in this research have a higher number of reviews from smart hotels located in Asia (e.g., Flyzoo and Henn-na) compared to Western travel platforms such as Tripadvisor, the results of the study may vary across cultures because Ctrip and Qunar are both Chinese travel platforms. Previous research has demonstrated that customers from different cultures have different expectations and attitudes toward smart technologies [20], so future research could explore how cultural differences affect customers’ perceptions of smart hotel service prioritization by integrating online reviews from more travel platforms to obtain insight from other regions and cultures. In addition, future research could consider using qualitative methods such as semi-structured interviews to obtain data. Combining online platform data with interview data can be beneficial in eliminating potential bias in online reviews, as reviewers are more likely to write reviews when they have had an extremely positive or negative experience [84]. Finally, we identified customer satisfaction and preference for different smart hotel attributes from online reviews without considering the impact of demographic variables (e.g., age, gender, occupation, etc.) on customer satisfaction and preference. Future research could incorporate these factors into the study through methods such as questionnaires for a more nuanced view of customer behavior.

Author Contributions

Conceptualization, Z.C. and S.H.-W.C.; methodology, Z.C.; software, Z.C.; validation, Z.C. and S.H.-W.C.; formal analysis, Z.C.; investigation, Z.C.; resources, Z.C.; data curation, Z.C.; writing—original draft preparation, Z.C.; writing—review and editing, Z.C. and S.H.-W.C.; visualization, Z.C.; supervision, S.H.-W.C. and K.B.; project administration, S.H.-W.C. and K.B. All authors have read and agreed to the published version of the manuscript.

Funding

This research received no external funding.

Institutional Review Board Statement

Not applicable.

Informed Consent Statement

Not applicable.

Data Availability Statement

Data are contained within the article.

Conflicts of Interest

The authors declare no conflicts of interest.

Appendix A

Appendix A.1

Table A1. Number of positive and negative comments and average sentiment score for each sub-attribute.
Po.Ne.Sen
Space4092812.0035
Window3031741.9718
Air Conditioner225492.9571
Design154911.6478
BedroomLight1461541.2603
Refrigerator1141850.9167
Sleep103911.3266
Bedding911150.9731
Soundproofing87692.1071
Table85821.2087
171712911.63727
Bathroom3523321.351
Shower4312331.829
Towel1621441.8505
Bathtub99701.9034
BathroomHot Water60521.4545
Shampoo74162.1732
Hairdryer66241.7288
Close Stool50431.8727
Washroom30331.4321
Body Lotion39122.973
13639591.85682
Check-In25908442.4723
Staff20654992.7184
Room Service18123294.0248
Front Desk6273482.4092
Human ServiceCheck-Out6453172.2591
Luggage349863.5775
Waiter107622.799
Reservation74392.5969
Treatment62452.392
Response9663.9167
842725752.91659
Price6032432.0988
Free576723.3951
Cost-Effective211433.4229
Cheap183542.7895
ValueCharge23490.4227
Worth62192.5472
Deposit28251.197
Affordable5744.3768
Value42162.7742
Cost21121.5897
18065372.46139
Facility10502972.8444
Bar5601652.14
Lift1581171.6094
Lobby190832.2965
FacilityGym175602.0893
Swimming Pool148731.5035
Car Park63671.0172
Spa106243.0755
Equipment107333.3314
Sofa56262.0194
26139452.19266
Breakfast14914912.6431
Restaurant6441652.3293
Coffee3141482.6591
Drinks297782.4887
FoodBread90293.3986
Cocktail88202.4692
Coffeemaker58471.032
Dinner67202.7339
Lunch55112.72
Buffet43163.4242
314710252.58981
Location11642462.2456
On Foot8591601.868
Airport5331571.9499
Metro526802.7804
LocationScenery545453.9675
Station403652.1581
City Center327512.0146
Transportation361492.9763
Convenience Store296602.6579
Train Station148211.6059
51629342.42242
Automated Check-In9811554.1025
Automated Check-Out7302552.5799
Facial Recognition224403.8918
Dinosaur Robots1351681.6111
SmartnessDelivery Robots111163.7945
Smart Television83103.7308
Tmall Genie56153.939
Intelligent System47172.9268
High Technology4863.507
Electric Bed31142.1333
24466963.22167

Appendix A.2

Table A2. Results of attribute satisfaction (sentiment score), importance, and opportunity.
S a t i s f a c t i o n ¯ I m p o r t a n c e ¯ Opportunity
Check-In0.518311.4817
Staff0.58060.757360.93412
Breakfast0.56150.662460.76342
Room Service0.9110.679940.67994
On Foot0.36550.479590.59368
Location0.4610.484020.50704
Facility0.61250.474250.47425
Automated Check-In0.93060.434450.43445
Front Desk0.50240.399480.39948
Automated Check-Out0.54560.39510.3951
Check-Out0.46440.387830.38783
Bathroom0.23480.30090.367
Price0.42390.353330.35333
Restaurant0.48220.34210.3421
Airport0.38620.313380.31338
Bar0.43430.307930.30793
Space0.39980.307640.30764
Shower0.35570.299080.29908
Metro0.59630.271940.27194
Free0.75170.265640.26564
Scenery0.89650.23580.2358
Window0.39180.221960.22196
Station0.43890.214150.21415
Coffee0.56560.202780.20278
Help0.79790.194770.19477
City Center0.40260.179630.17963
Transportation0.64580.174730.17473
Convenience Store0.56530.17290.1729
Drinks0.52250.16990.1699
Towel0.36110.155360.15536
Air Conditioner0.6410.152010.15201
Lift0.30010.14950.1495
Design0.30980.149180.14918
Lobby0.47390.126940.12694
Light0.21180.125190.12519
Facial Recognition0.87730.124380.12438
Refrigerator0.12490.118730.11873
Gym0.42150.114530.11453
Swimming Pool0.27330.114340.11434
Cost-Effective0.75880.106710.10671
Delivery Robots0.30050.106580.10658
Cheap0.59860.105060.10506
Sleep0.22860.102270.10227
Bedding0.13920.097150.09715
Train Station0.29920.092930.09293
Bathtub0.37450.087320.08732
Soundproofing0.4260.083930.08393
Luggage0.6010.077560.07756
Car Park0.15040.077490.07749
Table0.19880.074350.07435
Charge00.035890.07178
Spa0.67090.066590.06659
Equipment0.73560.064840.06484
Bread0.75260.059230.05923
Dinosaur Robots0.85270.053640.05364
Hot Water0.26090.053390.05339
Cocktail0.51760.047640.04764
Reservation0.54990.045570.04557
Treatment0.4980.04540.0454
Coffeemaker0.15410.044310.04431
Shampoo0.44270.044130.04413
Hairdryer0.33030.041680.04168
Close Stool0.36670.039670.03967
Dinner0.58450.036430.03643
Sofa0.40380.035870.03587
Smart Television0.83660.035220.03522
Response0.88360.034860.03486
Worth0.28440.034480.03448
Washroom0.25530.025410.02541
Tmall Genie0.88930.025310.02531
Intelligent System0.63330.022410.02241
Lunch0.5810.020120.02012
Body Lotion0.6450.019030.01903
High Technology0.780.018120.01812
Deposit0.19580.017390.01739
Affordable10.015920.01592
Buffet0.75910.014990.01499
Value0.59470.013550.01355
Electric Bed0.43260.011910.01191
Cost0.295100

References

  1. Stylos, N.; Fotiadis, A.K.; Shin, D.; Huan, T.T. Beyond smart systems adoption: Enabling diffusion and assimilation of smartness in hospitality. Int. J. Hosp. Manag. 2021, 98, 103042. [Google Scholar] [CrossRef]
  2. Cheong, F.; Law, R. Human employees versus robotic employees: Customers and hotel managers’ perceived experience at unmanned smart hotels. Cogent Soc. Sci. 2023, 9, 2202937. [Google Scholar] [CrossRef]
  3. Wang, J.; Fu, X. Unveiling the human-robot encounter: Guests’ perspectives on smart hotel experience. J. Hosp. Tour. Technol. 2024. [CrossRef]
  4. Lim, W.M.; Teh, P.; Ahmed, P.K.; Cheong, S.; Ling, H.; Yap, W. Going keyless for a seamless experience: Insights from a unified hotel access control system. Int. J. Hosp. Manag. 2018, 75, 105–115. [Google Scholar] [CrossRef]
  5. Kabadayi, S.; Ali, F.; Choi, H.; Joosten, H.; Lu, C. Smart service experience in hospitality and tourism services. J. Serv. Manag. 2019, 30, 326–348. [Google Scholar] [CrossRef]
  6. Chen, Y.; Xue, T.; Tuomi, A.; Wang, Z. Hotel robots: An exploratory study of Generation Z customers in China. Tour. Rev. 2022, 77, 1262–1275. [Google Scholar] [CrossRef]
  7. Buhalis, D.; Leung, R. Smart hospitality—Interconnectivity and interoperability towards an ecosystem. Int. J. Hosp. Manag. 2018, 71, 41–50. [Google Scholar] [CrossRef]
  8. Buhalis, D.; O’Connor, P.; Leung, R. Smart hospitality: From smart cities and smart tourism towards Agile business ecosystems in networked destinations. Int. J. Contemp. Hosp. Manag. 2022, 35, 369–393. [Google Scholar] [CrossRef]
  9. Casais, B.; Ferreira, L. Smart and sustainable hotels: Tourism agenda 2030 perspective article. Tour. Rev. 2023, 78, 344–351. [Google Scholar] [CrossRef]
  10. Antonova, N.; Ruiz-Rosa, I.; Mendoza-Jiménez, J. Water resources in the hotel industry: A systematic literature review. Int. J. Contemp. Hosp. Manag. 2021, 33, 628–649. [Google Scholar] [CrossRef]
  11. Ivars-Baidal, J.A.; Vera-Rebollo, J.F.; Perles-Ribes, J.; Femenia-Serra, F.; Celdrán-Bernabeu, M.A. Sustainable tourism indicators: What’s new within the smart city/destination approach? J. Sustain. Tour. 2021, 31, 1556–1582. [Google Scholar] [CrossRef]
  12. Zhang, C.; Xu, Z.; Gou, X.; Chen, S. An online reviews-driven method for the prioritization of improvements in hotel services. Tour. Manag. 2021, 87, 104382. [Google Scholar] [CrossRef]
  13. Song, Y.; Liu, K.; Guo, L.; Yang, Z.; Jin, M. Does hotel customer satisfaction change during the COVID-19? A perspective from online reviews. J. Hosp. Tour. Manag. 2022, 51, 132–138. [Google Scholar] [CrossRef]
  14. Luo, J.M.; Vu, H.Q.; Li, G.; Law, R. Understanding service attributes of robot hotels: A sentiment analysis of customer online reviews. Int. J. Hosp. Manag. 2021, 98, 103032. [Google Scholar] [CrossRef]
  15. Wu, H.; Cheng, C. Relationships between technology attachment, experiential relationship quality, experiential risk and experiential sharing intentions in a smart hotel. J. Hosp. Tour. Manag. 2018, 37, 42–58. [Google Scholar] [CrossRef]
  16. Chiang, C.; Chen, W.; Hsu, C. Classifying technological innovation attributes for hotels: An application of the Kano model. In Future of Tourism Marketing; Routledge: London, UK, 2021; pp. 28–39. [Google Scholar] [CrossRef]
  17. Yang, T.; Wu, J.; Zhang, J. Knowing how satisfied/dissatisfied is far from enough: A comprehensive customer satisfaction analysis framework based on hybrid text mining techniques. Int. J. Contemp. Hosp. Manag. 2023, 36, 873–892. [Google Scholar] [CrossRef]
  18. Yang, H.; Song, H.; Cheung, C.; Guan, J. How to enhance hotel guests’ acceptance and experience of smart hotel technology: An examination of visiting intentions. Int. J. Hosp. Manag. 2021, 97, 103000. [Google Scholar] [CrossRef]
  19. Kim, J.J.; Han, H. Hotel service innovation with smart technologies: Exploring consumers’ readiness and behaviors. Sustainability 2022, 14, 5746. [Google Scholar] [CrossRef]
  20. Koç, E.; Yazıcı Ayyıldız, A.; Baykal, M. Tourist behavior after service robots. J. Multidiscip. Acad. Tour. 2024, 9, 87–98. [Google Scholar] [CrossRef]
  21. Wang, L.; Rau, P.P.; Evers, V.; Robinson, B.K.; Hinds, P. When in Rome: The role of culture & context in adherence to robot recommendations. In Proceedings of the 2010 5th ACM/IEEE International Conference on Human-Robot Interaction (HRI), Osaka, Japan, 2–5 March 2010; pp. 359–366. [Google Scholar] [CrossRef]
  22. Ayyıldız, A.Y.; Baykal, M.; Koç, E. Attitudes of hotel customers towards the use of service robots in hospitality service encounters. Technol. Soc. 2022, 70, 101995. [Google Scholar] [CrossRef]
  23. Kim, J.J.; Han, H. Hotel of the future: Exploring the attributes of a smart hotel adopting a mixed-methods approach. J. Travel Tour. Mark. 2020, 37, 804–822. [Google Scholar] [CrossRef]
  24. Yan, Z.; Balasubramanian, K.; Konar, R.; Chen, L.; Wei, Y. Smart hotel in the eyes of the silver: Developing and testing the silver tourists’ behavioural intention scale. Curr. Issues Tour. 2024, 7, 1–20. [Google Scholar] [CrossRef]
  25. Dai, A.; Zhang, J.; Pai, C.K.; Lee, T.J. The impact of the perception of smart hotel attributes and perceptions of service innovation on tourist happiness and brand loyalty. Int. J. Hosp. Manag. 2025, 127, 104107. [Google Scholar] [CrossRef]
  26. Kim, J.J.; Lee, M.J.; Han, H. The psychology of vacationers’ hotel brand choice in a post-pandemic world. J. Vacat. Mark. 2022, 29, 206–221. [Google Scholar] [CrossRef]
  27. Srivastava, A.; Kumar, V. Hotel attributes and overall customer satisfaction: What did COVID-19 change? Tour. Manag. Perspect. 2021, 40, 100867. [Google Scholar] [CrossRef]
  28. Füller, J.; Matzler, K. Customer delight and market segmentation: An application of the three-factor theory of customer satisfaction on life style groups. Tour. Manag. 2008, 29, 116–126. [Google Scholar] [CrossRef]
  29. Zhang, C.; Xu, Z. Gaining insights for service improvement through unstructured text from online reviews. J. Retail. Consum. Serv. 2024, 80, 103898. [Google Scholar] [CrossRef]
  30. Violante, M.G.; Vezzetti, E. Kano qualitative vs quantitative approaches: An assessment framework for products attributes analysis. Comput. Ind. 2017, 86, 15–25. [Google Scholar] [CrossRef]
  31. Ulwick, A. What Customers Want: Using Outcome-Driven Innovation to Create Breakthrough Products and Services; McGraw Hill Professional: New York, NY, USA, 2005. [Google Scholar]
  32. Jeong, B.; Yoon, J.; Lee, J. Social media mining for product planning: A product opportunity mining approach based on topic modeling and sentiment analysis. Int. J. Inf. Manag. 2019, 48, 280–290. [Google Scholar] [CrossRef]
  33. Özen, İ.A.; Özgül Katlav, E. Aspect-based sentiment analysis on online customer reviews: A case study of technology-supported hotels. J. Hosp. Tour. Technol. 2023, 14, 102–120. [Google Scholar] [CrossRef]
  34. Zarezadeh, Z.Z.; Rastegar, R.; Xiang, Z. Big data analytics and hotel guest experience: A critical analysis of the literature. Int. J. Contemp. Hosp. Manag. 2022, 34, 2320–2336. [Google Scholar] [CrossRef]
  35. Fan, Z.; Li, G.; Liu, Y. Processes and methods of information fusion for ranking products based on online reviews: An overview. Inf. Fusion 2020, 60, 87–97. [Google Scholar] [CrossRef]
  36. Bigorra, A.M.; Isaksson, O.; Karlberg, M. Aspect-based Kano categorization. Int. J. Inf. Manag. 2019, 46, 163–172. [Google Scholar] [CrossRef]
  37. Ji, F.; Cao, Q.; Li, H.; Fujita, H.; Liang, C.; Wu, J. An online reviews-driven large-scale group decision making approach for evaluating user satisfaction of sharing accommodation. Expert Syst. Appl. 2023, 213, 118875. [Google Scholar] [CrossRef]
  38. Campbell, J.C.; Hindle, A.; Stroulia, E. Latent Dirichlet allocation. In The Art and Science of Analyzing Software Data; Morgan Kaufmann: Burlington, MA, USA, 2015; pp. 139–159. [Google Scholar] [CrossRef]
  39. Blei, D.M.; Ng, A.Y.; Jordan, M.I. Latent Dirichlet allocation. J. Mach. Learn. Res. 2003, 3, 993–1022. [Google Scholar]
  40. Guo, Y.; Barnes, S.J.; Jia, Q. Mining meaning from online ratings and reviews: Tourist satisfaction analysis using latent dirichlet allocation. Tour. Manag. 2017, 59, 467–483. [Google Scholar] [CrossRef]
  41. Ahani, A.; Nilashi, M.; Zogaan, W.A.; Samad, S.; Aljehane, N.O.; Alhargan, A.; Mohd, S.; Ahmadi, H.; Sanzogni, L. Evaluating medical travelers’ satisfaction through online review analysis. J. Hosp. Tour. Manag. 2021, 48, 519–537. [Google Scholar] [CrossRef]
  42. Sam, S.J.I.; Jasim, K.M.; Babu, M. Customers’ metaverse service encounter perceptions: Sentiment analysis and topic modeling. J. Hosp. Mark. Manag. 2024, 34, 92–114. [Google Scholar] [CrossRef]
  43. Bi, J.; Liu, Y.; Fan, Z.; Zhang, J. Exploring asymmetric effects of attribute performance on customer satisfaction in the hotel industry. Tour. Manag. 2020, 77, 104006. [Google Scholar] [CrossRef]
  44. Wu, J.; Zhao, N. What consumer complaints should hoteliers prioritize? Analysis of online reviews under different market segments. J. Hosp. Mark. Manag. 2022, 32, 1–28. [Google Scholar] [CrossRef]
  45. Zhao, M.; Liu, M.; Xu, C.; Zhang, C. Classifying travellers’ requirements from online reviews: An improved Kano model. Int. J. Contemp. Hosp. Manag. 2023, 36, 91–112. [Google Scholar] [CrossRef]
  46. Liu, B.; Zhang, L. A survey of opinion mining and sentiment analysis. In Mining Text Data; Springer: Boston, MA, USA, 2012; pp. 415–463. [Google Scholar] [CrossRef]
  47. Yu, Y.; Chen, J.; Mehraliyev, F.; Hu, S.; Wang, S.; Liu, J. Exploring the diversity of emotion in hospitality and tourism from big data: A novel sentiment dictionary. Int. J. Contemp. Hosp. Manag. 2024, 36, 4237–4257. [Google Scholar] [CrossRef]
  48. Zhang, H.; Gan, W.; Jiang, B. Machine learning and lexicon based methods for sentiment classification: A survey. In Proceedings of the 2014 11th Web Information System and Application Conference, Tianjin, China, 12–14 September 2014; pp. 262–265. [Google Scholar] [CrossRef]
  49. Liu, Y.; Huang, K.; Bao, J.; Chen, K. Listen to the voices from home: An analysis of Chinese tourists’ sentiments regarding Australian destinations. Tour. Manag. 2019, 71, 337–347. [Google Scholar] [CrossRef]
  50. Wu, S.; Xu, Y.; Wu, F.; Yuan, Z.; Huang, Y.; Li, X. Aspect-based sentiment analysis via fusing multiple sources of textual knowledge. Knowl.-Based Syst. 2019, 183, 104868. [Google Scholar] [CrossRef]
  51. Nie, R.; Tian, Z.; Wang, J.; Chin, K.S. Hotel selection driven by online textual reviews: Applying a semantic partitioned sentiment dictionary and evidence theory. Int. J. Hosp. Manag. 2020, 88, 102495. [Google Scholar] [CrossRef]
  52. Wu, H.; Xu, K.; Hu, T.; He, B.; Xie, D. ‘Instant noodle crisis’: Understanding tourist and public sentiments towards collective tourist environmentally irresponsible behaviour in a tourist destination in China. Curr. Issues Tour. 2023, 27, 4391–4409. [Google Scholar] [CrossRef]
  53. Xu, Y.; Li, S.; Law, R.; Jin, Y.; Lyu, Z. How does the COVID-19 pandemic influence tourist rating behaviour? An empirical exploration based on expectation theory. Curr. Issues Tour. 2023, 26, 4052–4068. [Google Scholar] [CrossRef]
  54. Wang, Z.; Zhang, S.; Liu, W. When a villager is a rural homestay operator: Role expectation research using the machine learning model? Curr. Issues Tour. 2024, 28, 1002–1020. [Google Scholar] [CrossRef]
  55. Wang, W.; Ying, S.; Lyu, J.; Qi, X. Perceived image study with online data from social media: The case of boutique hotels in China. Ind. Manag. Data Syst. 2019, 119, 950–967. [Google Scholar] [CrossRef]
  56. Davari, D.; Vayghan, S.; Jang, S.; Erdem, M. Hotel experiences during the COVID-19 pandemic: High-touch versus high-tech. Int. J. Contemp. Hosp. Manag. 2022, 34, 1312–1330. [Google Scholar] [CrossRef]
  57. Wong, I.A.; Zhang, T.; Lin, Z.; Peng, Q. Hotel AI service: Are employees still needed? J. Hosp. Tour. Manag. 2023, 55, 416–424. [Google Scholar] [CrossRef]
  58. Rabadán-Martín, I.; Barcos-Redín, L.; Pereira-Delgado, J.; Aguado-Correa, F.; Padilla-Garrido, N. Topic-based engagement analysis: Focusing on hotel industry Twitter accounts. Tour. Manag. 2025, 106, 104981. [Google Scholar] [CrossRef]
  59. Sarkar, D. Text Analytics with Python: A Practitioner’s Guide to Natural Language Processing; Apress: Berkeley, CA, USA, 2019. [Google Scholar] [CrossRef]
  60. Kaveski Peres, C.; Pacheco Paladini, E. Exploring the attributes of hotel service quality in Florianopolis—SC, Brazil: An analysis of TripAdvisor reviews. Cogent Bus. Manag. 2021, 8, 1926211. [Google Scholar] [CrossRef]
  61. Albayrak, T.; Dursun-Cengizci, A.; Fong, L.H.N.; Caber, M. The changing role of hotel attributes in destination competitiveness throughout a crisis. Int. J. Contemp. Hosp. Manag. 2024, 36, 3264–3282. [Google Scholar] [CrossRef]
  62. Tian, C.; Zhang, J.; Liu, D.; Wang, Q.; Lin, S. Technological topic analysis of standard-essential patents based on the improved latent Dirichlet allocation (LDA) model. Technol. Anal. Strat. Manag. 2022, 36, 2084–2099. [Google Scholar] [CrossRef]
  63. An, Q.; Ma, Y.; Du, Q.; Xiang, Z.; Fan, W. Role of user-generated photos in online hotel reviews: An analytical approach. J. Hosp. Tour. Manag. 2020, 45, 633–640. [Google Scholar] [CrossRef]
  64. Li, R.; Li, Y.; Ruan, W.; Zhang, S.; Wang, M. Sentiment mining of online reviews of peer-to-peer accommodations: Customer emotional heterogeneity and its influencing factors. Tour. Manag. 2023, 96, 104704. [Google Scholar] [CrossRef]
  65. Lee, S.; Hong, S.; Kim, J.; Meng, Z.M. Exploring the role of ethical experiences and psychological well-being in travel satisfaction: An animal welfare perspective in elephant-based tourism. Tour. Manag. Perspect. 2024, 51, 101248. [Google Scholar] [CrossRef]
  66. Wu, D.C.; Zhong, S.; Song, H.; Wu, J. Do topic and sentiment matter? Predictive power of online reviews for hotel demand forecasting. Int. J. Hosp. Manag. 2024, 120, 103750. [Google Scholar] [CrossRef]
  67. Qin, M.; Sun, M.; Li, J. Impact of environmental regulation policy on ecological efficiency in four major urban agglomerations in eastern China. Ecol. Indic. 2021, 130, 108002. [Google Scholar] [CrossRef]
  68. Hu, T.; Chen, H. Little-known leisure places: Chinese tourists’ preferences for visiting niche tourism destinations. Asia Pac. J. Tour. Res. 2023, 28, 1261–1278. [Google Scholar] [CrossRef]
  69. Li, J.; Xu, L.; Tang, L.; Wang, S.; Li, L. Big data in tourism research: A literature review. Tour. Manag. 2018, 68, 301–323. [Google Scholar] [CrossRef]
  70. Zhang, J.; Lu, X.; Liu, D. Deriving customer preferences for hotels based on aspect-level sentiment analysis of online reviews. Electron. Commer. Res. Appl. 2021, 49, 101094. [Google Scholar] [CrossRef]
  71. Hu, F.; Teichert, T.; Deng, S.; Liu, Y.; Zhou, G. Dealing with pandemics: An investigation of the effects of COVID-19 on customers’ evaluations of hospitality services. Tour. Manag. 2021, 85, 104320. [Google Scholar] [CrossRef] [PubMed]
  72. Wu, J.; Yang, T.; Zhou, Z.; Zhao, N. Consumers’ affective needs matter: Open innovation through mining luxury hotels’ online reviews. Int. J. Hosp. Manag. 2023, 114, 103556. [Google Scholar] [CrossRef]
  73. Tuomi, A.; Tussyadiah, I.P.; Stienmetz, J. Applications and implications of service robots in hospitality. Cornell Hosp. Q. 2020, 62, 232–247. [Google Scholar] [CrossRef]
  74. Pitardi, V.; Wirtz, J.; Paluch, S.; Kunz, W.H. Service robots, agency and embarrassing service encounters. J. Serv. Manag. 2021, 33, 389–414. [Google Scholar] [CrossRef]
  75. Borghi, M.; Mariani, M.M. Asymmetrical influences of service robots’ perceived performance on overall customer satisfaction: An empirical investigation leveraging online reviews. J. Travel Res. 2023, 63, 1086–1111. [Google Scholar] [CrossRef]
  76. Zhang, X.; Balaji, M.; Jiang, Y. Robots at your service: Value facilitation and value Co-creation in restaurants. Int. J. Contemp. Hosp. Manag. 2022, 34, 2004–2025. [Google Scholar] [CrossRef]
  77. Qi, H.; Mo, R. Exploring customer experience of smart hotel: A text big data mining approach. E3S Web Conf. 2021, 251, 01034. [Google Scholar] [CrossRef]
  78. Kaewkamol, P.; Chen, Y. Customer satisfaction factors of smart hotels based on customer reviews in online platform. In Proceedings of the 2023 Joint International Conference on Digital Arts, Media and Technology with ECTI Northern Section Conference on Electrical, Electronics, Computer and Telecommunications Engineering (ECTI DAMT & NCON), Phuket, Thailand, 22–25 March 2023; pp. 43–46. [Google Scholar] [CrossRef]
  79. Elshaer, A.M.; Marzouk, A.M. Memorable tourist experiences: The role of smart tourism technologies and hotel innovations. Tour. Recreat. Res. 2022, 49, 445–457. [Google Scholar] [CrossRef]
  80. Iranmanesh, M.; Ghobakhloo, M.; Nilashi, M.; Tseng, M.; Yadegaridehkordi, E.; Leung, N. Applications of disruptive digital technologies in hotel industry: A systematic review. Int. J. Hosp. Manag. 2022, 107, 103304. [Google Scholar] [CrossRef]
  81. Song, B.; Xia, H.; Law, R.; Muskat, B.; Li, G. Discovery of smart hotels’ competitiveness based on online reviews. Int. J. Hosp. Manag. 2024, 123, 103926. [Google Scholar] [CrossRef]
  82. Yağmur, Y.; Demirel, A.; Kılıç, G.D. Top quality hotel managers’ perspectives on smart technologies: An exploratory study. J. Hosp. Tour. Insights 2023, 7, 1501–1531. [Google Scholar] [CrossRef]
  83. Hsu, H.; Tseng, K. Facing the era of smartness: Constructing a framework of required technology competencies for hospitality practitioners. J. Hosp. Tour. Technol. 2022, 13, 500–526. [Google Scholar] [CrossRef]
  84. Rouliez, P.; Tojib, D.; Tsarenko, Y. The influence of online review exposure on reviewers’ intensity level of negative word of mouth. J. Hosp. Tour. Res. 2019, 43, 712–733. [Google Scholar] [CrossRef]
Figure 1. A conceptual framework for generating service improvement strategies for smart hotels. Source: Self-made for this research.
Sustainability 17 04036 g001
Figure 2. Perplexity across different numbers of topics. Source: Self-made for this research.
Sustainability 17 04036 g002
Figure 3. Comparison of positive and negative comments for each attribute. Source: Self-made for this research.
Sustainability 17 04036 g003
Figure 4. Opportunity landscape map of smart hotel sub-attributes (Number = Opportunity score rank). Source: Self-made for this research.
Sustainability 17 04036 g004
Figure 5. Link analysis of check-in, staff, and breakfast. Source: Self-made for this research.
Sustainability 17 04036 g005
Table 1. Distribution by country of smart hotels.
CountryFlyzooHenn-naYotelLYZTotal
China10045
Japan0200020
Netherlands00101
Portugal00101
Singapore00101
South Korea01001
Switzerland00101
Turkey00101
United Kingdom00505
United States01506
Table 2. The attributes and sub-attributes extracted from smart hotel online reviews.
AttributesSub-Attributes
BedroomSpace, Window, Air Conditioner, Design, Light, Refrigerator, Sleep, Bedding, Soundproof, Table
BathroomBathroom, Shower, Towel, Bathtub, Hot Water, Shampoo, Hairdryer, Close Stool, Washroom, Body Lotion
Human ServiceCheck-In, Staff, Room Service, Front Desk, Check-Out, Luggage, Waiter, Reservation, Treatment, Response
ValuePrice, Free, Cost-Effective, Cheap, Worth, Charge, Deposit, Affordable, Value, Cost
FacilityFacility, Bar, Lift, Lobby, Gym, Swimming pool, Car park, Spa, Equipment, Sofa
FoodBreakfast, Restaurant, Coffee, Drinks, Bread, Cocktail, Coffeemaker, Dinner, Lunch, Buffet
LocationLocation, On Foot, Airport, Metro, Scenery, Station, City Center, Transportation, Convenience Store, Train Station
SmartnessAutomated Check-In, Automated Check-Out, Facial Recognition, Dinosaur Robots, Delivery Robots, Smart Television, Tmall Genie, Intelligent system, High Technology, Electric Bed
Table 3. Number of positive and negative comments and average sentiment score for each attribute.
Po.Ne.Sen
Bedroom171712911.63727
Bathroom13639591.85682
Human Service842725752.91659
Value18065372.46139
Facility26139452.19266
Food314710252.58981
Location51629342.42242
Smartness24466963.22167
Disclaimer/Publisher’s Note: The statements, opinions and data contained in all publications are solely those of the individual author(s) and contributor(s) and not of MDPI and/or the editor(s). MDPI and/or the editor(s) disclaim responsibility for any injury to people or property resulting from any ideas, methods, instructions or products referred to in the content.

