1. Introduction
The Architecture, Engineering, and Construction (AEC) sector is constantly looking for innovation, new methods, and tools within information technologies to support and renew the efficient design of the built environment and the management of buildings. Embracing new approaches spanning the entire building lifecycle is crucial for shaping the future of the construction sector, ensuring that buildings are more efficient, resilient, and adaptable to the changing needs of society.
The drive for innovation is especially critical in addressing the high energy consumption seen in residential buildings, which are responsible for a significant amount of worldwide energy consumption. Indeed, operations within residential buildings, such as space heating and cooling, lighting, and electric appliances, account for about 27% of the EU’s final energy consumption [
1]. This means that a huge proportion of energy consumption is spent to ensure comfortable indoor environmental conditions, strongly related to building occupants’ behaviour.
Despite technological innovation supporting energy-efficient buildings and a more sustainable paradigm of energy use, achieving low- or net-zero-energy buildings still strongly depends on the impact of «human factors» [
2,
3]. As a result, it is paramount to analyse and comprehend the complex relationship between human behaviour and building performance, while looking for innovative tools and methodologies to effectively address this connection [
4]. Occupants’ interactions with building systems are influenced by personal preferences, habits, and economic concerns related to energy consumption and bills. Enhanced awareness of environmental and energy impacts, along with the adoption of more efficient and sustainable behaviours, could potentially lead to energy savings of up to 17% [
5], with individuals also being more inclined to reconsider their comfort levels [
6].
1.1. The Role of Training Systems to Improve Energy-Related Behaviours
Recently, researchers have examined training systems aimed at supporting building users in adopting energy-saving strategies [
7]. In this context, educating individuals about energy-efficient behaviour has been identified as a key strategy to reduce buildings’ energy consumption and increase behavioural awareness and sustainability. However, finding effective training methods or developing proper training activities for educating building occupants is currently challenging. Simple eco-feedback systems have emerged as promising solutions to provide building occupants with energy usage information through devices and/or interfaces [
8,
9]. These strategies bridge the gap between the lack of awareness and the comprehension of behavioural consequences [
10], enhancing pro-environmental behaviour, and promoting behavioural changes for reducing consumption and enhancing energy-usage awareness. Eco-feedback relies on data-driven information visualisation (InfoVis) [
11,
12], which has been defined by S. Card [
11] as ”the use of computer-supported, interactive, visual representation of abstract data to amplify cognition”. In the realm of eco-feedback, InfoVis is intended to display information to amplify cognition by simplifying and organising information to increase the memory and reducing the search for data, by grouping or visually relating information in a small space and avoiding a large amount of searching [
11]. The correct communication of information to users is considered to be vital, as inappropriate adoption and development of training activities have been recognised as major drawbacks to users’ engagement, knowledge improvement, and understanding of energy-related issues [
13]. In addition, accessible and engaging means of linking persuasive technology and informative context for sustainable and efficient energy-related behaviours are needed [
14]. This is why good practice guidelines for the effective design of eco-feedback systems are available [
8].
Today, new types of visualisation techniques are emerging to develop effective training activities based on eco-feedback and InfoVis, aiming at improving occupants’ awareness about the use of the building’s technological systems and the resulting behavioural consequences. Digital, visually engaging, and interactive technologies can be as effective as traditional eco-feedback systems in disrupting habitual behaviours and promoting long-term behavioural changes [
9]. Several attempts have been carried out for developing eco-feedback dashboards [
15,
16] and gaming platforms [
17] based on real-time data, showing significant positive effects on long-term behavioural changes and energy conservation.
Traditionally, in the field of training systems, non-immersive virtual simulations integrated in web interfaces [
18] and serious games [
14,
19,
20] have been used to promote energy-saving behaviours based on challenges, feedback, and rewards.
For example, Casals et al. [
18] developed a touchscreen tablet-based application in which players could control a character—a cartoon cat—that guided human avatars toward energy-saving practices within a residential setting. The game included a simplified points-based energy management system, aiming to educate users on household energy use, but the design choice distances users from the direct experience of real energy consumption.
A more realistic serious game was introduced in the study of Delemere et al. [
14], where players manage a virtual home through a screen-based interface, balancing energy consumption with wellbeing and financial constraints. Although the game provides feedback to support informed decision-making, it remains confined to two-dimensional visualisations and symbolic actions. As a result, the players are detached from the environment, which can reduce the transfer of learned behaviours to real-world habits.
Similarly, Häfner et al. [
19] employed a desktop-based system that visualises energy-efficient behavioural consequences and simplifies interactivity through gesture-based input devices. In this way, the user does not need a control panel, since the system can be controlled through gestures only. However, despite these interaction enhancements, the system remained non-immersive, tied to a fixed desktop setup, limiting the user’s physical engagement and sense of presence within the virtual environment.
A different approach was adopted by Ro et al. [
20], who designed a game that rewards participants for self-reported sustainable actions. In this study, participants who performed pro-environmental behaviours in their real-world individual personal space could claim credit via an online interface, with optional photo uploads for bonus points. However, this approach lacked any verification of whether the reported actions were actually performed. In addition, the use of scoring credits may encourage a focus on external rewards rather than fostering the internalisation of energy-saving behaviours.
Taken together, these studies highlight key limitations of non-immersive systems. First, they typically offer low levels of spatial presence, as users interact through screens rather than engaging directly in the environment. Second, the absence of real-time behavioural verification limits the validity of the reported outcomes. Finally, systems relying on symbolic or decontextualised actions, with dummy feedback systems such as scores or credits, tend to be abstract and reduce the perceived relevance of those actions to real-world energy use.
1.2. Leveraging Virtual Reality for Training Systems
Virtual Reality (VR) is rapidly transforming the engineering and construction sectors. It offers immersive and interactive environments that enhance design evaluations by allowing stakeholders to explore and modify building designs before construction [
4,
21,
22,
23]. Virtual models are adopted to effectively communicate project decisions to end-users. Additionally, virtual simulations have been used to train workers or building users on safety procedures in hazardous environments [
24,
25,
26]. Hence, VR goes a step further by enabling the creation of advanced training systems that can be experienced by users from the initial stages of building design. This early approach ensures that users are preliminarily well informed, empowering them to make better decisions on energy use, comfort optimisation, and sustainability throughout a building’s lifecycle. Moreover, a preliminary training approach has significant potential applications, as it aligns with the growing adoption of Building Information Modelling (BIM) and Building Energy Models (BEMs). The former are evolving to integrate advanced virtualisations of 3D building models, with VR offering virtual environments for complementary training activities. This integration supports a more comprehensive understanding of building systems and energy-related decisions, ultimately enhancing both design processes and the operational efficiency of buildings [
7]. When meaningfully processed, data derived from BEMs become crucial to successful training activities, improving information communicability and users’ comprehension [
8], and supporting more informed decision-making about energy-saving strategies. As a result, a promising future direction lies in the creation of virtual training activities coupling virtual environments and information based on the results of effective building models. This approach could revolutionise how users interact and experience eco-feedback, fostering more energy-efficient behaviour and enhancing occupants’ comfort. By merging the immersive capabilities of VR with the predictive power of BIM and BEMs, a more realistic, engaging, and effective way to educate building occupants on energy usage and comfort optimisation can be achieved.
In the VR domain, Immersive Virtual Environments (IVEs) are widely used to leverage the highest levels of sense of presence and immersivity, enhancing users’ engagement [
27]. By allowing users to coexist with eco-feedback in the same virtual 1:1 scaled environment, IVEs improve satisfaction and enjoyment in comparison to other tools, such as augmented reality and non-immersive virtual simulations. IVEs can offer practical benefits to develop cost-effective training sessions, facilitating the visualisation of complex data in an easier and more intuitive manner [
28] by adopting interactive, site-specific [
29], and risk-free interfaces [
30]. This empowers users to experiment with different strategies to optimise their energy use, resulting in increased user concentration and positive learning outcomes [
30,
31,
32,
33].
Despite their potential, the use of IVEs to train building users in energy-efficient behaviours has not received much attention, even though they have been used to study human–built environment interactions [
34,
35,
36,
37]. Indeed, to date, only a few studies have explored the effectiveness of virtual training activities to promote more energy-efficient behaviours. For instance, Kleinlogel et al. [
29] showed that receiving energy-saving instructions in IVEs can increase pro-environmental attitudes and different appliance use at home, in comparison to receiving the same messages via more traditional means, such as textual or video tools. Similarly, Carneiro et al. [
12] investigated the effectiveness of InfoVis in influencing occupants’ behaviour. An immersive virtual office space was integrated with spatiotemporal visualisations aimed at changing participants’ choices on energy consumption and lighting distribution. The results from 80 participants successfully highlighted the potential of InfoVis in shaping behaviours and suggested that the energy consumption visualisations were more effective in changing users’ behaviour in comparison to lightmaps. In this case study, lighting and energy simulations were carried out to provide accurate data for InfoVis.
Thus, while non-immersive simulations and gamified strategies to raise energy awareness have been widely explored, they often suffer from limited user engagement and reduced relevance to real-world energy use. To overcome these limitations, some studies have integrated InfoVis with immersive environments. However, these approaches remain relatively rare and typically focus on a single behaviour or system (e.g., lighting setting), without leveraging the full potential of real-time BEM data-driven feedback.
1.3. Research Objective
The literature analysis revealed that the application of IVEs for training building users on energy-efficient behaviours is underdeveloped, particularly using data-driven information to increase the awareness of consequences. Building upon the existing literature and the identified research gaps, this paper presents a novel framework for the development of an immersive training activity to improve building users’ awareness of energy-related behaviour.
A residential building was selected as case study to integrate InfoVis from the results of Building Energy Model simulations into the corresponding virtual environment. A pilot study on 52 subjects was carried out, aimed at demonstrating the effectiveness and potential of this innovative system, which can be experienced by users from the early stages of building design to increase their knowledge about the consequences of their energy-related behaviours. Accordingly, our research question was “Can an immersive training activity, integrating data-driven information from BEM into a virtual environment, effectively increase building users’ awareness and improve energy-related behaviour and air thermal condition?”
In
Section 2, the whole methodology used to create the immersive training system is illustrated in detail, in terms of the generation of the BEM and IVE, design of graphical indicators and tips, and experimental schedule. The results of ecological validity are analysed in
Section 3.1 and discussed in
Section 4.1. The efficacy of the immersive training activity is discussed in
Section 4.2 based on the results of the interaction choices (
Section 3.3) and the effectiveness of the graphical indicators and tips provided by the subjects’ ratings (
Section 3.4).
2. Materials and Methods
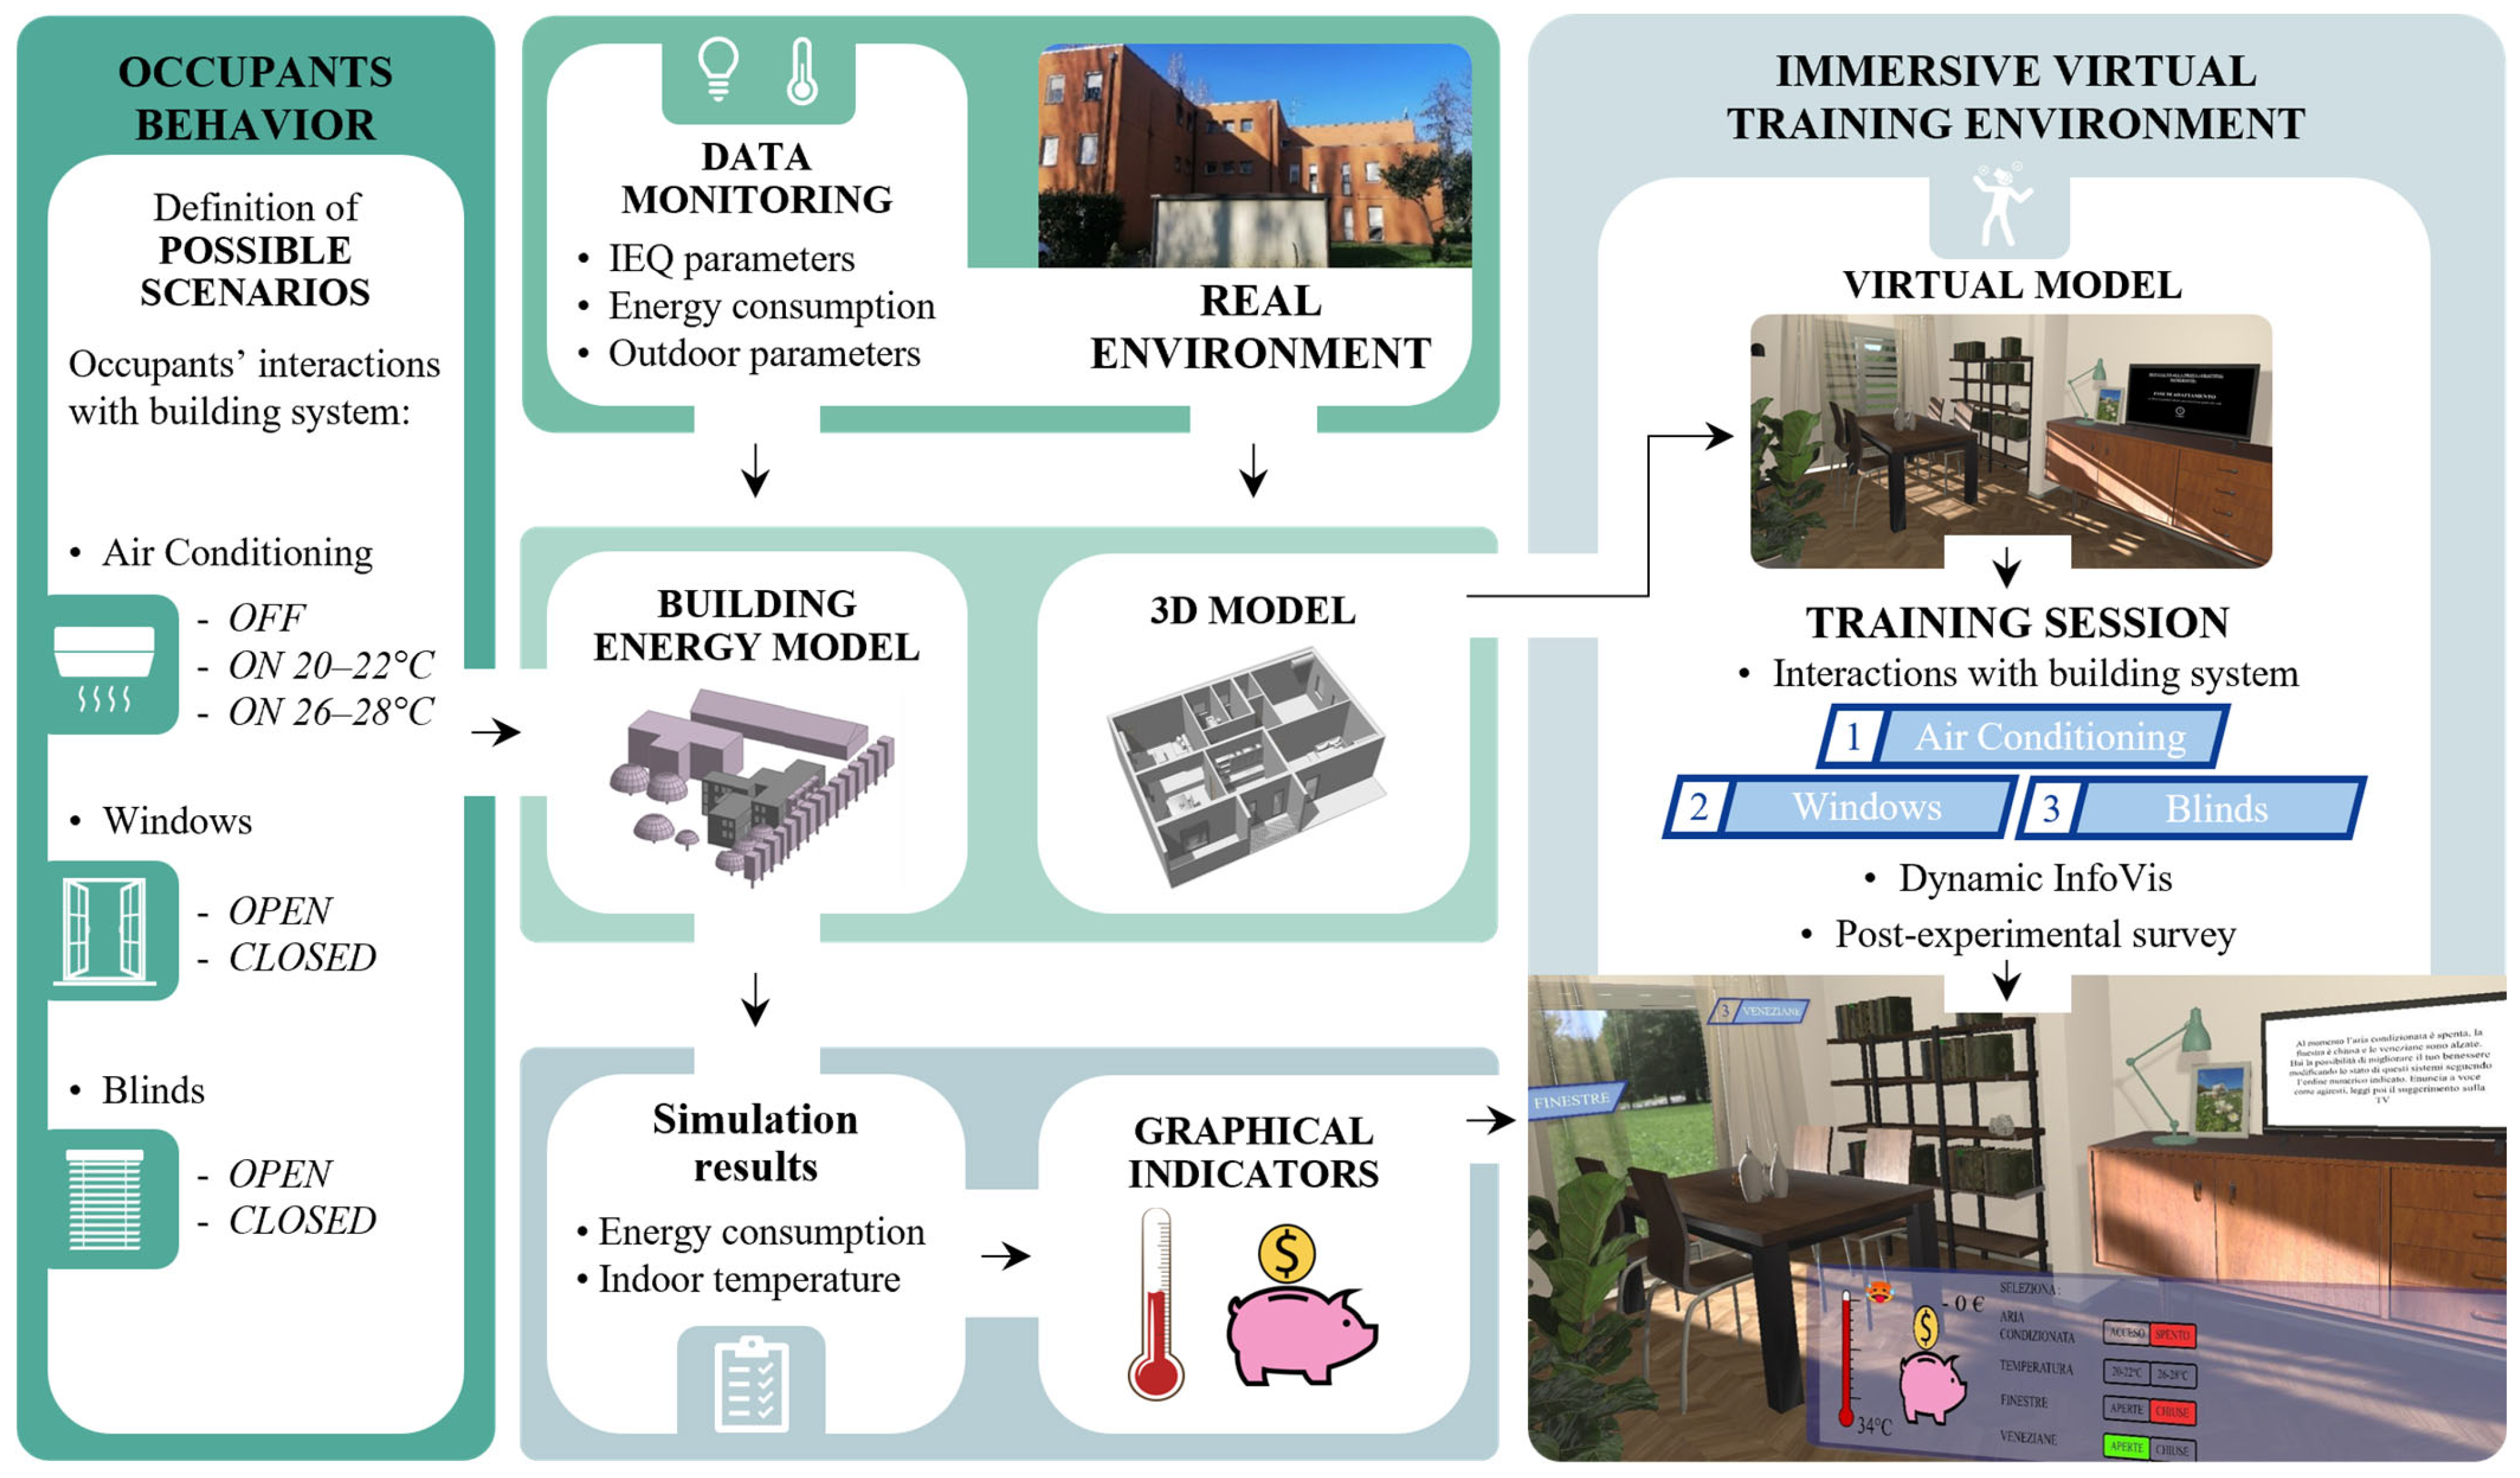
An overview of the methodological framework adopted to develop the immersive training system is displayed in
Figure 1. The main steps involved the following: the definition of possible interactions with three building systems (i.e., air conditioning, windows, blinds), the generation of a real case study Building Energy Model to extract the information at the base of the eco-feedback system (
Section 2.1), the design of the InfoVis system (
Section 2.2), the creation of the virtual environment representing the real case study, and its integration with the obtained feedback (
Section 2.3).
A total of 52 participants were voluntarily recruited to take part in a training activity in a residential Immersive Virtual Environment. The statistical power of the sample was verified using G*Power software version 3.1.9.7 (effect size = 0.5, minimum power = 80%, significance level = 0.05, two-tailed distribution [
38]). In order not to disrupt the validity of the results, standard inclusion criteria were applied, such as the absence of severe visual (e.g., colour blindness) or physical impairments (e.g., epileptic seizures); a normal physical health condition was also required.
The tests were carried out inside a test room (5.93 × 4.38 × 3.00 m) at the Department of Construction, Civil Engineering, and Architecture (DICEA) at the Università Politecnica delle Marche. It was equipped with air and operative temperature, humidity, and air velocity sensors of the HD32.1 Thermal Microclimate Station by DeltaOHM from GHM GROUP (Remscheid, Germany) [
39] to monitor the environmental conditions. The HVAC system was set up (at 29 °C) to simulate overheating conditions without an air conditioning system (29 °C).
2.1. Generation of the Building Energy Model
The first step in the workflow was to design the energy model of a real third-floor apartment of a social housing building in Reggio-Emilia, Italy. The building is a demonstrator of the LIFE SUPERHERO project [
40]. The envelope and internal vertical partitions (U = W/m
2K) consist of uninsulated prefabricated concrete panels with outdoor and indoor plaster, and double-glazed windows (U = 2.16 W/m
2K). The floors (U = 1.64 W/m
2K) are made of uninsulated reinforced concrete slabs, while the flat roof (U = 0.20 W/m
2K) consists of an insulated prefabricated reinforced concrete slab with a sheet metal finish. Each apartment is equipped with multi-split heat pumps for air conditioning in the living rooms and bedrooms. Since summer 2022, a wireless building monitoring system [
41] allows for the detection of several real-time data: indoor temperature, humidity, illuminance, CO
2, and human presence, via wall-mounted sensors in the bedrooms and living rooms; occupants’ behaviour in terms of the opening/closing activity of windows, by small sensors installed on the frames; and the electricity consumption for the cooling system, by energy meters. The roof’s thermal performance, in terms of heat fluxes through the roof and surface temperature, is also monitored.
Based on these real-time data, a previous activity allowed for the effective development and successful calibration of the corresponding Building Energy Model (BEM) [
42]. The BEM was developed based on the digital twin of the real building. Subsequently, DesignBuilder software version 7.1.3.015 was used for the 3D modelling and the definition of the thermophysical properties of the building envelope, systems, and schedule. Lastly, simulations were computed using EnergyPlus software version 23.2.0 [
43], and the corresponding results for the selected apartment were extracted and integrated as InfoVis. Specifically, the summer season of 2022 (from 22 June to 31 August) was selected as the reference period.
In the virtual training activity, 12 possible interaction scenarios (
Table 1) were hypothesised by combining the usage of air conditioning (AC), windows, and blinds. These specific interaction scenarios were selected to deal with the corresponding behavioural actions monitored and allowed in the real case study. Thus, the participants could choose from the following:
To turn the AC on by setting the temperature to 20–22 °C or 26–28 °C, or keep it off;
To open the windows or keep them closed;
To close the blinds or keep them open.
The same interaction scenarios were then simulated with the BEM. The hottest summer days in terms of measured outdoor temperature (24–25 July, maximum outdoor temperature value of 38.9 °C) were selected to run the simulations, while maintaining the behaviour settings [
37].
The outputs of interest were the resulting daily electrical consumption for the cooling system (kWh) and the indoor air temperature (°C) for each scenario. A post-processing step enabled us to convert the electricity consumption into the electrical energy costs by multiplying it by the current electricity price (EUR/kWh) set by the Italian national energy regulator, ARERA [
44].
2.2. Design of Graphical Indicators and Tips
Given the objective of the present research, InfoVis was designed to be part of the Immersive Virtual Environment and to highlight the impact of participants’ interactions on the energy consumption and indoor air temperature levels.
For this reason, a game-based visualisation technique, with 2D stylised graphical elements, was adopted in this case study, aligning with previous traditional eco-feedback systems [
8]. Specifically, InfoVis was composed of two 2D gauge graphical indicators, where the filling levels changed based on choices: a “thermometer” showing variations in indoor air temperature (°C), and a “piggy bank” displaying the energy consumption costs (EUR). The temperature level inside the thermometer increased or decreased based on the participants’ selection, just as the piggy bank was either filled or emptied with more frugal or expensive behaviour, respectively. Numerical information about temperature levels and consumption was coupled with graphical indicators, as an effective and quick solution to be interpreted by the users [
8].
In addition, to increase the participants’ awareness, textual information was also added. Indeed, tips were carefully designed for each possible interaction scenario (
Table 2), to enable the participants to acquire knowledge during the training activity and/or suggest a better choice. This would allow the users to make more prudent and sustainable decisions, both in the virtual environment and in real situations in the long term.
2.3. Generation of the Immersive Virtual Training Environment
The digital twin of the real building, used for the BEM, also provided the basis for developing the virtual environment. Indeed, the generation of the immersive virtual training environment (°) involved the 3D modelling of the real living room (26.84 square meters of area, and height of 2.7 m), building the precise room geometry (i.e., walls, ceiling, floor, window, and door), and integrating imaginary indoor furniture.
Subsequently, the 3D model was virtualised using Unity version 2021.3.38f1 [
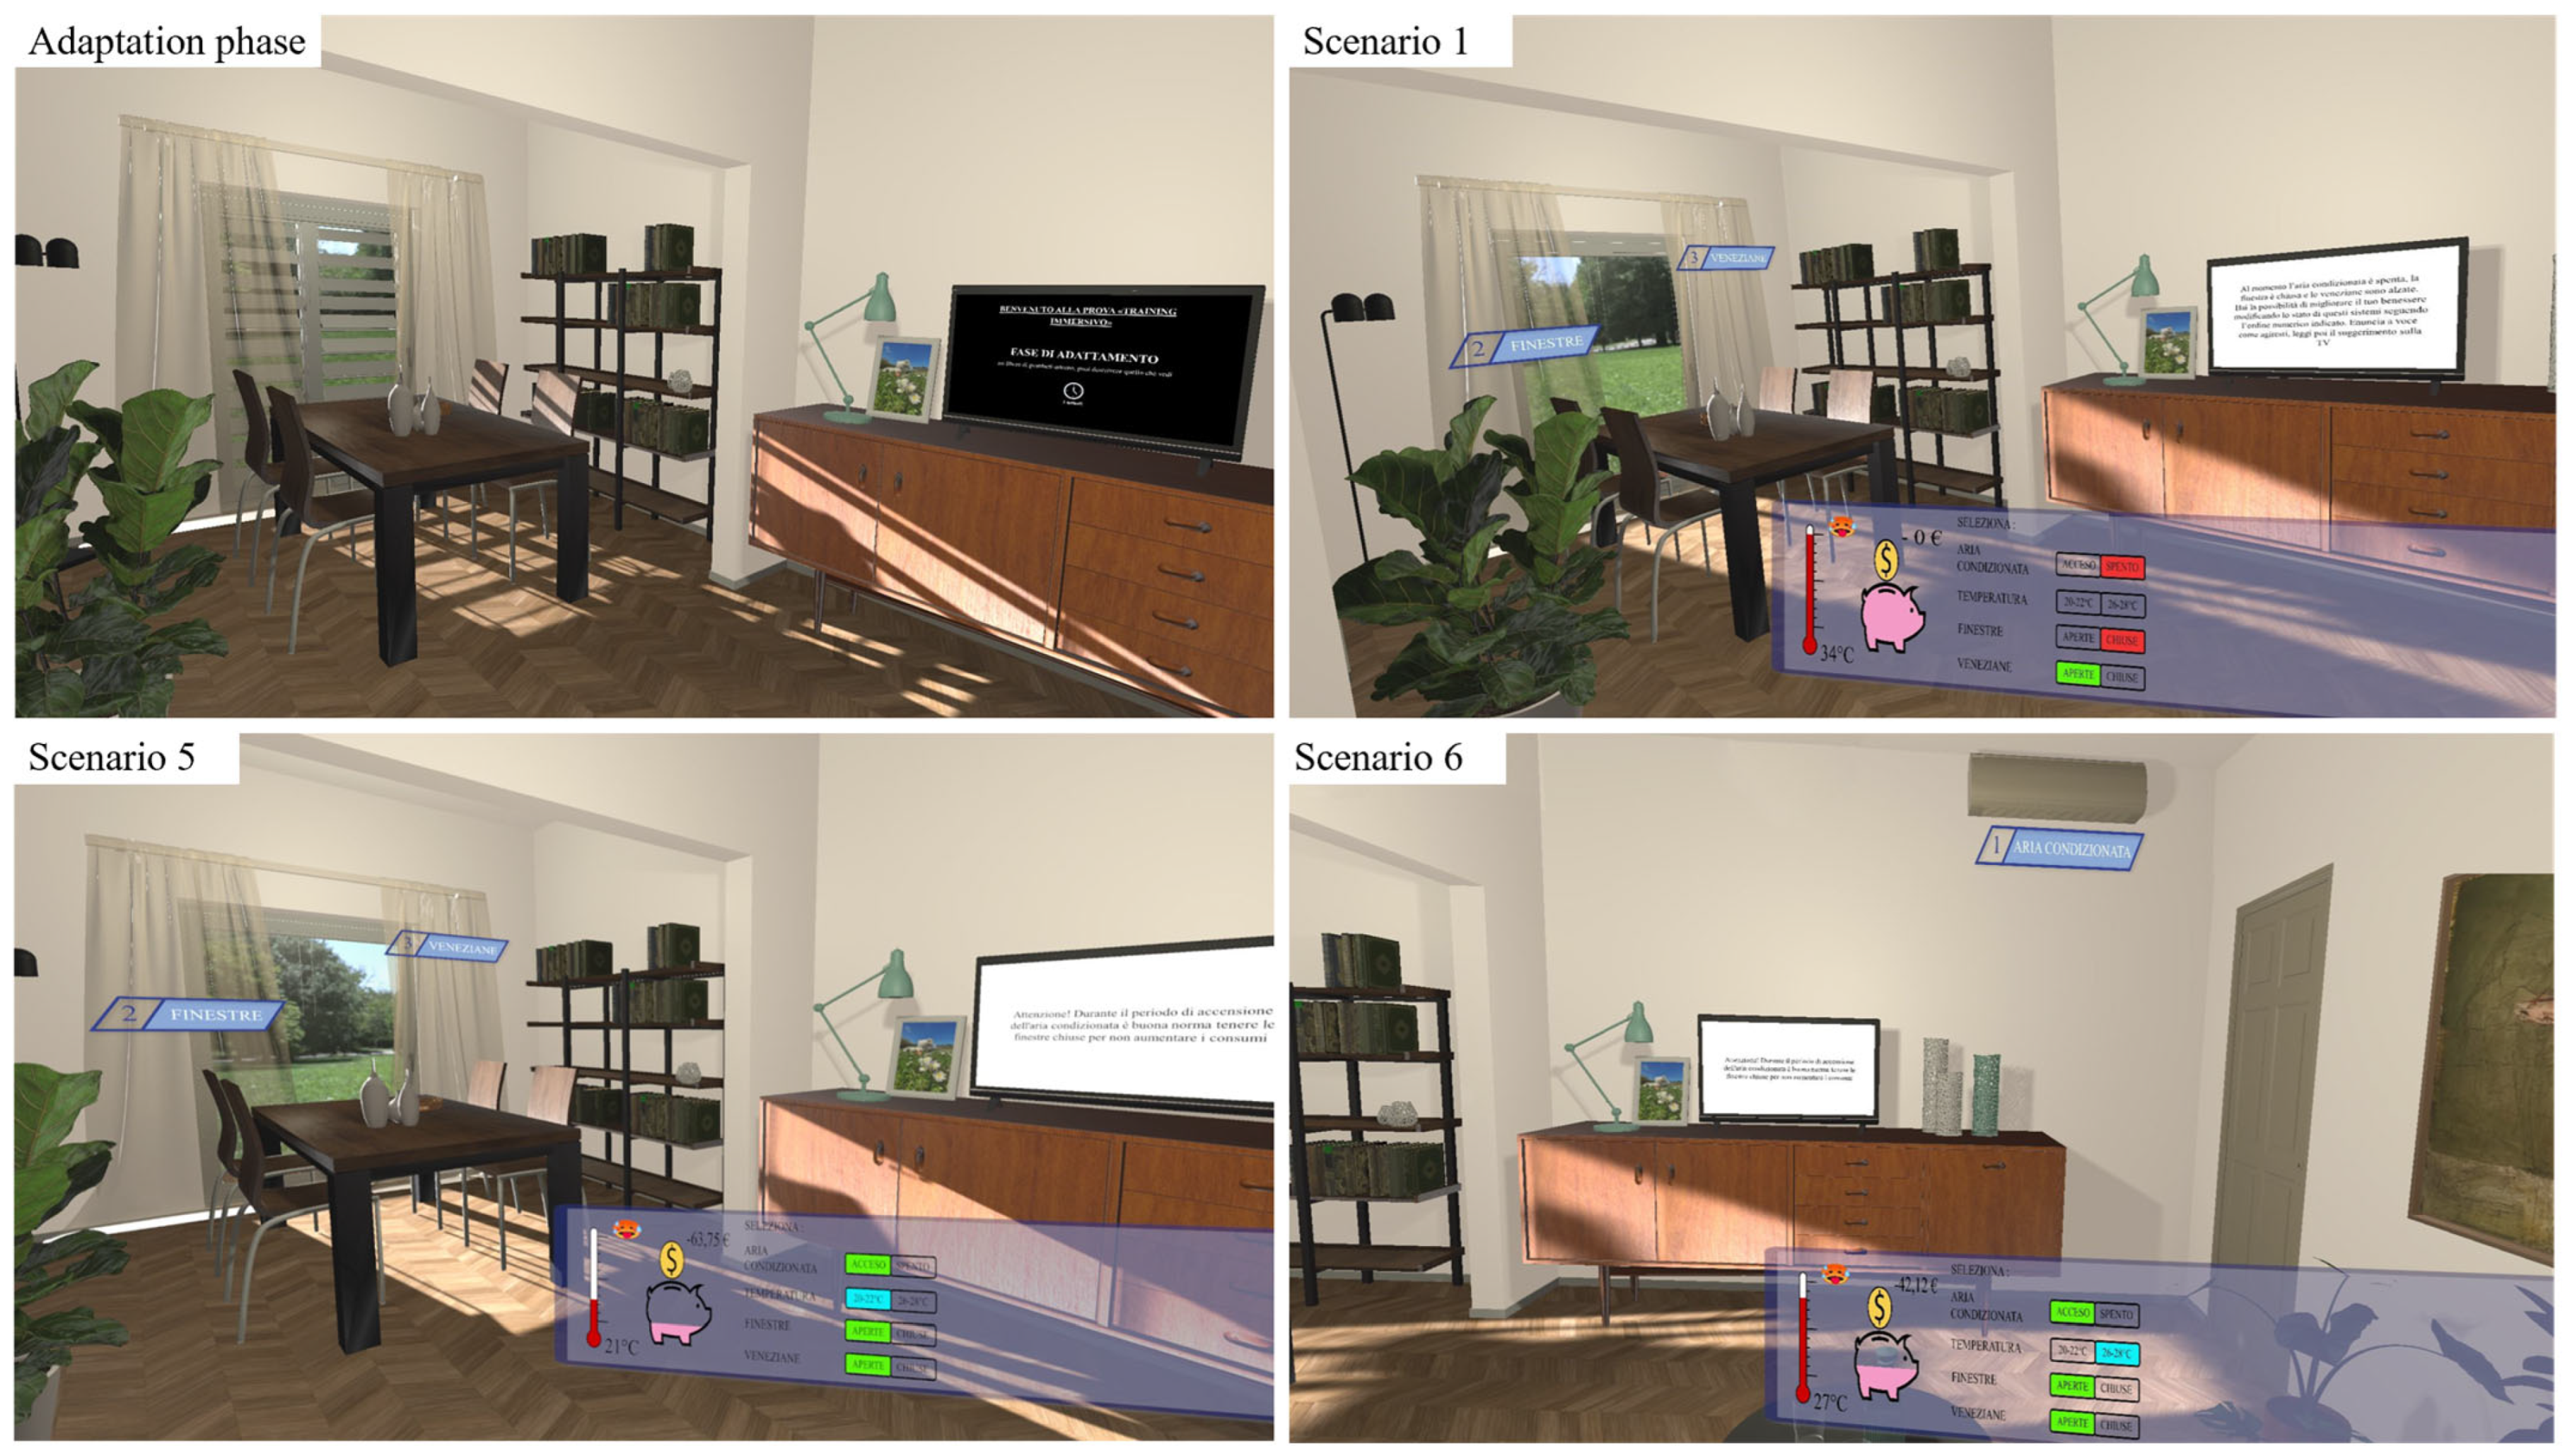
45], a game engine software that allowed us to apply realistic materials, lights, and the first-player control camera. Unity was used also to apply a physical-based SkyBox surrounding the virtual model to match the simulation conditions (i.e., sunny summer days). The model was created with the highest level of detail, as shown in
Figure 2, to ensure that it adequately replicated real-world settings.
Once the virtual model, texture, and camera were ready, the graphical indicators and tips based on the BEM simulation results were imported into Unity. The graphical indicators, coupled with the status of each system (i.e., air conditioning, windows, blinds), were presented within a banner in the participant’s field of view. Specifically, a graphical user interface system was created for each indicator (i.e., the thermometer representing indoor temperature variations, and the piggy bank for energy costs). Simultaneously, tips were displayed on the virtual TV screen and changed over time, following the same design principle as the graphical indicators.
The automatic, dynamic, and real-time variation in the indicators based on the participants’ choices was enabled with a series of C# scripts.
An HTC Corporation VIVE PRO Eye head-mounted display (1440 × 1600 resolution image per eye, a pixel density of 615 PPI, a field of view of 110° per eye, and an adjustable interpupillary distance from 60.7 to 73.5 mm) and the SteamVR plugin [
46] enabled the visualisation of the model.
2.4. Experiment Design
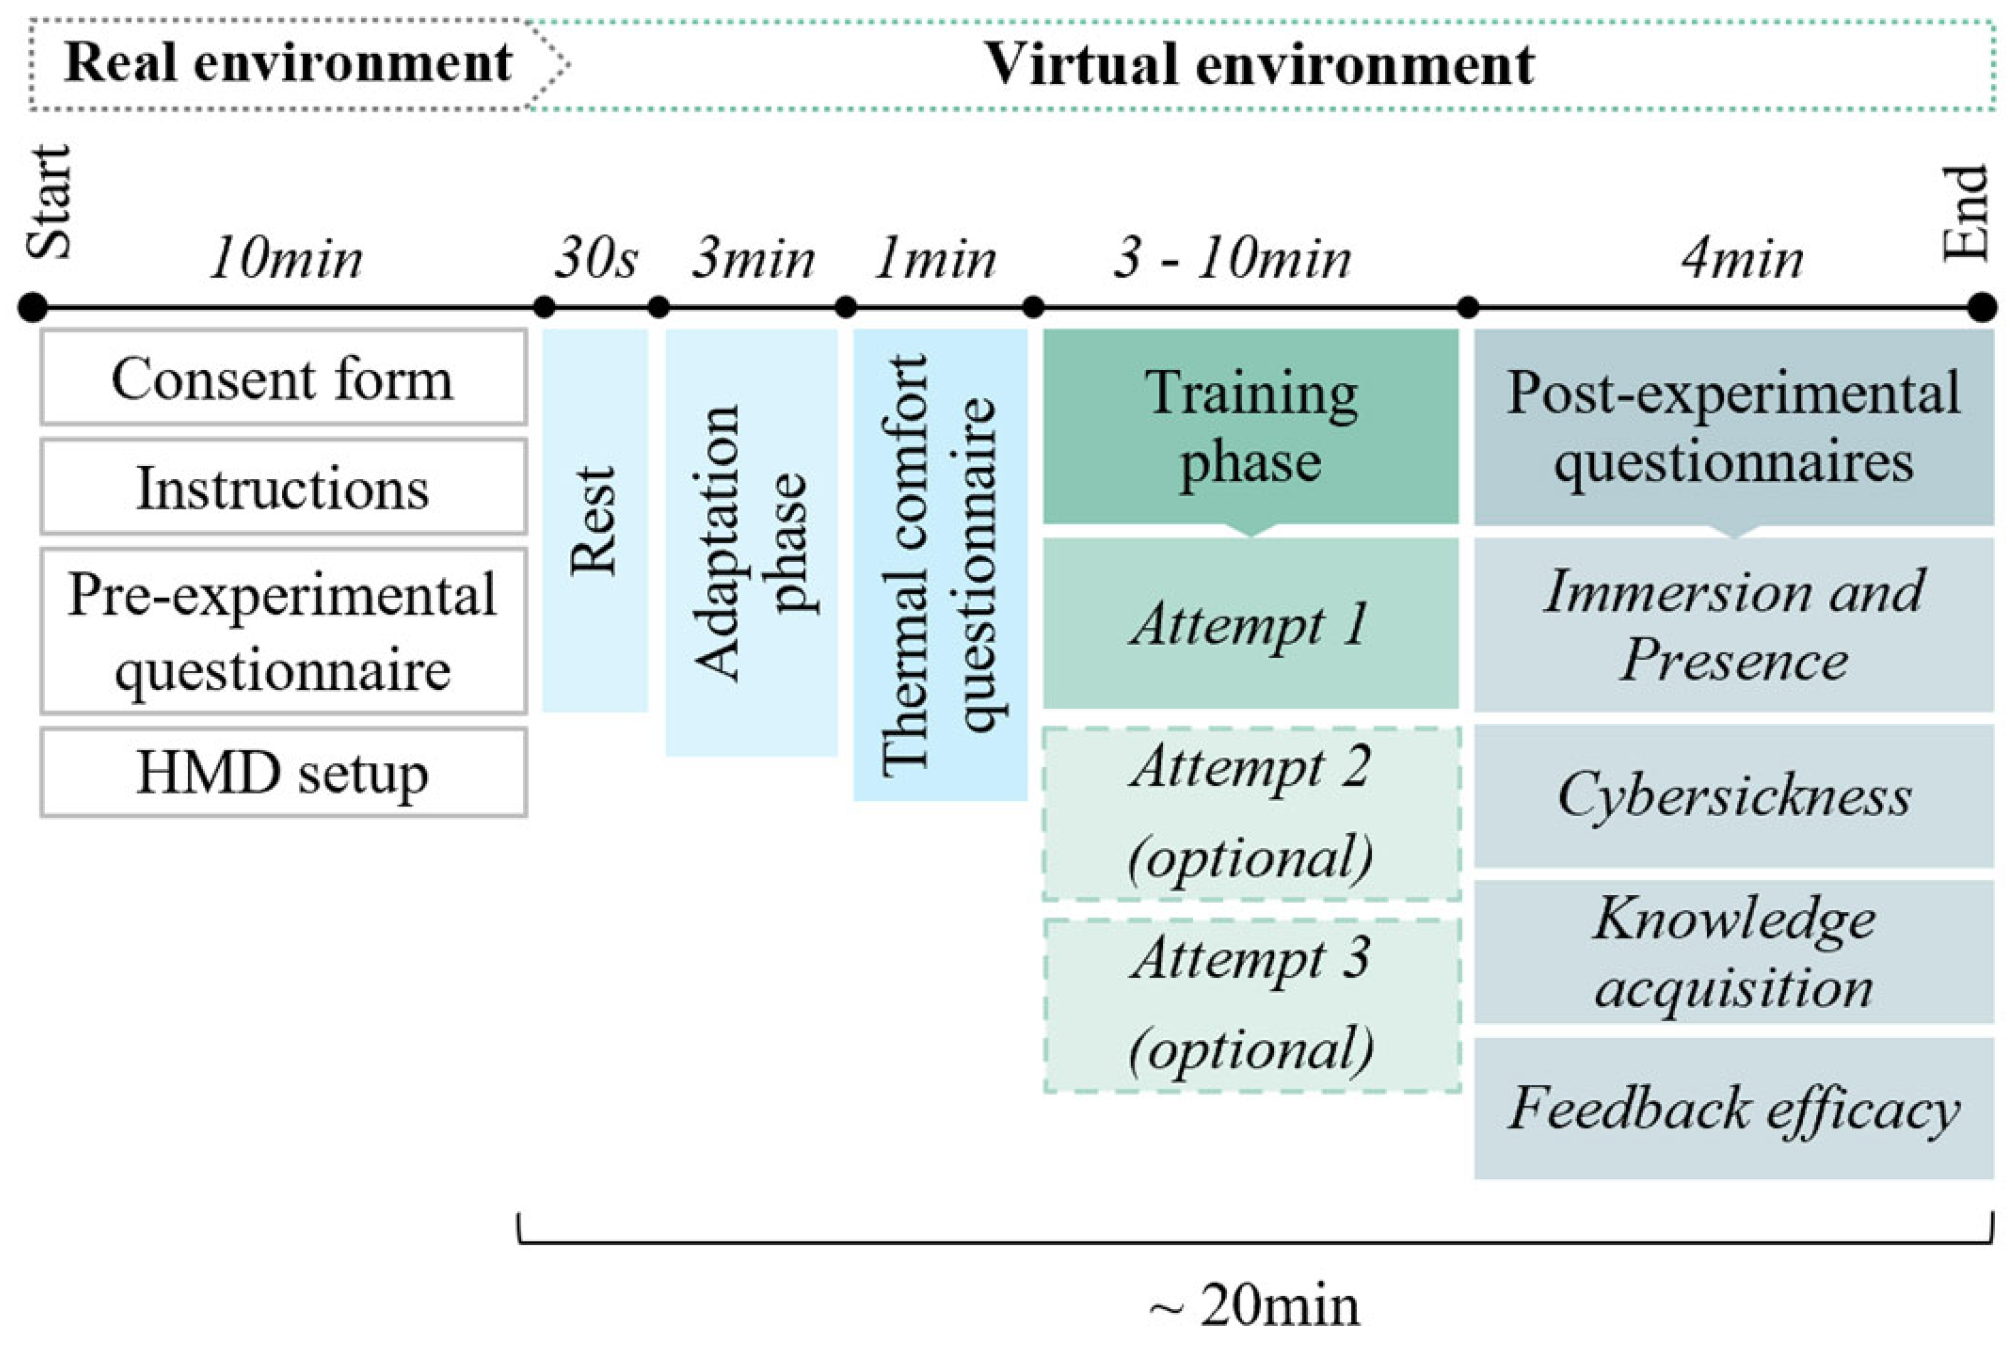
The experimental procedure developed and performed by the participants is presented in
Figure 3.
All of the participants started with a pre-experimental phase in the real environment (15 min long). Once they signed a consent form and received information about the training activity, they completed a pre-experimental questionnaire about general information while getting used to the indoor climate conditions:
Demographics: Questions relating to gender, age, education level, garments worn during the test, and eyesight problems that could affect how a participant perceived the immersive environment;
Virtual Reality: Previous experiences with virtual environments;
Environmental awareness: Questions relating to the use of educational tools, attendance of specific events, and constant updating on environmental issues.
Then, the participants were instructed to wear the head-mounted display, rest with their eyes closed (30 s), and adapt to the virtual scene for 3 min by freely experiencing the model to facilitate immersion and a sense of presence [
27]. Immersion indicates the “state in which a participant becomes attracted and involved in a virtual space of an activity to an extension that his or her mind is separated from the physical space he or she is being active in” [
47]. It strictly depends on visual realism, display parameters, haptics, sound, and the degree of the user’s interaction [
48,
49]. Presence is concomitant with immersion, since it refers to “the sense of being in an environment” [
50].
At the beginning of the training phase, the participants rated their thermal comfort via a questionnaire presented on the virtual TV screen. Then, they were asked to improve the air’s thermal condition by choosing to interact with the three building systems (i.e., air conditioning, windows, and blinds) and modifying the baseline scenario (with air conditioning off, windows closed, and blinds open). The indoor climatic condition remained constant throughout the pre-experimental, operative, and post-experimental phases, and it did not vary based on the participants’ desired interactions.
Once the participants had selected their preferred settings, the graphical indicator updates and the corresponding tip were displayed on the virtual TV screen to inform the about the indoor climate and energy cost consequences. The participants could repeat the training session if desired, trying other interaction combinations. Lastly, they completed a post-experimental survey to analyse whether they considered the virtual environment to be effective for the research purposes, with questions about the following aspects integrated in the virtual environment and displayed on the TV:
Ecological validity of the virtual model, concerning the immersion and sense of presence, along with cybersickness disorders [
27]. In particular, four indicators from the Igroup Presence Questionnaire (IPQ) were investigated on a seven-point Likert scale (“strongly agree” to “strongly disagree”): graphical satisfaction (GS), spatial presence (SP), involvement (INV), and experienced realism (REAL). The Virtual Reality Sickness Questionnaire was adopted to measure six possible disorders (general discomfort, fatigue, eye strain, difficulty in focusing, headache, and vertigo) on a five-point scale (“not at all” to “a lot”).
Training system efficacy, by asking participants to rate the potential knowledge acquisition, recommendations (i.e., graphical indicators and tips), effectiveness, and simplicity on a seven-point Likert scale (“strongly agree” to “strongly disagree”) [
51].
In general, selected interactions and responses to the post-experimental questionnaire were given by voice and recorded by the staff. To reduce fatigue and exposure to the virtual environment, each test session lasted less than 30 min.
3. Results
The collected data (i.e., subjective answers to questionnaires and interaction choice data) were analysed to verify the ecological validity of the Immersive Virtual Environment (
Section 3.2), the efficacy of the immersive training activity to increase users’ awareness of energy-related behaviour and the air’s thermal condition (
Section 3.3), and the effectiveness of the graphical indicators and tips (
Section 3.4). Specifically, the participants’ choice data were investigated as follows: number of attempts, meaning how many times the participants performed the training phase (continuous data type); type of interaction, which is a categorical data type based on the selection of systems’ statuses (e.g., air conditioning off–windows open–blinds closed, or air conditioning on at 20–22 °C—windows closed–blinds closed). The description of the participants is reported in
Section 3.1.
3.1. Sample Analysis
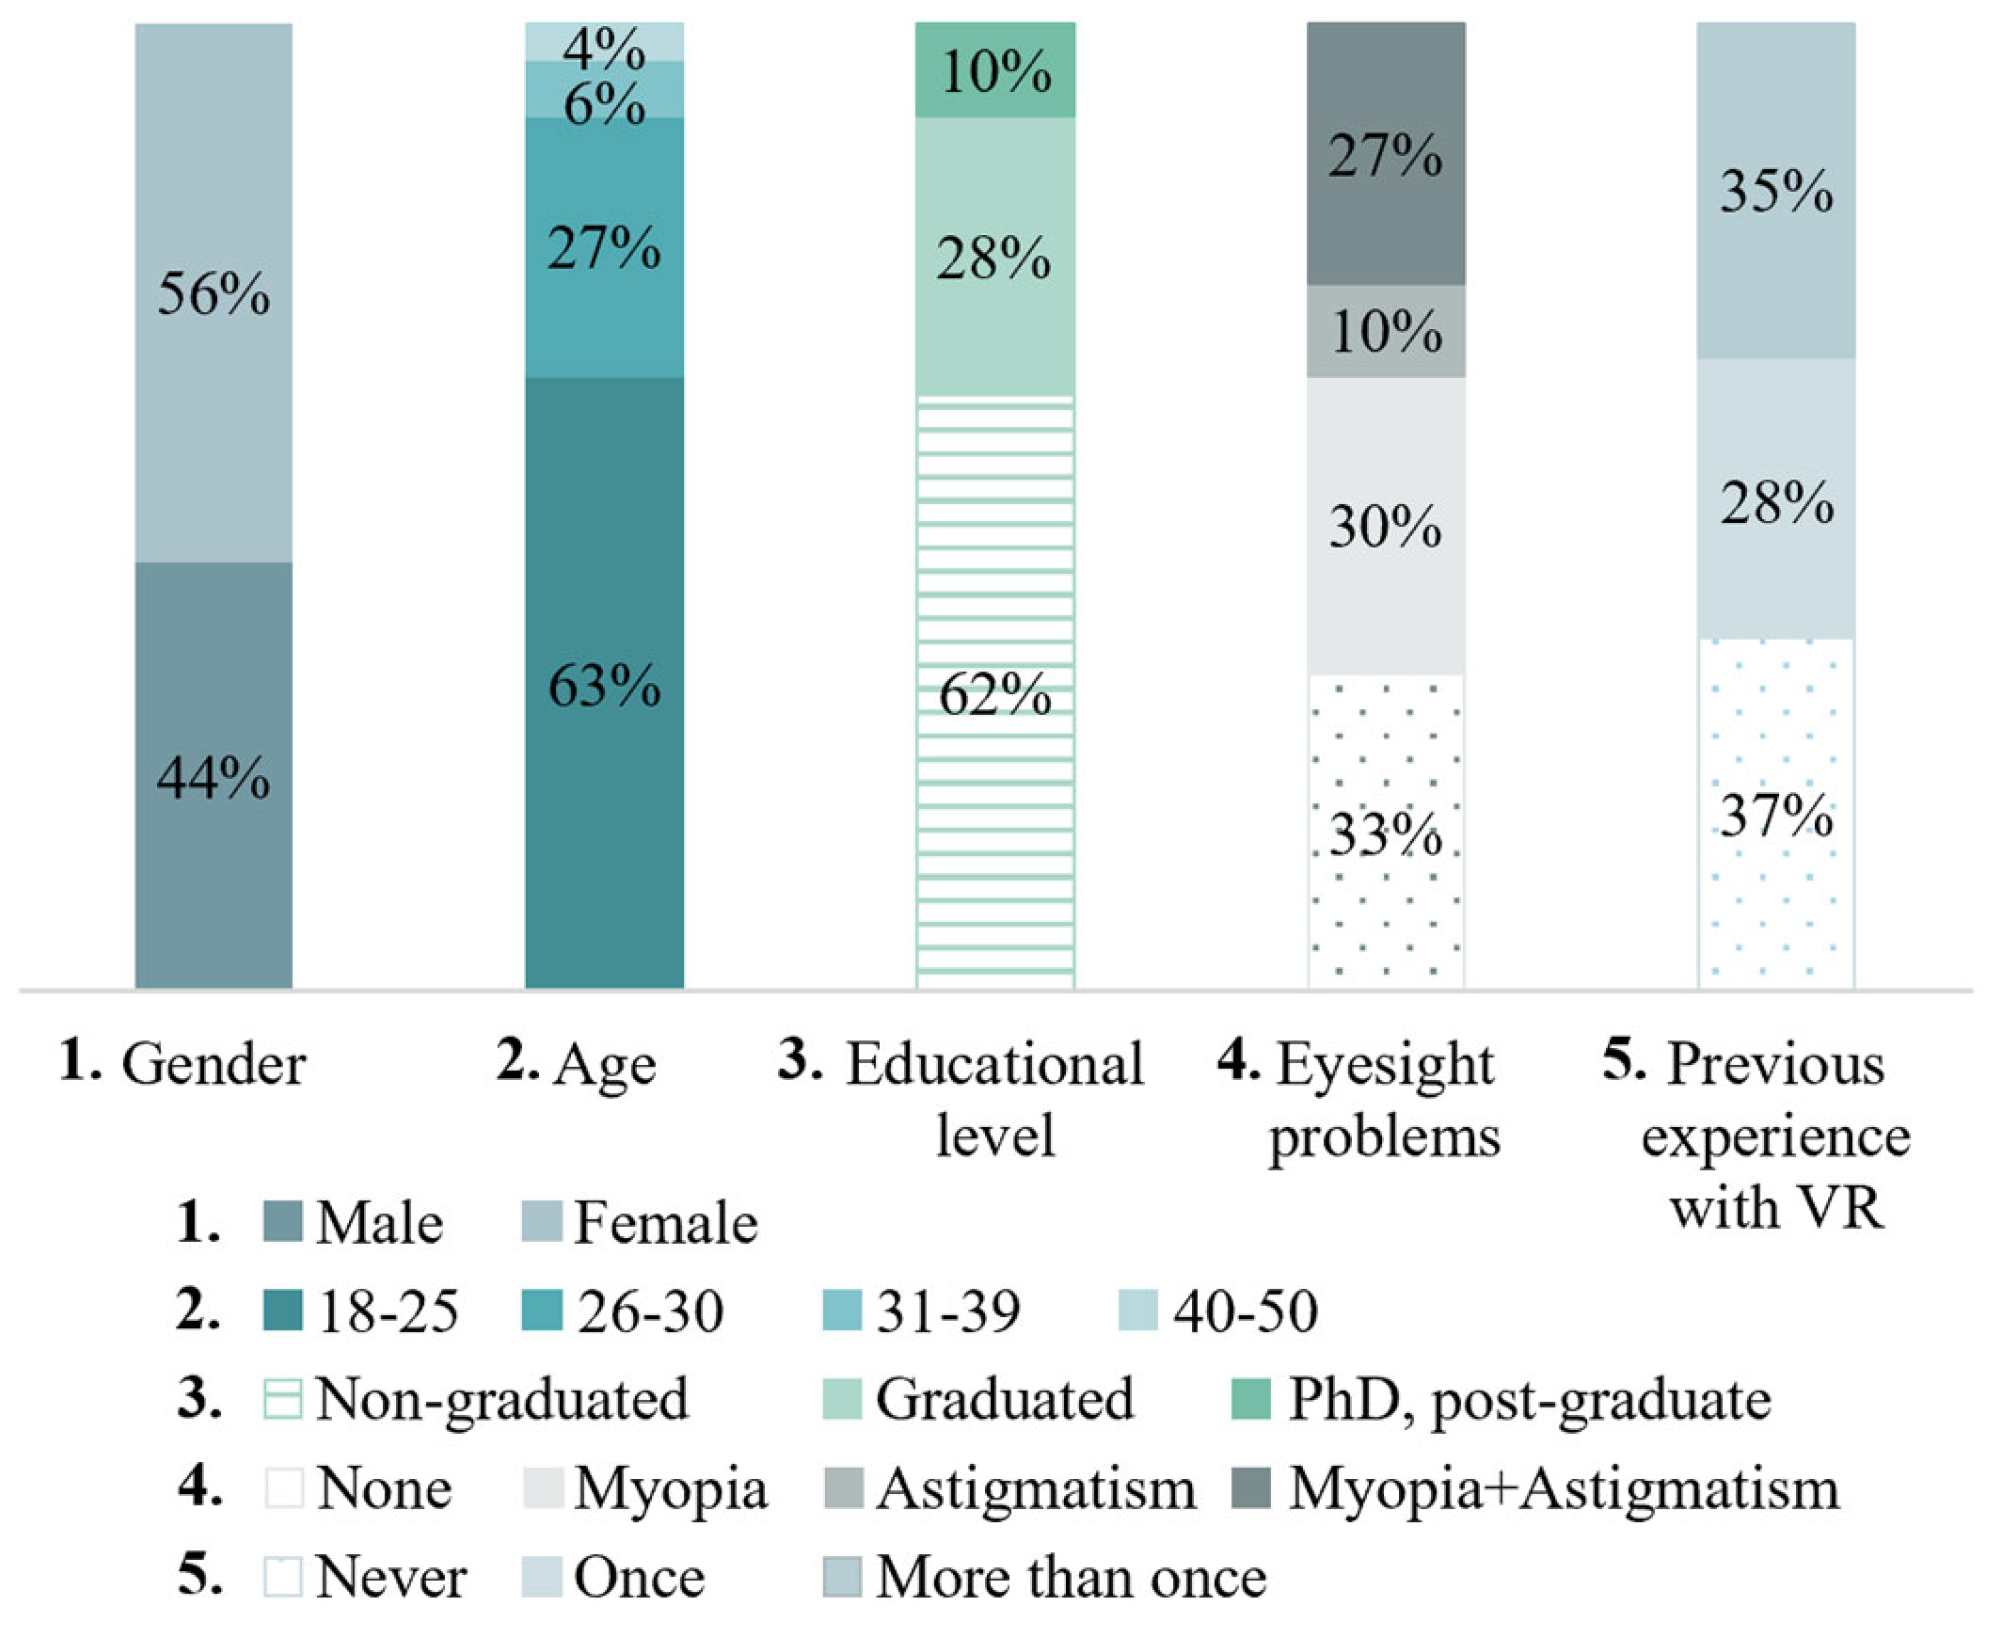
A total of 52 participants (44% male and 56% female) voluntarily performed the experimental activity. The average age of the sample was 25.4 ± 5.5 years, with a range from 18 to 46 years old.
The majority of the participants (62%) were non-graduated students, while the remainder were graduated (28%) or had a higher educational qualification (10%).
More than half of the sample (67%) had common eyesight problems (e.g., astigmatism, myopia); thus, they wore corrective lenses during the test in order to correctly visualise the model.
In addition, the analysis of the participants’ previous experience with Virtual Reality highlighted a varying level of familiarity with this technology: 37% of the participants reported never having experienced VR before, 28% indicated having tried VR on a single occasion, and 35% reported more than one previous experience. The description of the sample is depicted in
Figure 4.
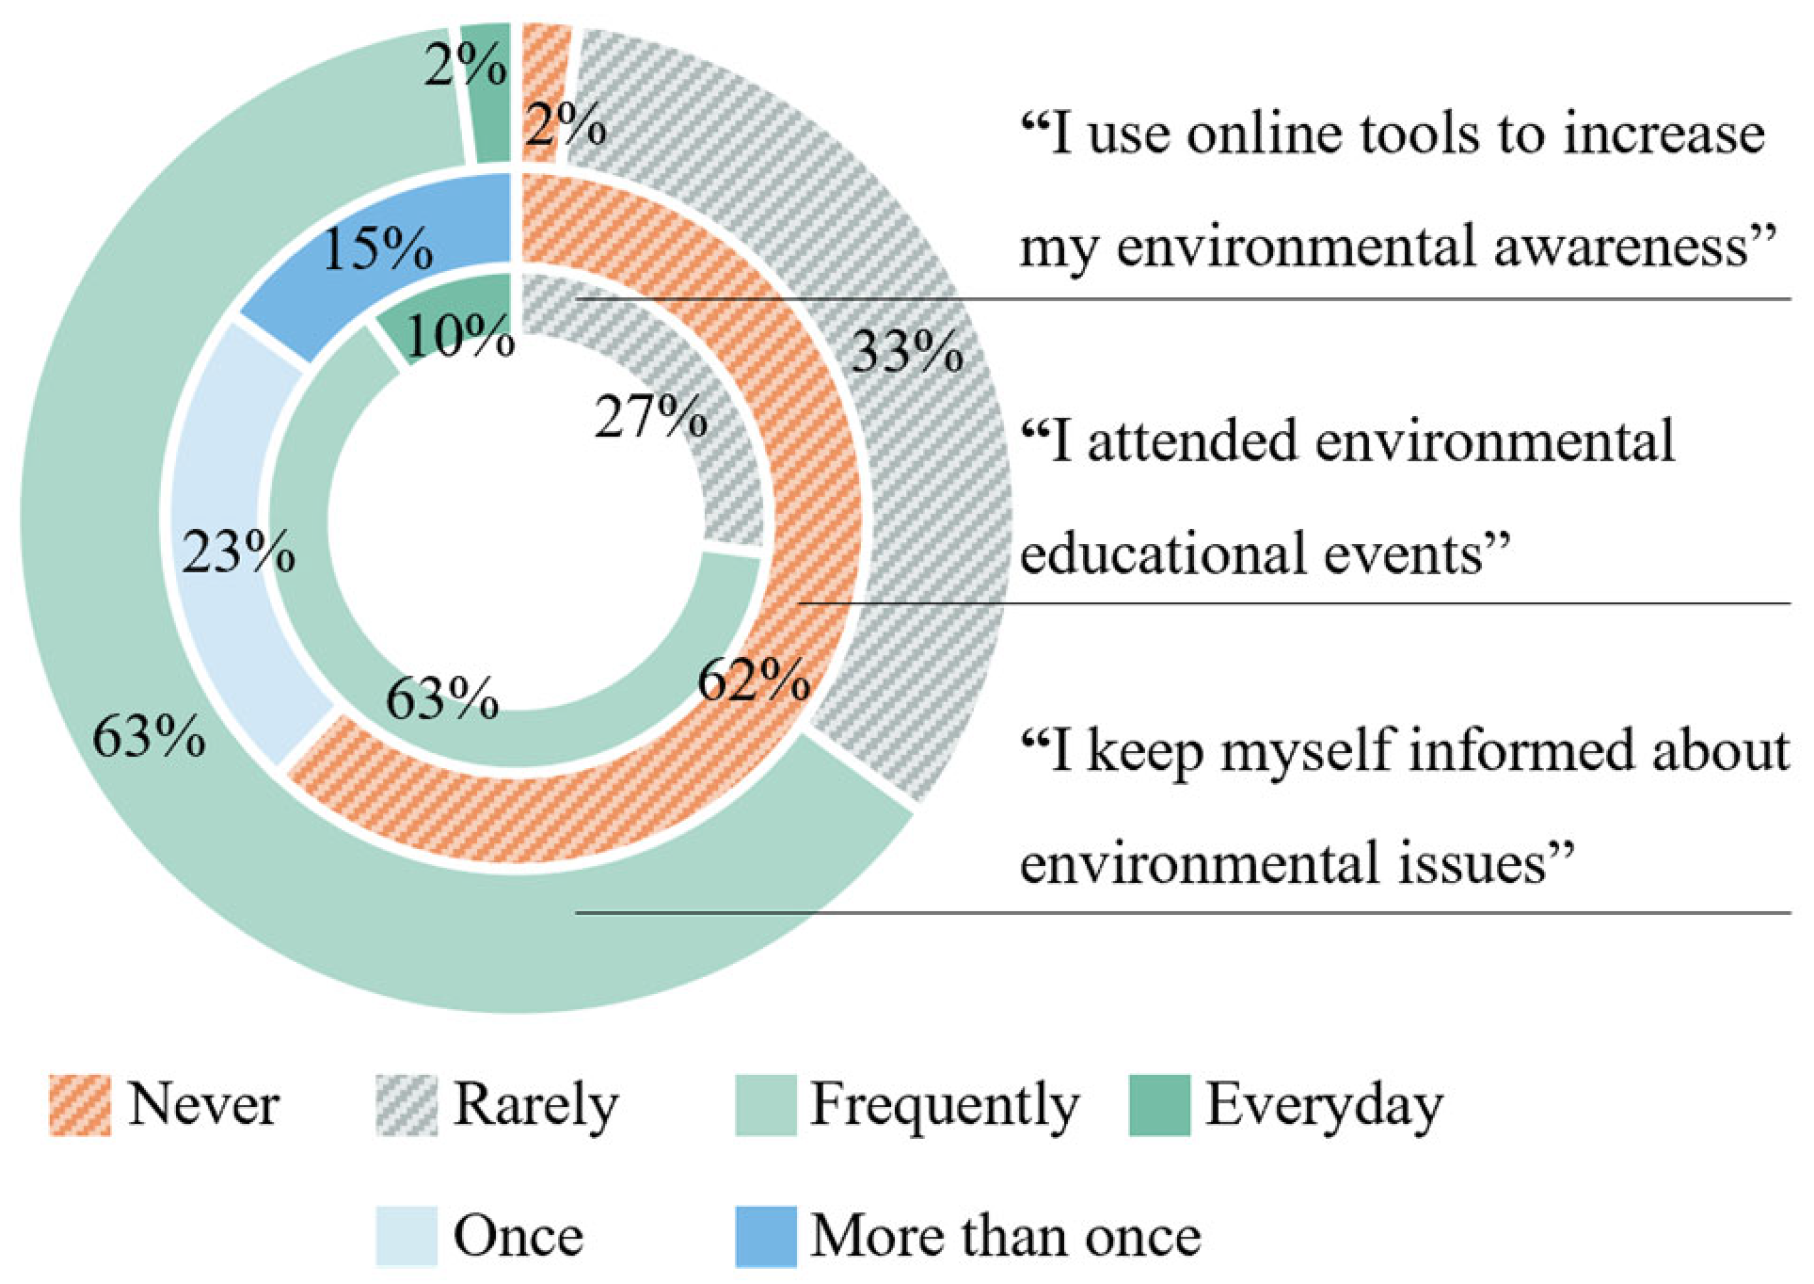
As shown in
Figure 5, most of the participants (65%) reported that they at least frequently or daily update themselves on environmental issues, with a main preference for the adoption of online tools (e.g., social apps, web) to increase their environmental awareness (73%). However, a significant portion of the participants (62%) reported never attending specific environmental educational events.
Since the experimental activity was carried out during the summer season, the participants wore typical lightweight garments with a thermal resistance of approximately 0.4 ± 0.1 clo [
52].
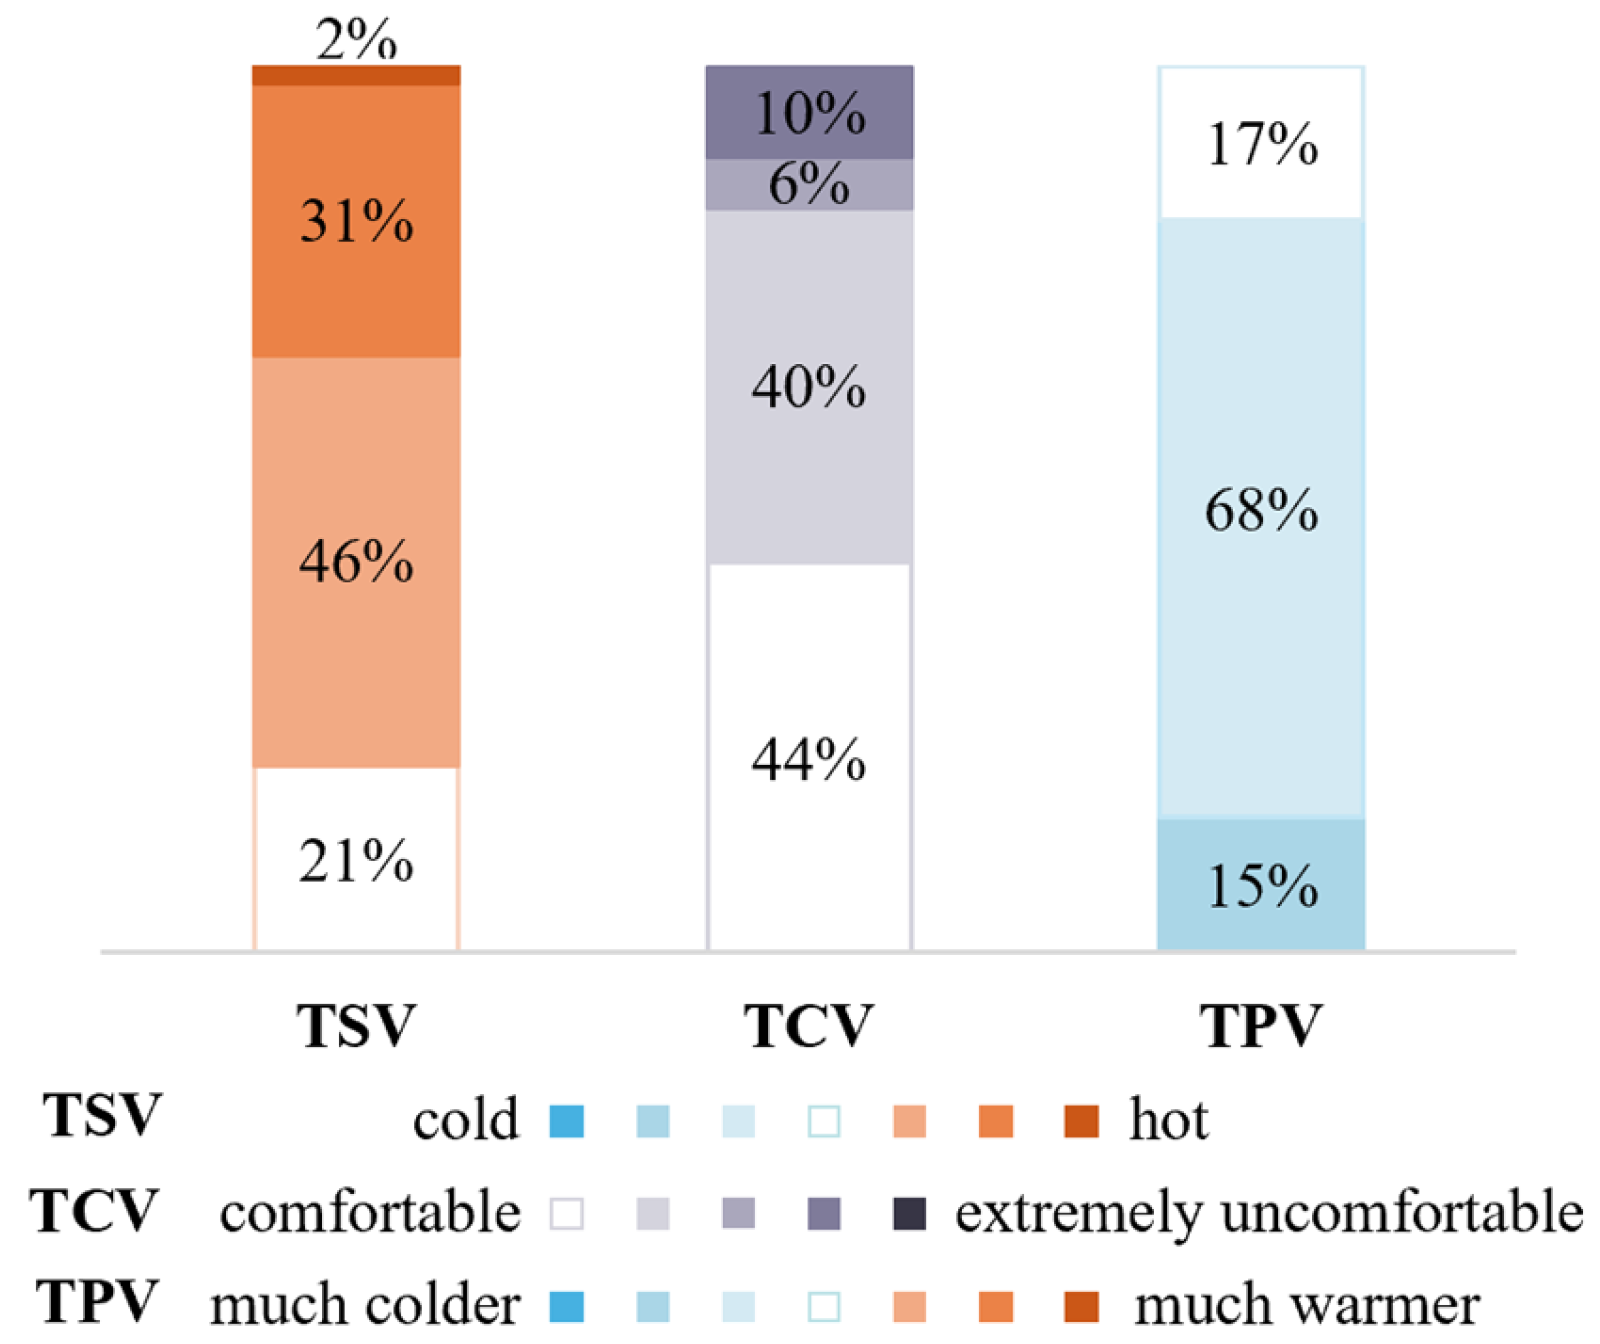
During the test, the HVAC system was set up to simulate indoor summer conditions, with a mean air temperature of 29.10 °C (±0.42), relative humidity of 41.52% (±2.32), mean radiant temperature of 28.71 °C (±0.44), and airflow speed of 0.06 m/s (±0.05). As a result (
Figure 6), 79% of the participants reported feeling at least slightly warm (TSV), resulting in an uncomfortable indoor environmental condition for more than half of them (TCV, 56%). Consequently, most of them (83%) would have preferred a thermal environment that was at least slightly cooler (TPV).
3.2. Ecological Validity of the Immersive Virtual Training Environment
To ensure the feasibility and effectiveness of the research results, the four IPQ indicators were analysed, rescaled to a five-point scale, and then compared to previous studies [
27,
53,
54,
55] that applied IVEs in the research field of human behaviour. As presented in
Figure 7a, the values of GS (4.56), SP (4.41), and REAL (4.29) in the present study were higher than the score corresponding to a moderate level (i.e., 4) on a five-point Likert scale. In addition, the comparison revealed that the SP score was higher than the references, while GS and REAL were almost similar to the highest values from the two previous studies of Latini et al. [
27,
55] (differences equal to 0.02 and 0.07 for GS, and 0.18 and 0.26 for REAL). Conversely, the INV score was slightly lower, at a moderate level, but similar to previous studies such as that of Buttussi et al. [
53].
The cybersickness questionnaire results (
Figure 7b) revealed that almost the entire sample (96%) did not suffer from
vertigo and
headaches during the test, except for two participants reporting a slight effect for both symptoms (4%).
General discomfort and
fatigue were also minimally detected, with more than half of the sample (54% and 87%, respectively) assigning a score of “not at all”. A small group of participants (23%) reported mild
eye strain, probably linked to the
difficulty in focusing experienced by 46% of them, and caused by the slightly blurred images presented by the head-mounted display.
3.3. Immersive Training Results
To assess the effectiveness of the immersive training activity, the participants’ choice data were analysed with respect to the number of attempts and the type of interaction to change the baseline scenario (“Air Conditioning Off, Window Closed, Blinds Open”).
The whole sample (n = 52) was instructed to perform at least one attempt.
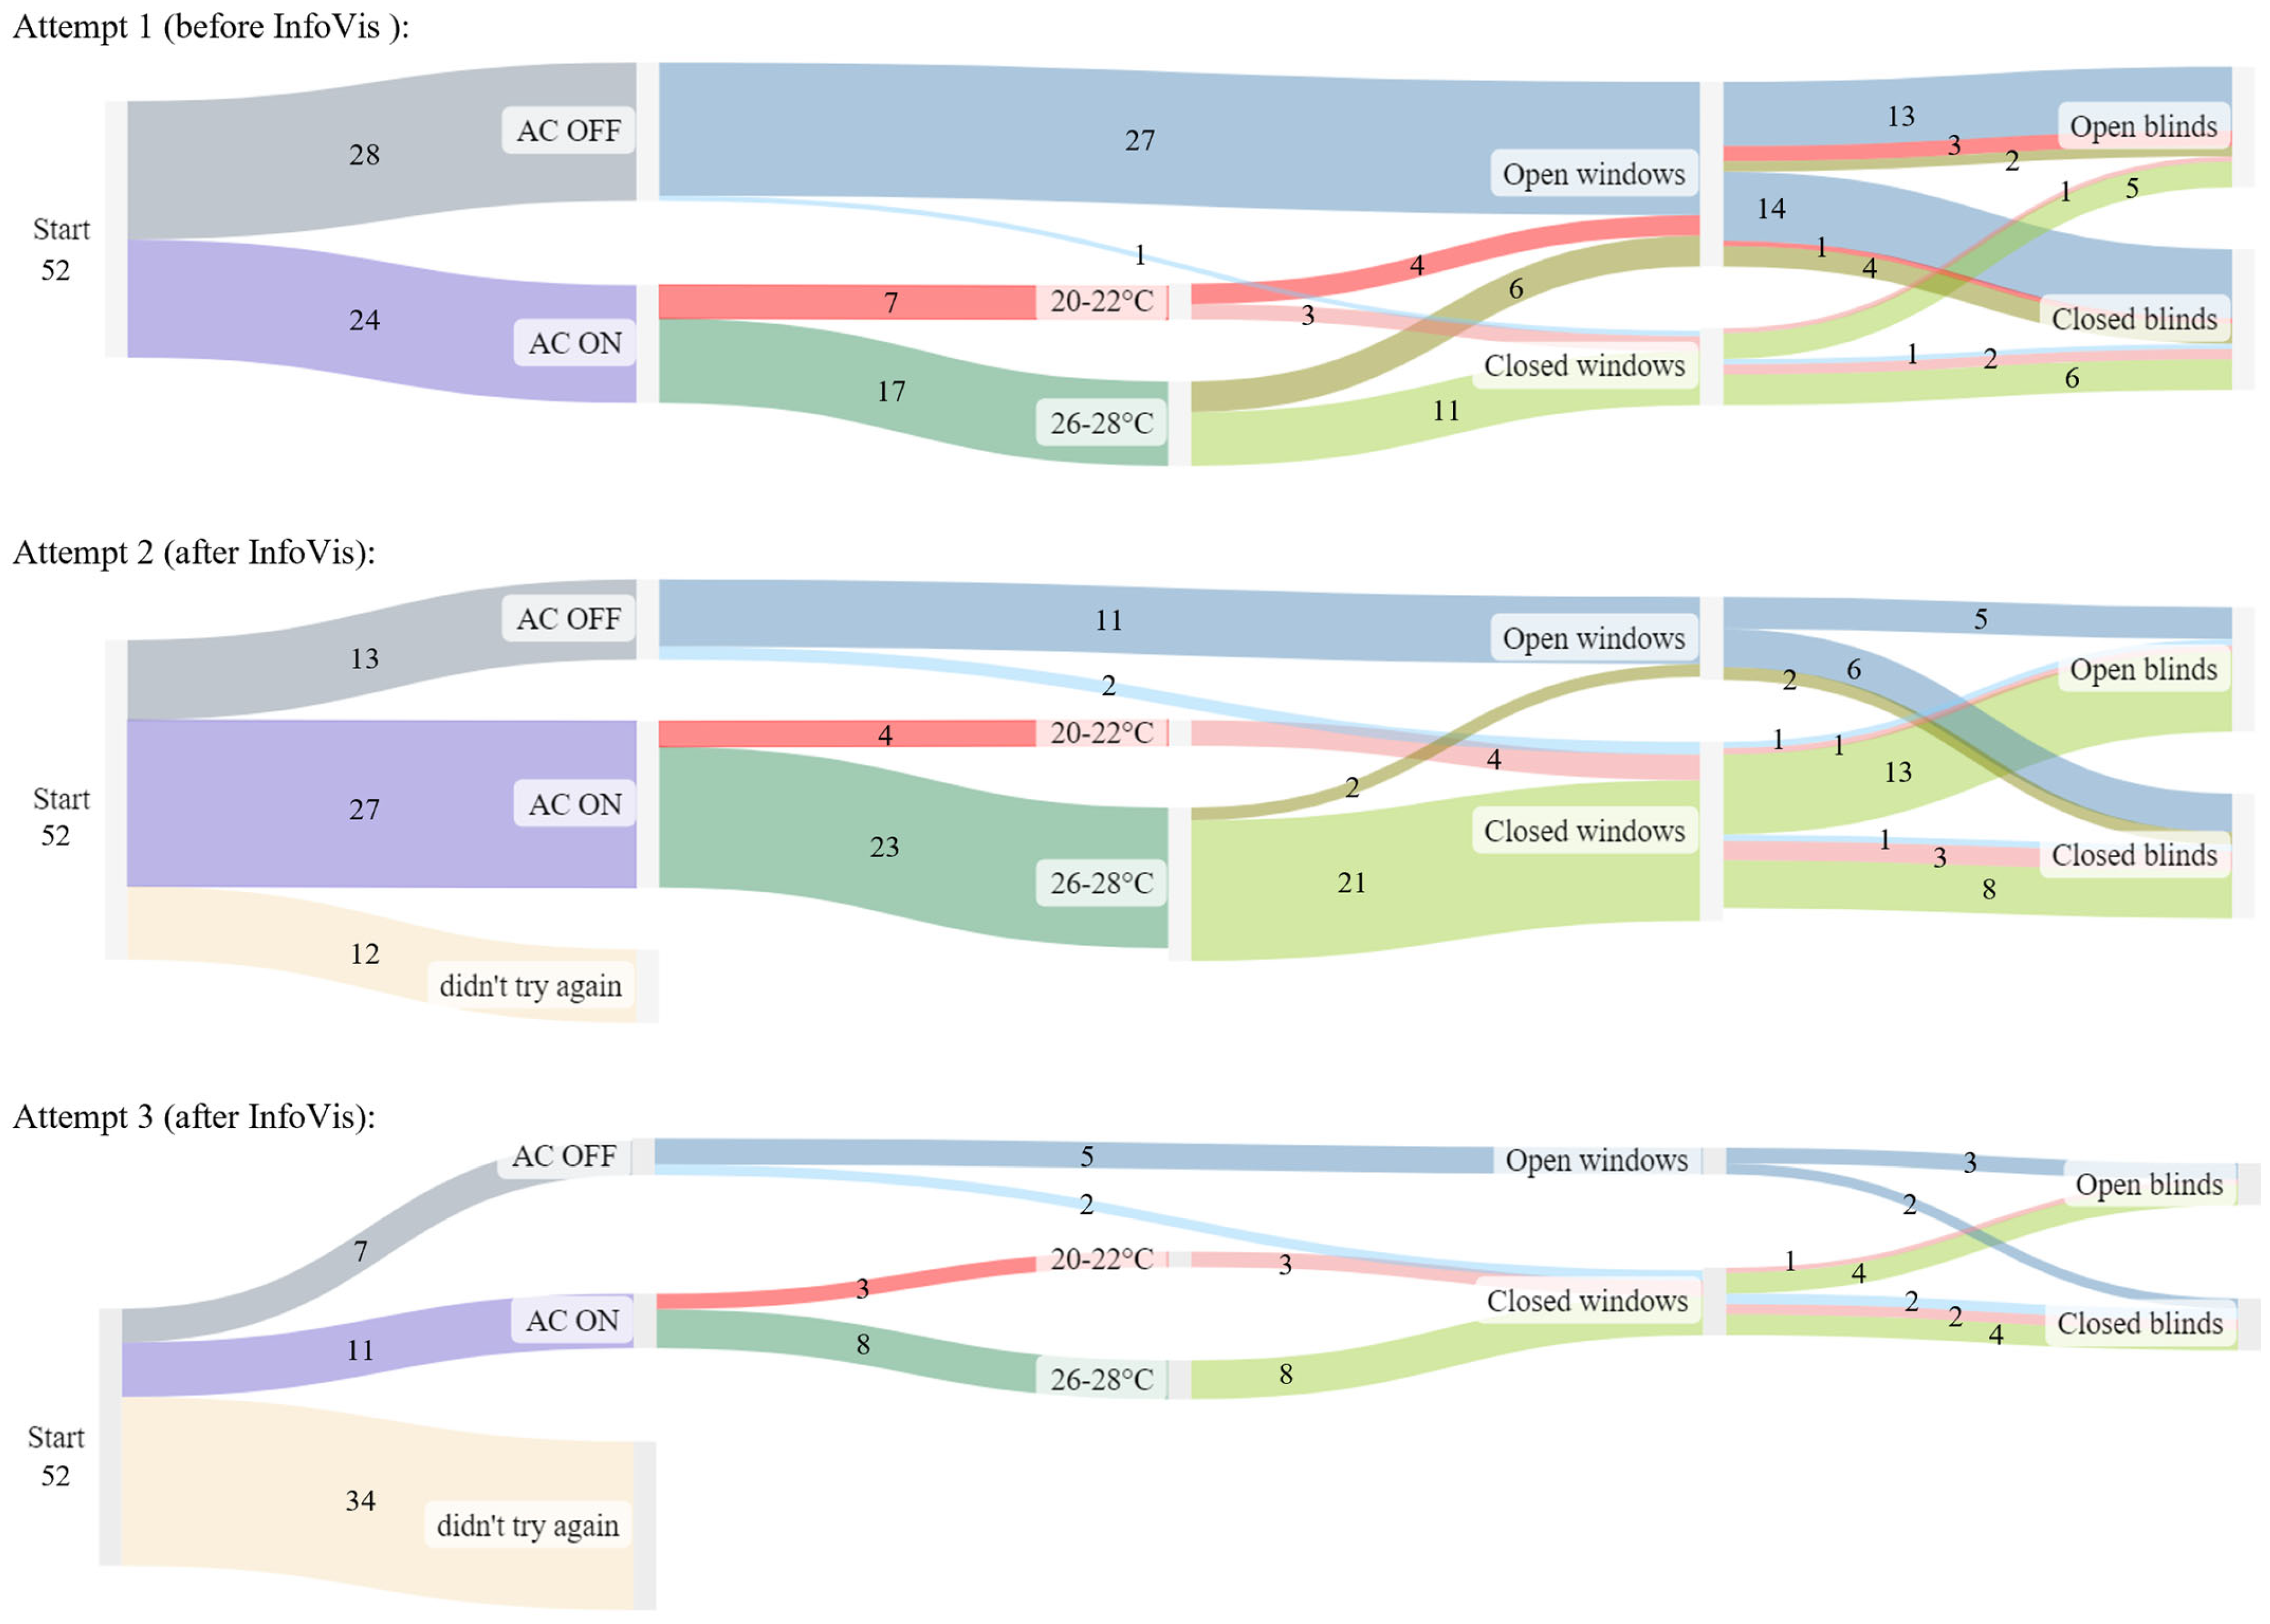
A Sankey diagram was developed to analyse the variation in the participants’ choices in the three game attempts (
Figure 8). The following considerations were drawn from the analysis, outlined for each attempt.
First attempt: Before the InfoVis, most of the sample intended to keep the air conditioning off and open the window. Among those who selected the activation of the cooling systems, the majority selected the higher set-point. More than half of this sub-group decided to keep the windows closed with the air conditioning on, while 10 erroneously decided to open them. Concerning the blinds’ state, 28 subjects decided to close them to limit summer insolation in the hottest hours of the day, and 24 chose to keep them open.
Second attempt: After the first mandatory choice, the participants were then given the option to try different interaction combinations, which may have been exploratory. Therefore, the second attempt was performed by 77% of the sample. Based on the results, the visualisation of graphical indicators and tips enabled a variation in the participants’ choices. The number of people who would have left the air conditioning off was halved, and 27 subjects selected the activation of the cooling system by setting up the higher temperature set-point. Interestingly, double the number of participants would have kept the windows closed with the air conditioning on, and half of the sample would have closed the blinds.
Third attempt: Finally, 35% of the sample decided to perform a third attempt to explore other interaction combinations. A further decrease in the number of participants setting the air conditioning to the lower temperature set-point was detected. The number of participants selecting to have the windows open while the air conditioning was on dropped to 0, and there was an increase in the number who selected to close the blinds (10 subjects). There was also an increase in the percentage of subjects attempting new combinations, reflecting the will to improve their knowledge thanks to the information visualisation.
Table 3 reports the percentage variation in the combinations of interactions across attempts for each simulated scenario.
In the first attempt, no subject maintained the baseline condition (AC off–windows closed–blinds open). This hypothesis was assessed by computing the Wilcoxon signed-rank test for categorical data within a repeated-measures research design (z = ±1.96 α = 0.05) to evaluate the difference between the baseline scenario and the choices of the first attempts. The results confirmed that most of the participants would have altered the systems in the environment to improve the indoor air’s thermal condition: 46% turned on the air conditioning (z-value = −4.29, p < 0.05), 71% opened windows (z-value = −5.30, p < 0.05), and 54% closed the blinds (z-value = −4.62, p < 0.05). Before the visualisation of graphical indicators and tips, the most common choice was the air conditioning off and windows open, with 25% of subjects keeping the blinds open (scenario 4) and 27% closing the blinds (scenario 10).
After InfoVis (second and third attempts), these percentages halved, while scenario 7 (windows and blinds closed) increased fivefold. Concerning the air conditioning’s activation, after InfoVis, the percentage of participants selecting the higher set-point (26–28 °C) increased in comparison with the first attempt: scenario 3 (AC on 26/28 °C-windows closed-blinds open) tripled to 33%, becoming the most selected scenario for the second attempt; scenario 9 (AC on 26/28 °C-windows closed-blinds closed) doubled to 20% in the second attempt and further increased to 22% in the third, making it the most selected scenario in the final round. Regarding the air conditioning’s activation with the lower set-point, scenarios 2 and 8 (windows closed with blinds open/closed) slightly increased after InfoVis. In general, the cases of subjects deciding to open windows in the presence of the air conditioning’s activation, regardless of the set-point, were almost reset after InfoVis. Thus, comparing the first and second attempts (n = 40), the Wilcoxon signed-rank tests highlighted behavioural changes: 83% of participants modified their selection for the air conditioning (z-value = −5.01, p < 0.05), 73% for the windows (z-value = −4.70, p < 0.05), and 53% for the blinds (z-value = −4.01, p < 0.05).
3.4. Effectiveness of Graphical Indicators and Tips
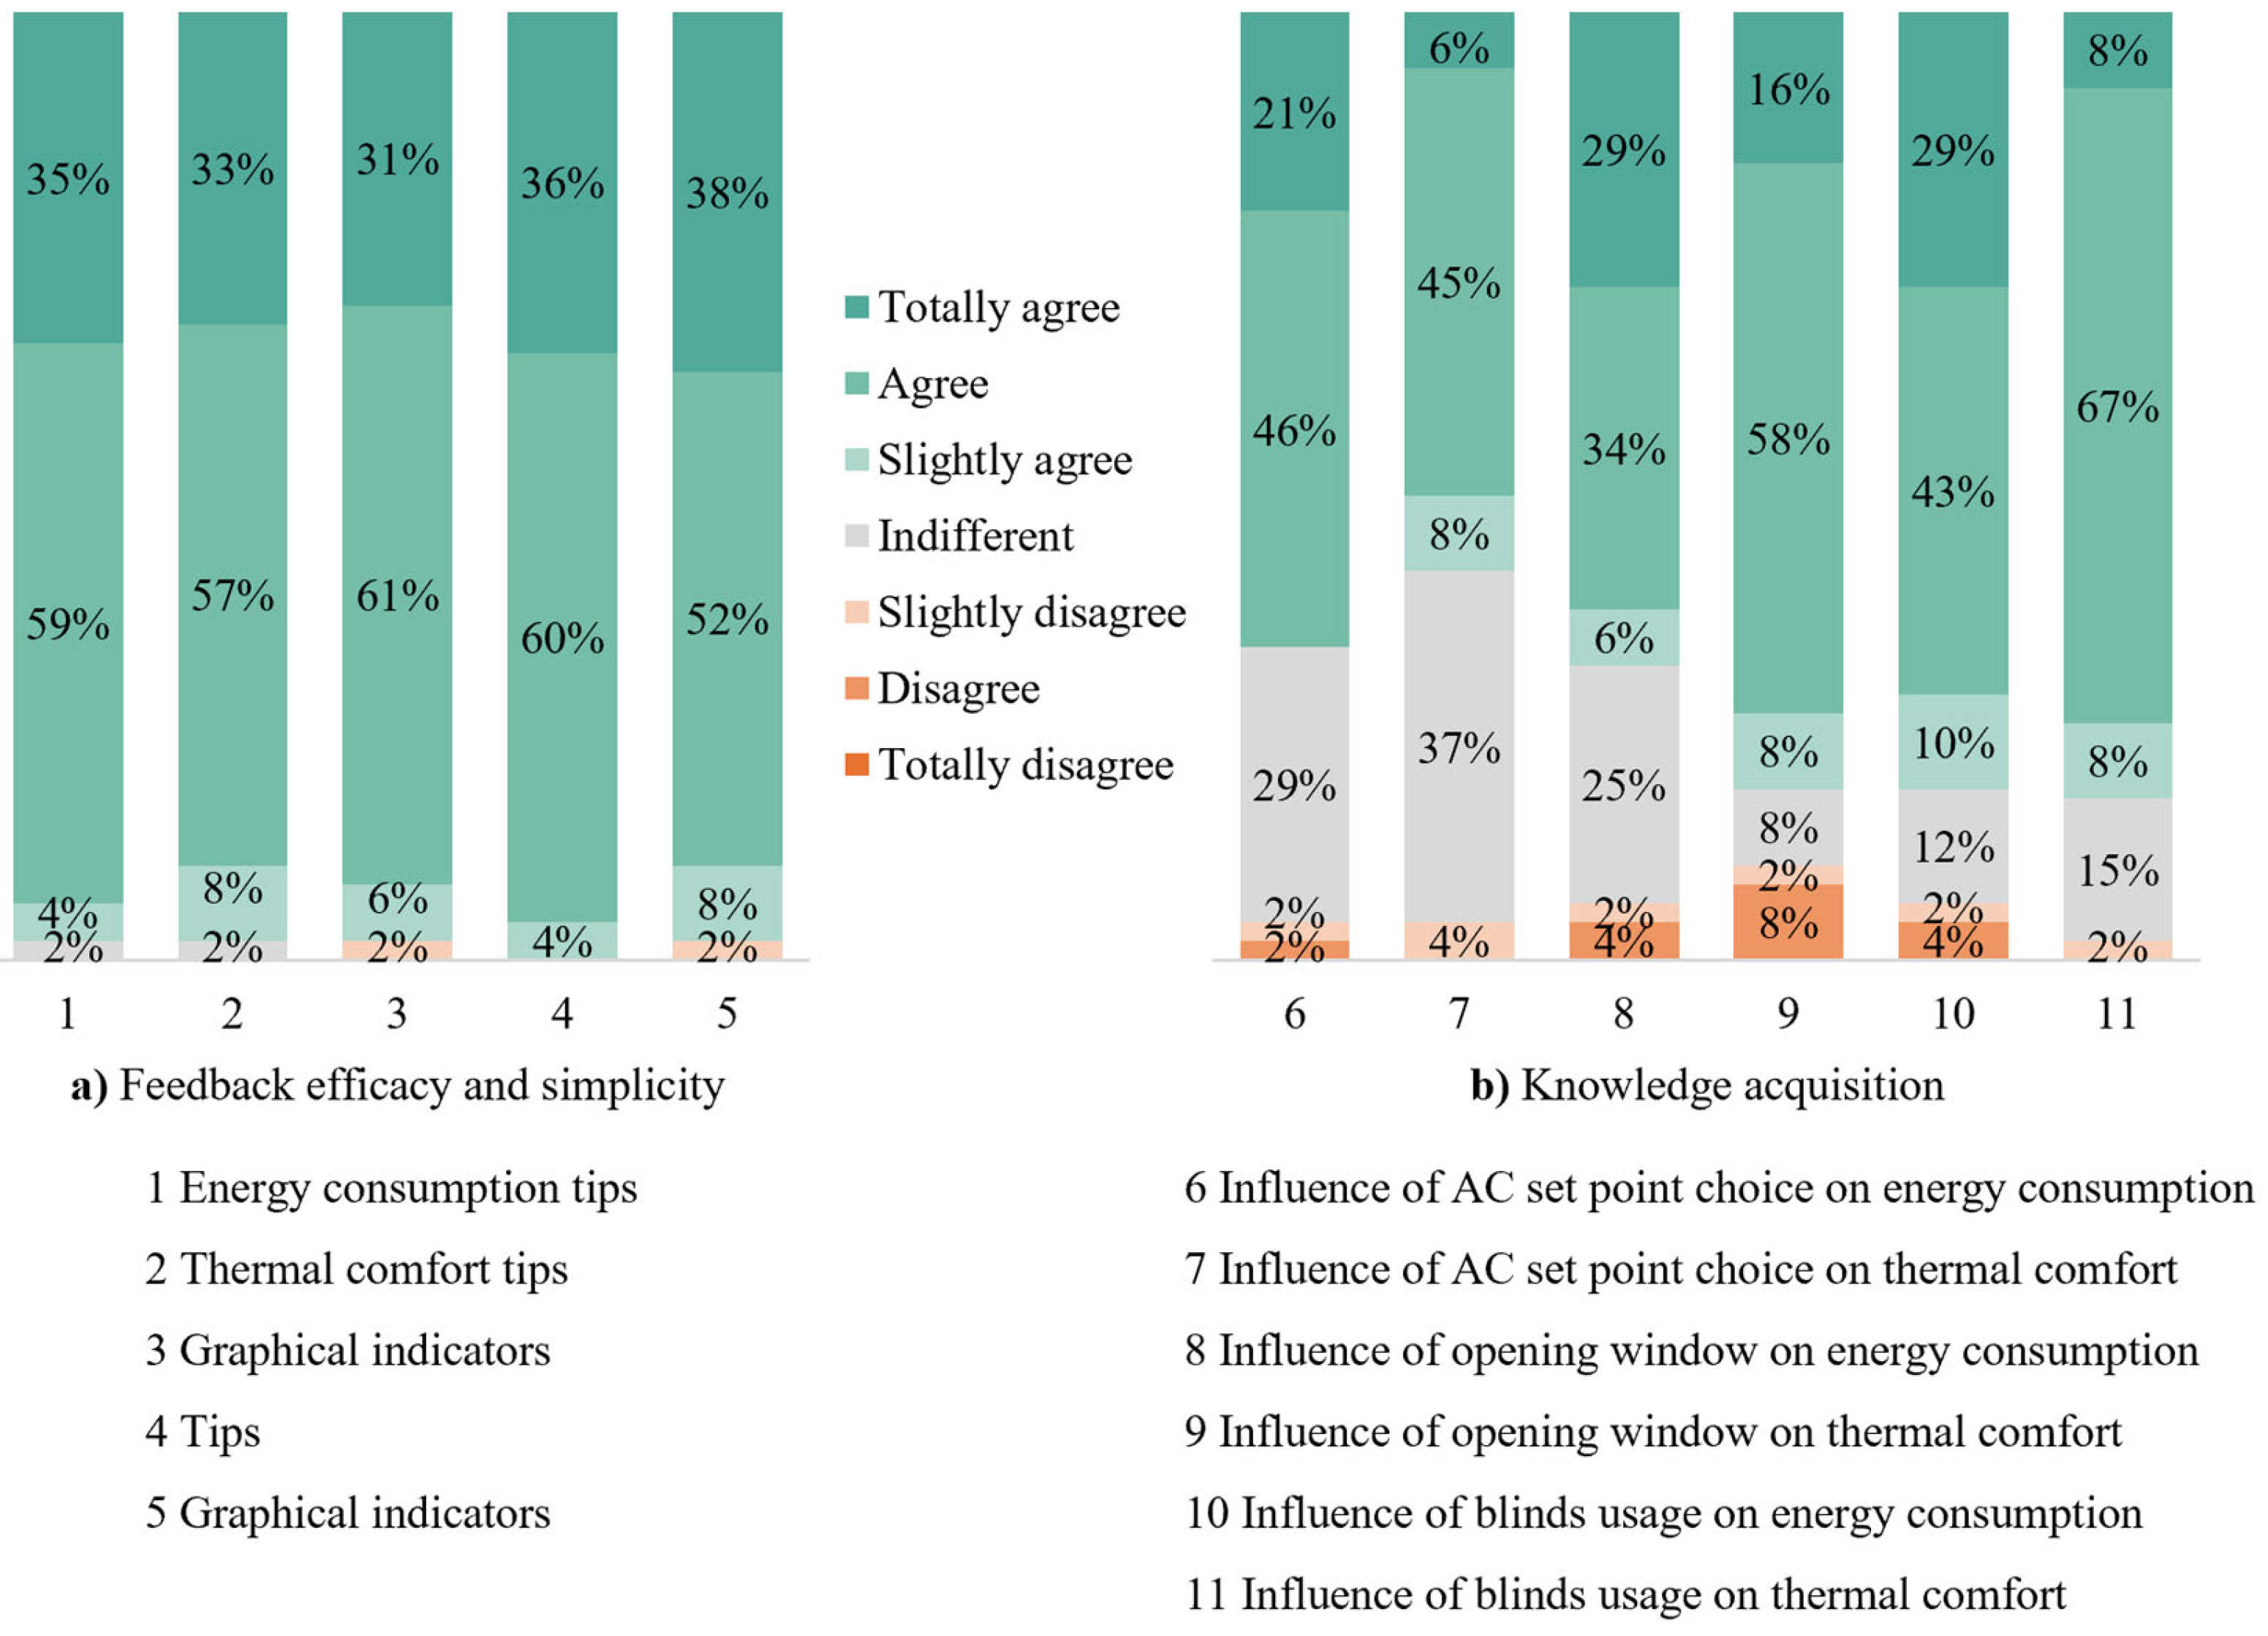
Figure 9a illustrates the participants’ assessment of feedback (i.e., graphical indicators and tips), efficacy, and simplicity. Almost the whole sample of participants (90–96% of scores were assigned at least to “agree”) considered the tips provided in the training activity to be effective and easy to understand, (question 4), as well as being useful to increase their knowledge about energy consumption (question 1) and air thermal condition (question 2). The graphical indicators were generally effective and easy to understand (question 5, 90%), and they were successfully complementary to the tips (question 3, 92%).
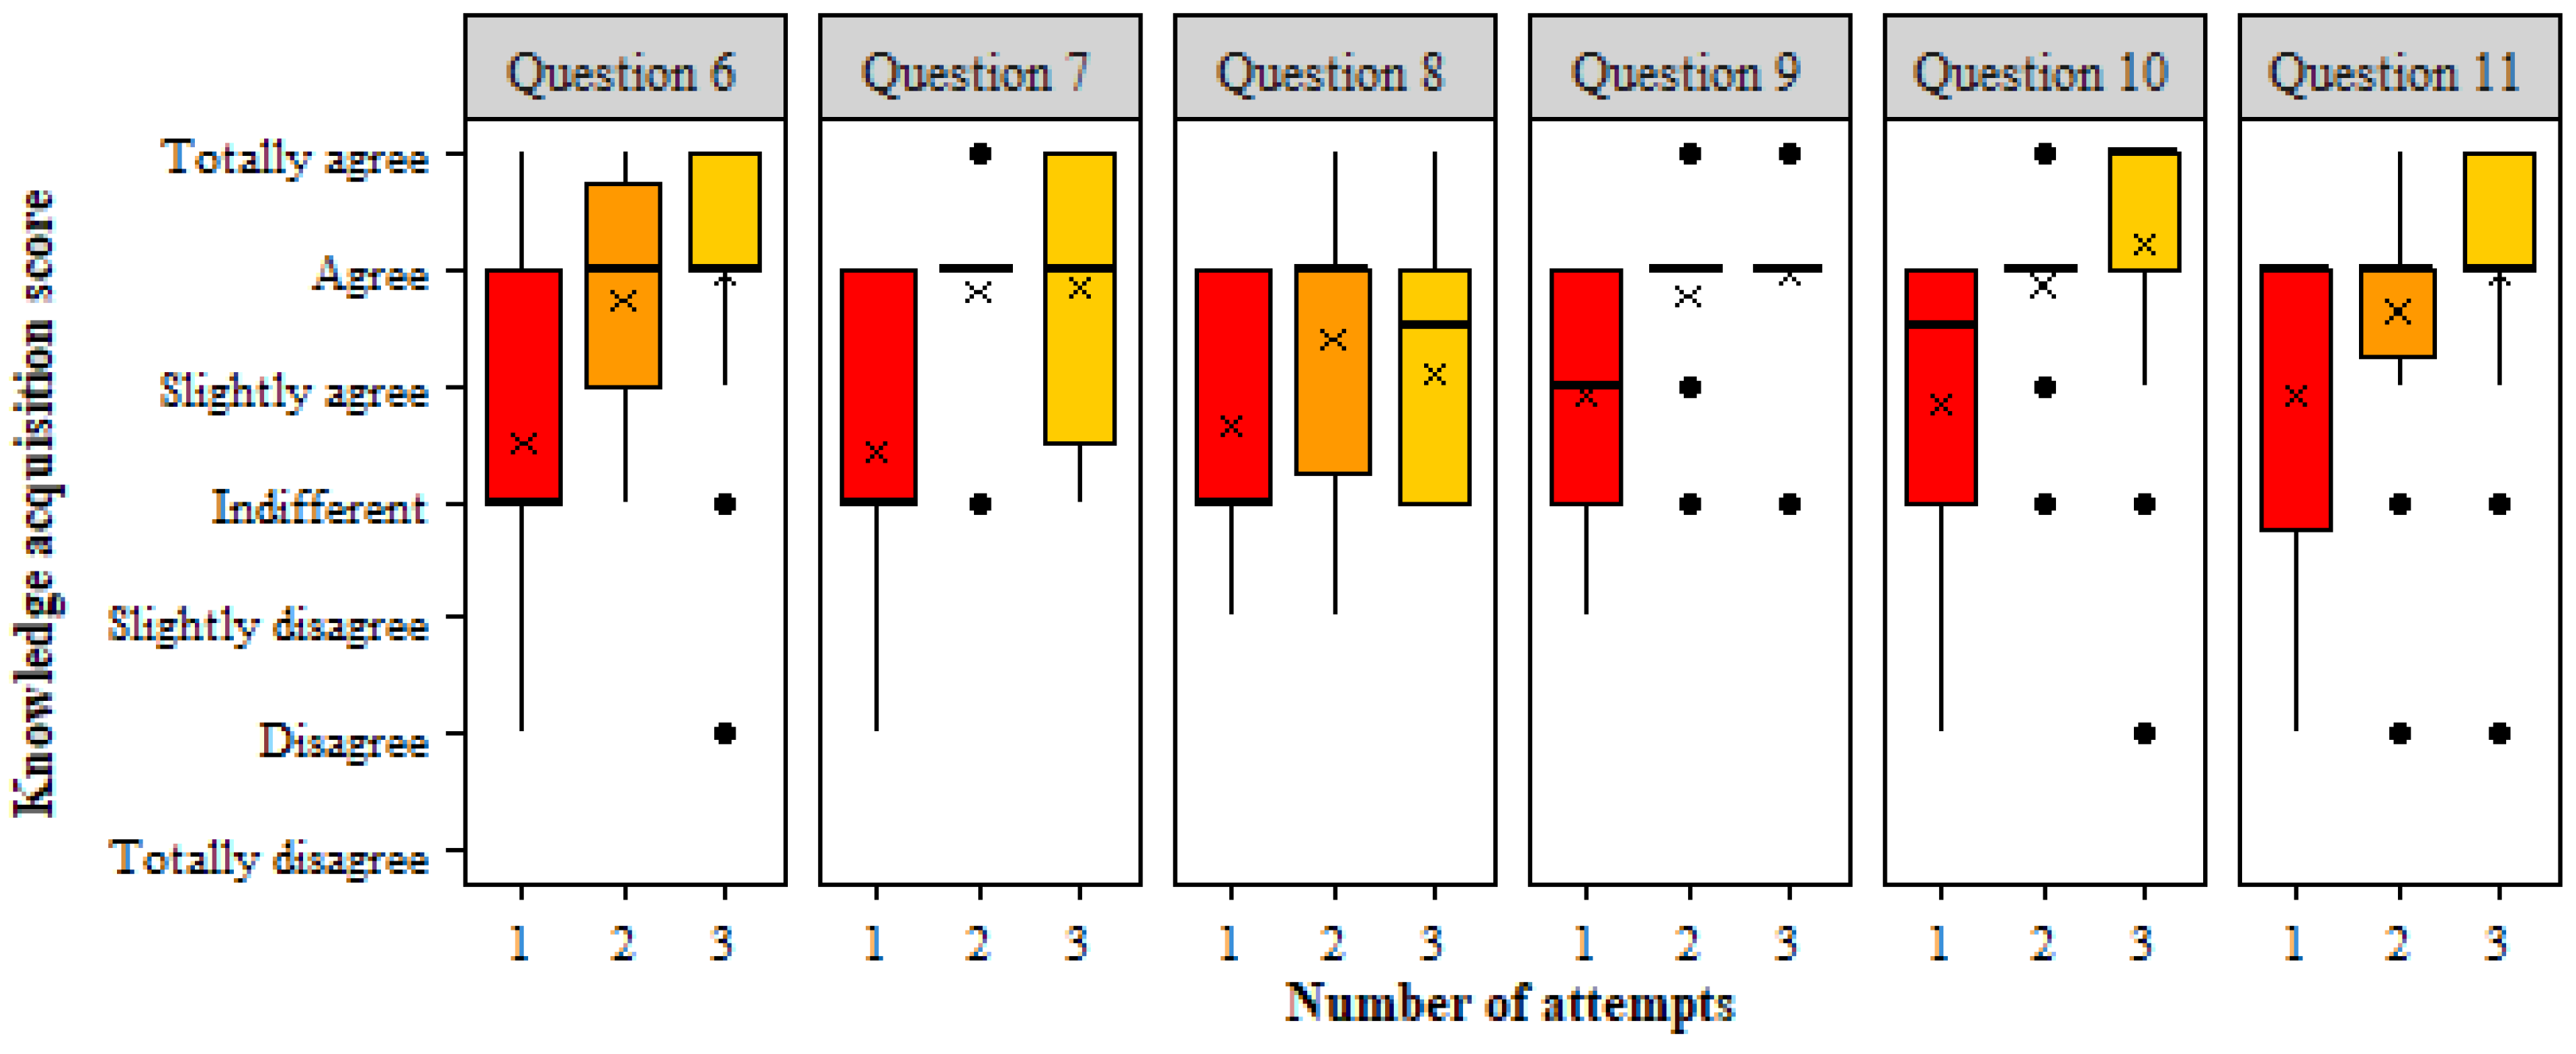
Figure 9b represents the self-reported knowledge acquisition. The outcomes revealed that the immersive training activity enabled the participants to learn the following:
Setting a very low AC temperature (20–22 °C) could lead to greater energy consumption (question 6, 67% of scores assigned at least to “slightly agree”) and a feeling of excessive cold (question 7, 59%), compared to a higher temperature set-point (26–28 °C);
Opening the windows while the air conditioner is working involves more energy consumption (question 8, 69%);
Opening the windows does not decrease the indoor temperature in the presence of an extremely hot outdoor air temperature (question 9, 82%);
Closing the blinds during the hottest hours can help reduce the internal temperature (question 11, 83%) but may result in the need to use artificial lighting (question 10, 82%).
Participants could repeat the training session if desired, trying other interactions and then exploring other configurations of tips and indicators depending on their choices. As a result, it was of interest to investigate the potential presence of an association between the number of interactions per participant (continuous-type data, ranging from 1 to 3 attempts) and the scores that they assigned to the knowledge acquisition questions (categorical data).
Rank-based Kendall’s correlation was computed to deal with categorical data and the limited large sample size (i.e., 52 participants) [
56]. Kendall’s tau can have a value between “−1”, indicating a perfectly negative linear correlation between the two variables, and “1”, indicating a perfectly positive linear correlation, where “0” indicates no linear correlation between the two variables (null hypothesis). The results (
Table 4) pinpointed a significant medium positive correlation (0 < tau < 1,
p-value < 0.05) between the knowledge acquisition questions and the number of attempts. The positive association between the level of knowledge acquired during the training activity and the number of attempts made by each participant is clearly displayed in
Figure 10. The distribution of scores assigned to each knowledge acquisition question in the first attempt was lower than the scores after the second and third attempts, except for question 8 (
p-value > 0.05).
4. Discussion
The novelty of the proposed methodology and research activity concerns several aspects related to the combination of Immersive Virtual Environments and Building Energy Model results for the development of an effective immersive training activity.
Compared to earlier approaches, such as traditional serious games and screen-based simulations, the proposed IVE training system offers a more authentic experience, enabling users to engage in realistic and immersive interactions with multiple building systems. Furthermore, unlike previous IVE studies, which typically focused on a single system (e.g., lighting settings), the present framework provides real-time InfoVis and feedback derived from BEM simulations, allowing users to experience the combined impact of their behavioural choices on both indoor thermal comfort and energy consumption.
4.1. Ecological Validity
At first, the results of the four IPQ indicators suggested that the virtual model offered the participants a very good sense of presence, experienced realism, involvement, and graphical satisfaction. The higher the scores, the more the participants perceived themselves as immersed within the IVE. The possibility of achieving a great sense of presence and immersivity through a visually realistic representation of the real environment was highlighted. In terms of cybersickness, thanks to the application of a previously developed experimental protocol [
27], no relevant disorder levels impairing the test execution and disrupting the reliability of the results were detected, except for a slight eye strain and difficulty in focusing. However, these results are consistent with the analysis of sickness symptoms from previous studies [
55,
57], which did not affect the reliability of the data. Thus, the authors confirmed the ecological validity of the IVE, which is a crucial point for the researchers to support a positive and effective user experience within virtual environments, ensuring the consistency of participants’ responses.
In conclusion, this finding allows us to consider that the created IVE offers a promising tool in terms of ecological validity. As a result, effective training activities can be developed, with the potential for facilitating users’ learning and promoting more sustainable practices through digital, visually engaging, and more interactive technology.
4.2. Immersive Training Effectiveness
To assess the effectiveness of the immersive training activity, the participants’ levels of knowledge acquisition, numbers of attempts, and types of interaction to change the baseline scenario were analysed, along with the assessment of graphical indicators and tips.
Concerning the participants’ choices, the results confirmed that no subject would have kept the same baseline condition. The results of the statistical analysis confirmed that, in order to improve the air’s thermal condition, people would change the state of the three systems, with 46% of participants deciding to turn on the air conditioning, 71% to open windows, and 54% to close the blinds.
In particular, the provision of InfoVis within the IVE suggests the possibility of effectively adopting immersive training activities to further enhance the adoption of more energy-efficient behaviours, while simultaneously seeking better indoor comfort levels. Indeed, after the visualisation of graphical indicators and tips, the number of participants who chose to close the windows with the air conditioning on doubled, and those who left the air conditioning off halved. The participants selecting the higher temperature set-point increased, with scenario 3 (AC on 26–28 °C-windows closed-blinds open) becoming the most selected second scenario. This trend continued in the third attempt, where the number of participants keeping the windows open with the air conditioning on dropped to zero, and more participants closed the blinds to limit summer insolation during the hottest hours of the day. In the third attempt, scenario 9 (AC on 26/28 °C-windows closed-blinds closed) was the most performed. Indeed, the effectiveness of the training activity was objectively assessed by comparing the results of the first and second attempts of the 40 participants. The outcomes of the Wilcoxon signed-rank tests highlighted that, after visualising the consequences of their first choices, people would have changed their interactions for the three systems. In particular, 83% of the participants modified their selection for the air conditioning, 73% for the windows, and 53% for the blinds.
The positive correlation between the number of attempts and the level of knowledge acquisition contributed to demonstrate the effectiveness of the immersive virtual training environment. Participants who completed multiple training sessions (attempts 2 or 3) explored a wider range of feedback, thus enhancing their understanding of energy-related behaviour and its consequences for the air’s thermal condition. This indicates that, as the number of attempts increased, the self-assessment scores improved, and there was a corresponding increase in the level of knowledge acquired and awareness of consequences. These results aligned with those of the previous literature concerning the effectiveness of immersive InfoVis in influencing participants’ choices and promoting more efficient energy-related behaviour, showing the results of users’ interactions with the building systems [
12].
Based on the survey results, the participants revealed that the graphical indicators and tips provided after each attempt were effective and easy to understand, with the whole sample agreeing on their potential to increase knowledge acquisition about energy consumption and indoor air thermal condition. Indeed, self-reported knowledge acquisition revealed that the immersive training activity significantly enhanced the participants’ awareness of consequences, such as the impact of a low air conditioning set-point, of opening windows while the air conditioning is on, and the benefits of closing the blinds during the hottest hours.
The outcomes demonstrated the effectiveness of the immersive training activity, with the potential for positively increasing users’ learning outcomes and awareness of energy-related behaviour and air thermal condition [
30,
31,
32,
33]. Indeed, the introduction of graphical indicators and tips from BEMs in the IVE allowed the participants to be more informed and consciously modify their choices. These results allow us to positively answer the research question of the present research activity (“Can an immersive training activity, integrating data-driven information from BEM into a virtual environment, effectively increase building users’ awareness and improve energy-related behaviour and air thermal condition?”).
4.3. Limitations and Future Research Directions
The sample was predominantly composed of students, introducing a degree of homogeneity that may have influenced the results. The participants’ higher familiarity with digital technologies might have facilitated their navigation within the virtual environment, potentially leading to more favourable user experiences than would be observed in a more diverse population. Furthermore, students may have different thermal comfort expectations and less direct concern with financial constraints related to energy consumption compared to adults or households. These factors could have shaped their interpretation of feedback and decision-making processes, thus limiting the generalisability of the findings to broader user groups. As a result, future research could extend the sample size and range, while also focusing on the impact of participants’ characteristics (such as age, education level, and environmental awareness) on the effectiveness of the immersive training activity systems. A more extensive experimental campaign would allow for a comprehensive assessment of the immersive training’s effectiveness, while also enabling the quantification of impacts on building performance and resilience.
Future research could also investigate how participants perceive and prioritise the feedback, addressing whether energy cost implications or thermal outcomes have a greater influence on their decisions. To further explore participants’ decision-making processes, additional strategies, such as post-session interviews or think-aloud protocols, could be incorporated. These methods would support a deeper understanding of whether actions result from intentional trade-offs, misconceptions, or habitual behaviours, ultimately contributing to a more accurate interpretation of user behaviour, and to the enhancement of the educational design. Future studies should also separate the training and knowledge assessment phases to more clearly evaluate the effectiveness of the immersive learning experience.
In addition, a long-term study could be carried out to further demonstrate the potential of immersive training for behavioural changes in the long term, and to evaluate whether the immersive experience translates into sustained behavioural changes in the real world and deeper learning outcomes over time.
Lastly, the flexibility of Virtual Reality can support modelling and testing interventions in different contexts, easily replicating experiments, and simulating the whole apartment’s geometry, multiple window orientations, variations in the time of day, and several building and urban scenarios by modifying the boundary conditions with a single click. This can support researchers and policymakers in exploring the impacts of potential targeted interventions at the building and urban levels, from the pre-design stages. Moreover, as this study represents a first attempt in the literature, the impact of a specific set of interactions with building systems (i.e., air conditioning, windows, and blinds) was considered. The authors acknowledge that future research could explore and provide feedback on the effects of other parameters, such as indoor air movement, to provide a more comprehensive understanding of the dynamics of comfort and energy savings in realistic scenarios. In line with this, future developments could also overcome the current simplification of the tip-based approach. More advanced versions could integrate dynamic and key factors of building cooling dynamics, such as solar radiation orientation, thermal mass, or internal heat gains, to reflect these complexities while remaining accessible to non-expert users.
In this context, there are some technological constraints that need to be considered, such as the cost and complexity of maintaining VR systems, the need for high-performance hardware, and the involvement of professionals to design specific graphical user interfaces and codes for running effective and engaging models. Additionally, a comparison with other VR technologies (e.g., non-immersive training methods provided via desktop) could further provide valuable insights into the added benefits of immersive VR technology.
5. Conclusions
This paper provides a contribution to the research exploring the development and application of advanced training systems, particularly those leveraging Virtual Reality (VR), for the design, operation, and management of the built environment while tackling high energy consumption.
In particular, this research illustrates a framework for the development of an immersive training activity that integrates information visualisation from the results of Building Energy Model simulations within an immersive virtual residential environment.
Fifty-two subjects were recruited and asked to improve their thermal comfort by choosing to interact with the three building systems and modifying the baseline scenario (with the air conditioning off, windows closed, and blinds open). After each choice, the graphical indicators of a thermometer and piggy bank for energy consumption were updated, and the corresponding tips were displayed to inform the users about the consequences for the indoor climate and energy costs.
Firstly, the results of the four IPQ indicators suggested that Immersive Virtual Environments can be adopted to develop promising training tools in terms of ecological validity.
Secondly, the provision of InfoVis within Immersive Virtual Environments increases users’ awareness of consequences in terms of energy consumption and air thermal condition. A positive correlation between the number of attempts and the level of knowledge acquisition was detected. Moreover, the participants adjusted their interactions for the three systems after visualising the consequences of their initial choices. Lastly, the graphical indicators and tips were evaluated as effective and easy to understand, as well as being promising for increasing knowledge acquisition about energy consumption and indoor air thermal condition.
The outcomes of the present experimental activity demonstrated the effectiveness of this innovative and engaging immersive training system, with the potential to drive occupants’ sustainable behaviour and increase their knowledge about the consequences of their energy-related behaviours and the indoor air’s thermal condition. This approach has the potential to pave the way for the full integration of VR and Building Information Modelling tools in the future, offering a more holistic and informed decision-making process in building design and management.


