Abstract
Ecological security is integral to national security strategies, making the construction of ecological security patterns essential for mitigating ecological risks. However, predictive research on ecological security patterns (ESPs) remains limited. This study integrates the Patch-generating Land Use Simulation (PLUS) model with ecological security pattern analysis to provide scientific insights into spatial governance and optimization in the Poyang Lake Ecological and Economic Zone (PLEEZ). First, the PLUS model simulated land use changes in 2030 under three scenarios: natural development (ND), economic development (ED), and ecological protection (EP). Based on these projections, ecological security patterns were constructed using the Integrated Valuation of Ecosystem Services and Tradeoffs (InVEST) model, the Morphological Spatial Pattern Analysis (MSPA) method, Conefor 2.6, the Minimum Cumulative Resistance (MCR) model, and resistance theory. The results indicate: (1) 19, 18, and 21 ecological source areas were identified under different scenarios, covering 6093.16 km2, 5973.21 km2, and 6702.56 km2, respectively, with 9, 8, and 10 important source sites, primarily in the north. (2) 37, 35, and 43 ecological corridors were delineated, exhibiting a spiderweb-like distribution. (3) 94, 62, and 107 ecological pinch points and 116, 121, and 104 ecological barrier points were detected. The Ecological Node Aggregation Area was identified as a critical zone for targeted ecological protection and restoration. Finally, the ecological zoning management strategy of “Four Cores, Two Zones, and One Belt” was proposed. This study offers valuable insights for sustainable land use planning and ecological risk mitigation.
1. Introduction
In recent years, rapid urbanization and economic development have significantly intensified human activities, reshaping the spatial patterns of land use and exacerbating conflicts among ecological, production, and living spaces. These changes have triggered a series of environmental issues, including soil heavy metal contamination, habitat loss, and ecosystem degradation, all of which pose serious threats to national ecological security [1,2,3]. Ecological security refers to the capacity of ecosystems to maintain sustainability and stability while adapting to environmental changes [4,5,6].
Land serves as the foundation for all natural systems. Changes in land use not only alter landscape patterns but also directly affect the provision of ecosystem services [7]. Urban expansion reduces ecological space and weakens critical ecological functions such as water conservation, biodiversity maintenance, and climate regulation [8]. Globally, studies on Lake Tana and Lake Hayqe in Ethiopia [9] and the Aotearoa New Zealand lake ecosystems [10] have consistently demonstrated the profound impacts of human activities on lacustrine systems [11,12]. In China’s Poyang Lake region, a critical freshwater resource and migratory bird habitat, extensive research has focused on ecological risk assessment, vegetation hydrology, and ecosystem services [13,14,15,16]. However, existing studies predominantly address current ecological practices, leaving a significant gap in prospective analyses of the regional ecological security patterns (ESPs) under future development scenarios. Constructing ecological security patterns (ESPs) based on land use change information is crucial for identifying key landscape elements and ecologically vulnerable areas. Such efforts are vital for enhancing ecological protection, implementing ecological civilization strategy, and achieving sustainable regional development [17,18,19].
The ecological security pattern comprises a network system composed of interconnected ecological sources and corridors, which primarily integrates the intrinsic relationships between services with the “source–sink” theory to characterize the resistance to ecological processes and the importance of landscape components [20,21]. The focus of ecological security research has gradually shifted from early biodiversity conservation to a more comprehensive integration of ecosystem and socio-economic dimensions [22,23]. Research topics have evolved from the construction and evaluation of single ecological security patterns to the coupling of ecosystem processes with ecological security patterns [11,22,24]. Along with the diversification of research methods and content, a basic research paradigm of “source identification–resistance surface construction–corridor extraction” has gradually emerged, consisting of elements such as sources, corridors, and nodes [25,26,27]. The ecological source areas, as key patches that sustain ecosystem stability, are considered the core of the ecological security network [28,29], and the current research is dominated by morphological spatial pattern analysis (MSPA) [30], ecosystem service importance analysis [31,32], ecological sensitivity analysis [33], and direct selection [34,35], with different analytical methods focusing on different aspects. To overcome the limitations of a single model, this study employs an overlay approach combining morphological spatial pattern analysis with habitat quality importance assessment to more accurately identify and select high-value habitat areas for determining ecological source sites.
The Ecological Surface of Resistance (ESR) describes the spatial variability in migration barriers encountered by species as they move through different habitats in their natural environment [36]. Peng et al. (2019) determined resistance surfaces on the basis of land use type only, without considering other influencing factors, which limited their accuracy results [28]. Wang et al. (2024) identified seven categories of impact factors, including land use, topography, and proximity to roads, by integrating natural and anthropogenic variables. This methodological framework facilitated the construction of a resistance surface with improved scientific rigor and reliability [37]. Ecological corridors are major bridges and pathways for species migration and movement. Recent studies have primarily concentrated on identifying and optimizing ecological corridors using various models, such as the Minimum Cumulative Resistance (MCR) model [38], Circuit Theory [39], Ant Colony Algorithm [40], and Gravity model [41,42]. Among these, the MCR model is more frequently used, as it more effectively captures the interactions of landscape patterns with ecological processes than conventional conceptual or mathematic modeling, but species wanderings are stochastic in nature [43]. Circuit theory, however, has overcome this limitation of the MCR model by simulating the stochastic dispersal behavior of organisms and the process of biological flow to determine the optimal pathway, which better reflects the ecological landscape connectivity [44,45]. Combining MCR modeling and circuit theory better meets the needs of corridor construction.
Uncertainty exists in the future development of a region. Land is a vehicle for mankind’s actions, with changes in land cover intuitively reflecting trends in mankind’s ecological actions, as well as the region’s state of ecological security [41]. Predicting prospective patterns of ecological security has an essential role to play in ecological risk management and sustained regional developments [27,46]. Common land use prediction models include the Markov model [47], Artificial Neural Network (ANN) model [48], CLUE-S (Conversion of Land Use and its Effects at Small regional extent) model [49,50], Future Land Use Simulation (FLUS) model [51], PLUS model [52,53], and so on. The PLUS model integrates conventional data mining techniques in land use structure analysis with a cellular automata framework, incorporating an adaptive inertia competition mechanism and random forest regression [52,54]. This enables the model to analyze multiple driving factors and predict patch evolution under various scenarios, thereby enhancing the accuracy of land use predictions [55]. In this study, we employed the PLUS model to predict land use changes under multiple scenarios in the Poyang Lake Ecological and Economic Zone by 2030.
This study integrates multi-scenario land use projection with ecological security pattern analysis using the PLUS model. Ecological sources were identified through the overlay of MSPA analysis and habitat importance assessment. Furthermore, the ecological security pattern was predicted by combining the MCR model with resistance theory. This integrated approach aims to identify potential ecological risks in a timely manner and provide a science-based reference for the future, harmonious development of human–land interactions in the region. The objectives of this paper as follows: (1) to forecast land use changes in the PLEEZ by 2030; (2) to identify ecological sources for different scenarios (natural development, economic development, and ecological protection) in 2030 using multiple models; and (3) to construct and analyze ecological security patterns under three scenarios in 2030, providing insights for future ecological conservation in the region.
2. Study Area and Data Sources
2.1. Study Area
The PLEEZ is located in the northern part of Jiangxi Province (114°29′~117°42′ E, 27°30′~30°06′ N), encompassing cities including Nanchang Jingdezhen, Yingtan, and Jiujiang, with a total of 38 counties (cities/districts) and an area of 51,200 km2 (Figure 1). Poyang Lake, recognized as China’s largest freshwater lake and an internationally significant wintering habitat for migratory birds as well as a designated wetland reserve [56,57], plays a critical role in safeguarding water security for the middle–lower Yangtze River basin. Its ecological effects profoundly influence the sustainable development of both the Yangtze River Economic Belt and broader East Asian regions [14]. However, this region has recently experienced significant ecological degradation, manifesting as water area contraction, heavy metal contamination, water quality deterioration, and biodiversity loss [13,58,59,60] that necessitate scientifically sound ecological measures to identify landscape risks and sustain its essential ecological functions.
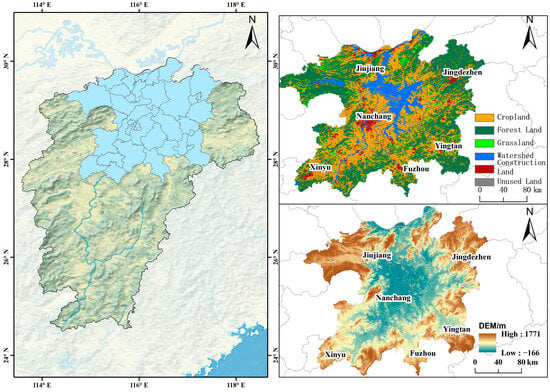
Figure 1.
Geographic location of PLEEZ.
2.2. Data Sources
The land use data, population, GDP, annual precipitation, annual temperature, and soil type data used in this study were all sourced from the Resource and Environmental Sciences Data Center of the Chinese Academy of Sciences [61,62,63]. The land use data were reclassified into six categories: cropland, forest land, grassland, watershed, construction land, and unused land. For monthly precipitation records from 1901 to 2023, we referred to the 1 km resolution dataset provided by the National Earth System Science Data Center [64]. In addition, river and road data were obtained from the National Geographic Information Resources Catalog Service [65]. The Digital Elevation Model (DEM) data were retrieved from the Geospatial Data Cloud Platform [66] (Table 1).

Table 1.
Data sources.
3. Research Methodology
This study used land use data from 2000, 2010, and 2020 to simulate and predict land use conditions in the PLEEZ for 2030, considering three scenarios: ND, ED, and EP. Next, the importance of habitat quality in this study area for 2030 was analyzed. The results were combined with core areas identified by the MSPA model to delineate ecological sources, which were classified based on their importance using the Conefor 2.6 model. Subsequently, a comprehensive resistance surface was constructed for the study area, considering factors such as land use types, DEM, slope, and proximity to roads. Finally, using circuit theory, the Linkage Mapper software extracted corridors, nodes, and barriers to establish the ecological security pattern. The technical framework is illustrated in Figure 2.
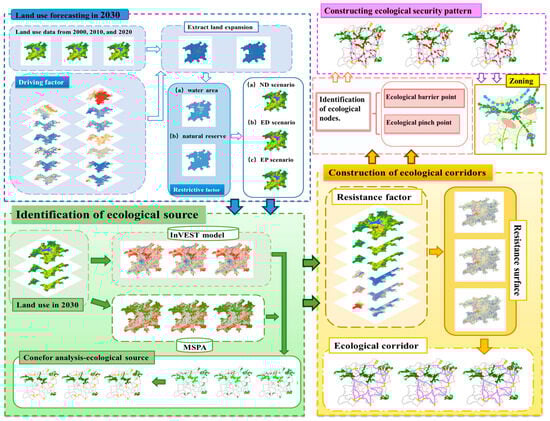
Figure 2.
Research framework diagram.
3.1. Land Use Projections
3.1.1. PLUS Model
The PLUS model is a land use change simulation tool based on cellular automata and Markov chains. It integrates the Transformation Analysis Strategy (TAS) and Pattern Analysis Strategy (PAS) while introducing a new land expansion analysis strategy (LEAS) based on the random forest (RF) algorithm [54,67,68]. The model integrates multiple factors, both natural and socio-economic, to predict land use change at patch scale based on raster data. Considering the geographical location and practical circumstances of the study area, this paper selected 13 driving factors, including DEM, slope, temperature, precipitation, soil types, distance to water bodies, distance to primary roads, GDP, and population density. Land use patterns in the research region under three different scenarios were simulated using water bodies and nature reserves as constraints based on the specific scenarios.
3.1.2. Neighborhood Weights and Accuracy Validation
The neighborhood weight is positively correlated with the land expansion capacity, with a value ranging between 0 and 1. This parameter quantifies the extent to which a specific land use type expands into surrounding areas. By adjusting the neighborhood weight, the accuracy of predicting the spatial distribution and dynamic changes of different land use types can be improved. The expansion intensity of each land use type was calculated based on land use data from 2000 and 2010, and the neighborhood weights were subsequently determined through appropriate adjustments with reference to relevant studies [69,70] (Table 2).
Table 2.
Neighborhood weights.
To assess the simulation’s accuracy, land use data, driving factor data, and neighborhood weight data from 2000 and 2010 were input into PLUS model to simulate land use patterns for 2020. The comparisons of the simulated and actual data yielded a Kappa coefficient of 0.875 and an overall accuracy of 0.917. A Kappa coefficient of 0.80 or above signifies high simulation accuracy [71].
3.1.3. Scenario Setting
The transfer matrix illustrates the transfer probabilities among different land use types (Table 3), where a value of “1” indicates that a land use type can be converted to another, while a value of “0” signifies that conversion is not possible. To explore potential future development trajectories of the PLEEZ, three typical scenarios have been established: ND, ED, and EP. They are defined below:
Table 3.
Multi-scenario land use transfers matrix.
- (1)
- The ND scenario is primarily based on the historical land use trends from 2000 to 2020, without considering the influence of policies or other external factors. It represents a condition with minimal human intervention, following the intrinsic dynamics of land use structure changes. The land use demand for each category is projected using a Markov chain model.
- (2)
- The ED scenario emphasizes the need for rapid urbanization and economic growth. Informed by elements of the “Key Tasks for New-type Urbanization and Urban-Rural Integration Development in Jiangxi Province (2020)”, this scenario assumes a rapid expansion of urban construction land, with land use transitions favoring built-up areas. This scenario is designed to analyze land use changes in the Poyang Lake Eco-Economic Zone under the tradeoff between economic development and ecological conservation.
- (3)
- The EP scenario aims to achieve sustainable development by prioritizing the conservation of ecological land types, such as forest, grassland, and water bodies. This scenario is guided by the Plan for the Eco-City Cluster around Poyang Lake (2015–2030) and relevant policies in Jiangxi Province, with the goal of balancing socio-economic development and environmental protection. Accordingly, stricter constraints on land use transitions are applied, and nature reserves are incorporated as exclusionary factors. This scenario explores the potential land use trajectories of the Poyang Lake Eco-Economic Zone under an ecological–development coordination framework [70].
3.2. Ecological Security Pattern Building
3.2.1. Ecological Source Site Identification
Ecological source areas are clusters of high-value patches with high environmental quality and strong self-regulation capacity, playing a crucial role in maintaining ecosystem stability. This study employed the InVEST model to estimate habitat quality within the PLEEZ. The MSPA model was then employed to identify ecological core regions. The areas with the highest Habitat Quality Index were intersected with the core areas extracted using the MSPA model to delineate ecological source areas. Finally, the landscape connectivity of these ecological source areas was assessed using Conefor 2.6 software. The analysis procedure included the following:
- (1)
- Habitat quality evaluation
Habitat quality represents an ecosystem’s ability to offer favorable living conditions that support population growth and development [72]. It is a key indicator for evaluating the ecological environment and the ecosystem services of a region, playing an essential function in preserving ecological health and fostering sustainability [73,74]. In this research, we utilized the Habitat Quality module from the InVEST model, which is a tool frequently used in studies on biodiversity and ecological suitability to evaluate habitat quality. The calculation method is detailed as follows:
where signifies the habitat quality associated with the x image elements belonging to land category j; represents the suitability of the habitat for land type j; indicates the threat intensity for grid pixel x in class j; z is a fixed constant with a value of 2.5, and k refers to a half-saturation constant, which is assigned a value of 0.5.
- (2)
- MSPA analysis
The MSPA is a method of image processing designed to detect ecological source areas by examining spatial morphology characteristics, including patch size and spatial topology connections [75]. The MSPA requires binary raster data, which are categorized into foreground and background classifications. In this study, forests, grasslands, and water bodies are classified as foreground, while all other land-use types are assigned to the background.
- (3)
- Ecological source classification
Conefor 2.6 is extensively applied software tool in ecological and landscape ecological studies. It evaluates landscape connectivity by quantifying the importance of habitat patches and their connections, which are crucial for maintaining or enhancing ecological connectivity [76,77]. In our study, the patch importance index (dPC) was adopted as primary metric. Based on the specific characteristics of this study region, ecological source sites were categorized as either important (dPC ≥ 1) or general (0.01 ≤ dPC < 1) based on their dPC values [78]. The following formula was used for the calculation:
where PC stands the index of Probable Connectivity; n denotes the total number of patches in the study region; and refer to the areas of patches i and j, respectively; represents the highest likelihood of species dispersing between these patches; indicates the landscape’s total area within the study region; and the overall connectivity index is expressed as IIC.
3.2.2. Ecological Resistance Surface Constructions and Corridor Extraction
In this study, we first constructed the ecological resistance surface using the MCR model, and subsequently extracted ecological corridors based on the resulting resistance surface.
- (1)
- MCR modeling
The Minimum Cumulative Resistance (MCR) quantifies the cost associated with species from its “source” to its “destination” [79]. The resistance surface represents the value of resistance that the species encounters in spatial flow. Higher resistance values indicate greater obstacles that organisms must overcome during migration and dispersal. The resistance value is influenced by both anthropogenic and natural factors. This research utilized the MCR model to develop the ecological resistance surface, integrating factors related to human activity and the natural environment. Four resistance factors—land use type, DEM, slope, and road proximity—were selected as indicators for the MCR model. Consistent with previous studies, the resistance factors were categorized on a scale of 1 to 9, where 1 represents the lowest resistance, with 9 representing the highest resistance. The weights assigned to these factors are presented in Table 4. The calculation of the MCR model was carried out using the formula presented below:
where MCR signifies cumulative minimum resistance coefficient; f is positive and demonstrates a direct relationship with the MCR; represents this distance in space between the species located at source j and the landscape substrate i; and indicates the resistance value of landscape i against species migration.
Table 4.
Resistance coefficients and weights.
- (2)
- Ecological corridor extraction
Ecological corridors serve as pathways for material flow within ecosystems, facilitating connectivity between isolated and fragmented ecological units and linking various ecological source areas. These corridors typically exhibit a linear or belt-shaped distribution. In the research, ecological corridors were determined through the Linkage Pathways module of Linkage Mapper 2.0. This process relied on the MCR model to develop a comprehensive resistance surface.
3.2.3. To Identify Ecological Pinch Points and Obstacle Points
Ecological pinch points are critical constraints in the flow of resources and energy within ecosystems, playing a key role in ecological conservation while being more susceptible to ecological risks. This study utilized the open-source software Circuitscape, employing the Pinchpoint Mapper tool within Linkage Mapper 2.0. The “all-to-one” mode was selected, initially tested with a step size of 500 m, and the cost-weighted distance was ultimately set at 1000 m.
Barrier sites refer to regions with elevated landscape resistance, which hinder species migration between source areas and affect overall landscape connectivity. This research employed the “Maximum” mode within the Barrier Mapper tool for detecting and extracting these barrier points.
4. Results and Analysis
4.1. 2030 Land Use Multi-Scenario Forecast Analysis
The PLEEZ shows large differences in the area of each category under the three different scenarios compared to 2020. As shown in Table 5, under the ND scenario for 2030, cultivated land, forested areas, and unused land decreased by 389.05 km2, 265.95 km2, and 13.07 km2, respectively. In contrast, built-up land, grassland, and water bodies expanded by 627.3 km2, 25.32 km2, and 15.45 km2, respectively. In recent years, economic development has led to a significant increase in built-up area, which has risen by 1.23% compared to the 2020 level. This increase is primarily due to the conversion of cultivated and forested lands. As illustrated in Figure 3, during natural evolution, the expansion of cultivated land is mainly driven by the conversion of forested and built-up areas, while a small portion of cultivated and unused land is being transformed into watersheds.
Table 5.
Land use types by area and proportion: 2020–2030.
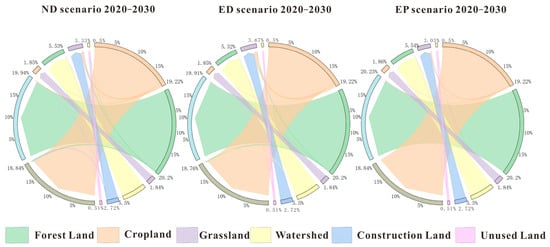
Figure 3.
Changes in land types under the different scenarios by 2030.
Under the ED scenario, the areas of cultivated land, forested area, and water bodies experience significant reductions of 475.23 km2, 301.38 km2, and 184.45 km2, respectively, compared to 2020. Supported by relevant economic policies, the area of construction land increases markedly by 968.63 km2, or 1.89%, primarily through conversion of cultivated land, forested land, water bodies, and unused land.
Under the EP scenario, the areas of forested land, grassland, water bodies, and built-up land all increase. However, the increase in constructed land is only 318.5 km2, which is half of the increase observed in the ND scenario and one-third of that under the ED scenario. Supported by conservation policies, forested land, grassland, and water bodies expand by 23.59 km2, 18.03 km2, and 39.93 km2, respectively, primarily due to conversion of arable and unused land.
Overall, the area of unutilized land in the three different scenarios changes less compared to 2020, whereas built-up land expands considerably. Conversely, watershed areas experience only slight fluctuations across the scenarios.
In terms of spatial structure, Figure 4 illustrates the changes under different scenarios. Under the ED scenario, building land in the southern region of Poyang County expands, Conversely, under the EP scenario, water areas increase, and woodland patches become denser. From a regional distribution perspective, construction on land in urban, densely populated areas such as Xunyang District, Zhushan District, Qingshan Lake District, Honggutan District, Donghu District, and Qingyunpu Junction will have significantly increased under the ED scenario. Meanwhile, watershed areas will have shrunk to varying degrees. In contrast, under the EP scenario, the forest and grassland areas in Wuning County, Fuliang County, northern Poyang County, and southern Guixi County will have expanded to varying degrees.
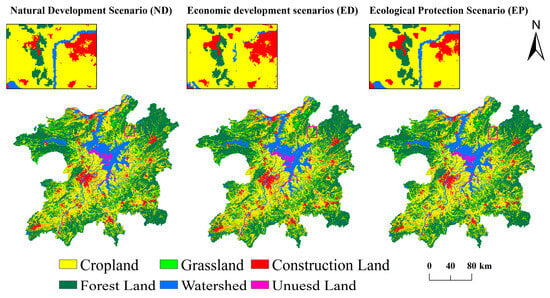
Figure 4.
Land use type projections under different scenarios for 2030.
4.2. Identification of Ecological Source Area
4.2.1. Habitat Quality Importance Assessment
To evaluate the quality of habitats in the PLEEZ, the natural breakpoint method was employed to classify habitats into six levels of importance: extremely unimportant, unimportant, generally important, relatively important, important, and extremely important. The areas classified as “important “and “extremely important” were identified as potential ecological source sites. Alternative source areas are primarily located in the northeast and northwest, southeast of Guixi City, and in the Poyang Lake region. High-value habitat areas are dispersed across Nanchang, Jinxian County, Shangrao, Yugan County, and Leping City. For 2030, the total important and very important patches under different scenarios was projected at 13,992.30 km2, 13,743.60 km2, and 14,715.56 km2, respectively. The distribution of high-value habitat quality areas remains relatively stable across the three scenarios, with minimal changes (Figure 5). The overall pattern follows a trend toward “higher to the north and lower to the south, denser to the north, and sparser to the south”. Under the ED scenario, the area of high-value zones decreases, whereas under the EP scenario, patch density increases in the northwest and northeast regions.
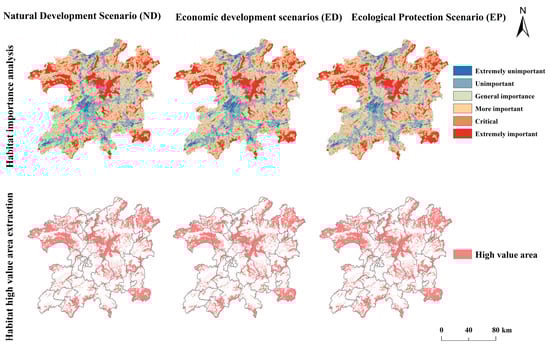
Figure 5.
Habitat quality assessment.
4.2.2. Morphological Spatial Structure (MSPA) Analysis
Using the MSPA analysis, woodlands, grasslands, and watersheds were designated as foreground analysis data, while other land categories were considered background analysis data. As shown in Figure 6a, the core areas under three scenarios for 2030—the ND Scenario, ED Scenario, and EP Scenario—are 9157.33 km2, 9030.97 km2, and 9643.83 km2, accounting for approximately 17.89%, 17.64%, and 18.84% of total study area (Figure 6b). Ecological protection scenario demonstrates a notable increase in core area, whereas this economic development scenario shows a reduction owing to the conversion to economic land of portions of forest and grassland. Spatially, the core areas are primarily concentrated in Jinxian County in the center, the Poyang Lake region, Wuning County in the northwest, Pengze County to the north, and Fuliang County in the northeast.
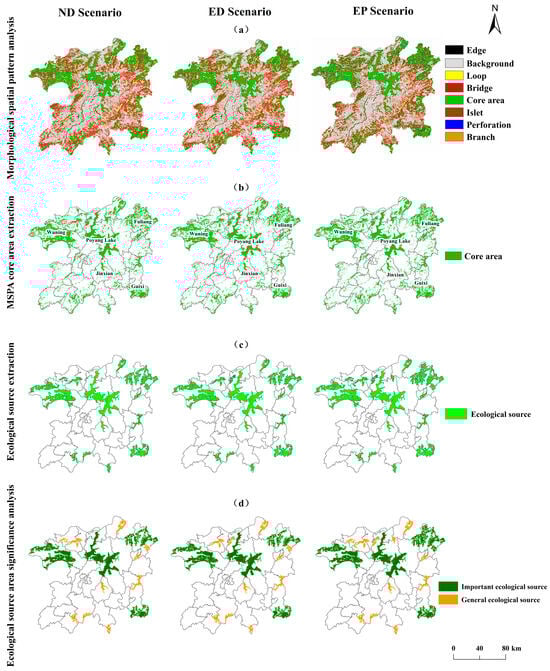
Figure 6.
Ecological source identification and classification. (a) Presents the results of the analysis based on the MSPA model; (b) Identifies the ecological core areas determined by the MSPA analysis; (c) Illustrates the ecological source areas formed by the overlay of high-value habitat quality areas with the identified core areas; (d) Shows the classification of ecological source areas.
4.2.3. Identification and Significance Analysis of Ecological Source Areas
The high-value habitat quality areas were overlaid with the core areas identified through the MSPA analysis, as illustrated in Figure 6c. Under the three different scenarios for 2030, the number of ecological source sites came out to 19, 18, and 21, respectively. The corresponding source areas were 6093.16 km2, 5973.21 km2, and 6702.56 km2, accounting for 11.90%, 11.67%, and 13.09% of the total study area, respectively.
The importance of ecological source sites was assessed using Conefor 2.6. Ecological source areas for dPC ≥ 1 were classified as important, while those with 0.01 ≤ dPC < 1 were classified as average. The results are presented in Figure 6d. In the ND scenario, there are nine important source sites, covering an area of 5016.73 km2, or 9.8% of total area. In the ED scenario, there are eight important source sites, covering an area of 4913.24 km2. In contrast to natural development, ecological sources located in northeastern Fuliang County and southern Ruichang City disappeared in the course of economic development. Under ecological protection policy, the number of important source sites increased to 10, and their area increased to 5503.06 km2. New ecological source areas emerged in the northern part of Fuliang County and southern part from Hukou County.
4.3. Resistance Surface Construction and Ecological Corridor Extraction Analysis
4.3.1. Integrated Resistance Surface Construction
MCR modeling was employed to generate a composite resistance surface, categorizing resistance values into five levels (1, 3, 5, 7, and 9), with smaller values indicating less resistance to species migration and spatial movement. In this study area, the resistance values varied between 1 and 8.4. The average resistance under the ND, ED, and EP scenarios had smaller differences of 3.19, 3.21, and 3.17, respectively. This suggests that economic development can influence the landscape connectivity of ecological spaces to some extent, thereby impacting the flow of organisms at the spatial scale. As shown in Figure 7a from the regional distribution, the Qingshanhu and Honggutan districts in Nanchang City, Zhujiang district in Jingdezhen City, Yushui district in Xinyu City, and Yuehu district in Yingtan City are the clusters of areas with high resistance values. The resistance values in Fuliang and Wuning counties, which have better natural ecological and environmental protection, are significantly lower. In general, with the exception of a few urban agglomerations, the high and medium value zones are scattered, while the low-value resistance zones are contiguous and show a block distribution pattern.
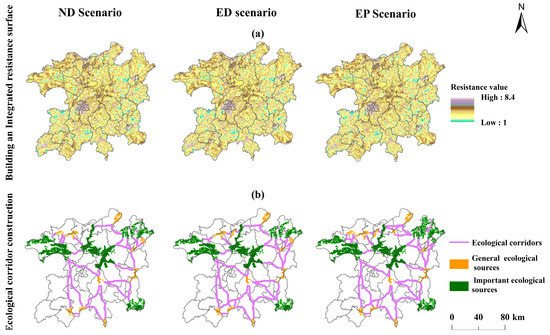
Figure 7.
Ecological corridor construction. (a) Shows the magnitude of resistance values; (b) Depicts the number and distribution of ecological corridors.
4.3.2. Ecological Corridor Extraction
Ecological corridors were extracted separately using the Linkage Pathways tool according to circuit theory. Based on the different scenarios, we identified 37 active corridors in the natural discovery scenario and potential corridors, of which the total length of active corridors came out to 1462.74 km, with a range of lengths from 0.88 km to 126.55 km. In the ED scenario, 35 active corridors and several inactive corridors were identified, with a total active corridor length of 1468.48 km ranging from 0.88 km to 127 km. In contrast, the EP scenario resulted in the highest number of 43 active corridors, with a total length of 1560.59 km and individual lengths ranging from 0.2 km to 129.63 km.
In terms of spatial morphology and distribution (Figure 7b), the corridors exhibit a spiderweb-like pattern, with dense distributions in the northern region and more dispersed patterns in the central and southern regions. This pattern primarily arises from the northern woodland, which is distributed in strips, resulting in a highly connected and coherent landscape. The south–central region is more urbanized and densely populated, leading to a reduced number of ecological sources compared to the north. Ecological corridors facilitate the flow of species but are highly vulnerable to human activities, underscoring the need for prioritizing their protection.
4.4. Ecological Pinch Point and Obstacle Point Extraction Analysis
Based on the current density analysis, the number of ecological pinch points were extracted as 94, 62, and 107 under three different scenarios (ND, ED, and EP), respectively. In terms of the spatial distribution patterns, pinch points were primarily located at intersections of corridors with source areas and predominantly concentrated in cropland, woodland, and grassland land types. Comparisons revealed significant variations in number of pinch points along specific ecological corridors, including the corridor connecting the southern Ruichang City source area to the Poyang Lake source area, the western Pengze County source area to the Poyang Lake source area, and the corridor connecting southern Linchuan to southern Fengcheng (Figure 8). Notably, the number of pinch points under the EP scenario increased significantly. Ecological pinch points, characterized by rich biodiversity and fragile ecosystems, showed a decrease under the ED scenario due to growth of the economy and the interference of human activities on natural ecosystems.
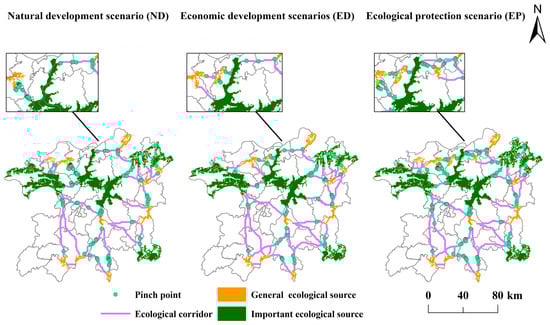
Figure 8.
Ecological pinch point extraction.
The number of barrier points in different contexts (ND, ED, and EP) were found to be 116, 121, and 104, respectively, with the highest number of ecological barrier points in the ED context. As shown in Figure 9, these barrier points are primarily clustered around the corridors of the southern source area of Wuning County—the source region of Jinxian County, the southern source region of Jingdezhen, and the source region of Poyang Lake—and the source area of Pengze County, which are close to densely populated cities. The corridor between the Wuning–Jinxian County source sites passes through the densely populated Qingshan Lake District of Nanchang, while the southern Jingdezhen source sites are located near the Zhushan District and the Changjiang District, which belong to the area where areas of high human activity intersect with ecologically suitable regions. Due to the significant ecological impact of human activities, these areas have become major obstacles to species migration and organism flow, highlighting the urgent need for ecological restoration.
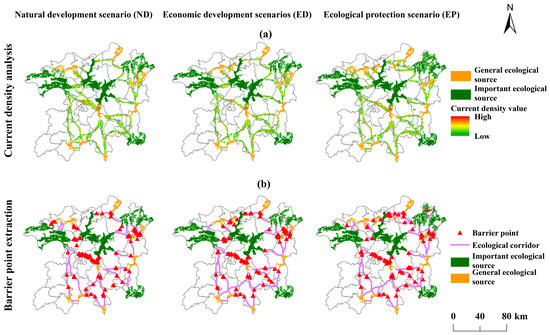
Figure 9.
Ecological barrier point extraction. (a) Illustrates the magnitude of current density; (b) Presents the distribution of ecological barrier points.
4.5. Analysis of Ecological Security Pattern Construction
Landscape elements including source areas and corridors with nodes together form an ecological security pattern combining “points, lines, and surfaces” (Figure 10). In general, source areas are more dispersed and primarily located in the northern part of this study region. As a result, the connecting corridors are primarily found in the southern area, with a longer length and a greater number of corridors. Ecological pinch points are mainly concentrated in the northern part of research region, where there is a high density of source areas and low resistance values, especially concentrated on the corridors of Poyang Lake–northern De’an County source site and the Poyang Lake–northeastern Poyang County source site, which are ecologically fragile areas that require key ecological protection. The ecological barrier sites are more widely dispersed, typically located in areas with high resistance values and significant urban development. The highest concentration of barrier points was found in Nanchang and Jingdezhen, which are critical areas for ecological restoration; these regions should be prioritized for ecological safety measures, with a focus on improving landscape connectivity and removing barrier points.
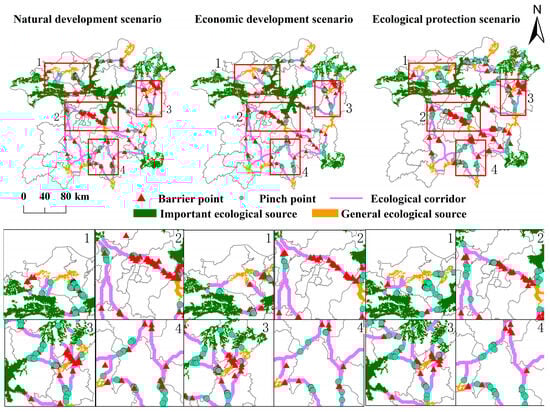
Figure 10.
Patterns of ecological security in 2030.
Based on the EP scenario for 2030, the PLEEZ was divided into “four cores, two regions, and one belt” (Figure 11). The four areas with good ecological quality and more stable source distribution were first identified as the ecological core, assuming the primary ecological functions of region. The northern ecological source area of the PLEEZ was divided into ecologically fragile zones, where ecological pinch points are concentrated in varying conditions, with significant changes in the source area. These areas are subject to key ecological protection efforts. Lastly, regions with concentrated distributions of obstacle sites were designated as ecological restoration areas.
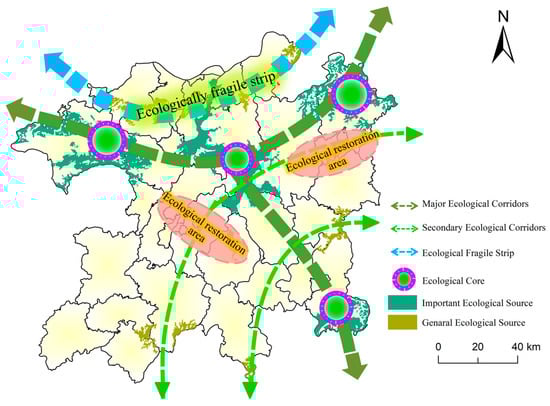
Figure 11.
Ecological zone.
5. Discussion
5.1. PLUS Model and Ecological Security Pattern Coupling Study
In the course of this study, 19, 18, and 21 ecological source areas were identified under different scenarios, along with the construction of 37, 35, and 43 ecological corridors, respectively, and the extraction of multiple ecological nodes. Traditional approaches to ecological security pattern (ESP) research provide valuable scientific support for regional ecosystem restoration [80,81]. However, future development remains highly uncertain [41]. Therefore, this study employed land use scenario simulations to explore future ESPs, with the aim of reconciling the conflict between economic development and ecological protection. By adopting a forward-looking perspective, we analyzed the dominant drivers of ESP changes and identified optimal development pathways.
Under the ED scenario, forest land, cropland, and water bodies are projected to be converted into construction land, whereas under the EP scenario, areas of forest land and grassland are expected to increase. These land types, characterized by high habitat quality, may serve as key factors influencing the integrity and fragmentation of ecological source areas. In conjunction with previous research findings, we suggest that these high-quality habitats play a critical role in shaping the structure of ecological source areas [82,83] and even directly contribute to the differences observed in ecological security patterns across multiple scenarios [12,84].
The ecological security pattern under the 2030 EP scenario represents the most optimal development state under ecological protection policies. In this scenario, the ecological environment is of high quality, and landscape connectivity is strong, facilitating the migration and dispersal of organisms. However, dense ecological barrier areas persist in the central regions of Nanchang and Jingdezhen, which is consistent with findings from existing studies [13,85,86,87]. This outcome can be primarily attributed to the high level of urbanization in Nanchang, where rapid development and urban expansion significantly hinder the movement of organisms between ecological source areas in southern Wuning County and Jinxian County. Similarly, Jingdezhen is surrounded by hills and mountains, while its central area is relatively flat. As the urban core with concentrated economic activities and population, this area disrupts landscape connectivity with the surrounding forest ecosystems, forming barriers that impede biological movement.
5.2. Ecological Source Area Overlay Studies
Methodologically, this study used InVEST superimposed on MSPA analysis for source location identification to overcome the limitations of a single method and improve the accuracy of source location identification [88]. The source sites identified based on this method have a high degree of overlap with ecologically sound woodlands, grasslands, and waters. Compared to existing studies [55,89,90] the source distribution area is roughly the same, but after rigorous overlay screening, the source patches were found to be more fragmented and relatively smaller in size [91]. Then, Conefor 2.6 was used to further classify ecological source according to landscape connectivity, and the important source regions were mainly distributed in Poyang Lake, Wuning County, Fuliang County, and the southern part of Guixi City, which are dominated by watersheds and low hills and have received less anthropogenic interference.
These ecological source areas identified based on the above methodology differed in different scenarios. Under the EP scenario, new ecological sources emerged in the southern part of Ruichang City and along the border between the Hukou and Duchang counties. Additionally, the sources located in the southern region of Fuliang County shifted from general to key ecological sources. The changes in land use types are closely related to landscape connectivity [92], as the expansion of hilly areas in this region has significantly enhanced landscape connectivity. In contrast, under the ND scenario, the disappearance of the source area in the northern part of Lushan City was caused, on the one hand, by the disconnection of bridging areas that originally played a role in maintaining landscape connectivity, leading to increased fragmentation of the source area [93], and on the other hand, by the reduction of forest area driven by urban construction and tourism development needs.
5.3. Future Dynamic Impacts of Land Use Change on Ecological Elements
The results indicate that land use change has significant impacts on key ecological elements. Using the 2030 natural development scenario as a baseline, notable differences in ecological conditions were observed when compared with the economic development and ecological protection scenarios. Under the economic development scenario, the expansion of construction land led to a sharp reduction in areas of high habitat importance. As a result, the area of ecological sources significantly declined, causing the disappearance of two ecological corridors and consequently impairing the overall ecological functionality of the region. These findings suggest that rapid urbanization intensifies habitat fragmentation, thereby negatively affecting the quality and stability of ecological land [94].
In contrast, under the ecological protection scenario, regional ecological conditions improved significantly, which were characterized by a decrease in the proportion of construction land and an increase in woodland area. Ecological sources expanded substantially, with two new sources emerging, and six additional ecological corridors were formed, which significantly enhanced the region’s overall ecological quality. Simultaneously, the reduction in barrier points indicates more effective buffering at the urban–ecological land interface, resulting in improved landscape connectivity.
These findings underscore the pivotal role of land use strategies in maintaining ecological security and biodiversity. Urban expansion can disrupt ecological sources, degrade existing ecological corridors [95], and increase ecological barriers, ultimately undermining the integrity of regional ecosystems. In contrast, a land use strategy focused on ecological protection helps to preserve landscape connectivity and ensure the long-term stability of ecological sources in the region [96].
5.4. Ecological Zoning Management Strategies
Based on the projected future ecological security pattern, this study proposes a zoning framework referred to as the “Four Cores, Two Zones, and One Belt” strategy. The ecological source areas are primarily distributed in the northern part of the study area, comprising forests and Poyang Lake. To ensure ecological integrity, conservation efforts should be intensified, focusing on forest and lake protection. Key measures include promoting forest incentives, establishing a forest carbon sink system, encouraging lake and wetland ecotourism, and continuously implementing afforestation and greening projects [97,98]. Designating these regions as ecological conservation core areas is crucial for maintaining long-term ecosystem stability [99]. The ecological restoration zones mainly consist of cultivated land, forestland, and construction land. The primary challenge in these zones lies in balancing ecological restoration with economic development. Future strategies should include constructing secondary ecological corridors to enhance the connectivity of the ecological security network, establishing an ecological compensation mechanism to regulate construction land expansion and minimize its impact on nearby ecological source areas, as well as increasing artificial wetlands and afforestation projects to facilitate their transition into relatively stable ecosystems [30,100,101]. The ecological fragile belt is characterized by a highly sensitive environment, complex land use patterns, and significant human activity influence. A “returning farmland to lake and wetland” policy should be implemented in the areas surrounding Poyang Lake, accompanied by a cross-regional collaborative management and ecological compensation mechanism to support ecological restoration. Additionally, an ecological shelterbelt should be established, delineating ecological protection red lines [102], and a forest closure and restoration policy should be applied to degraded areas (e.g., Lushan Mountain) to mitigate environmental deterioration [103].
5.5. Research Limitations
This study integrates the PLUS model with the ecological security pattern, but uncertainties remain, and further improvements are necessary. Overlay identification of source sites should be integrated with more factors such as nature conservation areas and could be refined on this basis. On the other hand, the PLUS model has several limitations, particularly when applied to complex ecosystems. First, the model heavily relies on historical land use data, following the development trends of previous land use patterns, and it cannot account for the impact of sudden extreme natural or human-made events (e.g., ecological policies) on future land use changes [30]. Second, the selection of driving factors and the setting of multiple scenarios are subjective. Despite referencing relevant studies and conducting several trials, the choice of factors and scenario settings should be based on more thorough scientific evidence [104]. Additionally, the model focuses on land use changes across different land types, without considering the interactions of complex ecological variables such as biodiversity, habitat changes, and species migration.
5.6. Future Research Directions
In future research, we can try to couple multiple models for simulation, for example, adding the system dynamics model (SDs) can synthesize multiple factors for more scientific prediction [105,106]. We can compare the impacts of different ecosystem service functions on source sites in terms of source site identification and select more representative factors as the main basis for judging source sites. Building on the findings from this research, ecological security patterns can be further evaluated and optimized. Finally, the development for ecological security patterns will provide a scientific foundation for a region’s sustainable development. Future research should also focus on integrating the results of ecological security patterns predictions with regional eco-security strategies and national spatial planning.
6. Conclusions
This study integrates land use projections with ecological security pattern to examine changes in ecological security patterns by 2030 under three scenarios: ND, ED, and EP. Results show that land allocated for economic development in 2030 is approximately three times larger than that in ecological protection scenario. Under the different scenarios, 19, 18, and 21 ecological source sites were identified, exhibiting a spatial distribution characterized by strips and blocks, with more sites to the north and fewer to the south. A total of 37, 35, and 43 ecological corridors were constructed, displaying a spider web-like distribution. Additionally, 94, 62, and 107 ecological pinch points, as well as 116, 121, and 104 ecological obstacle points, were identified, primarily concentrated in two urban areas: Nanchang City and the central part of Jingdezhen City.
The ecological security pattern under the 2030 EP scenario represents a more desirable development direction that maximizes the retention of ecological patches, prevents habitat fragmentation, and promotes biological flows. Finally, based on the EP scenario, the zoning concept of “Four Cores, Two Zones, and One Belt” was proposed, and Poyang Lake, Wuning County, Fuliang County, and the southern part of Guixi were identified as the core areas for ecological function, playing a critical role in the region’s sustainable development. This paper provides valuable scientific guidance for future ecological protection and restoration efforts in the region.
Author Contributions
Conceptualization, Y.S. and L.D.; Methodology, M.L. and L.D.; Software, Y.S., N.C., J.L. and W.Y.; Validation, Y.S., M.L., L.D., N.C. and W.Y.; Investigation, J.L.; Resources, N.C., J.L. and W.Y.; Data curation, N.C.; Writing—original draft, Y.S.; Writing—review & editing, Y.S.; Supervision, M.L. and L.D.; Project administration, M.L.; Funding acquisition, M.L. All authors have read and agreed to the published version of the manuscript.
Funding
This study was supported by the Natural Science Foundation of Jiangxi Province (20242BAB20125), the Graduate Innovation Fund of East China University of Technology—Research on the Prediction of Ecological Security Pattern of Poyang Lake Ecological and Economic Zone in Jiangxi Province (YC2024-S464), and the Graduate Student Innovation Fund of East China University of Technology—Mineralogical Characteristics and Metallogenic Mechanism of Neogene sandstone Type Uranium Deposit in Chepaizi Uplift, west margin of Junggar Basin, China (YC2024-B204).
Institutional Review Board Statement
Not applicable.
Informed Consent Statement
Not applicable.
Data Availability Statement
Data are contained within the article. The data are available upon request.
Conflicts of Interest
The authors declare that they have no known competing financial interests or personal relationships that could have appeared to influence the work reported in this paper.
References
- Cai, Z.; Ren, B.; Xie, Q.; Deng, X.; Yin, W.; Chen, L. Potential toxic heavy metals in village topsoil of antimony mining area: Pollution and distribution, environmental safety—A case study of Qilijiang village in xikuangshan mining area, central Hunan Province, China. Ecol. Indic. 2023, 155, 111033. [Google Scholar] [CrossRef]
- Cao, B.; Bai, C.; Xue, Y.; Yang, J.; Gao, P.; Liang, H.; Zhang, L.; Che, L.; Wang, J.; Xu, J.; et al. Wetlands rise and fall: Six endangered wetland species showed different patterns of habitat shift under future climate change. Sci. Total Environ. 2020, 731, 138518. [Google Scholar] [CrossRef] [PubMed]
- Balkanlou, K.R.; Müller, B.; Cord, A.F.; Panahi, F.; Malekian, A.; Jafari, M.; Egli, L. Spatiotemporal dynamics of ecosystem services provision in a degraded ecosystem: A systematic assessment in the Lake Urmia basin, Iran. Sci. Total Environ. 2020, 716, 137100. [Google Scholar] [CrossRef] [PubMed]
- Nan, B.; Zhai, Y.; Wang, M.; Wang, H.; Cui, B. Ecological Security Assessment, Prediction, and Zoning Management: An Integrated Analytical Framework. Engineering 2024, 11. in press. [Google Scholar] [CrossRef]
- Liu, C.; Li, W.; Xu, J.; Zhou, H.; Li, C.; Wang, W. Global trends and characteristics of ecological security research in the early 21st century: A literature review and bibliometric analysis. Ecol. Indic. 2022, 137, 108734. [Google Scholar] [CrossRef]
- Bai, Y.; Wong, C.P.; Jiang, B.; Hughes, A.C.; Wang, M.; Wang, Q. Developing China’s Ecological Redline Policy using ecosystem services assessments for land use planning. Nat. Commun. 2018, 9, 3034. [Google Scholar] [CrossRef]
- Wang, Q.; Bai, X. Spatiotemporal characteristics of human activity and land use on ecosystem service functions in mountainous areas of Northeast Guizhou, Southwest China. Ecol. Eng. 2025, 212, 107473. [Google Scholar] [CrossRef]
- Yang, H.; Wang, Y.; Tu, P.; Zhong, Y.; Huang, C.; Pan, X.; Xu, K.; Hong, S. Evaluating the Effects of Future Urban Expansion on Ecosystem Services in the Yangtze River Delta Urban Agglomeration under the Shared Socioeconomic Pathways. Ecol. Indic. 2024, 111, 111831. [Google Scholar] [CrossRef]
- Yimer, T.F.; Ayele, D.T.; Brihanu, Y.K.; Akele, M.L.; Kassaw, M.M.; Alemu, A.K.; Ayitegeb, D.Y.; Birhan, T.A.; Amare, Z.M.; Semegn, A.A.; et al. Ecological risk assessment of organochlorine pesticide residues in sediment samples from Lake Tana and Hayqe in Northwest Ethiopia. Emerg. Contam. 2024, 10, 100354. [Google Scholar] [CrossRef]
- Kuczynski, A.; Smith, R.G.R.; Fraser, C.E.; Larned, S.T. Environmental Indicators of Lake Ecosystem Health in Aotearoa New Zealand: Current State and Trends. Ecol. Indic. 2024, 165, 112185. [Google Scholar] [CrossRef]
- Fang, J.; Xu, L.; Lu, Q. Ecological security patterns of Chinese lakes based on ecosystem service values assessment and human threat factors evaluation. Ecol. Inform. 2024, 82, 102754. [Google Scholar] [CrossRef]
- Luo, X.; Le, F.; Zhang, Y.; Zhang, H.; Zhai, J.; Luo, Y. Multi-Scenario Analysis and Optimization Strategy of Ecological Security Pattern in the Weihe River Basin. J. Environ. Manag. 2024, 366, 121813. [Google Scholar] [CrossRef] [PubMed]
- Liu, Y.; Liu, J.; Yin, X.; Ouyang, X.; Ji, C.; Li, S.; Wei, G. Human Activities and Ecosystem Health: A Historical Analysis of Poyang Lake. Ecol. Indic. 2024, 166, 112446. [Google Scholar] [CrossRef]
- Dai, L.; Liu, Y.; Luo, X. Integrating the MCR and DOI models to construct an ecological security network for the urban agglomeration around Poyang Lake, China. Sci. Total Environ. 2021, 754, 141868. [Google Scholar] [CrossRef]
- Deng, Y.; Shao, Z.; Dang, C.; Huang, X.; Zhuang, Q. The impact of policies on land cover and ecosystem services dynamics in the Poyang Lake Ecological Economic Zone, China. Ecol. Indic. 2023, 156, 111169. [Google Scholar] [CrossRef]
- Chen, M.; Zeng, S.; Jiang, B.; Wen, Z.; Wu, J.; Xia, J. The Comprehensive Evaluation of How Water Level Fluctuation and Temperature Change Affect Vegetation Cover Variations at a Lake of Ecological Importance (Poyang Lake), China. Ecol. Indic. 2023, 148, 110041. [Google Scholar] [CrossRef]
- Tian, Z.; Liu, S.; Gu, P.; Lv, X.; Peng, W. Construction of Ecological Security Patterns in Huludao City Based on the MSPA-MCR-FLUS Model. J. Agric. Res. Environ. 2024, 1, 1–17. [Google Scholar]
- Peng, K.; Jiang, W.; Ling, Z.; Hou, P.; Deng, Y. Evaluating the potential impacts of land use changes on ecosystem service value under multiple scenarios in support of SDG reporting: A case study of the Wuhan urban agglomeration. J. Clean. Prod. 2021, 307, 127321. [Google Scholar] [CrossRef]
- Shuai, N.; Hu, Y.; Gao, M.; Guo, Z.; Bai, Y. Construction and optimization of ecological networks in karst regions based on multi-scale nesting: A case study in Guangxi Hechi, China. Ecol. Inform. 2023, 74, 101963. [Google Scholar] [CrossRef]
- Peng, J.; Pan, Y.; Liu, Y.; Zhao, H.; Wang, Y. Linking ecological degradation risk to identify ecological security patterns in a rapidly urbanizing landscape. Habitat Int. 2018, 71, 110–124. [Google Scholar] [CrossRef]
- Wang, Y.; Dong, W.; Zhang, Y.; Fu, B.; Zhao, Z.; Lv, Y.; Zhang, J. Progress in Ecological Security Research Based on Ecosystem Services. Acta Ecol. Sin. 2023, 43, 7821–7829. [Google Scholar] [CrossRef]
- Wei, W.; Zhang, Y.; Wei, X.; Xie, B.; Ma, Z.; Liu, C.; Yu, L.; Zhou, J.; Shi, W.; Liu, T.; et al. Construction and optimization of ecological security patterns based on ecosystem service function and ecosystem sensitivity in the important ecological functional area—A case study in the Yellow River Basin. Ecol. Eng. 2025, 215, 107609. [Google Scholar] [CrossRef]
- Li, L.; Huang, X.; Wu, D.; Yang, H. Construction of ecological security pattern adapting to future land use change in Pearl River Delta, China. Appl. Geogr. 2023, 154, 102946. [Google Scholar] [CrossRef]
- Zhang, M.; Chen, E.; Zhang, C.; Liu, C.; Li, J. Multi-Scenario Simulation of Land Use Change and Ecosystem Service Value Based on the Markov–FLUS Model in Ezhou City, China. Sustainability 2024, 16, 6237. [Google Scholar] [CrossRef]
- Wang, T.; Li, H.; Huang, Y. The Complex Ecological Network’s Resilience of the Wuhan Metropolitan Area. Ecol. Indic. 2021, 130, 108101. [Google Scholar] [CrossRef]
- Miao, Z.; Pan, L.; Wang, Q.; Chen, P.; Yan, C.; Liu, L. Research on Urban Ecological Network under the Threat of Road Networks—A Case Study of Wuhan. ISPRS Int. J. Geo-Inf. 2019, 8, 342. [Google Scholar] [CrossRef]
- Zeng, W.; He, Z.; Bai, W.; He, L.; Chen, X.; Chen, J. Identification of Ecological Security Patterns of Alpine Wetland Grasslands Based on Landscape Ecological Risks: A Study in Zoigê County. Sci. Total Environ. 2024, 928, 172302. [Google Scholar] [CrossRef]
- Peng, J.; Zhao, S.; Dong, J.; Liu, Y.; Meersmans, J.; Li, H.; Wu, J. Applying Ant Colony Algorithm to Identify Ecological Security Patterns in Megacities. Environ. Model. Softw. 2019, 117, 214–222. [Google Scholar] [CrossRef]
- Xu, X.; Yang, G.; Tan, Y. Identifying Ecological Red Lines in China’s Yangtze River Economic Belt: A Regional Approach. Ecol. Indic. 2019, 96, 635–646. [Google Scholar] [CrossRef]
- Xu, X.; Wang, S.; Rong, W. Construction of Ecological Network in Suzhou Based on the PLUS and MSPA Models. Ecol. Indic. 2023, 154, 110740. [Google Scholar] [CrossRef]
- Zhao, C.; Wu, S.; Yang, L.; Wu, Y.; Xiao, P.; Xu, J.; Liu, Y. Evaluating Ecological Conservation Effectiveness of Security Patterns under Multiple Scenarios: A Case Study of Hubei Province. Ecol. Indic. 2024, 166, 112528. [Google Scholar] [CrossRef]
- Li, Y.; Zhao, J.; Yuan, J.; Ji, P.; Deng, X.; Yang, Y. Constructing the Ecological Security Pattern of Nujiang Prefecture Based on the Framework of “Importance–Sensitivity–Connectivity”. Int. J. Environ. Res. Public Health 2022, 19, 10869. [Google Scholar] [CrossRef] [PubMed]
- Xu, A.; Hu, M.; Shi, J.; Bai, Q.; Li, X. Construction and Optimization of Ecological Network in Inland River Basin Based on Circuit Theory, Complex Network, and Ecological Sensitivity: A Case Study of Gansu Section of Heihe River Basin. Ecol. Model. 2024, 488, 110578. [Google Scholar] [CrossRef]
- Yang, J.; Deng, W.; Zhang, G.; Cui, X. Linking Endangered Species Protection to Construct and Optimize Ecological Security Patterns in the National Ecological Civilization Construction Demonstration Zone: A Case Study of Yichang, China. Ecol. Indic. 2024, 158, 111579. [Google Scholar] [CrossRef]
- Wang, Z.; Shi, P.; Zhang, X.; Tong, H.; Zhang, W.; Liu, Y. Research on Landscape Pattern Construction and Ecological Restoration of Jiuquan City Based on Ecological Security Evaluation. Sustainability 2021, 13, 5732. [Google Scholar] [CrossRef]
- Sun, D.; Wu, X.; Wen, H.; Ma, X.; Zhang, F.; Ji, Q.; Zhang, J. Ecological Security Pattern Based on XGBoost-MCR Model: A Case Study of the Three Gorges Reservoir Region. J. Clean. Prod. 2024, 470, 143252. [Google Scholar] [CrossRef]
- Wang, B.; Fu, S.; Hao, Z.; Zhen, Z. Ecological Security Pattern Based on Remote Sensing Ecological Index and Circuit Theory in the Shanxi Section of the Yellow River Basin. Ecol. Indic. 2024, 166, 112382. [Google Scholar] [CrossRef]
- He, H.; Yu, X.; Yu, H.; Ma, Z.; Luo, Y.; Liu, T.; Zhao, Y. Suitable Habitat Evaluation and Ecological Security Pattern Optimization for the Ecological Restoration of Giant Panda Habitat Based on Nonstationary Factors and MCR Model. Ecol. Model. 2024, 494, 110760. [Google Scholar] [CrossRef]
- Huang, L.; Chen, Z.; Yang, Z.; Chen, M.; Chen, X.; Zhai, T.; Qiu, T. Integrating “Quality-Risk-Demand” Framework and Circuit Theory to Identify Spatial Range and Priority Area of Ecological Security Pattern in a Rapidly Urbanizing Landscape. Ecol. Inform. 2024, 82, 102673. [Google Scholar] [CrossRef]
- Pan, J.; Liang, J.; Zhao, C. Identification and Optimization of Ecological Security Pattern in Arid Inland Basin Based on Ordered Weighted Average and Ant Colony Algorithm: A Case Study of Shule River Basin, NW China. Ecol. Indic. 2023, 154, 110588. [Google Scholar] [CrossRef]
- Sui, L.; Yan, Z.; Li, K.; Wang, C.; Shi, Y.; Du, Y. Prediction of Ecological Security Network in Northeast China Based on Landscape Ecological Risk. Ecol. Indic. 2024, 160, 111783. [Google Scholar] [CrossRef]
- Li, S.; Xiao, W.; Zhao, Y.; Lv, X. Incorporating Ecological Risk Index in the Multi-Process MCRE Model to Optimize the Ecological Security Pattern in a Semi-Arid Area with Intensive Coal Mining: A Case Study in Northern China. J. Clean. Prod. 2020, 247, 119143. [Google Scholar] [CrossRef]
- Gou, R.; Su, W.; Quan, X.; Huang, X. Identification of Ecological Security Patterns in the Quiet Zone of the “China Sky Eye”—Based on OWA and Circuit Theory. Acta Ecol. Sin. 2024, 44, 9636–9651. [Google Scholar] [CrossRef]
- Wu, S.; Zhao, C.; Yang, L.; Huang, D.; Wu, Y.; Xiao, P. Spatial and Temporal Evolution Analysis of Ecological Security Pattern in Hubei Province Based on Ecosystem Service Supply and Demand Analysis. Ecol. Indic. 2024, 162, 112051. [Google Scholar] [CrossRef]
- Yang, W.; Ye, H. Identification of Ecological Networks in the Guangdong-Hong Kong-Macao Greater Bay Area Based on Habitat Quality. Acta Ecol. Sin. 2023, 43, 10430–10442. [Google Scholar] [CrossRef]
- Gao, L.; Tao, F.; Liu, R.; Wang, Z.; Leng, H.; Zhou, T. Multi-Scenario Simulation and Ecological Risk Analysis of Land Use Based on the PLUS Model: A Case Study of Nanjing. Sustain. Cities Soc. 2022, 85, 104055. [Google Scholar] [CrossRef]
- Laar, C.; Annan, K.B.K.; Gibrilla, A.; Kusi-Afrakoma, Z.; Korkor-Asante, O.; Saah-Hayford, M.; Anornu, G. Assessing the Impact of Land Use and Land Cover Change on the Densu Delta Wetland Using Markov Chain Modeling and Artificial Neural Networks. Environ. Chall. 2024, 17, 101018. [Google Scholar] [CrossRef]
- Sarif, M.O.; Gupta, R.D.; Sharifi, A. Predicting Prayagraj’s Urbanization Trajectory Using CA-ANN Modelling: Population Pressures and Land Use Dynamics. J. Environ. Manag. 2024, 370, 122469. [Google Scholar] [CrossRef]
- Chasia, S.; Olang, L.O.; Sitoki, L. Modelling of Land-Use/Cover Change Trajectories in a Transboundary Catchment of the Sio-Malaba-Malakisi Region in East Africa Using the CLUE-s Model. Ecol. Model. 2023, 476, 110256. [Google Scholar] [CrossRef]
- Liao, G.; He, P.; Gao, X.; Lin, Z.; Huang, C.; Zhou, W.; Deng, L. Land Use Optimization of Rural Production–Living–Ecological Space at Different Scales Based on the BP–ANN and CLUE–S Models. Ecol. Indic. 2022, 137, 108710. [Google Scholar] [CrossRef]
- Qiao, X.; Li, Z.; Lin, J.; Wang, H.; Zheng, S.; Yang, S. Assessing Current and Future Soil Erosion under Changing Land Use Based on InVEST and FLUS Models in the Yihe River Basin, North China. Int. Soil Water Conserv. Res. 2024, 12, 298–312. [Google Scholar] [CrossRef]
- Xin, S.; Li, Z.; Chen, N.; Zhang, Z.; Zhang, X.; Chen, H.; Kang, L. The Contribution of Multi-Objective Land Use Optimization to Reducing Ecological Risk: A Case Study of the Lanzhou-Xining Urban Agglomeration. Ecol. Indic. 2024, 168, 112604. [Google Scholar] [CrossRef]
- Luan, C.; Liu, R.; Li, Y.; Zhang, Q. Comparison of Various Models for Multi-Scenario Simulation of Land Use/Land Cover to Predict Ecosystem Service Value: A Case Study of Harbin-Changchun Urban Agglomeration, China. J. Clean. Prod. 2024, 478, 144012. [Google Scholar] [CrossRef]
- Liang, X.; Guan, Q.; Clarke, K.C.; Liu, S.; Wang, B.; Yao, Y. Understanding the Drivers of Sustainable Land Expansion Using a Patch-Generating Land Use Simulation (PLUS) Model: A Case Study in Wuhan, China. Comput. Environ. Urban Syst. 2021, 85, 101569. [Google Scholar] [CrossRef]
- Wang, J.; Zhang, J.; Xiong, N.; Liang, B.; Wang, Z.; Cressey, E.L. Spatial and Temporal Variation, Simulation and Prediction of Land Use in Ecological Conservation Area of Western Beijing. Remote Sens. 2022, 14, 1452. [Google Scholar] [CrossRef]
- Chen, H.; Jin, G.; Tang, H.; Wu, J.; Wang, Y.-G.; Zhang, Z.; Deng, Y.; Zhang, S. Spatiotemporal Variations of Water Levels and River-Lake Interaction in the Poyang Lake Basin under the Extreme Drought. J. Hydrol. Reg. Stud. 2025, 57, 102165. [Google Scholar] [CrossRef]
- Zhang, P.; Mao, J.; Gu, K.; Dai, L.; Dai, H. Integrated Scheduling–Assessing System for Drought Mitigation in the River–Connected Lake. J. Environ. Manag. 2022, 313, 114999. [Google Scholar] [CrossRef]
- Han, Y.; Zhang, K.; Lin, Q.; Huang, S.; Yang, X. Assessing Lake Ecosystem Health from Disturbed Anthropogenic Landscapes: Spatial Patterns and Driving Mechanisms. Ecol. Indic. 2023, 147, 110007. [Google Scholar] [CrossRef]
- Ye, J.-H.; Yu, T.; Xu, Z.-T.; Liu, H.-Y.; Cai, Q.-R. Distribution and probabilistic integrated ecological risk assessment of heavy metals in the surface water of Poyang Lake, China. Chin. J. Anal. Chem. 2021, 49, 29–34. [Google Scholar] [CrossRef]
- Liu, C.; Liu, Y.; Giannetti, B.F.; Almeida, C.M.V.B.; Sevegnani, F.; Li, R. Spatiotemporal differentiation and mechanism of anthropogenic factors affecting ecosystem service value in the Urban Agglomeration around Poyang Lake, China. Ecol. Indic. 2023, 154, 110733. [Google Scholar] [CrossRef]
- Xu, X.; Liu, J.; Zhang, S.; Li, R.; Yan, C.; Wu, S. China Multi-Period Land Use Land Cover Remote Sensing Monitoring Dataset (CNLUCC); Resource and Environment Science and Data Center, Chinese Academy of Sciences: Beijing, China, 2018; Available online: https://www.resdc.cn/DOI/doi.aspx?DOIid=54 (accessed on 8 April 2025).
- Xu, X. China GDP Spatial Distribution Kilometer Grid Dataset. Resource and Environment Science Data Center, Chinese Academy of Sciences. 2017. Available online: https://www.resdc.cn/DOI/doi.aspx?DOIid=33 (accessed on 8 April 2025).
- Xu, X. China Meteorological Monthly Spatial Interpolation Dataset. Resource and Environment Science Data Center, Chinese Academy of Sciences. 2022. Available online: https://www.resdc.cn/DOI/DOI.aspx?DOIID=104 (accessed on 8 April 2025).
- National Earth System Science Data Center. Available online: http://www.geodata.cn (accessed on 8 April 2025).
- National Geographic Information Resources Catalog Service. Available online: http://www.ngcc.cn (accessed on 8 April 2025).
- Geospatial Data Cloud Platform, Computer Network Information Center, Chinese Academy of Sciences. Available online: http://www.gscloud.cn (accessed on 8 April 2025).
- Lv, J.; Wang, Y.; Liang, X.; Yao, Y.; Ma, T.; Guan, Q. Simulating Urban Expansion by Incorporating an Integrated Gravitational Field Model into a Demand-Driven Random Forest-Cellular Automata Model. Cities 2021, 109, 103044. [Google Scholar] [CrossRef]
- Zuo, R.; Ma, Y.; Tang, M.; Luo, H.; Li, J.; Liao, T.; Gong, Y.; Zhang, S.; Gong, J.; Yi, Y. Regional Carbon Storage Dynamics Driven by Tea Plantation Expansion: Insights from Meitan County, China. Land 2025, 14, 227. [Google Scholar] [CrossRef]
- Cao, X.; Liu, Z.; Li, S.; Gao, Z. Integrating the Ecological Security Pattern and the PLUS Model to Assess the Effects of Regional Ecological Restoration: A Case Study of Hefei City, Anhui Province. Int. J. Environ. Res. Public Health 2022, 19, 6640. [Google Scholar] [CrossRef]
- Yu, J.; Guo, S.; Wang, S.; Luo, Y. Multi-Scenario Simulation of Land Use Change and Ecosystem Health Assessment in Chengdu Metropolitan Area Based on SD-PLUS-VORS Coupled Modeling. Sustainability 2025, 17, 3202. [Google Scholar] [CrossRef]
- Sun, Y.; Yang, J.; Song, S.; Zhu, J.; Dai, J. Multi-Level Vector Cellular Automata Modeling and Land Use Change Simulation. Acta Geogr. Sin. 2020, 75, 2164–2179. [Google Scholar] [CrossRef]
- Cheng, Q.; Chen, R.; Xu, W.; Wang, M. Characteristics of Spatial and Temporal Evolution of Coastal Wetland Landscape Patterns and Prediction Analysis—A Case Study of Panjin Wetland, China. Land 2025, 14, 118. [Google Scholar] [CrossRef]
- Hillard, E.M.; Nielsen, C.K.; Groninger, J.W. Swamp Rabbits as Indicators of Wildlife Habitat Quality in Bottomland Hardwood Forest Ecosystems. Ecol. Indic. 2017, 79, 47–53. [Google Scholar] [CrossRef]
- Li, X.; Zhang, X.; Feng, H.; Li, Y.; Yu, J.; Liu, Y.; Du, H. Dynamic Evolution and Simulation of Habitat Quality in Arid Regions: A Case Study of the Hexi Region, China. Ecol. Model. 2024, 493, 110726. [Google Scholar] [CrossRef]
- Luo, J.; Fu, H. Constructing an Urban Cooling Network Based on PLUS Model: Implications for Future Urban Planning. Ecol. Indic. 2023, 154, 110887. [Google Scholar] [CrossRef]
- Mu, B.; Tian, G.; Xin, G.; Hu, M.; Yang, P.; Wang, Y.; Xie, H.; Mayer, A.L.; Zhang, Y. Measuring Dynamic Changes in the Spatial Pattern and Connectivity of Surface Waters Based on Landscape and Graph Metrics: A Case Study of Henan Province in Central China. Land 2021, 10, 471. [Google Scholar] [CrossRef]
- Saura, S.; Torné, J. Conefor Sensinode 2.2: A Software Package for Quantifying the Importance of Habitat Patches for Landscape Connectivity. Environ. Model. Softw. 2009, 24, 135–139. [Google Scholar] [CrossRef]
- Li, X.; Tao, H.; Wang, J.; Zhang, B.; Liu, Z.; Liu, Z.; Li, J. Integrated Evaluation of the Ecological Security Pattern in Central Beijing Using InVEST, MSPA, and Multifactor Indices. Land 2025, 14, 205. [Google Scholar] [CrossRef]
- Sun, T.; Lei, D.; Liu, L.; Bao, G.; Fu, H. Quantitative Comparison of Minimum Ecological Land in the Dianchi Lake Basin Based on the Minimum Cumulative Resistance Model and Scenario Simulation Method. Acta Ecol. Sin. 2024, 44, 9135–9145. [Google Scholar] [CrossRef]
- Chen, W.; Liu, H.; Wang, J. Construction and Optimization of Regional Ecological Security Patterns Based on MSPA-MCR-GA Model: A Case Study of Dongting Lake Basin in China. Ecol. Indic. 2024, 165, 112169. [Google Scholar] [CrossRef]
- Chen, L.; Zhang, A. Identification of land use conflicts and dynamic response analysis of natural-social factors in rapidly urbanizing areas—A case study of urban agglomeration in the middle reaches of Yangtze River. Ecol. Indic. 2024, 161, 112009. [Google Scholar] [CrossRef]
- Jiang, S.; Feng, F.; Zhang, X.; Xu, C.; Jia, B.; Lafortezza, R. Driving Factors of Fragmentation in Urban Landscapes: Local Contributions, Spatial Relationships, and Causal Effects. Ecologies 2025, 174, 113454. [Google Scholar] [CrossRef]
- Han, P.; Xiong, H.; Hu, H.; Zhou, J.; Wang, M. Integrating Risk-Conflict Assessment for Constructing and Optimizing Ecological Security Patterns of Polder Landscape in the Urban–Rural Fringe. Ecol. Indic. 2024, 166, 112256. [Google Scholar] [CrossRef]
- Chang, X.; Xing, Y.; Wang, J.; Yang, H.; Gong, W. Effects of Land Use and Cover Change (LUCC) on Terrestrial Carbon Stocks in China between 2000 and 2018. Resour. Conserv. Recycl. 2022, 182, 106333. [Google Scholar] [CrossRef]
- Tian, C.; Zhong, J.; You, Q.; Fang, C.; Hu, Q.; Liang, J.; He, J.; Yang, W. Land Use Modeling and Habitat Quality Assessment under Climate Scenarios: A Case Study of the Poyang Lake Basin. Ecol. Indic. 2025, 172, 113292. [Google Scholar] [CrossRef]
- Fu, Y.; Huang, M.; Gong, D.; Lin, H.; Fan, Y.; Du, W. Dynamic Simulation and Prediction of Carbon Storage Based on Land Use/Land Cover Change from 2000 to 2040: A Case Study of the Nanchang Urban Agglomeration. Remote Sens. 2023, 15, 4645. [Google Scholar] [CrossRef]
- Qing, L.; Huanhuan, F.; Fuqing, Z.; Wenbo, C.; Yuanping, X.; Bing, Y. The dominant role of human activity intensity in spatial pattern of ecosystem health in the Poyang Lake ecological economic zone. Ecol. Indic. 2024, 166, 112347. [Google Scholar] [CrossRef]
- Li, Y.; Liu, J.L.; Li, J.J.; Yang, C.Y.; Luo, G.J. Construction of Ecological Security Patterns in Karst Basins Based on Ecological Corridor Identification: A Case Study of the Nanming River Basin in Guizhou. Environ. Sci. 2024, 1, 1–23. [Google Scholar] [CrossRef]
- Dan, L. Multi-Scenario Simulation of Land Use in the Poyang Lake Ecological and Economic Zone Considering the Ecological Network. Master’s Thesis, Wuhan University, Wuhan, China, 2020. [Google Scholar]
- Liang, Z. Spatiotemporal Changes in Land Use and Ecological Security Patterns in the Poyang Lake Ecological and Economic Zone. Master’s Thesis, Jiangxi Normal University, Wuhan, China, 2021. [Google Scholar]
- Zhao, Y.; Luo, Y.; Yi, T.; Wang, Z.; Wang, N.; Wu, J. Construction of Ecological Security Patterns in Shenzhen Based on the Supply-Demand Matching of Ecosystem Services. Chin. J. Appl. Ecol. 2022, 33, 2475–2484. [Google Scholar] [CrossRef]
- Pelorosso, R.; Noce, S.; De Notaris, C.; Gobattoni, F.; Apollonio, C.; Petroselli, A.; Recanatesi, F.; Ripa, M.N. The Nexus between Connectivity, Climate, and Land Use: A Scenario Assessment of Bio-Energy Landscape Connectivity in Central Italy. J. Environ. Manag. 2025, 376, 124521. [Google Scholar] [CrossRef] [PubMed]
- Wu, X.; Pan, J.; Zhu, X. Optimizing the ecological source area identification method and building ecological corridor using a genetic algorithm: A case study in Weihe River Basin, NW China. Ecol. Inform. 2024, 80, 102519. [Google Scholar] [CrossRef]
- Li, M.; Chen, L.; Zhao, F.; Bu, Q.; Tang, J.; Wang, X.; Zhao, B.; Feng, Q.; Yang, L. The Distribution Pattern of Human Pathogens in Soil Was Affected by Social-Economic Pattern and Landscape Fragmentation in Rapidly Urbanizing Areas. Ecol. Front. 2025, 45, 589–598. [Google Scholar] [CrossRef]
- Ding, G.; Guo, J.; Yi, D.; Ou, M.; Yang, G. Evaluating habitat isolation driven by future urban growth: A landscape connectivity perspective. Environ. Impact Assess. Rev. 2025, 113, 107886. [Google Scholar] [CrossRef]
- Wang, X.; Wen, D.; Liu, P.; Wei, C.; Zhao, P.; Xu, N. Maintaining Ecological Connectivity in Highly Urbanized Areas: Optimal Strategy, Key Patches and Protection Policy. Ecol. Indic. 2024, 164, 112152. [Google Scholar] [CrossRef]
- Ren, Y.; Zhang, L.; Wei, X.; Song, Y.; Wu, S.; Wang, H.; Chen, X.; Qiao, Y.; Liang, T. Evaluating and Simulating the Impact of Afforestation Policy on Land Use and Ecosystem Services Trade-Offs in Linyi, China. Ecol. Indic. 2024, 160, 111898. [Google Scholar] [CrossRef]
- Zhu, L.; Zhu, K.; Zeng, X. Evolution of landscape pattern and response of ecosystem service value in international wetland cities: A case study of Nanchang City. Ecol. Indic. 2023, 155, 110987. [Google Scholar] [CrossRef]
- Li, J.; Liang, L.; Chao, Y.; Wang, X.; Qiu, M.; Luo, P.; Zhu, Y. Construction of the Ecological Security Pattern of Mu Us Sandy Land Based on the “Source–Resistance–Corridor” Theory. Ecol. Indic. 2025, 171, 113162. [Google Scholar] [CrossRef]
- Guo, Z.; Zhu, C.; Fan, X.; Li, M.; Xu, N.; Yuan, Y.; Guan, Y.; Lyu, C.; Bai, Z. Analysis of ecological network evolution in an ecological restoration area with the MSPA-MCR model: A case study from Ningwu County, China. Ecol. Indic. 2025, 170, 113067. [Google Scholar] [CrossRef]
- Tang, B.; Wang, H.; Liu, J.; Zhang, W.; Zhao, W.; Cheng, D.; Zhang, L.; Jiao, L. Identification of Ecological Restoration Priority Areas Integrating Ecological Security and Feasibility of Restoration. Ecol. Indic. 2024, 158, 111557. [Google Scholar] [CrossRef]
- Gu, Y.; Lin, N.; Cao, B.; Ye, X.; Pang, B.; Du, W.; Dou, H.; Zou, C.; Xu, C.; Xu, D.; et al. Assessing the Effectiveness of Ecological Conservation Red Line for Mitigating Anthropogenic Habitat Degradation in River Corridors. Ecol. Indic. 2023, 154, 110742. [Google Scholar] [CrossRef]
- Huang, A.; Xu, Y.; Sun, P.; Zhou, G.; Liu, C.; Lu, L.; Xiang, Y.; Wang, H. Land Use/Land Cover Changes and Its Impact on Ecosystem Services in Ecologically Fragile Zone: A Case Study of Zhangjiakou City, Hebei Province, China. Ecol. Indic. 2019, 104, 604–614. [Google Scholar] [CrossRef]
- Xu, L.; Liu, X.; Tong, D.; Liu, Z.; Yin, L.; Zheng, W. Forecasting Urban Land Use Change Based on Cellular Automata and the PLUS Model. Land 2022, 11, 652. [Google Scholar] [CrossRef]
- Li, C.; Wu, Y.; Gao, B.; Zheng, K.; Wu, Y.; Li, C. Multi-scenario simulation of ecosystem service value for optimization of land use in the Sichuan-Yunnan ecological barrier, China. Ecol. Indic. 2021, 132, 108328. [Google Scholar] [CrossRef]
- Luo, J.; Fu, H. Constructing the Future Wetland Ecological Security Pattern with Multi-Scenario Simulation. Ecol. Indic. 2023, 153, 110473. [Google Scholar] [CrossRef]
Disclaimer/Publisher’s Note: The statements, opinions and data contained in all publications are solely those of the individual author(s) and contributor(s) and not of MDPI and/or the editor(s). MDPI and/or the editor(s) disclaim responsibility for any injury to people or property resulting from any ideas, methods, instructions or products referred to in the content. |
© 2025 by the authors. Licensee MDPI, Basel, Switzerland. This article is an open access article distributed under the terms and conditions of the Creative Commons Attribution (CC BY) license (https://creativecommons.org/licenses/by/4.0/).