
An Empirical Evaluation of Communication Technologies and Quality of Delivery Measurement in Networked MicroGrids

Abstract

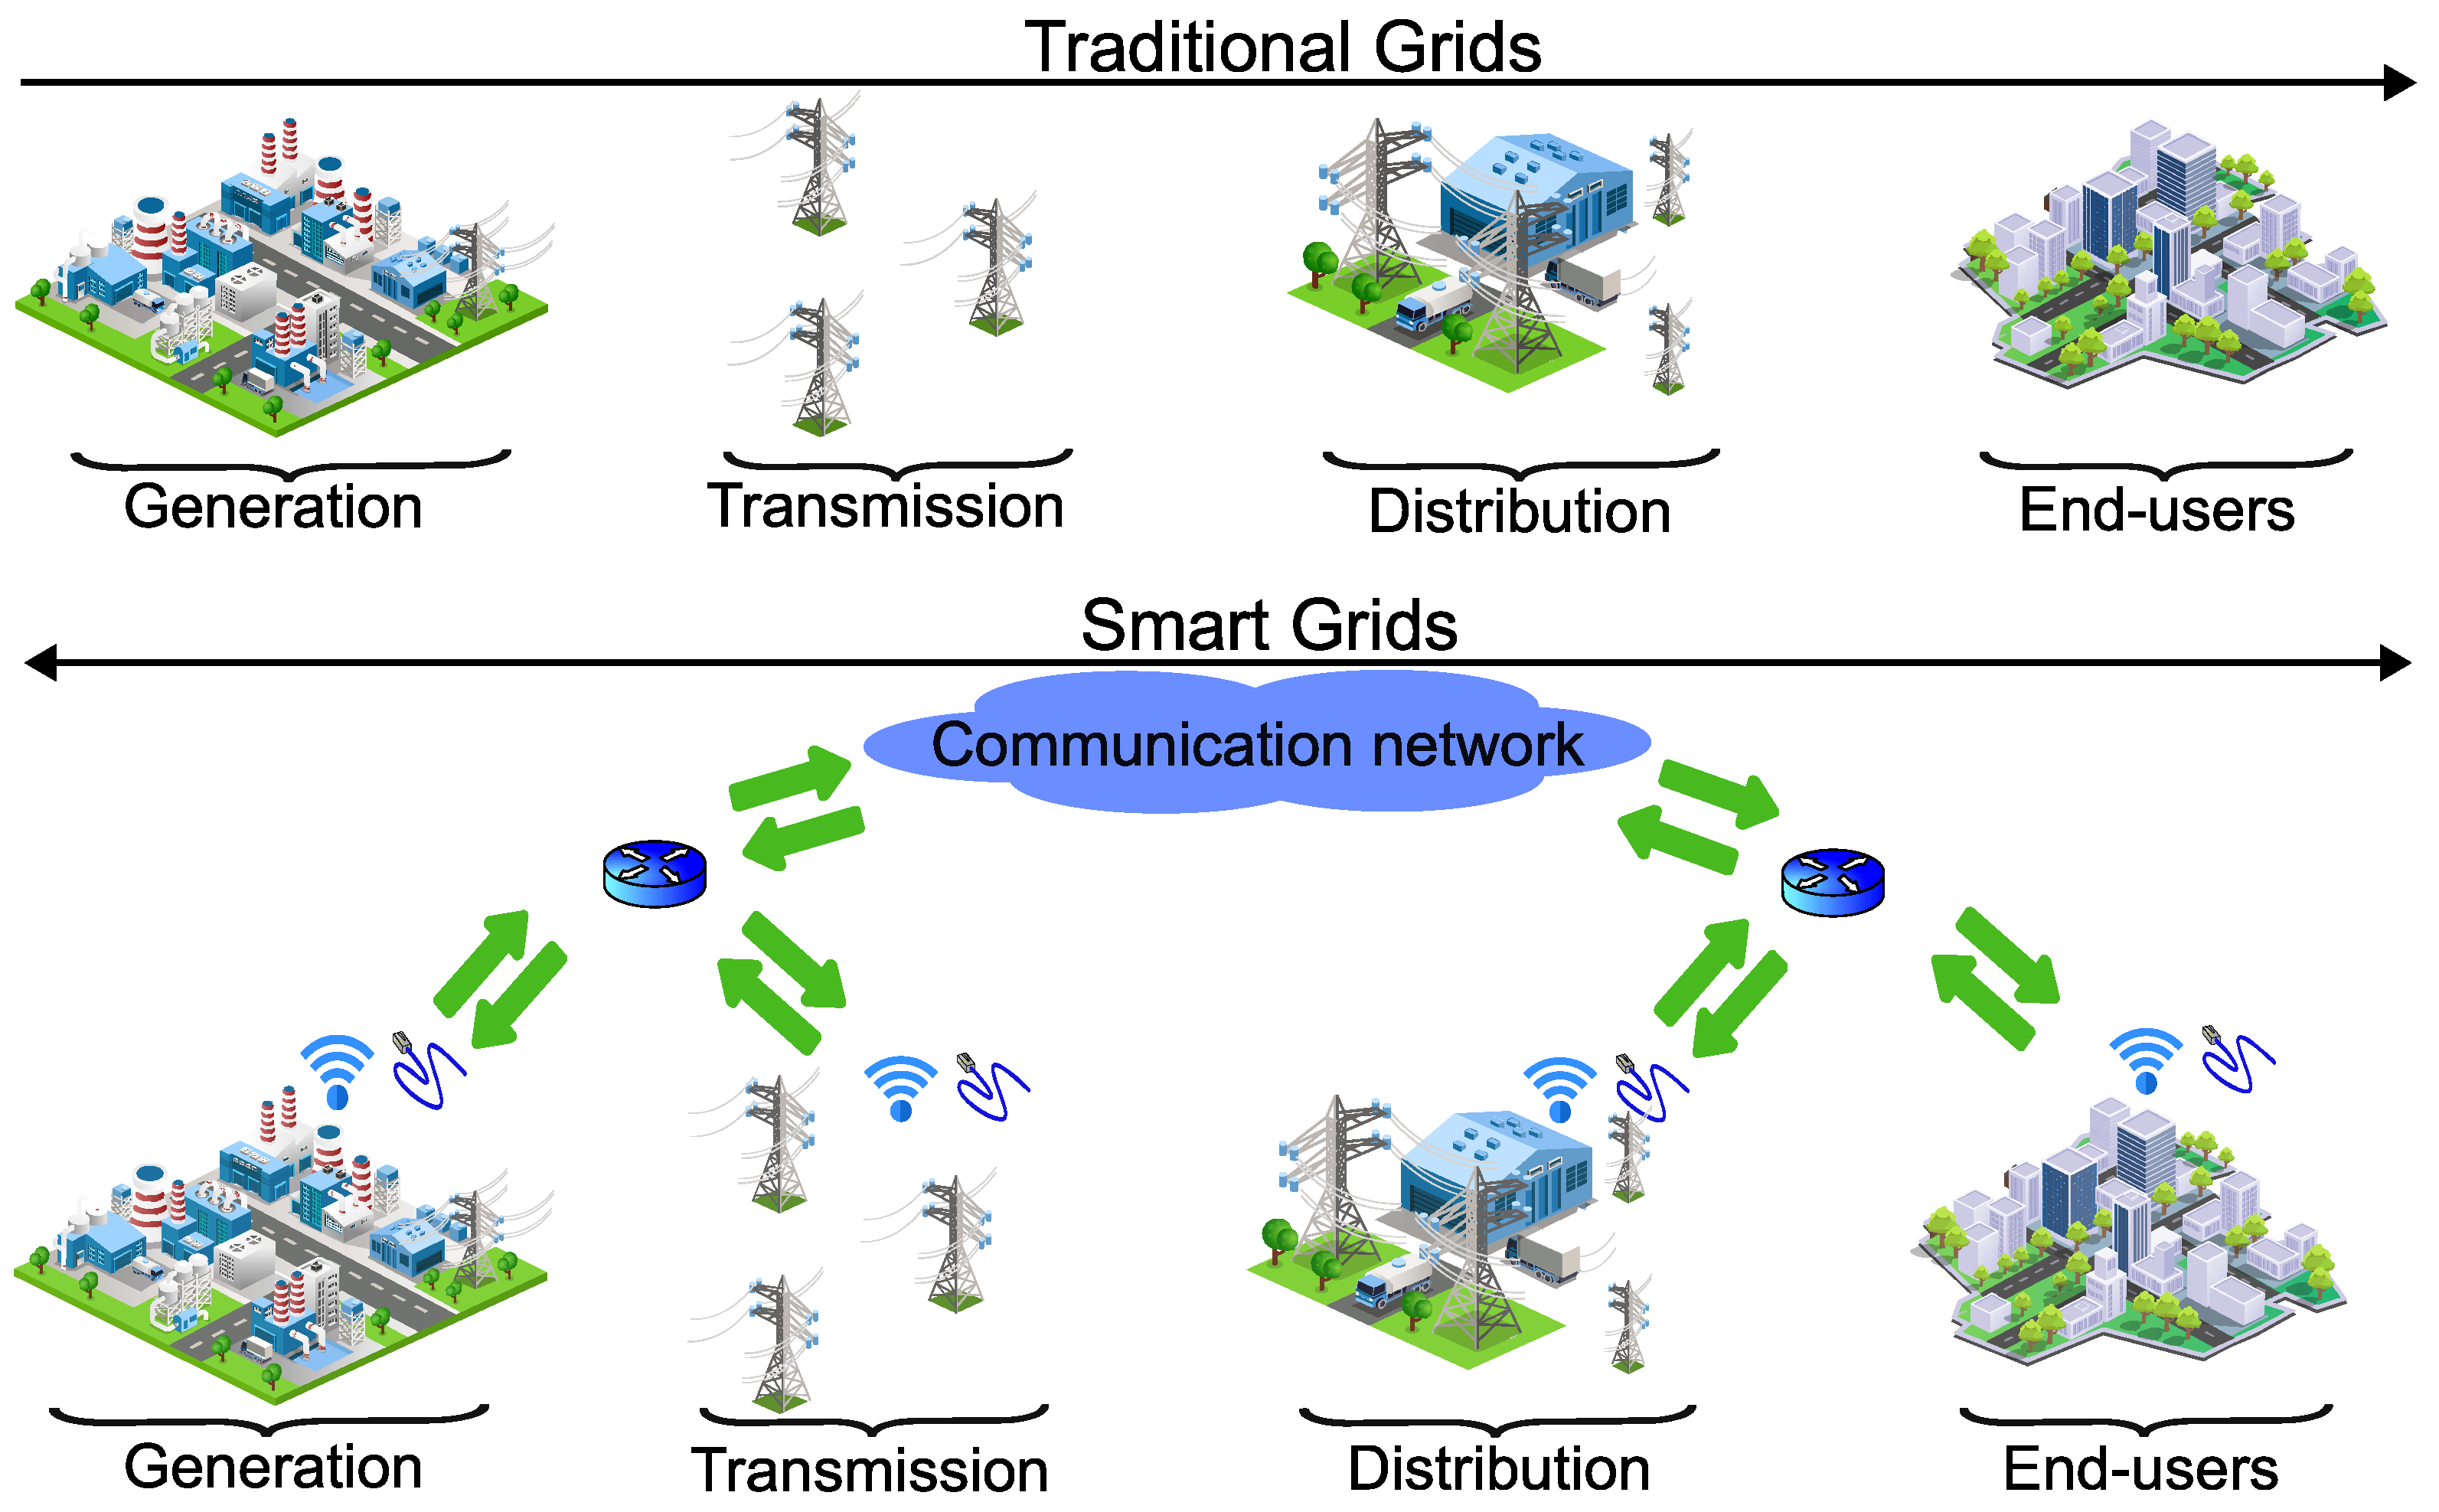
1. Introduction
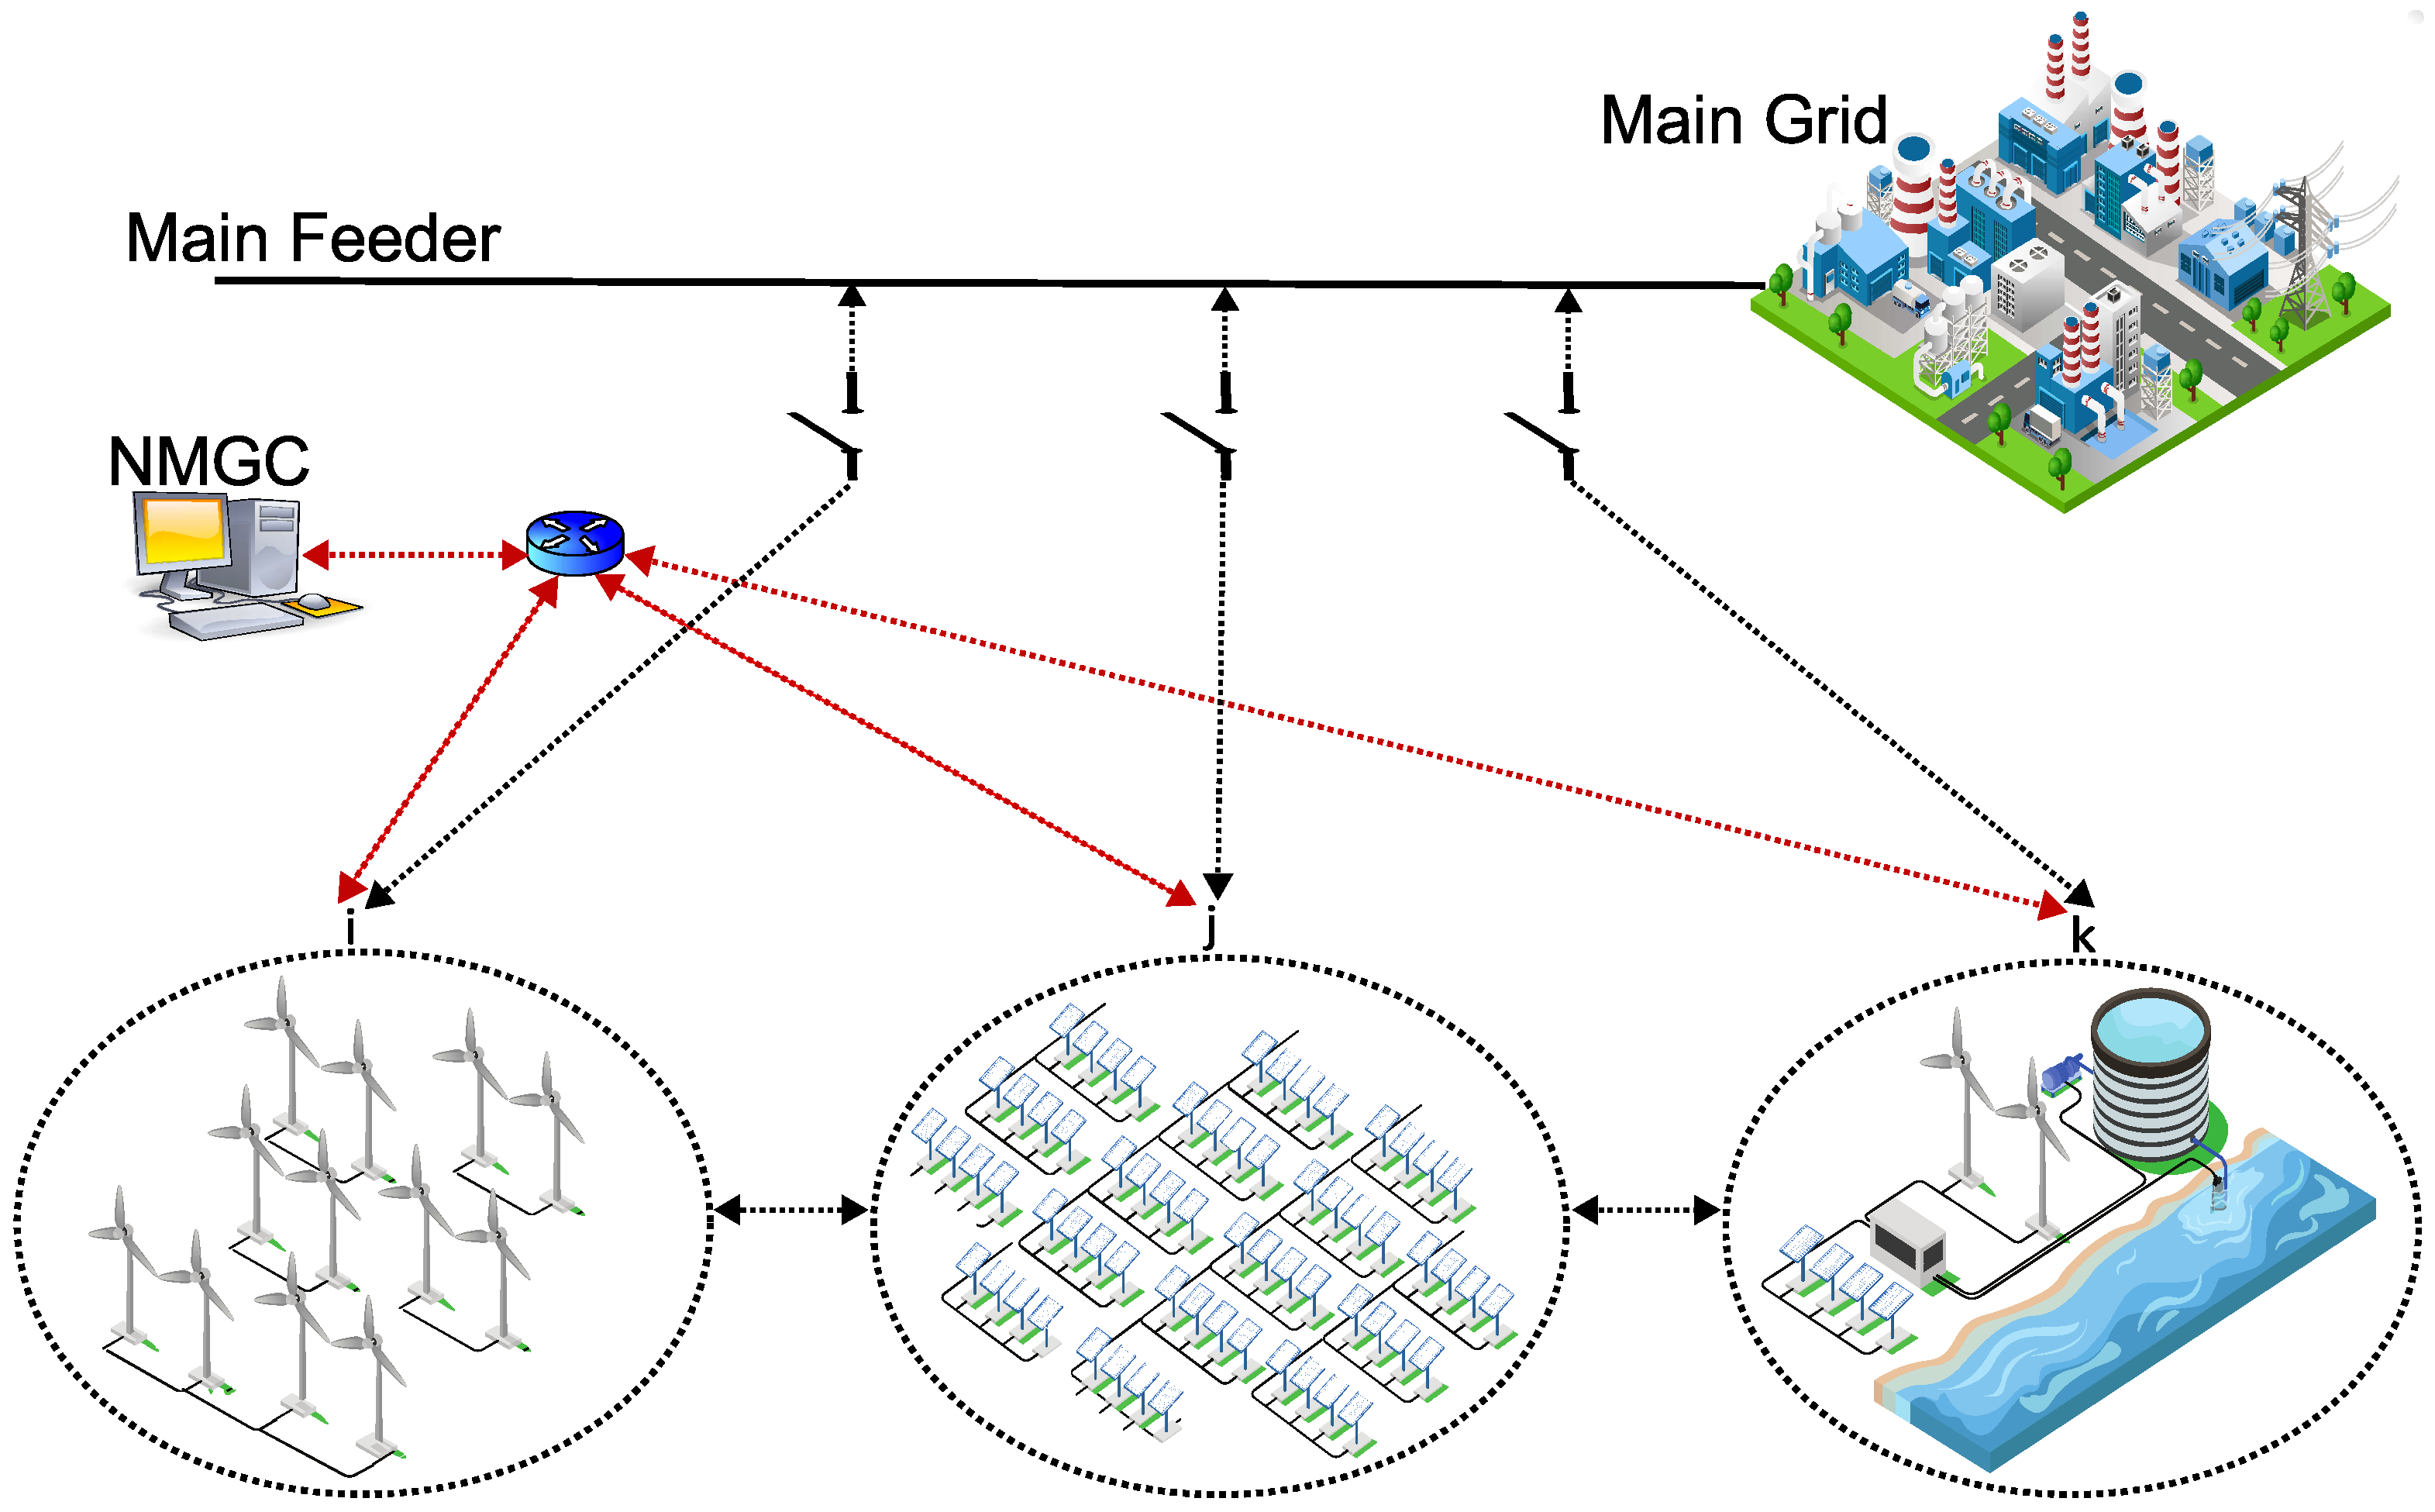
2. NMG Classification
3. QoD Measurement for NMGs

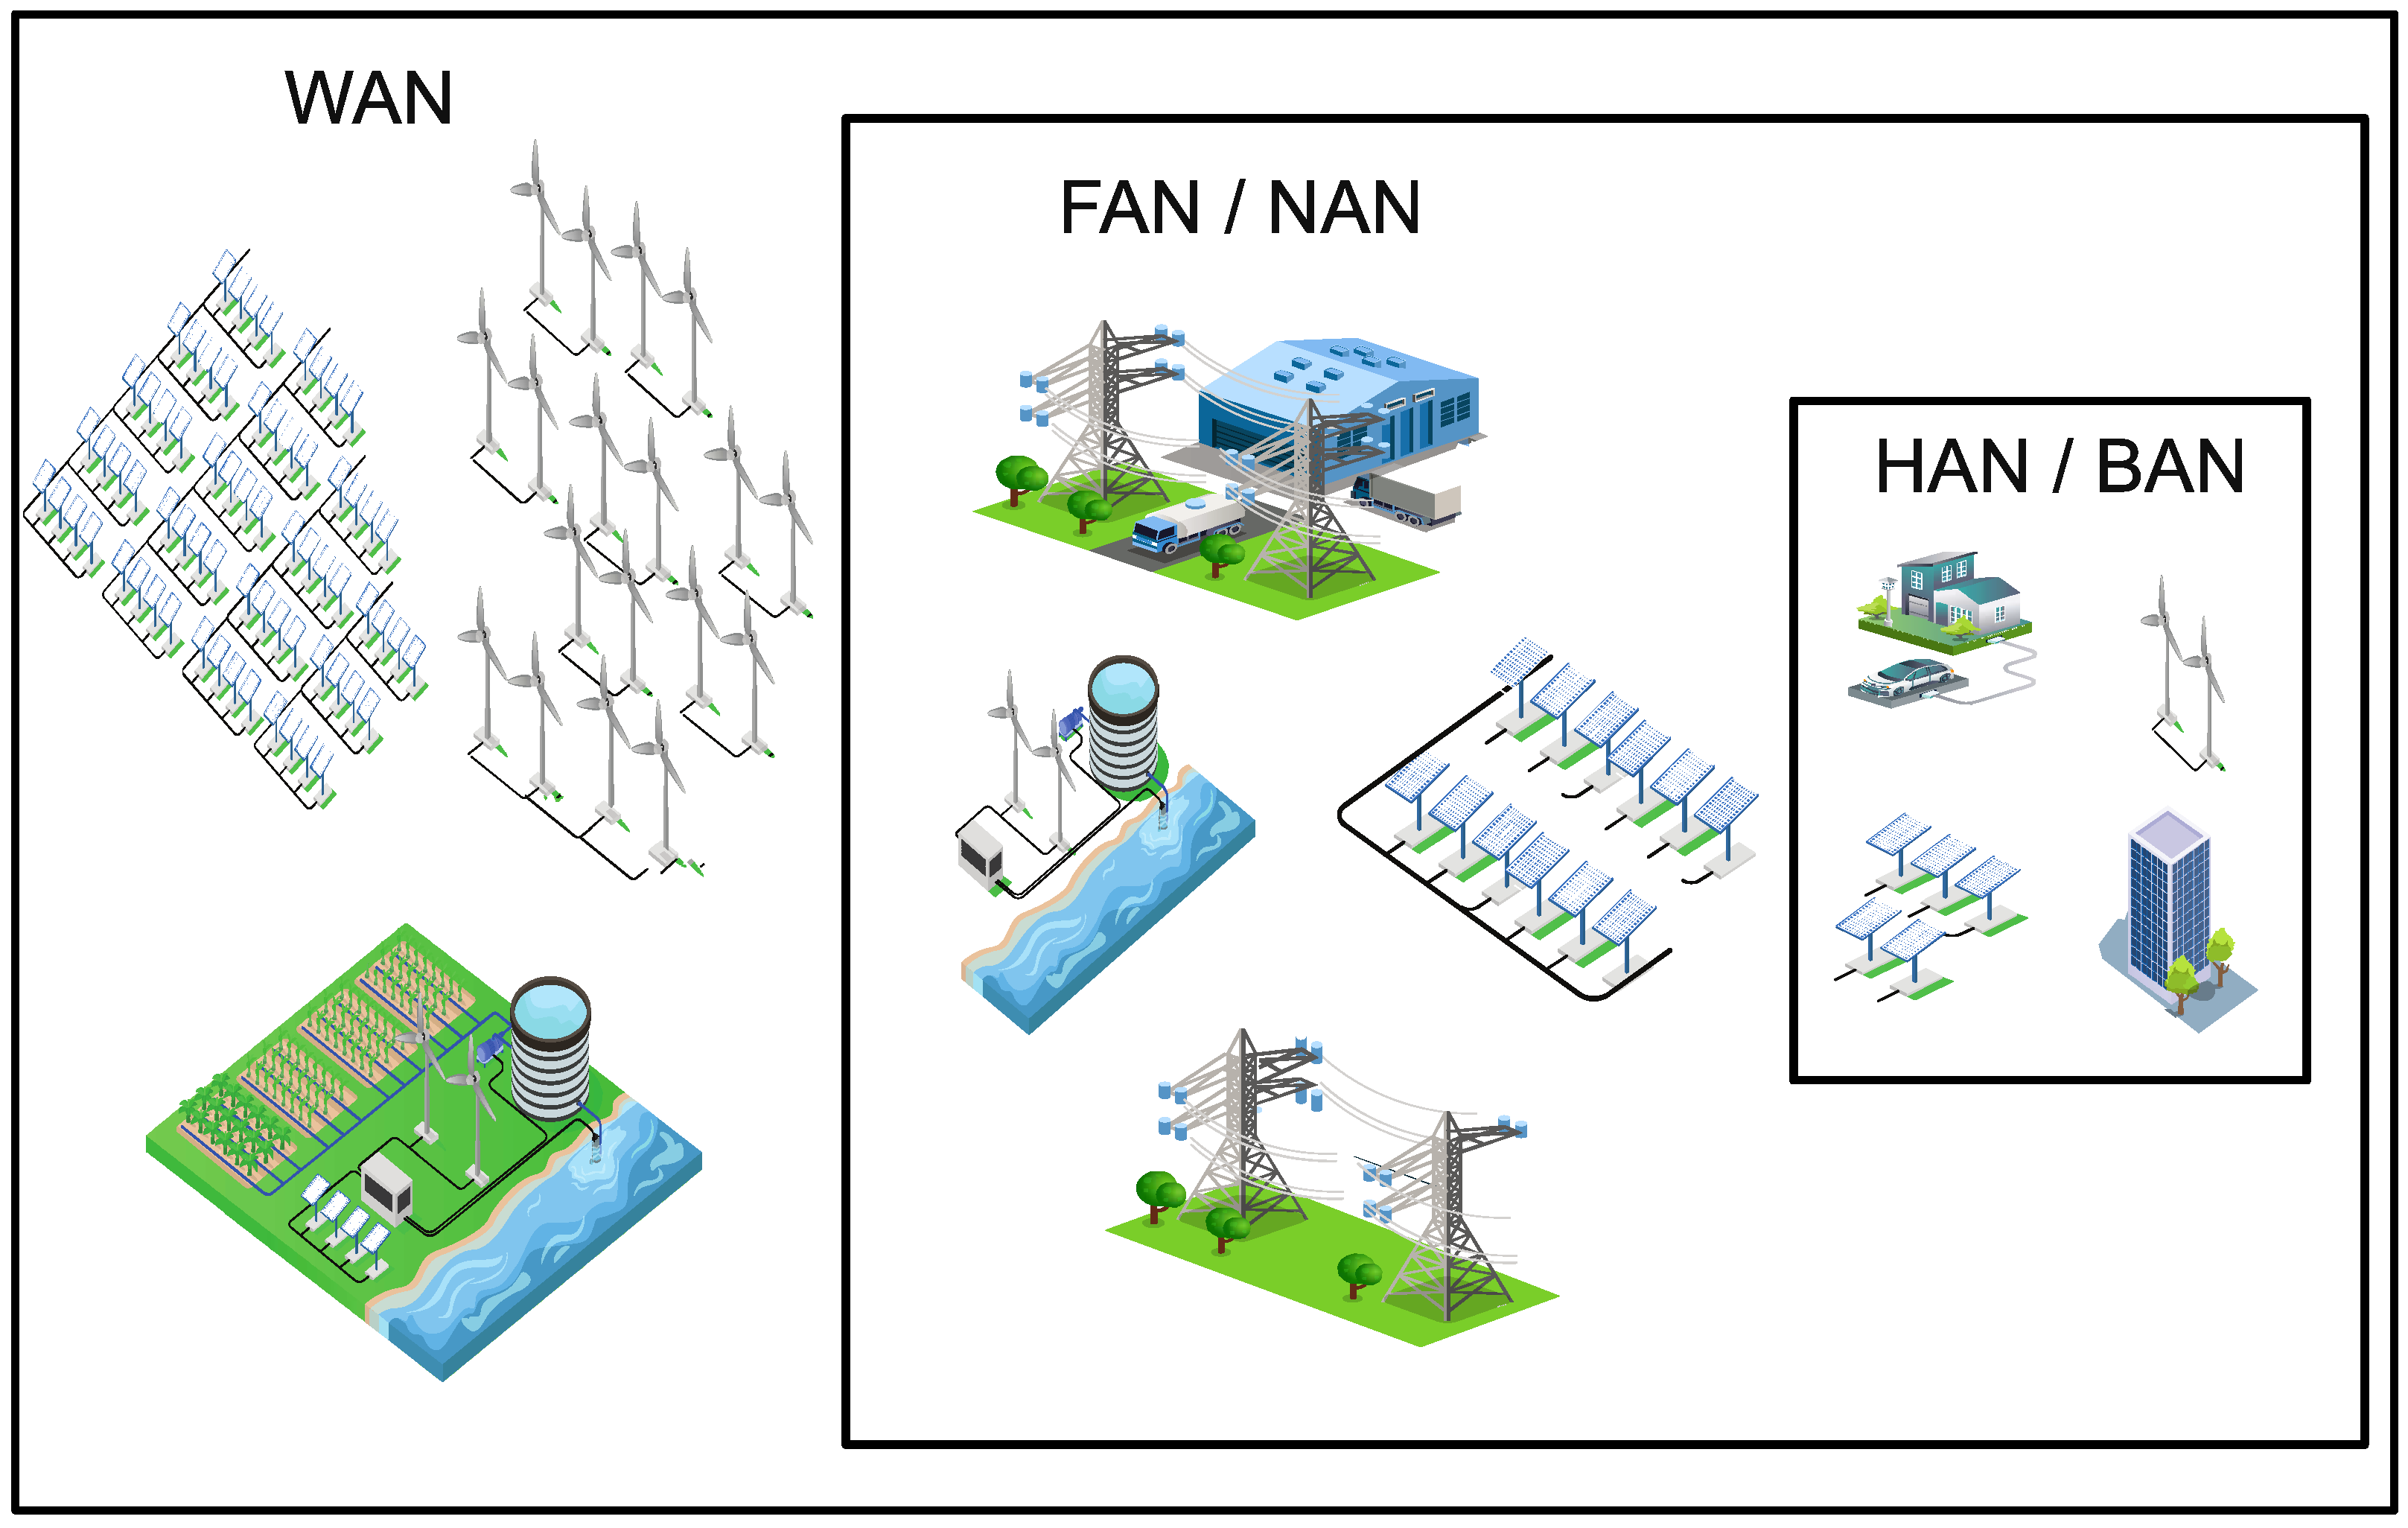
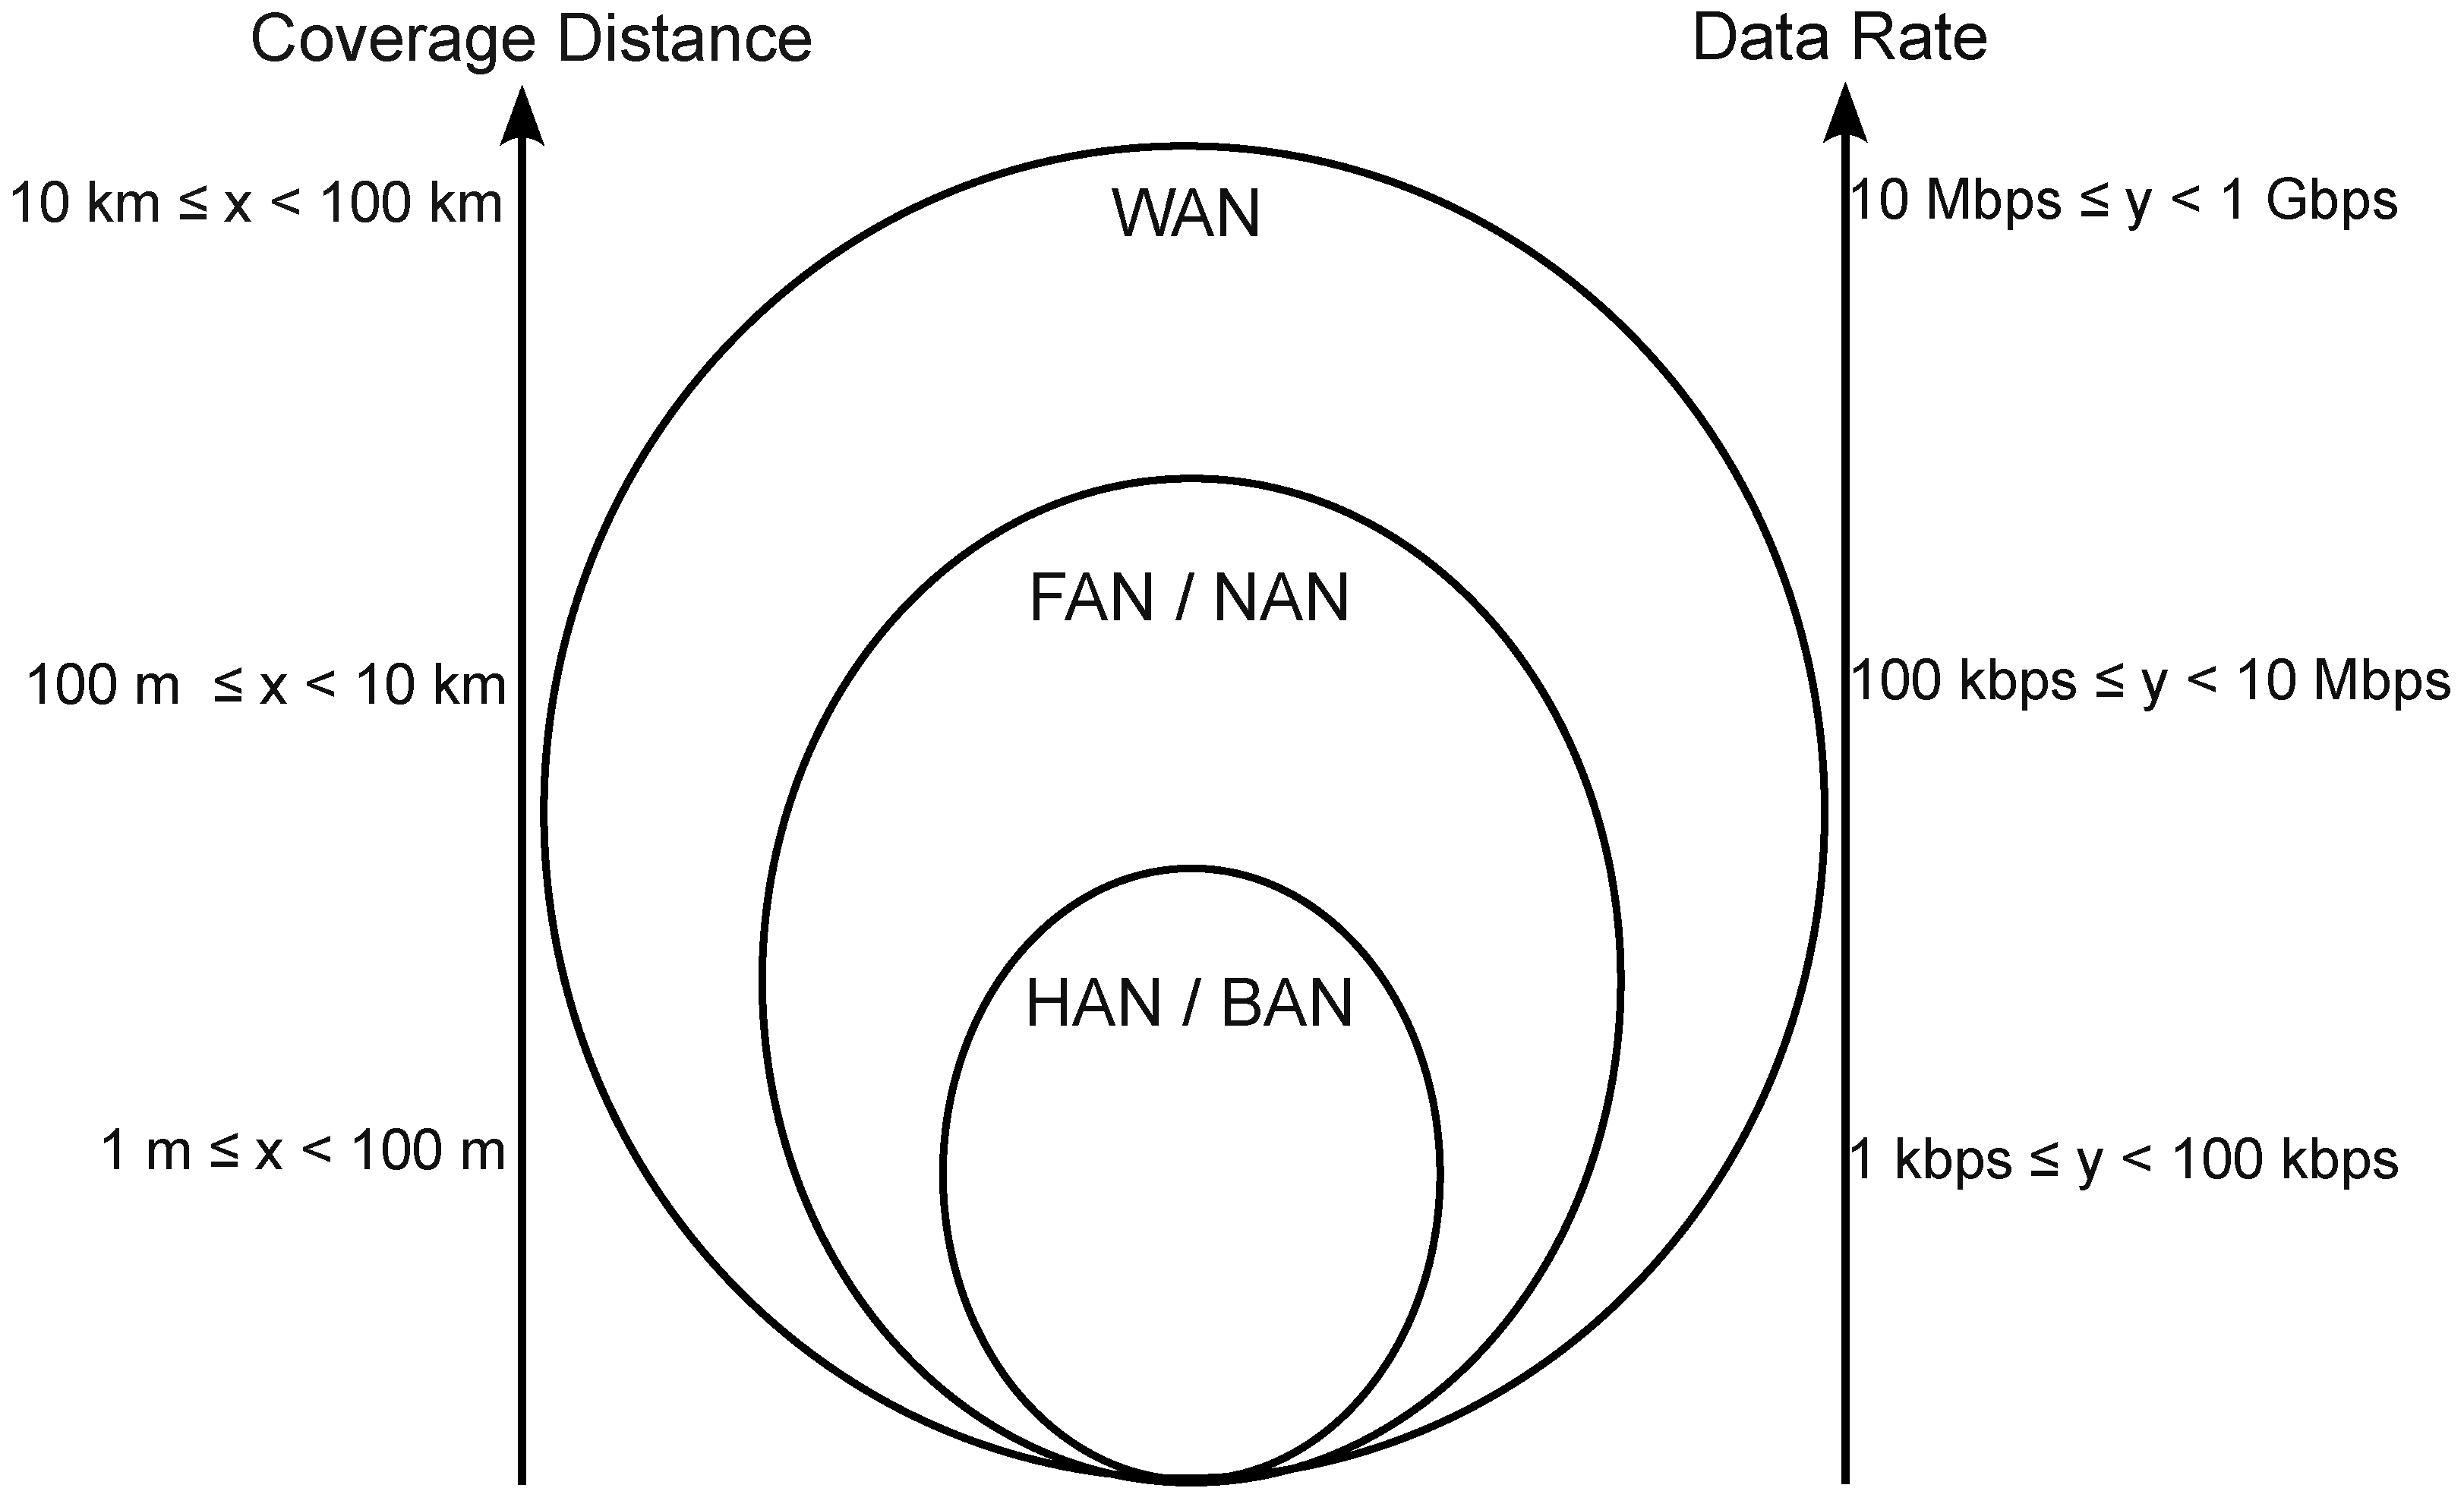
4. Communication Networks and Technologies in NMGs
5. Designing an NMG Testbed and Numerical Results
6. Future Work and Open Challenges
7. Conclusions
Author Contributions
Funding
Institutional Review Board Statement
Informed Consent Statement
Data Availability Statement
Acknowledgments
Conflicts of Interest
Abbreviations
| NMG | Networked Microgrids |
| QoD | Quality of Delivery |
| TG | Traditional Grids |
| SG | Smart Grids |
| DER | Distributed Energy Resources |
| NMGC | Networked Microgrid Controller |
| AMI | Advanced Smart Metering Infrastructure |
| V2G | Vehicle-to-Grid |
| EV | Electric Vehicles |
| PV | Photovoltaic |
| RTT | Round Trip Time |
| ACK | Acknowledgment |
| AC | Alternating Current |
| DC | Direct Current |
| MW | Megawatt |
| WAN | Wide Area Network |
| FAN | Field Area Network |
| NAN | Neighbourhood Area Network |
| HAN | Home Area Network |
| BAN | Building Area Network |
| ESBN | Electricity Supply Board Networks |
| VS | Video-Streaming |
| ISR | Integrated Services Routers |
| NTP | Network Time Protocol |
| ADC | Analog-to-Digital Converter |
| IED | Intelligent Electronic Devices |
| ETSI | European Telecommunications Standards Institute |
| IEC | International Electrotechnical Commission |
| FPS | Frames-Per-Second |
| TCP | Transmission Control Protocol |
| UDP | User Datagram Protocol |
| RTSP | Real Time Streaming Protocol |
| ICMP | Internet Control Message Protocol |
| SDN | Software Defined Networking |
| ML | Machine Learning |
| RNN | Recurrent Neural Network |
| ECN | Explicit Congestion Notification |
| DT | Decision Trees |
| RF | Random Forests |
| CNN | Convolutional Neural Network |
| P2P | Peer-to-Peer |
| LDES | Long-Duration Energy Storage |
References
- Liu, Z.; Zhang, Y.; Wang, Y.; Wei, N.; Gu, C. Development of the interconnected power grid in Europe and suggestions for the energy internet in China. Glob. Energy Interconnect. 2020, 3, 111–119. [Google Scholar] [CrossRef]
- Farhangi, H. The path of the smart grid. IEEE Power Energy Mag. 2010, 8, 18–28. [Google Scholar] [CrossRef]
- Ahmad, A.; Alam, M.S.; Chabaan, R. A Comprehensive Review of Wireless Charging Technologies for Electric Vehicles. IEEE Trans. Transp. Electrif. 2018, 4, 38–63. [Google Scholar] [CrossRef]
- Mutua, A.M.; de Fréin, R. Sustainable Mobility: Machine Learning-Driven Deployment of EV Charging Points in Dublin. Sustainability 2024, 16, 9950. [Google Scholar] [CrossRef]
- Dileep, G. A survey on smart grid technologies and applications. Renew. Energy 2020, 146, 2589–2625. [Google Scholar] [CrossRef]
- IEEE Std 2030.7-2017; IEEE Standard for the Specification of Microgrid Controllers. IEEE: Piscataway, NJ, USA, 2018; pp. 1–43. [CrossRef]
- EPRI. Program on Technology Innovation: Microgrid Implementations: Literature Review; 3002007384 Technical Report; EPRI: Palo Alto, CA, USA, 2016. [Google Scholar]
- Rehmani, M.H.; Reisslein, M.; Rachedi, A.; Erol-Kantarci, M.; Radenkovic, M. Integrating Renewable Energy Resources into the Smart Grid: Recent Developments in Information and Communication Technologies. IEEE Trans. Ind. Inform. 2018, 14, 2814–2825. [Google Scholar] [CrossRef]
- Tightiz, L.; Yang, H. A Comprehensive Review on IoT Protocols’ Features in Smart Grid Communication. Energies 2020, 13, 2762. [Google Scholar] [CrossRef]
- Faheem, M.; Shah, S.; Butt, R.; Raza, B.; Anwar, M.; Ashraf, M.; Ngadi, M.; Gungor, V. Smart grid communication and information technologies in the perspective of Industry 4.0: Opportunities and challenges. Comput. Sci. Rev. 2018, 30, 1–30. [Google Scholar] [CrossRef]
- Norouzi, F.; Hoppe, T.; Elizondo, L.R.; Bauer, P. A review of socio-technical barriers to Smart Microgrid development. Renew. Sustain. Energy Rev. 2022, 167, 112674. [Google Scholar] [CrossRef]
- Zeinali, M.; Thompson, J. Comprehensive practical evaluation of wired and wireless internet base smart grid communication. IET Smart Grid 2021, 4, 522–535. [Google Scholar] [CrossRef]
- Eltamaly, A.M.; Ahmed, M.A. Performance Evaluation of Communication Infrastructure for Peer-to-Peer Energy Trading in Community Microgrids. Energies 2023, 16, 5116. [Google Scholar] [CrossRef]
- Nunes, B.A.A.; Veenstra, K.; Ballenthin, W.; Lukin, S.M.; Obraczka, K. A machine learning framework for TCP round-trip time estimation. EURASIP J. Wirel. Commun. Netw. 2014, 2014, 47. [Google Scholar] [CrossRef]
- Emir Kutlu, Y.; de Fréin, R.; Basu, M.; Malik, A. Integrated DC Microgrid Testbed for QoS Evaluation. In Proceedings of the Joint European Conference on Networks and Communications & 6G Summit (EuCNC/6G Summit), Antwerp, Belgium, 3–6 June 2023; pp. 1–2. [Google Scholar] [CrossRef]
- Harmon, E.; Ozgur, U.; Cintuglu, M.H.; de Azevedo, R.; Akkaya, K.; Mohammed, O.A. The Internet of Microgrids: A Cloud-Based Framework for Wide Area Networked Microgrids. IEEE Trans. Ind. Inform. 2018, 14, 1262–1274. [Google Scholar] [CrossRef]
- Ahmed, M.; Meegahapola, L.; Vahidnia, A.; Datta, M. Stability and Control Aspects of Microgrid Architectures—A Comprehensive Review. IEEE Access 2020, 8, 144730–144766. [Google Scholar] [CrossRef]
- Hamidieh, M.; Ghassemi, M. Microgrids and Resilience: A Review. IEEE Access 2022, 10, 106059–106080. [Google Scholar] [CrossRef]
- Suhaimy, N.; Radzi, N.A.M.; Ahmad, W.S.H.M.W.; Azmi, K.H.M.; Hannan, M.A. Current and Future Communication Solutions for Smart Grids: A Review. IEEE Access 2022, 10, 43639–43668. [Google Scholar] [CrossRef]
- Uddin, M.; Mo, H.; Dong, D.; Elsawah, S.; Zhu, J.; Guerrero, J.M. Microgrids: A review, outstanding issues and future trends. Energy Strategy Rev. 2023, 49, 101127. [Google Scholar] [CrossRef]
- Ali, O.; Aghmadi, A.; Mohammed, O.A. Performance evaluation of communication networks for networked microgrids. E-Prime-Adv. Electr. Eng. Electron. Energy 2024, 8, 100521. [Google Scholar] [CrossRef]
- Cao, G.; Gu, W.; Gu, C.; Sheng, W.; Pan, J.; Li, R.; Sun, L. Real-time cyber−physical system co-simulation testbed for microgrids control. IET Cyber-Phys. Syst. Theory Appl. 2019, 4, 38–45. [Google Scholar] [CrossRef]
- Bhattarai, B.; Marinovici, L.; Touhiduzzaman, M.; Tuffner, F.; Schneider, K.; Xie, J.; Mana, P.; Du, W.; Fisher, A. Studying Impacts of Communication System Performance on Dynamic Stability of Networked Microgrid. IET Smart Grid 2020, 3, 667–676. [Google Scholar] [CrossRef]
- Serban, I.; Céspedes, S.; Marinescu, C.; Azurdia-Meza, C.A.; Gómez, J.S.; Hueichapan, D.S. Communication Requirements in Microgrids: A Practical Survey. IEEE Access 2020, 8, 47694–47712. [Google Scholar] [CrossRef]
- Paulo, V.S.C.; de Oro Arenas, L.; Alonso, A.M.S. Communication Latency Assessment for an Interoperability Interface Prototype Applied to Power Converters in Laboratory Microgrids. In Proceedings of the 2023 Workshop on Communication Networks and Power Systems (WCNPS), Brasilia, Brazil, 30 November–1 December 2023; pp. 1–6. [Google Scholar] [CrossRef]
- Sengupta, S.; Yadav, V.K.; Saraf, Y.; Gupta, H.; Ganguly, N.; Chakraborty, S.; De, P. MoViDiff: Enabling service differentiation for mobile video apps. In Proceedings of the 2017 IFIP/IEEE Symposium on Integrated Network and Service Management (IM), Lisbon, Portugal, 8–12 May 2017; pp. 537–543. [Google Scholar] [CrossRef]
- Kutlu, Y.; de Fréin, R.; Basu, M.; Malik, A. Round Trip Time Measurement over Microgrid Power Network. In Proceedings of the 2023 IEEE 34th Irish Signals and Systems Conference (ISSC), Dublin, Ireland, 13–14 June 2023; pp. 1–6. [Google Scholar] [CrossRef]
- Ren, L.; Qin, Y.; Wang, B.; Zhang, P.; Luh, P.B.; Jin, R. Enabling Resilient Microgrid Through Programmable Network. IEEE Trans. Smart Grid 2017, 8, 2826–2836. [Google Scholar] [CrossRef]
- Kuzlu, M.; Pipattanasomporn, M.; Rahman, S. Communication network requirements for major smart grid applications in HAN, NAN and WAN. Comput. Netw. 2014, 67, 74–88. [Google Scholar] [CrossRef]
- Abrahamsen, F.E.; Ai, Y.; Cheffena, M. Communication Technologies for Smart Grid: A Comprehensive Survey. Sensors 2021, 21, 8087. [Google Scholar] [CrossRef] [PubMed]
- Shaukat, N.; Ali, S.; Mehmood, C.; Khan, B.; Jawad, M.; Farid, U.; Ullah, Z.; Anwar, S.; Majid, M. A survey on consumers empowerment, communication technologies, and renewable generation penetration within Smart Grid. Renew. Sustain. Energy Rev. 2018, 81, 1453–1475. [Google Scholar] [CrossRef]
- Ghorbanian, M.; Dolatabadi, S.H.; Masjedi, M.; Siano, P. Communication in Smart Grids: A Comprehensive Review on the Existing and Future Communication and Information Infrastructures. IEEE Syst. J. 2019, 13, 4001–4014. [Google Scholar] [CrossRef]
- De Almeida, L.F.F.; Santos, J.R.D.; Pereira, L.A.M.; Sodré, A.C.; Mendes, L.L.; Rodrigues, J.J.P.C.; Rabelo, R.A.L.; Alberti, A.M. Control Networks and Smart Grid Teleprotection: Key Aspects, Technologies, Protocols, and Case-Studies. IEEE Access 2020, 8, 174049–174079. [Google Scholar] [CrossRef]
- Saleem, Y.; Crespi, N.; Rehmani, M.H.; Copeland, R. Internet of Things-Aided Smart Grid: Technologies, Architectures, Applications, Prototypes, and Future Research Directions. IEEE Access 2019, 7, 62962–63003. [Google Scholar] [CrossRef]
- Raza, U.; Kulkarni, P.; Sooriyabandara, M. Low Power Wide Area Networks: An Overview. IEEE Commun. Surv. Tutor. 2017, 19, 855–873. [Google Scholar] [CrossRef]
- Schneider Electric. Schneider Electric Helps Make an Ambitious Microgrid Campus Project; Technical Report; Schneider Electric, IMT–Grenoble: Rueil Malmaison, France, 2021. [Google Scholar]
- Morozumi, S. Overview of Micro-grid Research and Development in Japan. In Micro-Grid Symposium in Nagoya; The New Energy and Industrial Technology Development Organization (NEDO): Tokyo, Japan, 2007. [Google Scholar]
- Steca Elektronik GmbH. Communication Between Components in Mini-Grids Recommendations for Communication System Needs for PV Hybrid Mini-Grid Systems; Technical Report; International Energy Agency (IEA): Paris, France, 2011. [Google Scholar]
- Ton, D.; Smith, M.A. The U.S. Department of Energy’s Microgrid Initiative. Electr. J. 2012, 25, 84–94. [Google Scholar] [CrossRef]
- Ashton, S.R. Smart Energy Isles, Closedown Report; Technical Report; Western Power Distribution: Derbyshire, UK, 2021. [Google Scholar]
- Hitachi Europe Limited. Isles of Scilly, UK—Smart Energy Islands, Presentation; Technical Report; Hitachi Europe Limited, Stoke Poges: Buckinghamshire, UK, 2018. [Google Scholar]
- Schneider Electric, USA. Fairfield’s Innovative Public Safety Microgrid; Technical Report; European Commission and EU-SYSFLEX Consortium, Boston ONE Campus: Andover, MA, USA, 2016. [Google Scholar]
- Pabst, P.; Chen, H.K. Synchronized Measurements in Distribution Systems; Technical Report; ComEd, An Exelon Company: Oakbrook Terrace, IL, USA, 2021. [Google Scholar]
- Lu, X.; Bahramirad, S.; Wang, J.; Chen, C. Bronzeville Community Microgrids: A Reliable, Resilient and Sustainable Solution for Integrated Energy Management with Distribution Systems. Electr. J. 2015, 28, 29–42. [Google Scholar] [CrossRef]
- Couraud, B.; Andoni, M.; Robu, V.; Norbu, S.; Chen, S.; Flynn, D. Responsive FLEXibility: A smart local energy system. Renew. Sustain. Energy Rev. 2023, 182, 113343. [Google Scholar] [CrossRef]
- UKRI. Smart Local Energy Systems: The Energy Revolution Takes Shape; Technical Report; United Kingdom Research and Innovation, Polaris House: Swindon, UK, 2022.
- Dixon, D. Operation and Integration Considerations for Distinct Qualifier Trial Providing Units of System Services; Technical Report; European Commission and EU-SYSFLEX Consortium, EirGrid, the Oval: Ballsbridge, Dublin, Ireland, 2021. [Google Scholar]
- Peter Asmus, M.K. Horizon Power: A Case Study on Integrating Customer DER, Moving the Needle on Utility DERMS Innovation in Australia; Technical Report; Guidehouse Inc.: Mc Lean, VA, USA, 2021. [Google Scholar]
- Smarter Grid Solutions. Strate Grid Next-Generation Utility Derms Combining Grid and Market Management with Real-Time Control; Technical Report; Mitsubishi: Glasgow, UK, 2023. [Google Scholar]
- Smarter Grid Solutions. Cirrus Flex Aggregated Control of Distributed Energy Resources for Optimized Market Participation; Technical Report; Mitsubishi: Glasgow, UK, 2023. [Google Scholar]
- Siemens GridEdge. SICAM GridEdge Engineering Guide; Technical Report; Siemens AG, Smart Infrastructure Digital Grid: Nuremberg, Germany, 2023. [Google Scholar]
- Siemens SICAM8. SICAM 8 Series Core Functions and Hardware; Technical Report; Siemens AG, Smart Infrastructure Digital Grid: Nuremberg, Germany, 2024. [Google Scholar]
- Reddy, G.P.; Kumar, Y.V.P.; Chakravarthi, M.K. Communication Technologies for Interoperable Smart Microgrids in Urban Energy Community: A Broad Review of the State of the Art, Challenges, and Research Perspectives. Sensors 2022, 22, 5881. [Google Scholar] [CrossRef] [PubMed]
- Saleh, M.; Esa, Y.; Hariri, M.E.; Mohamed, A. Impact of Information and Communication Technology Limitations on Microgrid Operation. Energies 2019, 12, 2926. [Google Scholar] [CrossRef]
- Chhaya, L.; Sharma, P.; Kumar, A.; Bhagwatikar, G. IoT-Based Implementation of Field Area Network Using Smart Grid Communication Infrastructure. Smart Cities 2018, 1, 176–189. [Google Scholar] [CrossRef]
- Liu, X.; Chen, B.; Chen, C.; Jin, D. Electric power grid resilience with interdependencies between power and communication networks—A review. IET Smart Grid 2020, 3, 182–193. [Google Scholar] [CrossRef]
- Kumar, P.; Gurtov, A.; Sain, M.; Martin, A.; Ha, P.H. Lightweight Authentication and Key Agreement for Smart Metering in Smart Energy Networks. IEEE Trans. Smart Grid 2019, 10, 4349–4359. [Google Scholar] [CrossRef]
- Ghosal, A.; Conti, M. Key Management Systems for Smart Grid Advanced Metering Infrastructure: A Survey. IEEE Commun. Surv. Tutor. 2019, 21, 2831–2848. [Google Scholar] [CrossRef]
- Kumar, P.; Lin, Y.; Bai, G.; Paverd, A.; Dong, J.S.; Martin, A. Smart Grid Metering Networks: A Survey on Security, Privacy and Open Research Issues. IEEE Commun. Surv. Tutor. 2019, 21, 2886–2927. [Google Scholar] [CrossRef]
- Geaney, C. The Dingle Electirification Project: Customer Flexibility Trial; Technical Report; Electricity Supply Board Networks (ESBN), ESB Head Office: Dublin, Ireland, 2022. [Google Scholar]
- Saleh, M.; Esa, Y.; Mohamed, A. Impact of Communication Latency on the Bus Voltage of Centrally Controlled DC Microgrids During Islanding. IEEE Trans. Sustain. Energy 2019, 10, 1844–1856. [Google Scholar] [CrossRef]
- Tanenbaum, A.S.; Wetherall, D.J. Computer Networks, 5th ed.; Prentice Hall Press: Hoboken, NJ, USA, 2010. [Google Scholar]
- Apple. Find Movies with 4K, HDR, Dolby Vision, or Dolby Atmos in the Apple TV App. Available online: https://support.apple.com/en-us/119599#connection (accessed on 13 February 2025).
- VideoLAN, Organisation. VLC Product Website. Available online: https://www.videolan.org/ (accessed on 7 April 2025).
- WinDump. WinDump (2018)—Home. Available online: https://www.winpcap.org/windump/ (accessed on 4 April 2025).
- ETSI. Machine-to-Machine Communications (M2M); Applicability of M2M Architecture to Smart Grid Networks; Impact of Smart Grids on M2M Platform; Technical Report ETSI TR 102 935 V2.1.1; ETSI: Sophia Antipolis, France, 2012. [Google Scholar]
- Marzal, S.; Salas, R.; González-Medina, R.; Garcerá, G.; Figueres, E. Current challenges and future trends in the field of communication architectures for microgrids. Renew. Sustain. Energy Rev. 2018, 82, 3610–3622. [Google Scholar] [CrossRef]
- ETSI TR 102 935. Available online: https://www.etsi.org/deliver/etsi_tr/102900_102999/102935/02.01.01_60/tr_102935v020101p.pdf (accessed on 7 April 2025).
- IEC 61850. Available online: https://iec61850.dvl.iec.ch/ (accessed on 7 April 2025).
- Khalil, A.; Rajab, Z.; Alfergani, A.; Mohamed, O. The impact of the time delay on the load frequency control system in microgrid with plug-in-electric vehicles. Sustain. Cities Soc. 2017, 35, 365–377. [Google Scholar] [CrossRef]
- Mirkovic, D.; Armitage, G.; Branch, P. A Survey of Round Trip Time Prediction Systems. IEEE Commun. Surv. Tutor. 2018, 20, 1758–1776. [Google Scholar] [CrossRef]
- Ahmed, A.H.; Hicks, S.; Riegler, M.A.; Elmokashfi, A. Predicting High Delays in Mobile Broadband Networks. IEEE Access 2021, 9, 168999–169013. [Google Scholar] [CrossRef]
- Dong, A.; Du, Z.; Yan, Z. Round Trip Time Prediction Using Recurrent Neural Networks With Minimal Gated Unit. IEEE Commun. Lett. 2019, 23, 584–587. [Google Scholar] [CrossRef]
- Zinno, S.; Affinito, A.; Pasquino, N.; Ventre, G.; Botta, A. Prediction of RTT Through Radio-Layer Parameters in 4G/5G Dual-Connectivity Mobile Networks. In Proceedings of the 2023 IEEE Symposium on Computers and Communications (ISCC), Gammarth, Tunisia, 9–12 July 2023; pp. 213–218. [Google Scholar] [CrossRef]
- Welzl, M.; Islam, S.; von Stephanides, M. Real-Time TCP Packet Loss Prediction Using Machine Learning. IEEE Access 2024, 12, 159622–159634. [Google Scholar] [CrossRef]
- de Fréin, R.; Izima, O.; Malik, A. Detecting Network State in the Presence of Varying Levels of Congestion. In Proceedings of the 2021 IEEE 31st International Workshop on Machine Learning for Signal Processing (MLSP), Gold Coast, Australia, 25–28 October 2021; pp. 1–6. [Google Scholar] [CrossRef]
- Lisas, T.; de Fréin, R. Sequential Learning for Modeling Video Quality of Delivery Metrics. IEEE Access 2023, 11, 107783–107797. [Google Scholar] [CrossRef]
- Strielkowski, W.; Vlasov, A.; Selivanov, K.; Muraviev, K.; Shakhnov, V. Prospects and Challenges of the Machine Learning and Data-Driven Methods for the Predictive Analysis of Power Systems: A Review. Energies 2023, 16, 4025. [Google Scholar] [CrossRef]
- Tufail, S.; Riggs, H.; Tariq, M.; Sarwat, A.I. Advancements and Challenges in Machine Learning: A Comprehensive Review of Models, Libraries, Applications, and Algorithms. Electronics 2023, 12, 1789. [Google Scholar] [CrossRef]
- Tan, S.; Wu, Y.; Xie, P.; Guerrero, J.M.; Vasquez, J.C.; Abusorrah, A. New Challenges in the Design of Microgrid Systems: Communication Networks, Cyberattacks, and Resilience. IEEE Electrif. Mag. 2020, 8, 98–106. [Google Scholar] [CrossRef]
- Zhang, H.; Liu, B.; Wu, H. Smart Grid Cyber-Physical Attack and Defense: A Review. IEEE Access 2021, 9, 29641–29659. [Google Scholar] [CrossRef]
- Shahzad, S.; Abbasi, M.A.; Ali, H.; Iqbal, M.; Munir, R.; Kilic, H. Possibilities, Challenges, and Future Opportunities of Microgrids: A Review. Sustainability 2023, 15, 6366. [Google Scholar] [CrossRef]
- Farivar, G.G.; Manalastas, W.; Tafti, H.D.; Ceballos, S.; Sanchez-Ruiz, A.; Lovell, E.C.; Konstantinou, G.; Townsend, C.D.; Srinivasan, M.; Pou, J. Grid-Connected Energy Storage Systems: State-of-the-Art and Emerging Technologies. Proc. IEEE 2023, 111, 397–420. [Google Scholar] [CrossRef]
- ESB SIT. ESB Emerging Technology Insights 2024; Technical Report; Electricity Supply Board (ESB), ESB Head Office: Dublin, Ireland, 2024. [Google Scholar]
- Twitchell, J.; DeSomber, K.; Bhatnagar, D. Defining long duration energy storage. J. Energy Storage 2023, 60, 105787. [Google Scholar] [CrossRef]
- Saeed, M.H.; Fangzong, W.; Kalwar, B.A.; Iqbal, S. A Review on Microgrids’ Challenges & Perspectives. IEEE Access 2021, 9, 166502–166517. [Google Scholar] [CrossRef]


| Connection Type | Coverage | Data Rate | Applicability | Advantages | Disadvantages | Application |
|---|---|---|---|---|---|---|
| Wired Technologies | ||||||
| Ethernet | Up to 100 m | Up to 100 Gbps | WAN, FAN, HAN | Widely available, suitable for low coverage | Limited coverage distance | Home automation |
| Fiber-optic | Up to 60 km | Up to several Tbps | WAN, FAN | High data rate, fast transmission | More expensive than copper cables and some wireless technologies | Communication channel in generation site |
| Narrowband PLC | Up to 3 km | Up to 500 kbps | WAN, FAN, HAN | Affordable, widely available | Greater electromagnetic noise, susceptible to disruptions, low data rate | Transmission of electricity |
| Broadband PLC | Up to km | Up to 300 Mbps | WAN, FAN, HAN | Affordable, widely available | Greater electromagnetic noise, susceptible to disruptions | Transmission of electricity |
| HomePlug | Up to 200 m | Up to 10 Mbps | HAN | Affordable, energy efficient | Limited coverage distance | Home automation |
| Asymmetric Digital Subscriber Line (ADSL) | Up to 5 km | Up to 8 Mbps | HAN | Affordable, energy efficient | Limited coverage distance, low data rate | Home automation |
| 3G | Up to 75 km | Up to Mbps | WAN, FAN, HAN | Widely available, existing infrastructure | Shared network infrastructure, risk of congestion | Smart meter data collection |
| 4G | Up to 12 km | Up to 100 Mbps | WAN, FAN, HAN | Wide coverage distance, fast data transmission | Shared network infrastructure, risk of congestion | Two-way communication between smart device and control centre |
| Wireless Technologies | ||||||
| 5G | Up to 50 km | Up to 20 Gbps | WAN, FAN | High data rate and reliability, low latency | Costly infrastructure, security issues | Data exchange between MGs |
| ZigBee (IEEE 802.15.4) | Up to 100 m | Up to 250 kbps | HAN | Affordable, low complexity | Limited coverage distance, low data rate, slow processing rate | Home automation |
| Bluetooth (IEEE 802.15.1) | Up to 100 m | Up to 721 kbps | HAN | Affordable, power efficient, low complexity | Short coverage distance, low data rate, poor security | Home automation |
| LoRaWAN | Up to 15 km | Up to 50 kbps | WAN, FAN | Wide coverage distance, affordable and secure communication | Low data rate | Monitoring of electricity transmission towers |
| Wi-Fi (IEEE 802.11 b/g/n) | Up to 1 km | Up to 600 Mbps | WAN, FAN, HAN | Effective in short range, affordable | Limited coverage distance | V2G |
| Organisation | Location | Communication Technology | Scale | NMG Component(s) | Reference(s) |
|---|---|---|---|---|---|
| Schneider Electric | Grenoble, France | IoT (e.g., ZigBee) and Cloud | 450 kW | PV, micro-CHP, Battery | [36] |
| NEDO | Hachinohe, Japan | Ethernet and Fiber-optic cables | 600 kW | PV, Wind, Bio-gas, Battery | [37,38,39] |
| NEDO | Kyoto, Japan | Ethernet | 650 kW | PV, Wind, Bio-gas, Battery | [37,38,39] |
| Hitachi Europe Limited | Isles of Scilly, England | IoT (e.g., 3G), Ethernet and Cloud | 800 kW | PV and Battery | [40,41] |
| Schneider Electric | Fairfield, CT, USA | IoT (e.g., ZigBee) and Cloud | MW | PV, Fuel Cell, Natural Gas | [42] |
| Commonwealth Edison Company | Bronzeville, IL, USA | Fiber-optic cables, ZigBee | MW | PV, Bio-gas, Battery | [43,44] |
| United Kingdom Research and Innovation | Orkney, Scotland | 4G, Wi-Fi and Cloud | 8 MW | PV, Wind, Tidal, Battery | [45,46,47] |
| Horizon Power | Onslow, Australia | 4G | 11 MW | PV and Battery | [48] |
| Scottish and Southern Electricity Networks | Shetland, Scotland | IoT and Cloud | MW | Wind, Tidal and Battery | [49,50] |
| Siemens | Tampere, Finland | Ethernet, Cloud, ZigBee | 16 MW | PV, Fuel Cell, Battery | [51,52] |
Disclaimer/Publisher’s Note: The statements, opinions and data contained in all publications are solely those of the individual author(s) and contributor(s) and not of MDPI and/or the editor(s). MDPI and/or the editor(s) disclaim responsibility for any injury to people or property resulting from any ideas, methods, instructions or products referred to in the content. |
© 2025 by the authors. Licensee MDPI, Basel, Switzerland. This article is an open access article distributed under the terms and conditions of the Creative Commons Attribution (CC BY) license (https://creativecommons.org/licenses/by/4.0/).
Share and Cite
Kutlu, Y.E.; de Fréin, R. An Empirical Evaluation of Communication Technologies and Quality of Delivery Measurement in Networked MicroGrids. Sustainability 2025, 17, 4013. https://doi.org/10.3390/su17094013
Kutlu YE, de Fréin R. An Empirical Evaluation of Communication Technologies and Quality of Delivery Measurement in Networked MicroGrids. Sustainability. 2025; 17(9):4013. https://doi.org/10.3390/su17094013
Chicago/Turabian StyleKutlu, Yasin Emir, and Ruairí de Fréin. 2025. "An Empirical Evaluation of Communication Technologies and Quality of Delivery Measurement in Networked MicroGrids" Sustainability 17, no. 9: 4013. https://doi.org/10.3390/su17094013
APA StyleKutlu, Y. E., & de Fréin, R. (2025). An Empirical Evaluation of Communication Technologies and Quality of Delivery Measurement in Networked MicroGrids. Sustainability, 17(9), 4013. https://doi.org/10.3390/su17094013