Article

Estimation of Lithium-Ion Battery State of Health-Based Multi-Feature Analysis and Convolutional Neural Network–Long Short-Term Memory

1
School of Information and Electrical Engineering, Shandong Jianzhu University, Jinan 250101, China
2
School of Information Science and Engineering, Shandong Normal University, Jinan 250358, China
*
Author to whom correspondence should be addressed.
Sustainability 2025, 17(9), 4014; https://doi.org/10.3390/su17094014
Submission received: 26 February 2025 / Revised: 28 April 2025 / Accepted: 28 April 2025 / Published: 29 April 2025

Abstract

:
Accurate estimation of battery state of health (SOH) is critical to the efficient operation of energy storage battery systems. Furthermore, precise SOH estimation methods can significantly reduce resource waste by extending the battery service life and optimizing retirement strategies, which is compatible with the sustainable development of energy systems under carbon neutrality goals. Conventional methods struggle to comprehensively characterize the health degradation properties of batteries. To address that limitation, this study proposes a data-driven model based on multi-feature analysis using a hybrid convolutional neural network and long short-term memory (CNN-LSTM) architecture, which synergistically extracts multi-dimensional degradation features to enhance SOH estimation accuracy. The framework begins by systematically collecting the voltage, current, and other parameters during charge–discharge cycles to construct a temporally resolved multi-dimensional feature matrix. A correlation analysis employing Pearson correlation coefficients subsequently identifies key health indicators strongly correlated with SOH degradation. At the same time, the K-means clustering method was adopted to identify and process the outliers of CALCE data, which ensures the high quality of data and the stability of the model. Then, CNN-LSTM hybrid neural network architecture was constructed. The experimental results demonstrated that the absolute value of MBE for the dataset provided by CALCE was less than 0.2%. The MAE was less than 0.3%, and the RMSE was less than 0.4%. Furthermore, the proposed method demonstrated a strong performance on the dataset provided by NASA PCoE. The experimental results indicated that the proposed method significantly reduced the estimation error of SOH across the entire battery lifecycle, and they fully verified the superiority and engineering applicability of the algorithm in battery SOH estimation.

1. Introduction

Against the backdrop of efforts to accelerate the global energy structure’s transition toward low-carbon and cleaner directions, the rapid development of renewable energy is becoming a crucial pillar of future energy systems [1]. However, due to the intermittent and unstable nature of renewable energy sources such as wind and solar power, effectively storing and distributing electrical energy to achieve a dynamic balance between energy supply and demand has emerged as a critical challenge requiring an urgent resolution. Renowned for their exceptional energy density, extended operational durability, and optimized energy transfer efficiency, lithium-ion batteries have been widely adopted in energy storage systems, electric vehicles, and portable electronic devices, serving as a core technology driving sustainable energy development [2,3]. Nevertheless, lithium-ion batteries undergo irreversible performance degradation during prolonged use, which not only impacts the overall operational efficiency of energy storage systems but also poses safety risks. Therefore, accurately assessing the SOH of lithium-ion batteries [4,5], providing early warnings during degradation, and optimizing the operational strategies of battery management systems (BMSs) represent vital research objectives for enhancing the battery lifespan, improving energy utilization, and reducing resource waste [6].
As an important index to measure battery performance, SOH represents the energy storage and supply capacity of current batteries compared with new batteries. With the increase in battery use time, SOH will gradually decrease, becoming a key parameter to evaluate the degree of battery aging. At present, the definition of SOH is mainly divided into the following two categories [7]:
(1) Capacity definition. The decline in battery capacity is an intuitive manifestation of aging. The capacity definition characterizes SOH by the ratio of the current available capacity of the battery to the initial rated capacity, as follows:
SOH = C t C N
where Ct and CN are the current available capacity and the initial capacity of the battery, respectively.
(2) Definition of internal resistance. The increase in the internal resistance of the battery is another important feature of the aging process. The internal resistance is defined as the ratio of the current internal resistance to the initial internal resistance, used to characterize SOH by the following formula:
SOH = R end R t R end R N
where Rend represents the internal resistance when the battery reaches the end of life; Rt indicates the current internal resistance of the battery; and RN indicates the initial internal resistance of the battery. Compared with the capacity definition, although the internal resistance definition can reflect the degradation inside the battery, it is greatly affected by the external environment, and the measurement and analysis process are relatively complex. The capacity definition is widely used for its practicality and ease of operation, and this study also adopts the capacity definition as the evaluation criterion for battery SOH.
Current SOH estimation methods for batteries primarily fall into three categories: experimental methods [8,9,10], physics-based modeling [11], and data-driven approaches [12,13]. The experimental methods include the internal resistance method [8], impedance method [9], and ampere-hour integration method [10]. Experimental methods evaluate the SOH by precisely measuring key parameters such as capacity and internal resistance. While accurate, this approach typically required laboratory conditions, and it is time-consuming, costly, and unsuitable for online monitoring. Physics-based methods rely mainly on electrochemical models (EMs) [14] or equivalent circuit models (ECMs) [15]. The EM was built on the basis of electrochemical reactions and physical processes inside the battery. The EM considers the electrode reaction, ion diffusion, mass transfer, ohmic resistance, and other factors, and it can describe the behavior of the battery in detail during the charging and discharging process. Hosseininasab et al. [16] proposed an SOH estimation method based on a fractional-order electrochemical model to simultaneously estimate the internal resistance and capacity attenuation of batteries. This method reduced the calculation cost by reducing the number of calibration parameters while maintaining high accuracy. ECM simplifies the battery into a network of circuit elements such as resistors and capacitors [17,18]. In contrast, data-driven approaches eliminate the need for complex physical models by leveraging machine learning or deep learning algorithms to extract features and build predictive models from historical data. These methods effectively adapt to diverse battery operating conditions and enable online SOH estimation, thus attracting significant attention [19,20,21].
Among data-driven methods, deep learning techniques are particularly suited for analyzing complex time-series data. Ren et al. [22] proposed an SOH estimation method for battery packs based on a cross-generative adduction network (CrGAN), which effectively solved the problem of data incompleteness by introducing an adaptive enhancement algorithm and data enhancement technology. Wu et al. [23] proposed a support vector regression (SVR) method based on transfer learning, which combined a small amount of target battery data and source data to achieve an accurate estimation of the full life cycle SOH of lithium-ion batteries. In recent years, the research field of battery state estimation has ushered in an innovative method, which by organically integrating a physics-based model and data-driven model, fully taps into the complementary characteristics of the two types of models, and thus shows significant advantages in the field of SOH estimation and other state research. This method cannot only combine a profound understanding of the internal mechanism of the battery with the physical model but also makes full use of the ability of the data-driven model to deal with nonlinear relations and complex working conditions, and effectively solves the limitations of the traditional single method in data scarcity, model generalization ability, and real-time performance. Through this fusion method, researchers cannot only achieve high-precision estimation of the battery state but also better characterize the aging mechanism of batteries and multi-factor interaction, which provides important theoretical support and practical guidance for the design and optimization of an intelligent battery management system. Wang et al. [24] proposed a method based on the physical information neural network (PINN) to achieve accurate and stable estimation of the lithium-ion battery SOH by modeling battery degradation attributes and extracting short-term data features, which is suitable for different battery types and charging–discharge protocols, and performs well on large-scale datasets, with a MAPE of only 0.87%. Zhang et al. [25] proposed a data-driven approach combining physics-based electrochemical models with deep learning for lithium-ion SOH estimation, and solved the inconsistencies caused by manufacturing process differences in leveraging the initial cyclic state and physics-informed dual neural network (PIDNN) to achieve high-precision capacity decay prediction. In addition, convolutional neural networks (CNNs) have achieved remarkable success in image processing and signal analysis due to their powerful feature extraction capabilities. Long short-term memory (LSTM) networks, a specialized form of recurrent neural networks (RNNs), excel at capturing long-term dependencies in time-series data. Zheng et al. [26] introduced a hybrid architecture integrating the CNN with gated recurrent units (CNN-GRU), designed to autonomously identify critical patterns in voltage, current, and thermal data during irregular charging cycles. This methodology bypasses human-engineered feature extraction while maintaining estimation accuracy. In subsequent work, Yang et al. [27] tackled incomplete data challenges from partial discharge cycles by fusing CNN architectures with ensemble learning through random forests. Further advancements emerged in comprehensive data integration, as demonstrated by Van et al. [28], whose LSTM network leveraged multi-dimensional operational parameters including electrochemical measurements, thermal profiles, and impedance data for simultaneous SOH and internal resistance prediction. For specialized battery chemistries, Zhang et al. [29] enhanced LSTM performance in lithium–sulfur systems by incorporating incremental capacity analysis (ICA) derivatives alongside charge curve metrics, with adaptive moment estimation (Adam) optimization improving prediction robustness. Through in-depth research and systematic verification by many scholars, the hybrid neural network combining CNN and LSTM has been adopted as a suitable, efficient method for estimating the battery SOH. It can fully utilize the local feature extraction capability of the CNN and the timing modeling capability of LSTM to extract key health features from complex battery data and improve the accuracy of SOH estimation [30,31].
However, the existing SOH data-driven estimation methods still have problems such as failure to accurately select health characteristics and manage the outliers in datasets, which must be discussed and analyzed. The traditional single feature input is unlikely to fully reflect the SOH of the battery, and the introduction of too many irrelevant features may increase the complexity of the model and affect the prediction accuracy. Therefore, the challenge of extracting highly correlated health features based on battery charging and discharging data, and using the deep learning model for accurate SOH estimation, is a key factor to overcome in order to improve the intelligence level of BMSs. Therefore, a method for SOH estimation of Li-ion batteries based on multi-feature analysis and a CNN-LSTM network was proposed in this study. Firstly, Pearson’s correlation coefficient was used to analyze the correlation of the feature set, and the key health indicators that were highly correlated with SOH attenuation were selected. At the same time, the K-means clustering method was adopted to detect and process the outliers of CALCE data, which ensures the high quality of data and the stability of the model. Then, the CNN-LSTM hybrid neural network architecture was constructed to extract the local spatial correlation of health features using a CNN, and the temporal dependence in the process of battery degradation was captured by the LSTM network. To verify the validity and generality of the model, experiments were carried out based on the CALCE battery aging dataset and the data provided by NASA PCoE. The data-driven approach adopted not only ensures the prediction accuracy but also significantly reduces the consumption of computing resources through the lightweight design of the algorithm, which reflects the sustainability-oriented technological development concept. Figure 1 shows the SOH prediction framework of the proposed method.
The innovations and contributions of this study are as follows:
(1)
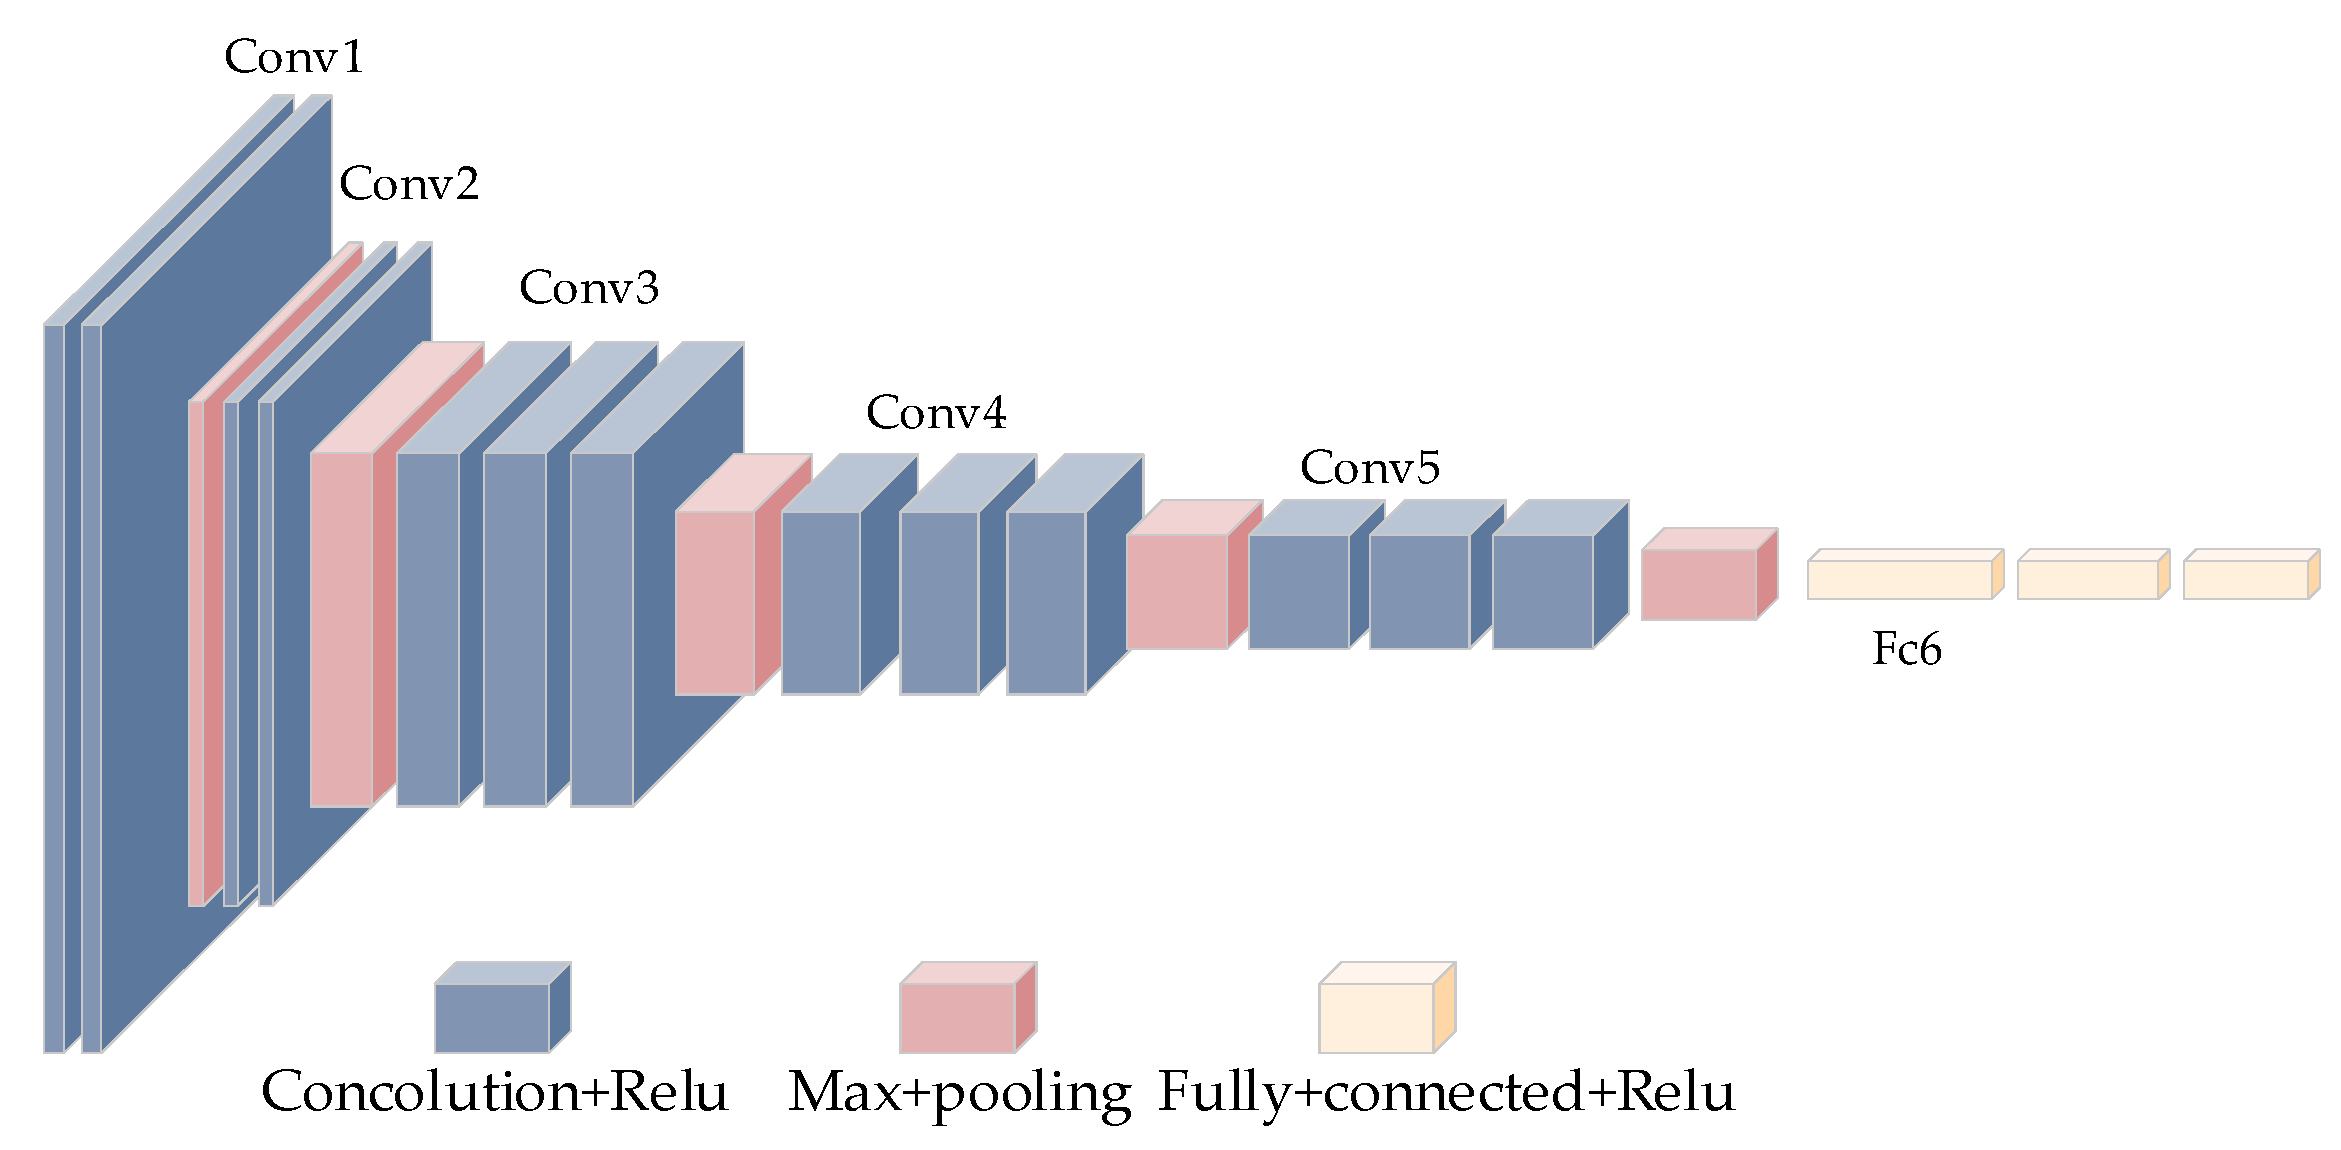
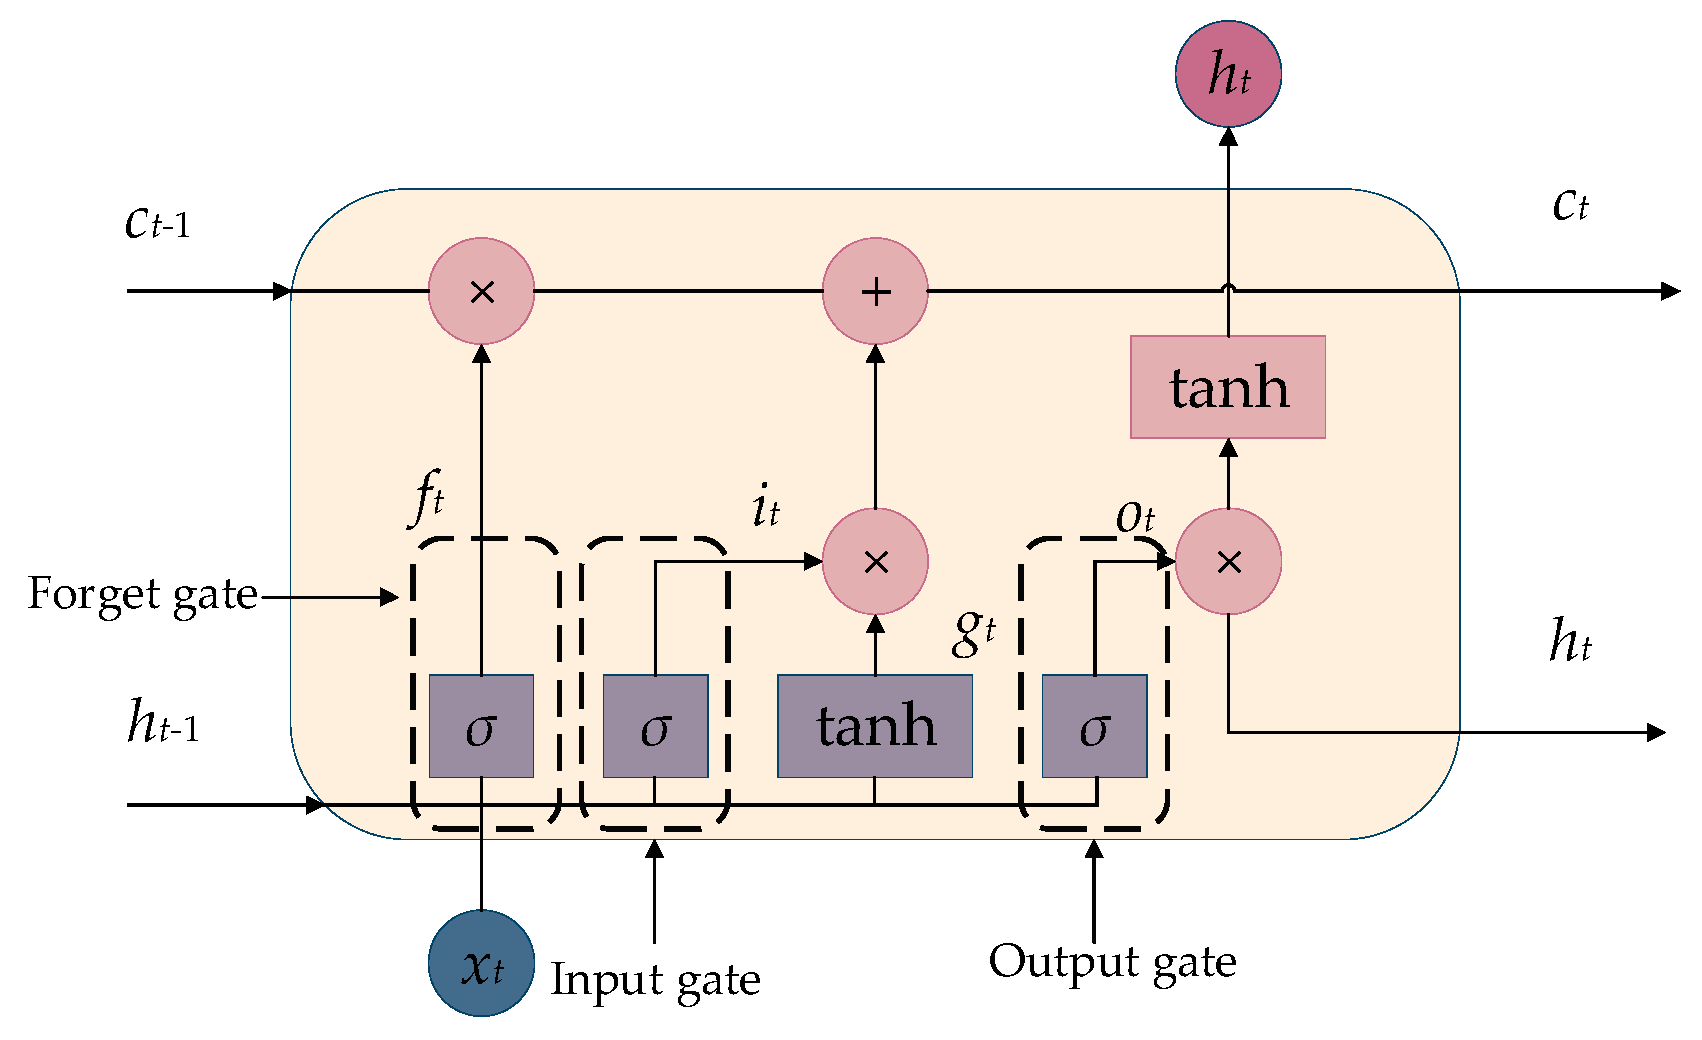
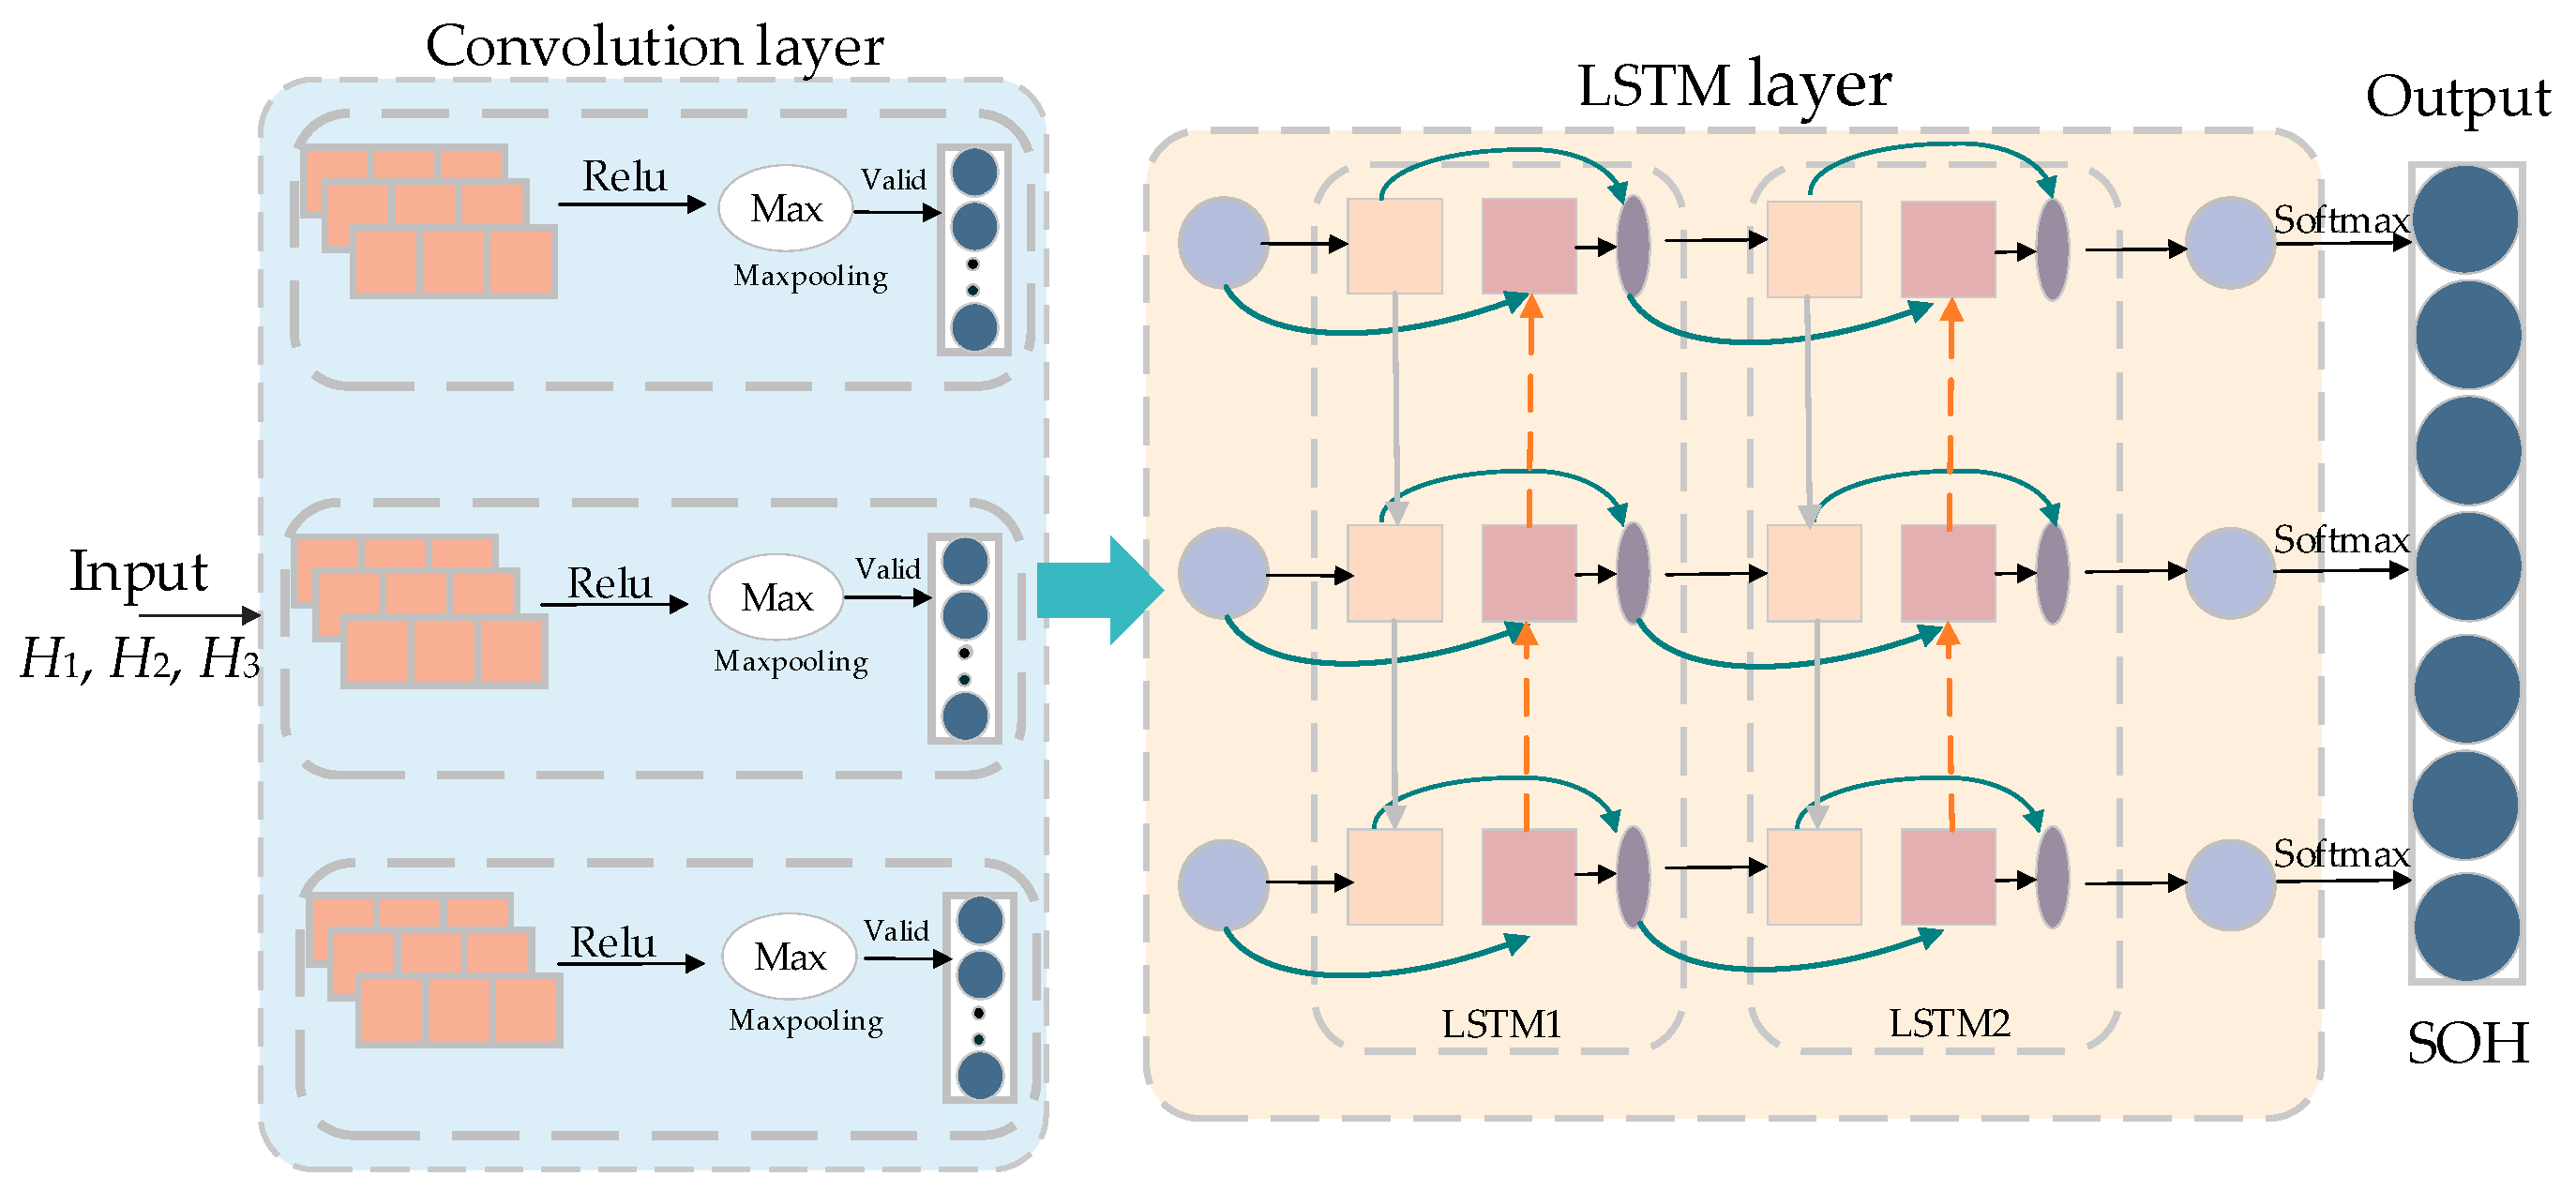
To address the dual challenge of balancing local feature extraction and time-dependent modeling in battery SOH estimation, the CNN-LSTM model is introduced. The structural design of the model plays a key role in achieving efficient SOH estimation. The CNN part enhances the sensitivity of the model to the change in the battery state by extracting the local features of the battery charge and discharge curve. The LSTM part improves the model’s ability to predict long-term trends by capturing the time series dependencies in the battery degradation process.
(2)
To capture the changes in battery state comprehensively, multi-dimensional feature information, time features on the basis of battery voltage, and current traditional features are introduced. Six health features—the lowest point in time-of-discharge voltage H1, average discharge time H2, average discharge voltage H3, constant voltage charging time H4, average discharge current H5, and lowest point in voltage H6—are extracted, and then Pearson correlation is used to analyze them. Three features, H1, H2, and H3, most relevant to battery SOH are selected.
(3)
To ensure the high quality of data and the stability of the model, this paper uses the K-means clustering method to detect and process outliers in the CALCE data. Considering the possibility for noise and outliers in experimental data to interfere with model training, this paper introduces the K-means unsupervised clustering method to detect outliers in charge and discharge data, and combines the Elbow method and contour coefficient to automatically determine the optimal number of clusters, thereby effectively improving data quality and model stability.

2. Experimental Data and Feature Analysis

2.1. Dataset

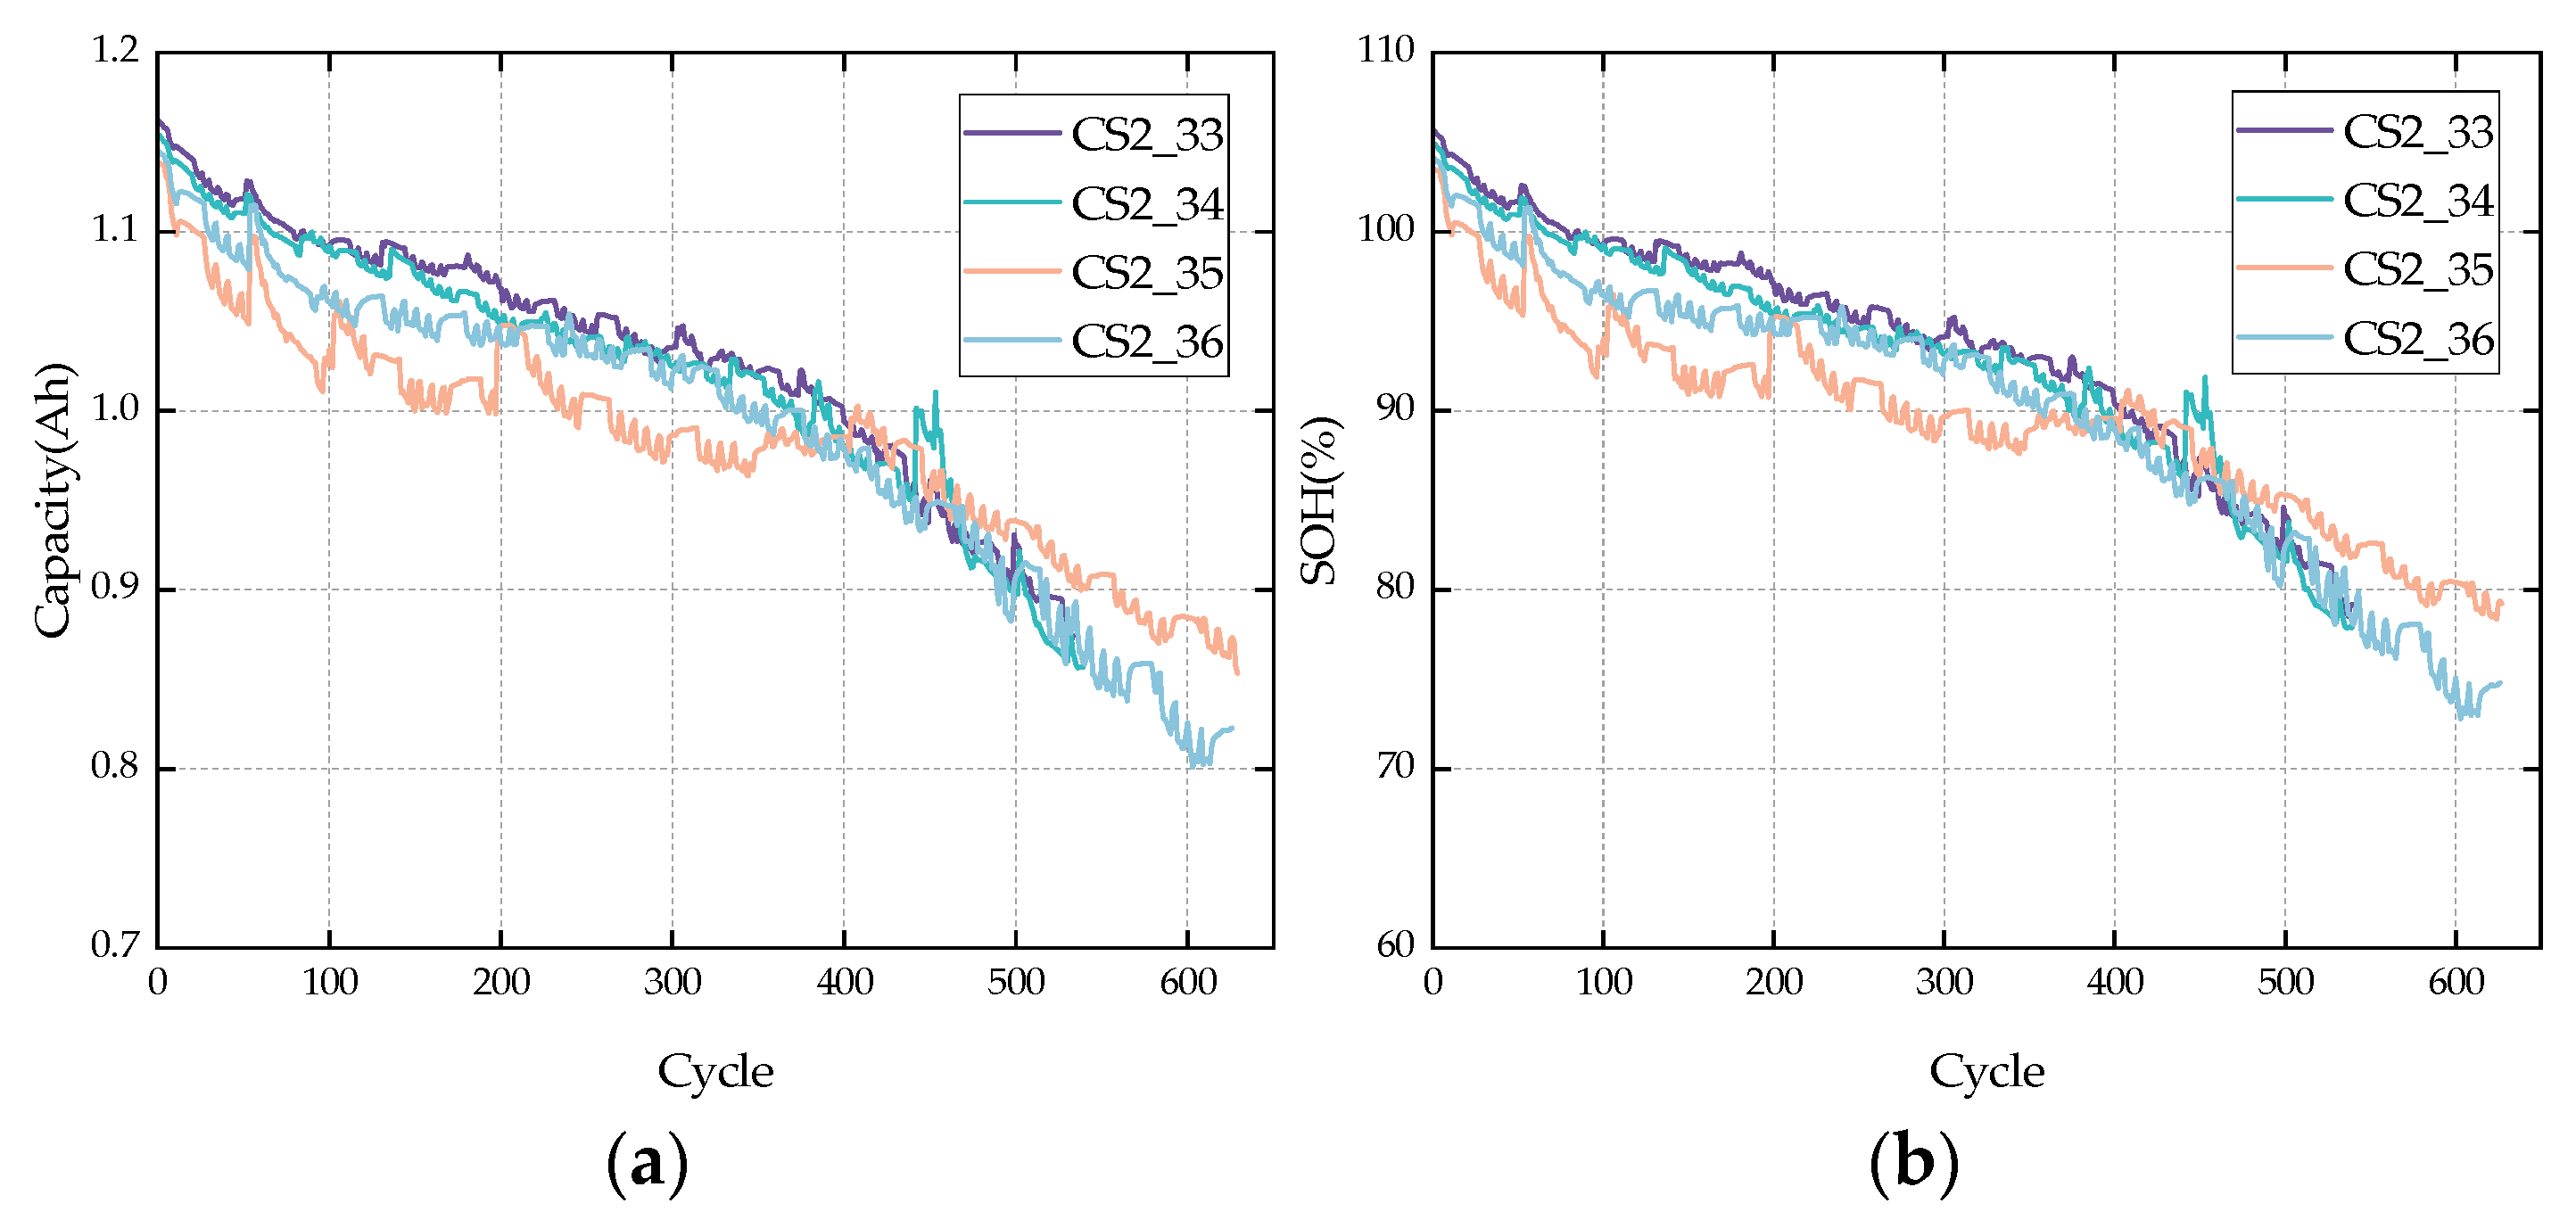
2.1.1. CALCE Dataset Information

The first experimental data used this study were obtained from the CS2 battery research project [32,33] conducted by the University of Maryland’s CALCE. Table 1 lists the battery parameters of the CALCE dataset. Specifically, datasets CS2_33 and CS2_35 were selected for analysis, both featuring batteries with an initial capacity of 1100 mAh. Two constant-current (CC) charging rates, 0.5C and 1C, were employed during the charging phase. The process began with CC charging until the battery voltage reached the upper limit of 4.2 V. The system then switched to the constant-voltage (CV) charging mode, maintaining 4.2 V until the charging current dropped below 0.05 A, ensuring full charge. A resting period followed to stabilize the battery’s internal state. For discharge, the same CC rates, 0.5C and 1C, were applied until the voltage decreased to the 2.7 V cut-off threshold. This charge–discharge cycling systematically monitored battery performance degradation across cycles.
This study focused on data from CS2_33 and CS2_35 batteries throughout their lifespan, from initial states to 80% SOH degradation. Figure 2 illustrates the experimental results of actual capacity variation with cycle number, providing critical insights into battery aging characteristics.

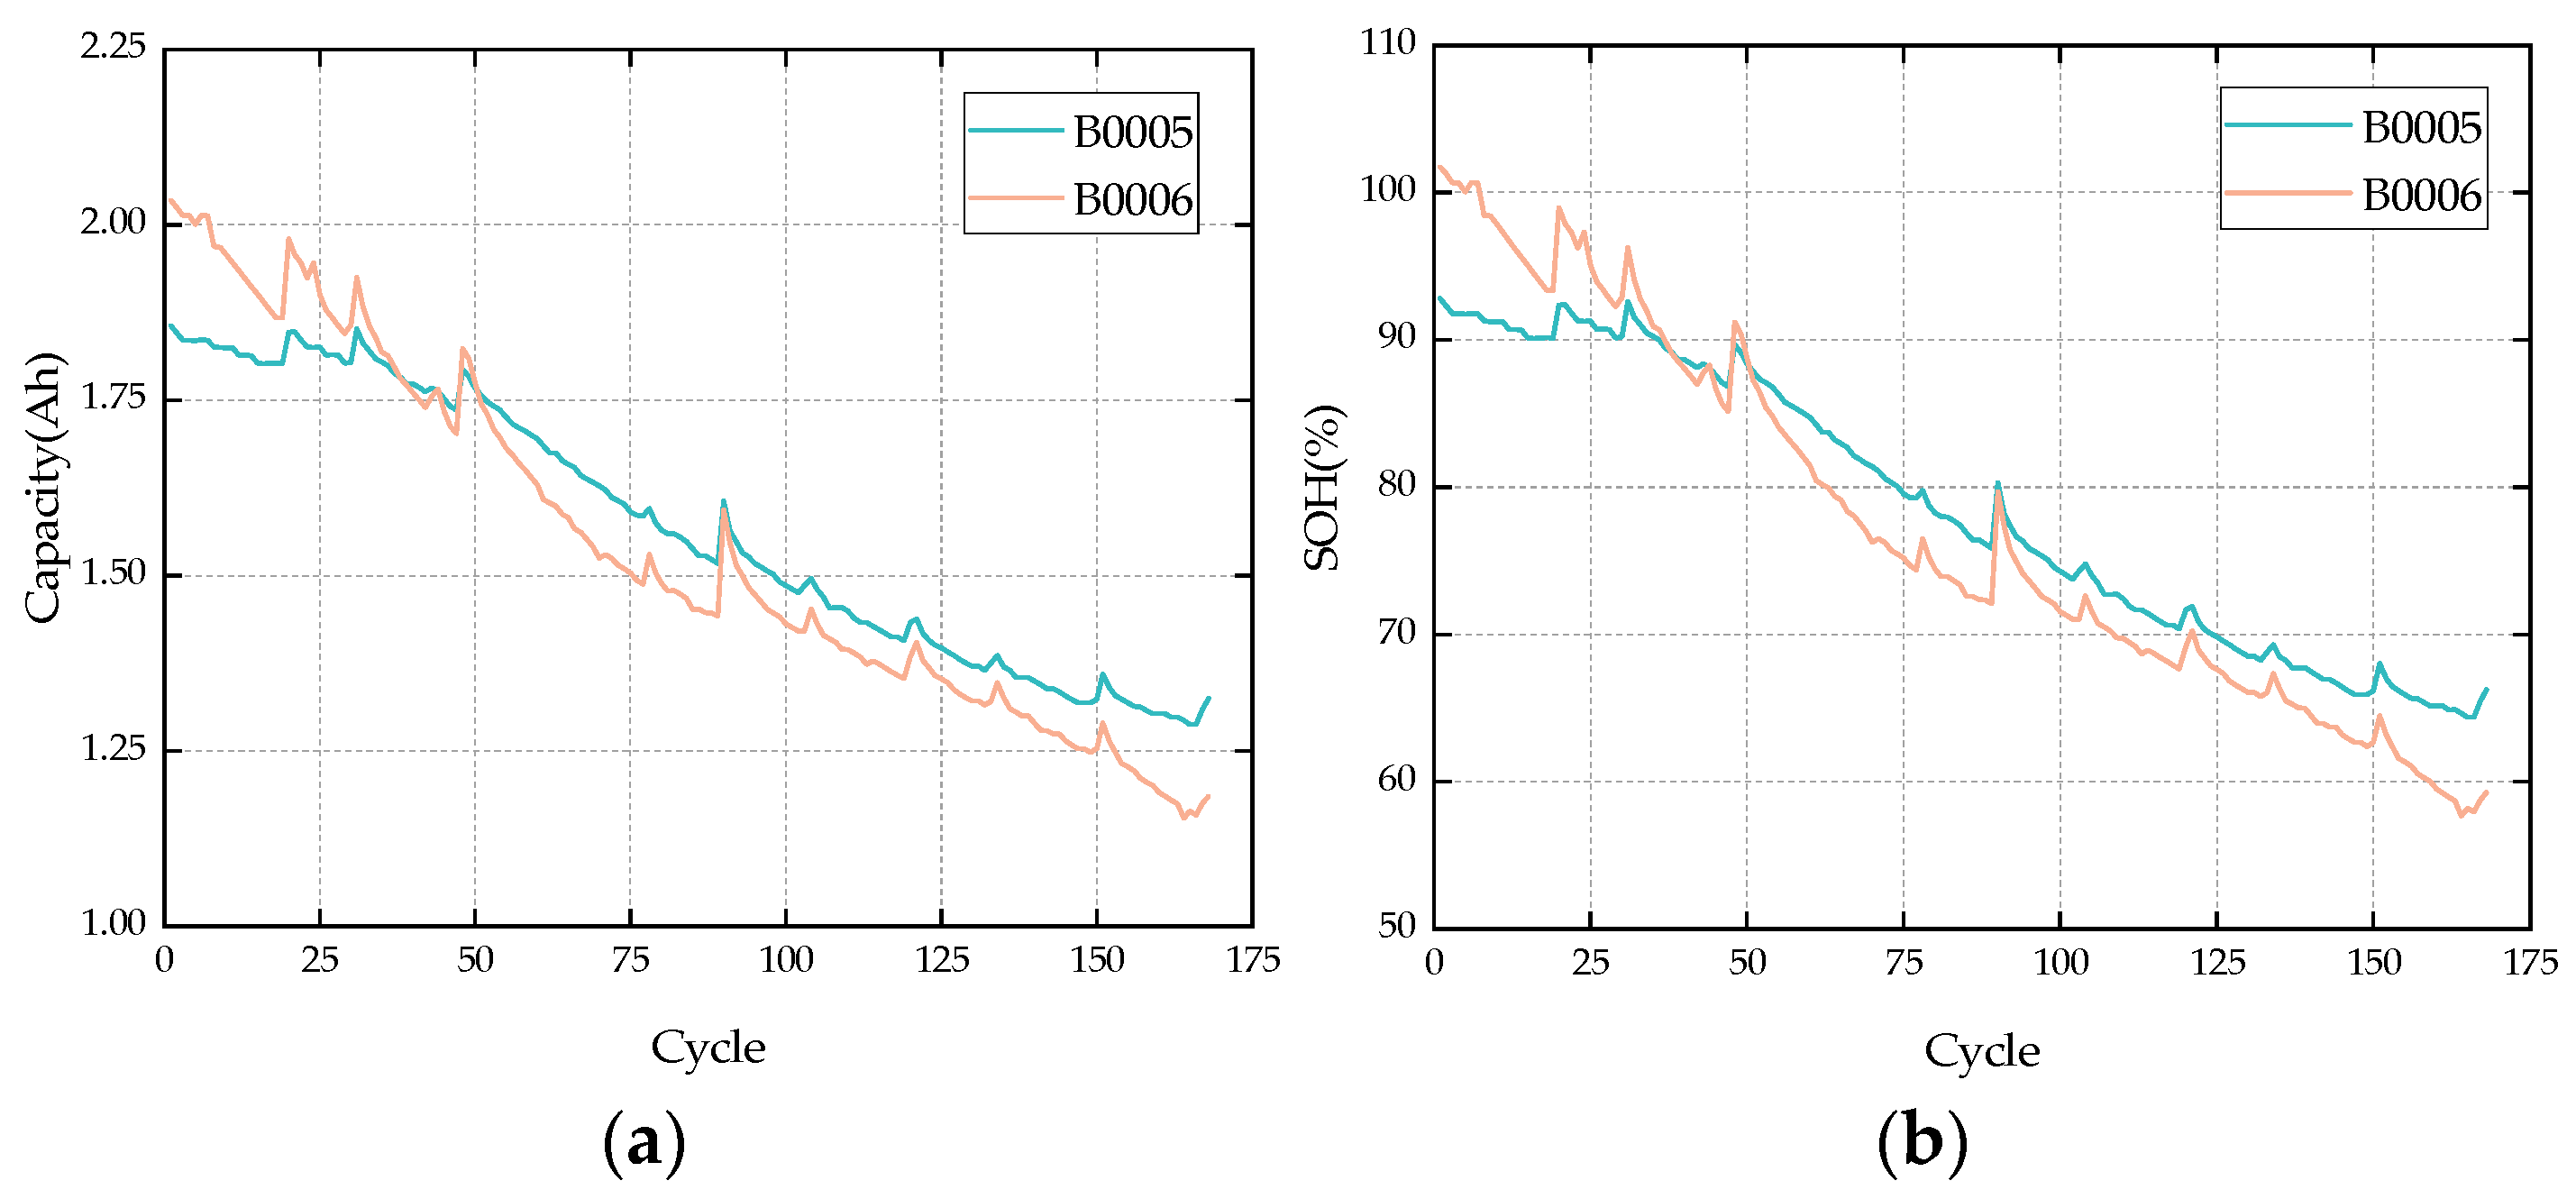
2.1.2. NASA Dataset Information

The second set of experimental data used came from the 18650 lithium-ion battery dataset provided by the NASA PCoE institution [34], and their specific parameters are shown in Table 2. In the experiment, two groups of batteries, B0005 and B0006, were selected to run tests at room temperature according to three typical operating modes (charge, discharge, and impedance test). The specific experimental conditions were as follows: charge at 1.5 A constant current mode until the battery voltage rises to 4.2 V, then switch to the constant voltage mode to continue charging until the charging current drops to 20 mA; use 2 A constant current to discharge until the B0005 battery voltage drops to 2.7 V and B0006 to 2.5 V; the experiment ends when the battery performance reaches the end of life (EOL) standard, that is, the battery capacity decreases by 30% from the initial value. Figure 3 shows the actual capacity and SOH value of the NASA 18650 batteries as a function of the number of charge and discharge cycles.

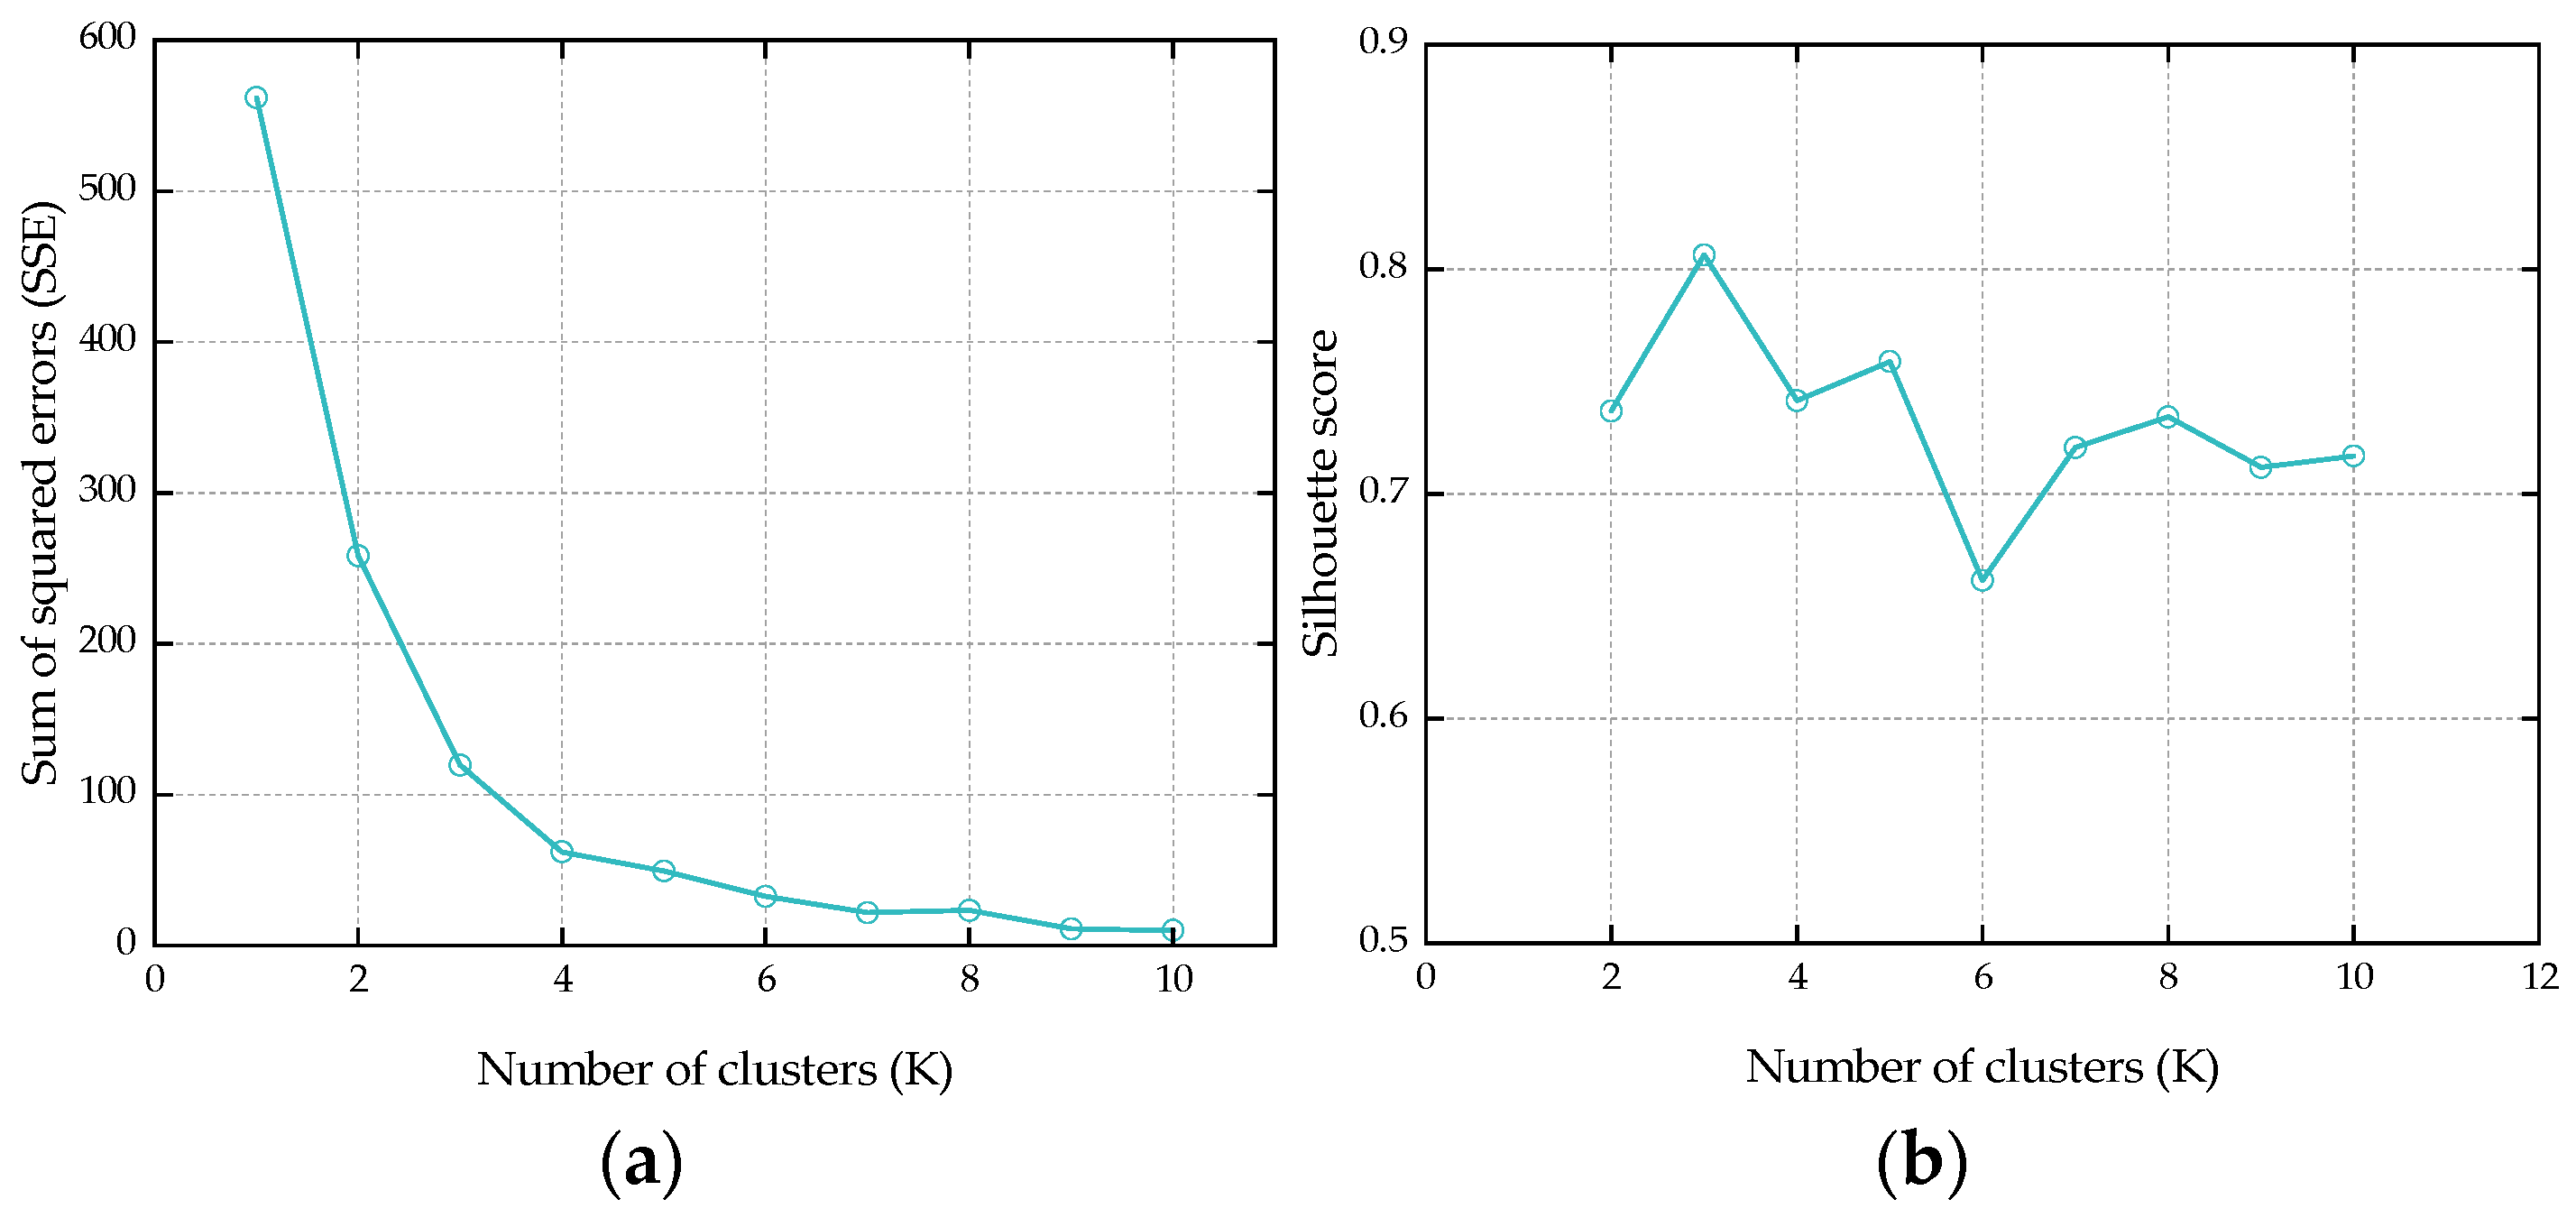
2.1.3. Data Outlier Detection

During the operation of the BMS, the battery data acquisition may cause measurement deviations due to sensor noise, system delay, and environmental interference, resulting in abnormal data points. These anomalies often manifest as zero bias or abrupt data points that are significantly different from the surrounding sample. To ensure the accuracy of battery status assessment, it is necessary to identify and eliminate these outliers in time. Figure 4 shows the raw capacity data from the CALCE dataset.
To accurately identify these outliers, the K-means clustering detection method was used to analyze the original data [35]. Its principle is to evaluate the similarity between different data objects by selecting an appropriate distance formula, with the aim of minimizing the distance between the data of the same cluster and maximizing the distance between the data of different clusters. Therefore, data with higher similarity are classified as the same cluster, which is why it is called K-means cluster analysis. K-means cluster analysis is considered one of the more mature data-mining technologies at present, and it is often applied to deal with a large amount of data, so it is very suitable for the rapidly growing sensor data stream data. The input to the K-means clustering algorithm is an unlabeled dataset {x1, x2, …, xk}, and because of its unsupervised learning method, we can only see the input set to the labeled data in this collection. The core of the K-means clustering method is to divide the sample into k different clusters, and the specific algorithm flow is described as follows:
Step 1: Randomly select k samples as the initial mean vector {u1, u2, …, uk}.
Step 2: Calculate the distance between sample xi and each mean vector uj (1 ≤ jk):
d = x i u j 2
Step 3: Determine the cluster marker of xi according to the nearest central point:
λ = arg min x i u j 2 ,   j 1 , 2 , , k
Step 4: Calculate the new mean vector u j .
Then, repeat Step 2, Step 3, and Step 4 until the algorithm converges. The optimal K value is selected using the Elbow method [36] and the Silhouette Score [37] analysis.
The Elbow method curve shows the trend of the sum of squares of error (SSE) with respect to K. The curve at the inflection point arises where the SSE drops significantly more slowly, and the K value is the best value. The higher the Silhouette Score, the better (closer to 1) the clustering effect. Simulation experiments on CS2_33 were carried out and results were obtained, as shown in Figure 5; the simulation results show that the SSE of the data tends to be stable when it drops to 4, which means that K = 4 is a reasonable segmentation point and can effectively reduce the error. When K = 3, the similarity within clusters is the highest and the difference between clusters is the largest. The actual effect of the clustering results was observed under the conditions of K = 3 and K = 4, respectively, and it was found that the data outliers could be completely detected under the condition of K = 4, so K = 4 was selected. The K values for CS2_34, CS2_35, and CS2_36 are 3, 5, and 4, respectively. Figure 6 shows the results of systematic outlier detection of CS2 batteries by the K-means clustering method. In view of the excellent quality characteristics of the original data provided by NASA, no additional pre-processing operations were performed to ensure the original and authenticity of the data.

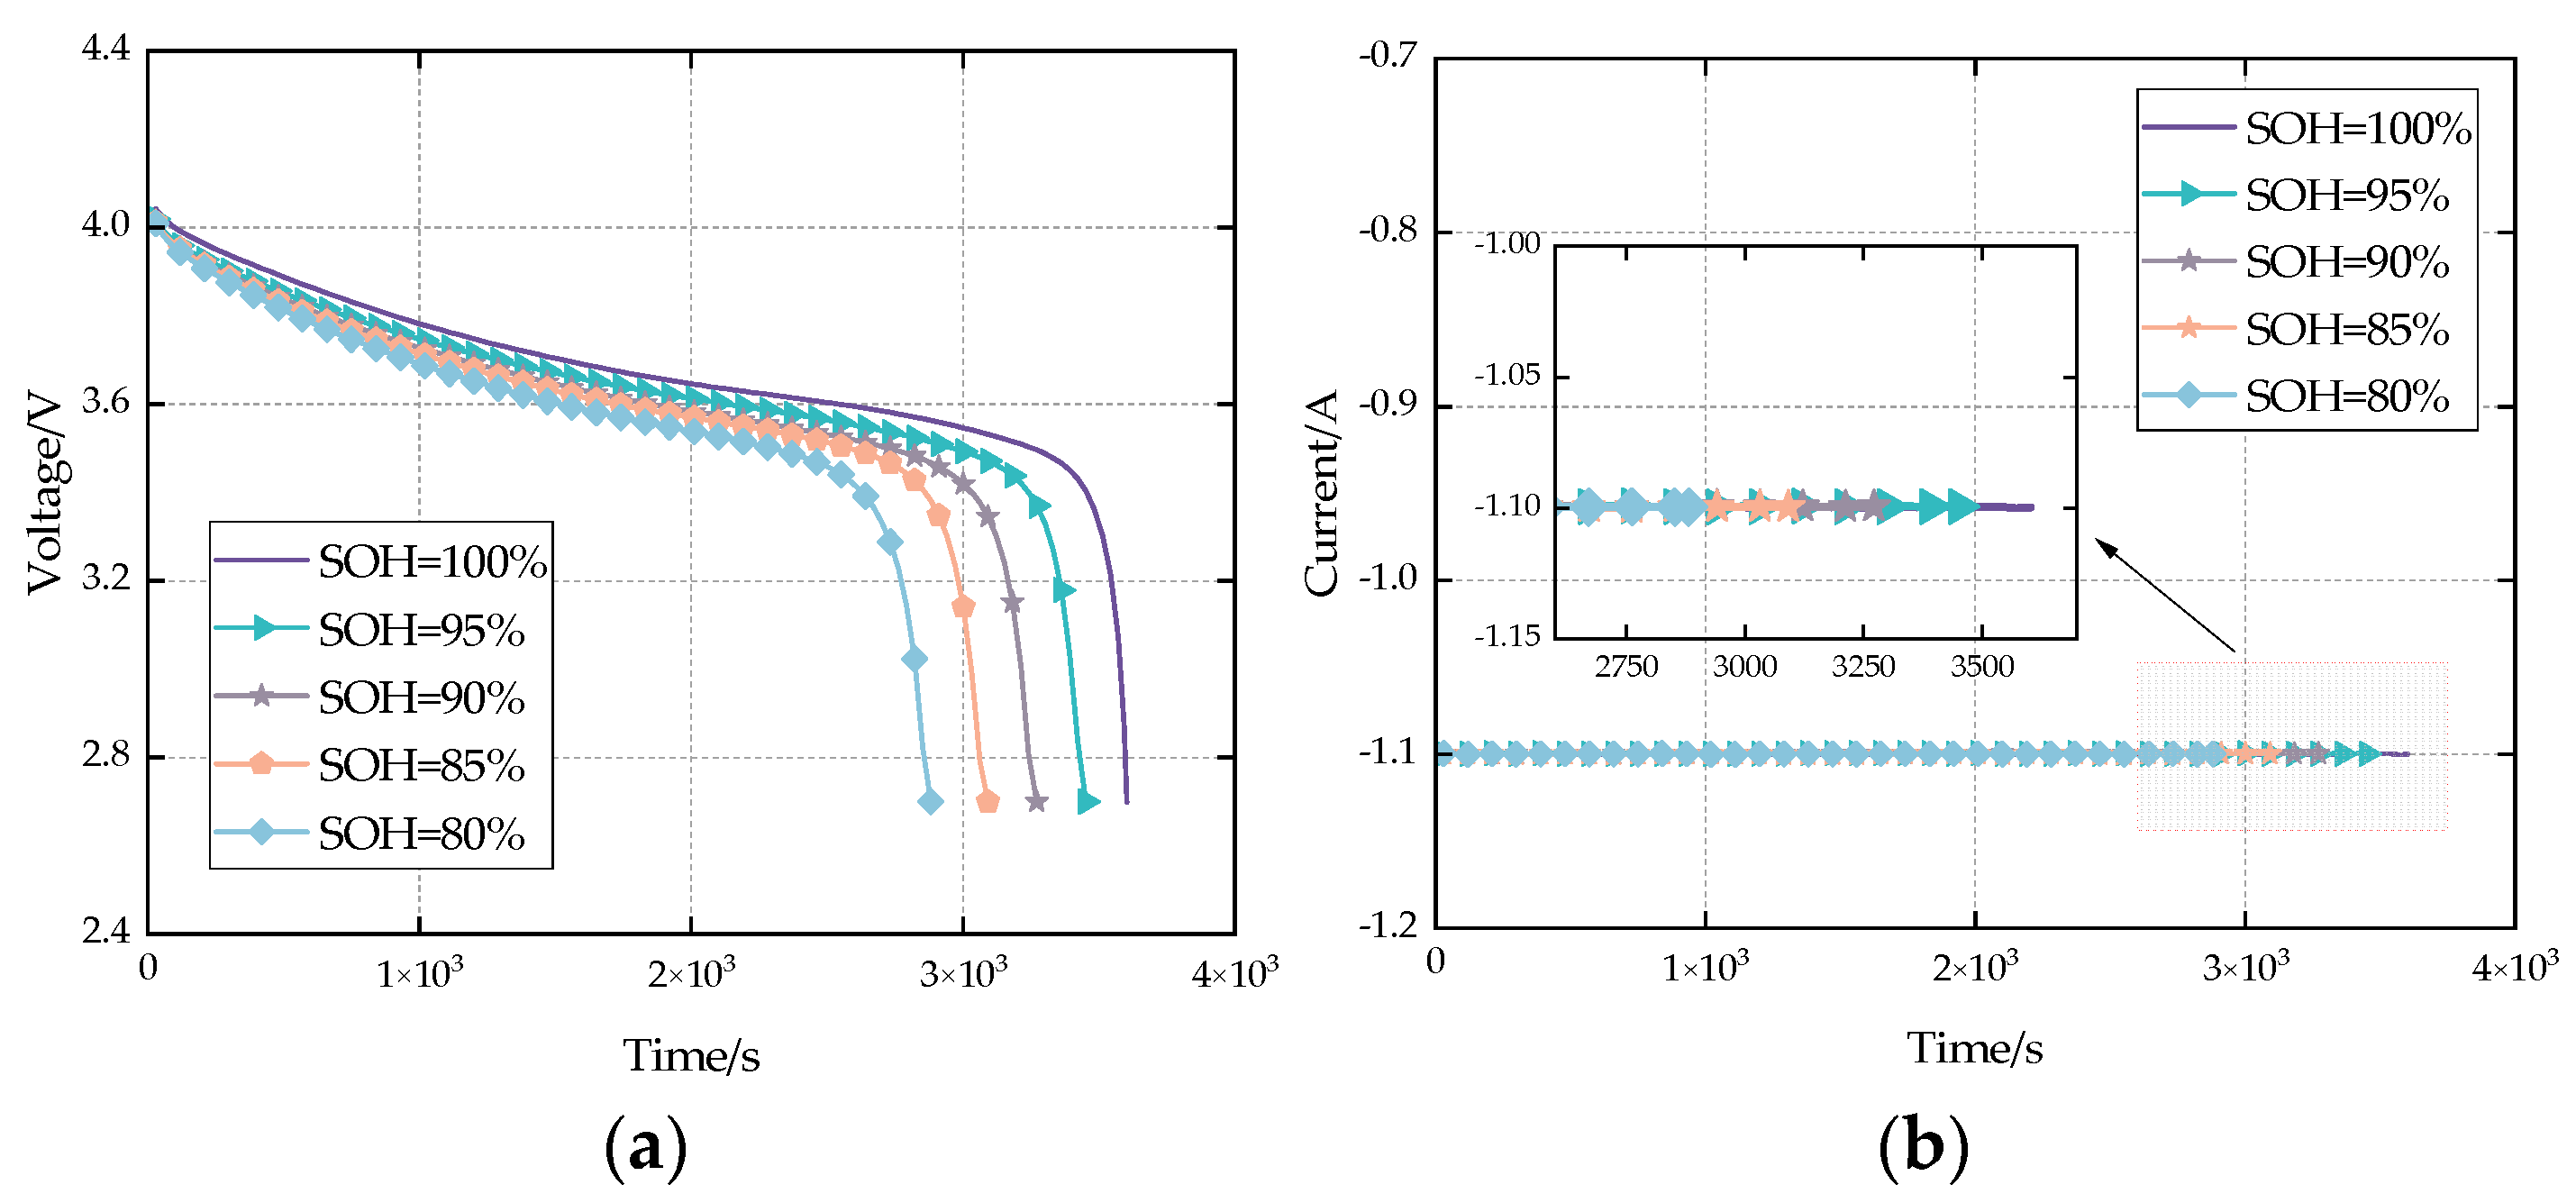
2.2. Feature Extraction

The selection of health features is a key factor for the accurate estimation of battery SOH, and some key features can usually be extracted from the relatively stable charging voltage, current, and temperature of the battery as a measure of the battery SOH during use [38]. This study introduced the health characteristics of the battery discharge stage, which can reflect the performance changes in the battery in the actual use process. On this basis, time characteristics were also introduced, and it was found that the lowest discharge time and average discharge time were also important key characteristics. Figure 7 presents the dynamic evolution of voltage and current characteristics in the CS2_35 battery across different stages of health.
Therefore, six health features—the lowest discharge time H1, the average discharge time H2, the average discharge voltage H3, the constant voltage charging time H4, the average discharge current H5, and the lowest discharge voltage H6—were extracted.

2.3. Pearson Correlation Analysis

To systematically evaluate the correlation between health features and SOH, the Pearson correlation coefficient method from statistics was employed. This method effectively quantifies the linear relationship between two variables and has been widely adopted in feature selection and correlation analysis [39,40,41,42]. The mathematical formula for calculating the Pearson correlation coefficient is provided below:
r = i ( x i x ¯ ) ( y i y ¯ ) i ( x i x ¯ ) 2 i ( y i y ¯ ) 2
where x and y represent sample data, x ¯ and y ¯ denote the means of the samples, and r is the Pearson correlation coefficient. The value of this coefficient ranges between [−1, 1], where a larger absolute value indicates a stronger linear relationship between the variables. A positive coefficient signifies a positive correlation, while a negative value indicates a negative correlation.
Through statistical analysis of health feature data, the Pearson correlation coefficients between individual health features and the battery SOH were calculated. The results are shown in Table 3. The absolute values of correlation coefficients of the four health features, H1, H2, H3, and H4, were higher than those of other features, indicating that there was a strong correlation between these features and battery SOH, which was the main health feature of CS2_33 and CS2_35. Among these, H1 exhibits the highest absolute correlation coefficient, highlighting its critical role in evaluating battery SOH. In contrast, H5 and H6 show weaker correlations but still retain some reference value. In addition, the experimental analysis showed that H1, H2, and H3 health characteristics could effectively and adequately predict the SOH. Adding H4 features to the model did not significantly improve the prediction accuracy of SOH. To avoid information redundancy, H1, H2, and H3 were selected as the primary input features for subsequent battery SOH prediction models. This approach cannot only effectively reduce the complexity of the model but also improve the accuracy and reliability of the prediction, providing robust support for battery health management systems.

3. Model Building

3.1. Convolutional Neural Networks

The CNN effectively reduces computational complexity and mitigates the overfitting issues commonly encountered in traditional fully connected networks, thanks to their unique local connectivity and weight-sharing strategies. These mechanisms enable more efficient model optimization [43,44]. The basic architecture of a CNN is illustrated in Figure 8.
In CNN architectures, the convolutional layer serves as the core component for feature extraction, functioning similarly to filters that extract local patterns from input data [45]. The detailed computational process is defined by Equation (6):
x i l = f ( W i l × X l 1 + b i l )
where, x i l denotes the i-th feature map at layer l; f is the activation function, typically ReLU or Leaky ReLU; W i l represents the convolution kernel weight matrix at layer l; * denotes the convolution operation; X l 1 is the output of layer l − 1; and b i l is the bias term of layer l − 1.
Additionally, the pooling layer serves to reduce data dimensionality while enhancing model robustness to feature variations and preventing overfitting [46]. Common pooling methods include Max Pooling and Average Pooling. The pooling operation can be formally defined as follows:
X i l + 1 = pool X i l ,   D j
where X i l + 1 represents the pooled feature map; pool denotes the pooling operation; and Dj is the pooling window size.

3.2. Long Short-Term Memory Neural Networks

The LSTM networks are a type of recurrent neural network (RNN) designed to capture long-term dependencies in sequential data. An LSTM unit incorporates three gating mechanisms to regulate the storage, retention, and output of information through its cell state [47,48]. The architecture of LSTM is illustrated in Figure 9.
The computations for the gating units in an LSTM are defined as follows:
Forget gate:
f t = σ ( W f [ h t 1 , x t ] + b f )
Input gate:
i t = σ ( W f [ h t 1 , x t ] + b i )
C ^ t = tanh ( W C [ h t 1 , x t ] + b c )
Cell state update:
C t = f t C t 1 + i t C ^ t
Output gate:
o t = σ ( W o [ h t 1 , x t ] + b o )
h t = o t tanh ( C t )
where σ denotes the sigmoid activation function with an output range of 0 to 1; while tanh has a range of −1 to 1. The weight matrices Wf, Wi, WC, and Wo correspond to the forget gate, input gate, cell state, and output gate, respectively. The biases bf, bi, bc, and bo represent the forget gate bias, input gate bias, cell state bias, and output gate bias. The term ot is the output value of the output gate, and ht is the final output value of the LSTM unit in the current timestep.

3.3. CNN-LSTM Model

Since the CS2 dataset belongs to time-series data and exhibits significant volatility and uncertainty, this study proposed a hybrid CNN-LSTM neural network model to improve the estimation accuracy of lithium-ion battery SOH. The CNN-LSTM model integrates the spatial feature extraction capability of CNNs with the temporal dependency learning ability of LSTM networks. This combination enables the model to extract critical features more precisely when processing complex battery data. The architecture of the proposed model is presented in Figure 10.
In the CNN-LSTM model architecture, firstly, the input layer transmits the input health index data to the CNN; then, three CNN convolutional layers are applied to train the data, where the convolution kernel sizes are 3 × 3, 5 × 4, and 9 × 32, respectively. Next, the convolutional results of the CNN output are expanded into a row of inputs into the LSTM by a sequence expansion layer and smoothing layer, where the number of hidden neurons is 256. At the same time, the random discard layer is introduced to reduce the complexity, discard part of the information, and improve the anti-noise interference ability. Finally, the model is estimated by the fully connected layer and the regression layer.

4. Experimental Results and Analysis

4.1. Evaluation Indicators

Four classic regression evaluation metrics were employed: the coefficient of determination (R2), mean absolute errors (MAEs), mean bias errors (MBEs), and root mean squared errors (RMSEs). These metrics assess the model’s fitting capability, error magnitude, and bias in predictions from multiple perspectives, thereby helping to identify the model’s strengths and weaknesses while offering guidance for optimization.

4.1.1. R-Square

The coefficient of determination R2 quantifies the proportion of variance in the target variable explained by the model, with its value ranging between 0 and 1. A higher R2 value indicates a better model fit, demonstrating stronger predictive capability for capturing data trends [49]. The formula is expressed as follows:
R 2 = 1 ( T true T estimated ) 2 ( T true mean ( T true ) ) 2
where Ttrue denotes the true values, while Testimated represents the predicted values. An R2 value approaching 1 indicates that the model exhibits a strong predictive capacity, effectively capturing the underlying trends in the data. Conversely, a lower R2 value suggests that the model fails to adequately identify characteristic patterns within the dataset, potentially signaling underfitting issues.

4.1.2. Mean Absolute Error

The MAE quantifies the average magnitude of deviations between predicted and true values [50]. Unlike other metrics, the MAE is insensitive to outliers and provides an intuitive measure of average prediction error. Its formula is
MAE = 1 n T estimated T true
A smaller MAE indicates higher predictive accuracy. Due to its robustness and interpretability, the MAE is particularly suitable for datasets with homogeneous error distributions.

4.1.3. Mean Bias Error

The mean bias error evaluates systematic deviations in model predictions, identifying consistent overestimation or underestimation trends [51]. It is calculated as
MBE = 1 n ( T estimated T true )
When there is an MBE > 0, the model overestimates the true value; otherwise, it underestimates the true value. While the MBE reveals directional bias, it does not quantify the error magnitude. Thus, it is typically used alongside the MAE or RMSE for comprehensive error analysis.

4.1.4. Root Mean Square Error

The RMSE quantifies the average deviation between predicted and true values while imposing additional penalties on larger errors. By squaring the errors before averaging, the RMSE disproportionately amplifies the impact of significant deviations, making it particularly sensitive to data fluctuations and outliers [52]. This property ensures that models are penalized more rigorously for large prediction errors, thereby emphasizing robust performance in noisy or non-ideal datasets. The RMSE is defined as
RMSE = 1 n ( T true T estimated ) 2
where the RMSE reflects the average error margin between the predicted value and the true value. The smaller the value, the better the prediction effect of the model.
Due to its squared amplification effect, the RMSE may overestimate the model error level when large measurement errors exist. Therefore, the RMSE is more appropriate for scenarios requiring stringent error penalties, while the MAE may be preferred in cases with uniform data distributions or when robustness to outliers is prioritized.

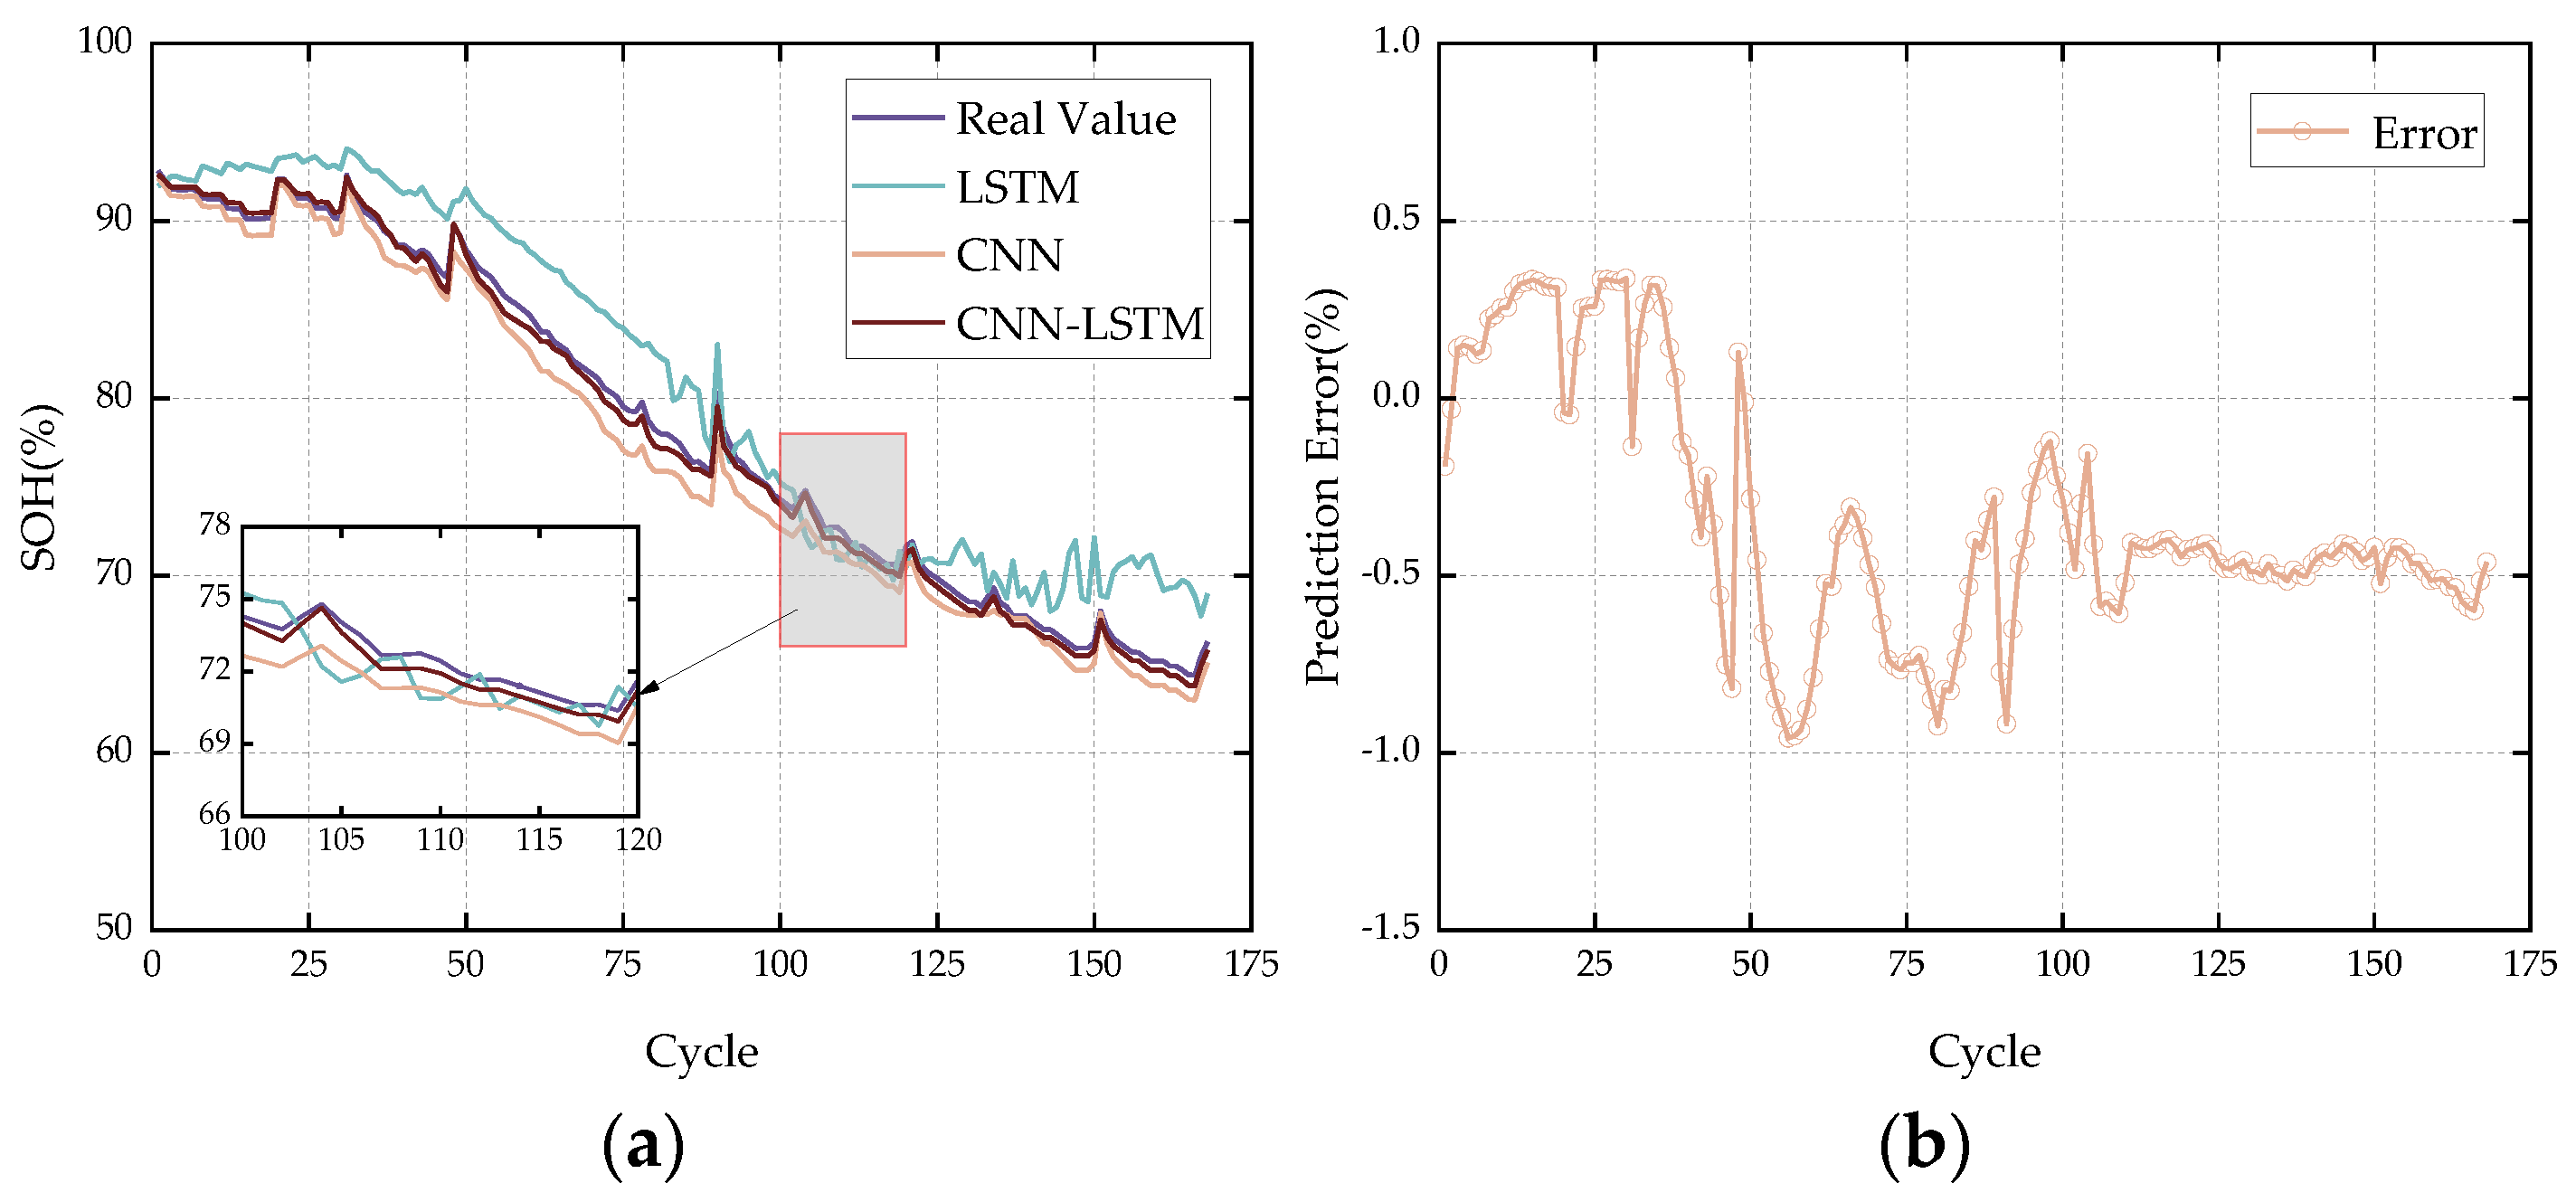
4.2. SOH Prediction Results of the CNN-LSTM Model

To validate the effectiveness and generalization of the proposed CNN-LSTM-based multi-feature analysis method for SOH estimation, experiments were conducted using the CS2 dataset from CALCE and the 18650 batteries dataset provided by NASA. Additionally, a full lifecycle experimental design was implemented to evaluate the model’s long-term prediction capability. Specifically, the datasets CS2_34 and CS2_36 from CALCE, along with NASA’s B0006 dataset, were selected as training sets to train the model for full lifecycle SOH prediction. Meanwhile, CS2_33, CS2_35, and NASA’s B0005 were chosen as testing sets to achieve full lifecycle SOH prediction. During the experiments, four regression evaluation metrics were employed to measure the model’s fitting capability, prediction error, and systematic bias. These metrics provided comprehensive insights into the model’s performance, ensuring the accuracy and thoroughness of the experimental analysis. The experiments conducted SOH predictions on the CS2_33, CS2_35, and B0005 datasets. The results were visualized in comparison curves between predicted and true SOH values and prediction errors (the difference between the predicted value and the true value), as shown in Figure 11, Figure 12 and Figure 13.
For the CS2_33 and CS2_35 batteries, the prediction results of the CNN-LSTM model outperformed those of single models. As shown in Figure 11, the prediction curve of the CNN-LSTM model for CS2_33 closely aligns with the true SOH curve, indicating the model’s ability to accurately capture the trends of battery SOH changes. From the distribution of prediction errors, it can be seen that most errors were maintained within 0.5%, with slight increases only during rapid SOH decline phases. However, the overall error level remained low. As indicated in Table 4, the MAE was 0.297%, demonstrating a very small average absolute error between predicted and true values; the MBE was −0.004%, close to 0, indicating no significant systematic overestimation or underestimation; and the RMSE was 0.339%, further confirming the model’s low overall error and good prediction stability. Compared to the single CNN model, the CNN-LSTM model reduced the MAE by approximately 0.16%, the MBE by approximately 0.4%, and the RMSE by approximately 0.38%. Compared to the single LSTM model, the CNN-LSTM model reduced the MAE by approximately 0.7%, the MBE by approximately 1%, and the RMSE by approximately 0.68%.
For CS2_35, as shown in Figure 12, the CNN-LSTM model also performed well in fitting the battery’s SOH changes, with prediction errors mostly controlled within 0.5%. As shown in Table 5, the MAE was 0.184%, which was lower than that of CS2_33, indicating a better prediction performance on this dataset; the MBE was −0.111%, indicating that the model’s predictions were slightly lower than the true SOH, but the overall error was minimal; and the RMSE was 0.239%, further validating the reliability of the CNN-LSTM model in battery SOH prediction. Compared to the single CNN model, the CNN-LSTM model reduced the MAE by 0.5%, the MBE by approximately 0.3%, and the RMSE by approximately 0.86%; compared to the single LSTM model, the CNN-LSTM model reduced the MAE by approximately 0.5%, the MBE by approximately 0.56%, and the RMSE by approximately 0.68%.
To further validate the generalization of the proposed method, experiments were conducted using the NASA 18650 batteries dataset. For the B0005 battery, the CNN-LSTM model also achieved excellent prediction results. As shown in Figure 13, the SOH curve predicted by the CNN-LSTM model closely followed the true SOH curve, with prediction errors mostly controlled within 0.7%. As shown in Table 6, the MAE was 0.442%, the MBE was −0.341%, and the RMSE was 0.488%. Compared to the single CNN model, the CNN-LSTM model reduced the MAE by approximately 0.8%, the MBE by approximately 0.9%, and the RMSE by approximately 0.9%; compared to the single LSTM model, the CNN-LSTM model reduced the MAE by approximately 2.1%, the MBE by approximately 2%, and the RMSE by approximately 2.4%.
In the model, the CNN was primarily used to extract local features from battery charge–discharge curves. Through the sliding window operation of the convolutional layers, the CNN could automatically identify features related to the battery SOH during charge and discharge processes. These features reflected changes in the internal chemical reactions of the battery and were critical factors for SOH prediction. The experimental results demonstrated that the introduction of the CNN significantly enhanced the model’s ability to capture the battery SOH. On the CALCE dataset, compared to models using only LSTM, the CNN-LSTM model reduced the MAE by approximately 0.5%, the MBE by approximately 0.56%, and the RMSE by approximately 0.68%. This indicated that the CNN could effectively extract nonlinear features from battery charge–discharge curves, providing high-quality inputs for subsequent time-series modeling. Additionally, the CNN’s ability to extract local features significantly improved the model’s robustness to noise. In experiments on NASA’s dataset without outlier detection, when battery charge–discharge curves were affected by random noise, the RMSE of the CNN-LSTM model decreased by 2.4% compared to models using only LSTM. This demonstrated that the CNN could effectively filter noise and extract stable features related to the SOH.
LSTM was mainly responsible for capturing the temporal dependencies of the SOH. Through its memory units and gating mechanisms, LSTM could effectively model the time-dependent variation in the battery SOH. Experimental results showed that the introduction of LSTM significantly improved the model’s ability to capture dynamic changes in the battery SOH. On the CALCE dataset, compared to models using only the CNN, the CNN-LSTM model reduced the RMSE by approximately 0.38% in long-term prediction tasks. This indicated that LSTM could effectively capture the temporal features of battery SOH, providing strong time-dependent modeling capabilities for SOH prediction. Furthermore, its long-term memory capability enabled the model to better adapt to the SOH variation patterns of different batteries. In experiments on NASA’s dataset, although B0005 and B0006 had different discharge cut-off voltages, the RMSE of the LSTM-based model decreased by approximately 0.9% compared to models using only a CNN. This demonstrated that LSTM could effectively model individual differences in the battery SOH, enhancing the model generalization capability.

5. Conclusions

To address the limitations of traditional SOH estimation methods, including inaccurate feature extraction, the inability of SOH estimation methods to comprehensively reflect battery health status, and dataset anomalies, this study has proposed an SOH estimation method based on multi-feature analysis and a CNN-LSTM model. A series of comprehensive experiments were conducted using battery data from two distinct datasets: the CALCE CS2 dataset and the NASA 18650 battery dataset. To thoroughly evaluate the model’s long-term prediction capability, a full-life cycle experimental design was adopted. First, through multi-feature analysis, highly SOH-relevant health features were extracted from battery charge–discharge data, providing high-quality input data for subsequent model training. These features not only included basic information such as voltage and current but also introduced temporal features, such as the lowest discharge point time and average discharge time, thereby more comprehensively reflecting the battery’s health status. At the same time, the K-means clustering method was adopted to detect and process the outliers of CALCE data, which ensures the high quality of data and the stability of the model. The introduction of the CNN-LSTM model further improved the accuracy of SOH estimation. The model’s structure played a key role in achieving a superior performance. The CNN component extracted localized features from battery charge–discharge curves, enhancing the model sensitivity to battery state changes. Meanwhile, the LSTM component captured the temporal dependencies in the battery degradation process, improving the model’s ability to predict long-term trends. This combination enabled the model to monitor both instantaneous state changes and long-term development patterns. The experimental results demonstrated the excellent performance of the proposed CNN-LSTM model in battery SOH estimation tasks. On the CS2_33 and CS2_35 datasets of CALCE, the MAE, MBE, and RMSE of the model were 0.297% and 0.184%; −0.0.004%; and −0.111%, 0.339%, and 0.239%, respectively. Compared with the single CNN model, the MAE, MBE, and RMSE of the CNN-LSTM model decreased by about 0.16% and 0.5%; 0.4%; and 0.3%, 0.38%, and 0.86%, respectively. Compared with the single LSTM model, the MAE decreased by about 0.7% and 0.5%, the MBE decreased by about 1% and 0.56%, and the RMSE decreased by about 0.68% and 0.68%, respectively. On the NASA dataset, the MAE, MBE, and RMSE of the model were 0.442%, −0.341%, and 0.488%, respectively. Compared with the single CNN model, the MAE, MBE, and RMSE decreased by about 0.8%, 0.9%, and 0.9%, respectively. Compared with the single LSTM model, the MAE, MBE, and RMSE decreased by about 2.1%, 2%, and 2.4%, respectively. The findings of this study demonstrate that the proposed method provides a reliable methodological foundation for the sustainable operation and maintenance of energy storage systems.
This study has not achieved a breakthrough in SOH estimation methods but also its core algorithm is still based on the classical data-driven framework, which does not significantly exceed the theoretical boundaries set in the existing literature. However, this article has not fully discussed the model generalization ability of the battery system beyond the small-sample data scenario.
Future research will be extended in three directions: firstly, exploring the potential for migrating this model to new energy storage systems such as solid-state batteries and sodium-ion batteries; secondly, exploring data augmentation and robustness optimization methods to enhance the stability and reliability of the model under different data quality and noise conditions, particularly in new energy storage systems; thirdly, introducing transfer learning mechanisms to build an adaptive SOH estimation framework across temperatures and rates, and improving the model’s generalization performance under different operating conditions through pre-training.

Author Contributions

Conceptualization, C.T. (Changbin Tian); data curation, C.T. (Changbin Tian) and X.M.; formal analysis, C.T. (Changbin Tian); investigation, C.T. (Changbin Tian) and X.M.; software, C.T. (Chongyi Tian), X.D. and R.Z.; supervision, C.T. (Chongyi Tian) and R.Z.; validation, C.T. (Changbin Tian) and R.Z.; writing—original draft, X.M. All authors have read and agreed to the published version of the manuscript.

Funding

This research was funded by the National Natural Science Foundation of China (grant numbers 62203277, 62403292) and Shandong Provincial Natural Science Foundation (grant number ZR2022QF138).

Institutional Review Board Statement

Not applicable.

Informed Consent Statement

Not applicable.

Data Availability Statement

Data are contained within the article.

Conflicts of Interest

The authors declare no conflicts of interest.

References

  1. Gao, Z.; Zhao, Y.; Li, L.; Hao, Y. Economic effects of sustainable energy technology progress under carbon reduction targets: An analysis based on a dynamic multi-regional CGE model. Appl. Energy 2024, 363, 123071. [Google Scholar] [CrossRef]
  2. Khan, F.M.; Rasul, M.G.; Sayem, A.S.M.; Mandal, N.K. Design and optimization of lithium-ion battery as an efficient energy storage device for electric vehicles: A comprehensive review. J. Energy Storage 2023, 71, 108033. [Google Scholar] [CrossRef]
  3. Kong, D.P.; Lv, H.P.; Ping, P.; Wang, G.Q. A review of early warning methods of thermal runaway of lithium ion batteries. J. Energy Storage 2023, 64, 107073. [Google Scholar] [CrossRef]
  4. Guo, Y.; Yang, D.F.; Zhang, Y.; Wang, L.C.; Wang, K. Online estimation of SOH for lithium-ion battery based on SSA-Elman neural network. Prot. Control Mod. Power Syst. 2022, 7, 40. [Google Scholar] [CrossRef]
  5. Ruan, H.K.; He, H.W.; Wei, Z.B.; Quan, Z.Y.; Li, Y.W. State of Health Estimation of Lithium-Ion Battery Based on Constant-Voltage Charging Reconstruction. IEEE J. Emerg. Sel. Top. Power Electron. 2023, 11, 4393–4402. [Google Scholar] [CrossRef]
  6. Zhao, J.; Zhu, Y.; Zhang, B.; Liu, M.; Wang, J.; Liu, C.; Zhang, Y. Method of Predicting SOH and RUL of Lithium-Ion Battery Based on the Combination of LSTM and GPR. Sustainability 2022, 14, 11865. [Google Scholar] [CrossRef]
  7. Yang, S.J.; Zhang, C.P.; Jiang, J.C.; Zhang, W.G.; Zhang, L.J.; Wang, Y.B. Review on state-of-health of lithium-ion batteries: Characterizations, estimations and applications. J. Clean. Prod. 2021, 314, 128015. [Google Scholar] [CrossRef]
  8. Zhuang, D.B.; Li, M.L.; Lam, V.N.; Braatz, R.D.; Chueh, W.C.; Bazant, M.Z. Physics-Informed Design of Hybrid Pulse Power Characterization Tests for Rechargeable Batteries. J. Electrochem. Soc. 2024, 171, 050510. [Google Scholar] [CrossRef]
  9. Bruj, O.; Calborean, A. Lifecycle Evaluation of Lithium-Ion Batteries Under Fast Charging and Discharging Conditions. Batteries 2025, 11, 65. [Google Scholar] [CrossRef]
  10. Zhang, X.; Hou, J.W.; Wang, Z.K.; Jiang, Y.Q. Joint SOH-SOC Estimation Model for Lithium-Ion Batteries Based on GWO-BP Neural Network. Energies 2023, 16, 132. [Google Scholar] [CrossRef]
  11. Xu, Y.; Li, C.; Wang, X.; Zhang, H.; Yang, F.; Ma, L.; Wang, Y. Joint Estimation Method with Multi-Innovation Unscented Kalman Filter Based on Fractional-Order Model for State of Charge and State of Health Estimation. Sustainability 2022, 14, 15538. [Google Scholar] [CrossRef]
  12. Huang, P.; Gu, P.; Kang, Y.; Zhang, Y.; Duan, B.; Zhang, C. The state of health estimation of lithium-ion batteries based on data-driven and model fusion method. J. Clean. Prod. 2022, 366, 132742. [Google Scholar] [CrossRef]
  13. Obregon, J.; Han, Y.R.; Ho, C.W.; Mouraliraman, D.; Lee, C.W.; Jung, J.Y. Convolutional autoencoder-based SOH estimation of lithium-ion batteries using electrochemical impedance spectroscopy. J. Energy Storage 2023, 60, 106680. [Google Scholar] [CrossRef]
  14. Li, C.F.; Yang, L.; Li, Q.; Zhang, Q.S.; Zhou, Z.Y.; Meng, Y.Z.; Zhao, X.W.; Wang, L.; Zhang, S.M.; Li, Y.; et al. SOH estimation method for lithium-ion batteries based on an improved equivalent circuit model via electrochemical impedance spectroscopy. J. Energy Storage 2024, 86, 111167. [Google Scholar] [CrossRef]
  15. Xu, Z.C.; Wang, J.; Lund, P.D.; Zhang, Y.M. Co-estimating the state of charge and health of lithium batteries through combining a minimalist electrochemical model and an equivalent circuit model. Energy 2022, 240, 122815. [Google Scholar] [CrossRef]
  16. Hosseininasab, S.; Lin, C.W.; Pischinger, S.; Stapelbroek, M.; Vagnoni, G. State-of-health estimation of lithium-ion batteries for electrified vehicles using a reduced-order electrochemical model. J. Energy Storage 2022, 52, 104684. [Google Scholar] [CrossRef]
  17. Tian, J.P.; Xiong, R.; Yu, Q.Q. Fractional-Order Model-Based Incremental Capacity Analysis for Degradation State Recognition of Lithium-Ion Batteries. IEEE Trans. Ind. Electron. 2019, 66, 1576–1584. [Google Scholar] [CrossRef]
  18. Su, S.S.; Li, W.; Mou, J.H.; Garg, A.; Gao, L.; Liu, J. A Hybrid Battery Equivalent Circuit Model, Deep Learning, and Transfer Learning for Battery State Monitoring. IEEE Trans. Transp. Electrif. 2023, 9, 1113–1127. [Google Scholar] [CrossRef]
  19. Wen, J.P.; Chen, X.; Li, X.H.; Li, Y.K. SOH prediction of lithium battery based on IC curve feature and BP neural network. Energy 2022, 261, 125234. [Google Scholar] [CrossRef]
  20. Peng, S.M.; Zhu, J.C.; Wu, T.Z.; Tang, A.H.; Kan, J.R.; Pecht, M. SOH early prediction of lithium-ion batteries based on voltage interval selection and features fusion. Energy 2024, 308, 132993. [Google Scholar] [CrossRef]
  21. Qu, J.T.; Liu, F.; Ma, Y.X.; Fan, J.M. A Neural-Network-Based Method for RUL Prediction and SOH Monitoring of Lithium-Ion Battery. IEEE Access 2019, 7, 87178–87191. [Google Scholar] [CrossRef]
  22. Ren, Y.; Tang, T.; Jiang, F.S.; Xia, Q.; Zhu, X.Y.; Sun, B.; Yang, D.Z.; Feng, Q.; Qian, C. A novel state of health estimation method for lithium-ion battery pack based on cross generative adversarial networks. Appl. Energy 2025, 377, 124385. [Google Scholar] [CrossRef]
  23. Wu, J.; Cui, X.C.; Meng, J.H.; Peng, J.C.; Lin, M.Q. Data-Driven Transfer-Stacking-Based State of Health Estimation for Lithium-Ion Batteries. IEEE Trans. Ind. Electron. 2024, 71, 604–614. [Google Scholar] [CrossRef]
  24. Wang, F.J.; Zhai, Z.; Zhao, Z.B.; Di, Y.; Chen, X.F. Physics-informed neural network for lithium-ion battery degradation stable modeling and prognosis. Nat. Commun. 2024, 15, 4332. [Google Scholar] [CrossRef] [PubMed]
  25. Zhang, S.X.; Liu, Z.T.; Xu, Y.; Chen, G.W.; Su, H.Y. An Electrochemical Aging-Informed Data-Driven Approach for Health Estimation of Lithium-Ion Batteries with Parameter Inconsistency. IEEE Trans. Power Electron. 2025, 40, 7354–7369. [Google Scholar] [CrossRef]
  26. Zheng, Y.X.; Hu, J.X.; Chen, J.J.; Deng, H.W.; Hu, W.H. State of health estimation for lithium battery random charging process based on CNN-GRU method. Energy Rep. 2023, 9, 1–10. [Google Scholar] [CrossRef]
  27. Yang, N.K.; Song, Z.Y.; Hofmann, H.; Sun, J. Robust State of Health estimation of lithium-ion batteries using convolutional neural network and random forest. J. Energy Storage 2022, 48, 103857. [Google Scholar] [CrossRef]
  28. Van, C.N.; Quang, D.T. Estimation of SoH and internal resistances of Lithium ion battery based on LSTM network. Int. J. Electrochem. Sci. 2023, 18, 100166. [Google Scholar]
  29. Zhang, H.; Sun, H.L.; Kang, L.; Zhang, Y.; Wang, L.C.; Wang, K. Prediction of Health Level of Multiform Lithium Sulfur Batteries Based on Incremental Capacity Analysis and an Improved LSTM. Prot. Control Mod. Power Syst. 2024, 9, 21–31. [Google Scholar] [CrossRef]
  30. Pradyumna, T.K.; Cho, K.; Kim, M.; Choi, W. Capacity estimation of lithium-ion batteries using convolutional neural network and impedance spectra. J. Power Electron. 2022, 22, 850–858. [Google Scholar] [CrossRef]
  31. Park, M.S.; Lee, J.K.; Kim, B.W. SOH Estimation of Li-Ion Battery Using Discrete Wavelet Transform and Long Short-Term Memory Neural Network. Appl. Sci. 2022, 12, 3996. [Google Scholar] [CrossRef]
  32. Huang, J.; He, T.; Zhu, W.L.; Liao, Y.X.; Zeng, J.H.; Xu, Q.; Niu, Y.C. A lithium-ion battery SOH estimation method based on temporal pattern attention mechanism and CNN-LSTM model. Comput. Electr. Eng. 2025, 122, 109930. [Google Scholar] [CrossRef]
  33. Ji, X.Y.; Chen, Y.; Wang, J.F.; Zhou, G.D.; Lai, C.S.; Dong, Z.K. Time-Frequency Hybrid Neuromorphic Computing Architecture Development for Battery State-of-Health Estimation. IEEE Internet Things J. 2024, 11, 39941–39957. [Google Scholar] [CrossRef]
  34. He, Y.; Bai, W.Y.; Wang, L.L.; Wu, H.B.; Ding, M. SOH estimation for lithium-ion batteries: An improved GPR optimization method based on the developed feature extraction. J. Energy Storage 2024, 83, 110678. [Google Scholar] [CrossRef]
  35. Laszlo, M.; Mukherjee, S. A genetic algorithm that exchanges neighboring centers for k-means clustering. Pattern Recognit. Lett. 2007, 28, 2359–2366. [Google Scholar] [CrossRef]
  36. Guo, X.L.; Shan, Q.Y.; Zhang, Z.M.; Qu, Z.Y. Visual Extraction of Refined Operation Mode of New Power System Based on IPSO-Kmeans. Electronics 2023, 12, 2326. [Google Scholar] [CrossRef]
  37. Subbalakshmi, C.; Krishna, G.R.; Rao, S.K.M.; Rao, P.V. A Method to Find Optimum Number of Clusters Based on Fuzzy Silhouette on Dynamic Data Set. Proc. Int. Congr. Inf. Commun. Technol. 2015, 46, 346–353. [Google Scholar] [CrossRef]
  38. Neunzling, J.; Hainke, P.; Winter, H.; Henriques, D.; Fleckenstein, M.; Markus, T. Investigation of the Suitability of the DTV Method for the Online SoH Estimation of NMC Lithium-Ion Cells in Battery Management Systems. Batteries 2025, 11, 25. [Google Scholar] [CrossRef]
  39. Xia, F.; Wang, K.A.; Chen, J.J. State of health and remaining useful life prediction of lithium-ion batteries based on a disturbance-free incremental capacity and differential voltage analysis method. J. Energy Storage 2023, 64, 107161. [Google Scholar] [CrossRef]
  40. Gu, X.Y.; See, K.W.; Li, P.H.; Shan, K.H.; Wang, Y.P.; Zhao, L.; Lim, K.C.; Zhang, N. A novel state-of-health estimation for the lithium-ion battery using a convolutional neural network and transformer model. Energy 2023, 262, 125501. [Google Scholar] [CrossRef]
  41. Li, Q.L.; Li, D.Z.; Zhao, K.; Wang, L.C.; Wang, K. State of health estimation of lithium-ion battery based on improved ant lion optimization and support vector regression. J. Energy Storage 2022, 50, 104215. [Google Scholar] [CrossRef]
  42. Gou, B.; Xu, Y.; Feng, X. State-of-Health Estimation and Remaining-Useful-Life Prediction for Lithium-Ion Battery Using a Hybrid Data-Driven Method. IEEE Trans. Veh. Technol. 2020, 69, 10854–10867. [Google Scholar] [CrossRef]
  43. Xu, H.W.; Wu, L.F.; Xiong, S.Z.; Li, W.; Garg, A.; Gao, L. An improved CNN-LSTM model-based state-of-health estimation approach for lithium-ion batteries. Energy 2023, 276, 127585. [Google Scholar] [CrossRef]
  44. Tang, A.H.; Jiang, Y.H.; Yu, Q.Q.; Zhang, Z.G. A hybrid neural network model with attention mechanism for state of health estimation of lithium-ion batteries. J. Energy Storage 2023, 68, 107734. [Google Scholar] [CrossRef]
  45. Sonthalia, A.; Josephin, J.S.F.; Varuvel, E.G.; Chinnathambi, A.; Subramanian, T.; Kiani, F. A deep learning multi-feature based fusion model for predicting the state of health of lithium-ion batteries. Energy 2025, 317, 134569. [Google Scholar] [CrossRef]
  46. Fan, J.; Zhang, X.D.; Zou, Y.; He, J.T. Multitimescale Feature Extraction From Multisensor Data Using Deep Neural Network for Battery State-of-Charge and State-of-Health Co-Estimation. IEEE Trans. Transp. Electrif. 2024, 10, 5689–5702. [Google Scholar] [CrossRef]
  47. Elachhab, A.; Laadissi, E.; Tabine, A.; Hajjaji, A. Deep learning and data augmentation for robust battery state of charge estimation in electric vehicles. In Electrical Engineering; Springer: Berlin/Heidelberg, Germany, 2024. [Google Scholar]
  48. Bamati, S.; Chaoui, H.; Gualous, H. Enhancing Battery Thermal Management With Virtual Temperature Sensor Using Hybrid CNN-LSTM. IEEE Trans. Transp. Electrif. 2024, 10, 10272–10287. [Google Scholar] [CrossRef]
  49. Li, F.; Zuo, W.; Zhou, K.; Li, Q.Q.; Huang, Y.H. State of charge estimation of lithium-ion batteries based on PSO-TCN-Attention neural network. J. Energy Storage 2024, 84, 110806. [Google Scholar] [CrossRef]
  50. Ma, Y.; Shan, C.; Gao, J.W.; Chen, H. A novel method for state of health estimation of lithium-ion batteries based on improved LSTM and health indicators extraction. Energy 2022, 251, 123973. [Google Scholar] [CrossRef]
  51. Jafari, S.; Kim, J.; Byun, Y.C. Integrating ensemble learning and meta bagging techniques for temperature-specific State of Health prediction in Lithium-ion Batteries. Energy Rep. 2024, 12, 2388–2407. [Google Scholar] [CrossRef]
  52. Xing, Q.K.; Sun, X.W.; Fu, Y.P.; Wang, K. Lithium-ion battery health estimate based on electrochemical impedance spectroscopy and CNN-BiLSTM-Attention. Ionics 2025, 31, 1389–1403. [Google Scholar] [CrossRef]
Figure 1. The SOH prediction framework of the proposed method.
Sustainability 17 04014 g001
Figure 2. The capacity and SOH information of the CALCE dataset: (a) capacity attenuation curve; (b) SOH attenuation curve.
Sustainability 17 04014 g002
Figure 3. The capacity and SOH information of the NASA dataset: (a) capacity attenuation curve; (b) SOH attenuation curve.
Sustainability 17 04014 g003
Figure 4. Raw capacity data of CALCE dataset CS2: (a) raw capacity data of CS2_33; (b) raw capacity data of CS2_35.
Sustainability 17 04014 g004
Figure 5. CS2_33 Elbow method curve and Silhouette Score curve: (a) CS2_33 Elbow method curve; (b) CS2_33 Silhouette Score curve.
Sustainability 17 04014 g005
Figure 6. Outlier detection results based on K-means clustering method: (a) CS2_33 outlier detection results; (b) CS2_34 outlier detection results; (c) CS2_35 outlier detection results; (d) CS2_36 outlier detection results.
Sustainability 17 04014 g006
Figure 7. Voltage and current curves of CS2_35 battery under different SOH: (a) voltage curves of CS2_35 battery; (b) current curves of CS2_35 battery.
Sustainability 17 04014 g007
Figure 8. Cell structure of CNNs.
Sustainability 17 04014 g008
Figure 9. Cell structure of LSTM neural networks.
Sustainability 17 04014 g009
Figure 10. CNN-LSTM model structure.
Sustainability 17 04014 g010
Figure 11. CS2_33 prediction results and error: (a) CS2_33 prediction results; (b) CS2_33 prediction error based on CNN-LSTM.
Sustainability 17 04014 g011
Figure 12. CS2_35 prediction results and error: (a) CS2_35 prediction results; (b) CS2_35 prediction error based on CNN-LSTM.
Sustainability 17 04014 g012
Figure 13. B0005 prediction results and error: (a) B0005 prediction results; (b) B0005 prediction error based on CNN-LSTM.
Sustainability 17 04014 g013
Table 1. Description of battery parameters for the CALCE dataset.
CS2_33CS2_34CS2_35CS2_36
Capacity (mAh)1100110011001100
Charge rate (C)0.50.511
Discharge rate (C)0.50.511
Charge cut-off voltage (V)4.24.24.24.2
Discharge cut-off voltage (V)2.72.72.72.7
Cycle number540540628627
Table 2. Description of battery parameters for the NASA dataset.
B0005B0006
Capacity (mAh)20002000
Charge rate (C)1.51.5
Discharge rate (C)22
Charge cut-off voltage (V)4.24.2
Discharge cut-off voltage (V)2.72.5
Cycle number168168
Table 3. Correlation between health characteristics and SOH.
Health FactorCS2_33CS2_35
H11.00000.9778
H20.99980.9990
H30.82900.8702
H4−0.7659−0.8691
H50.0454−0.1425
H6−0.2669−0.2278
Table 4. Evaluation indexes of CS2_33 prediction results.
AlgorithmR2MAE (%)MBE (%)RMSE (%)
LSTM0.9740.9930.9921.023
CNN0.9870.459−0.3930.719
CNN-LSTM0.9970.297−0.0040.339
Table 5. Evaluation indexes of CS2_35 prediction results.
AlgorithmR2MAE (%)MBE (%)RMSE (%)
LSTM0.9710.683−0.6740.916
CNN0.9580.6840.4051.102
CNN-LSTM0.9980.184−0.1110.239
Table 6. Evaluation indexes of B0005 prediction results.
AlgorithmR2MAE (%)MBE (%)RMSE (%)
LSTM0.9052.5412.3102.930
CNN0.9791.254−1.2541.390
CNN-LSTM0.997350.442−0.3410.488
Disclaimer/Publisher’s Note: The statements, opinions and data contained in all publications are solely those of the individual author(s) and contributor(s) and not of MDPI and/or the editor(s). MDPI and/or the editor(s) disclaim responsibility for any injury to people or property resulting from any ideas, methods, instructions or products referred to in the content.

