Article

Driving Effects of Coal Mining Activities on Microbial Communities and Hydrochemical Characteristics in Different Zones

1
School of Resources and Geosciences, China University of Mining and Technology, Xuzhou 221116, China
2
Key Laboratory of Coalbed Methane Resources and Reservoir Formation Process, Ministry of Education, China University of Mining and Technology, Xuzhou 221008, China
*
Author to whom correspondence should be addressed.
Sustainability 2025, 17(9), 4000; https://doi.org/10.3390/su17094000
Submission received: 27 March 2025 / Revised: 18 April 2025 / Accepted: 26 April 2025 / Published: 29 April 2025

Abstract

Elucidating the microbial–hydrochemical interactions in distinct functional zones of coal mines holds significant implications for groundwater pollution mitigation strategies in mining regions. Taking Xinji No. 2 Coal Mine as an example, 15 water samples (including surface water, goaf water, sump water, working face drainage, rock roadway water, and coal roadway water) were collected from six surface and underground areas for hydrochemical and microbial detection analysis. The results show that bacterial genera such as Exiguobacterium and Mycobacterium cannot adapt to high-salinity environments with elevated K+ + Na+ concentrations, showing negative correlation with TDS. Microbial communities related to sulfate serve as important indicators for microbial technology-based pollution control in coal mine groundwater, where sulfate-reducing bacteria (e.g., norank_f__Desulfuromonadaceae) can reduce SO42− concentrations and improve mine water quality. Low dissolved oxygen (DO) concentrations lead to decreased abundance of aerobic microorganisms, hindering the formation of stable microbial communities in mines. Affected by mine water quality, the confluence of mine drainage into rivers results in HCO3 and SO42− concentrations at the confluence being higher than upstream, which gradually return to upstream concentrations after entering the downstream. However, due to the influx of nitrogen cycle-related bacteria and organic matter from mine water into surface water, increased microbial physiological activities and carbon sources cause NO3 concentrations to increase more than tenfold. The formation stages of mine water quality exhibit regional characteristics, with goaf areas showing distinct hydrochemical components and microbial communities compared to other zones. Based on this research, new microbial approaches for groundwater pollution control in coal mining areas are proposed: (1) selecting and cultivating functional microorganisms (such as SRB and organic matter-degrading bacteria) to develop biological materials for mine water remediation; (2) regulating the transformation of elements by adjusting carbon sources and oxygen supply according to indigenous microbial requirements, thereby reducing pollutant concentrations in water bodies.

1. Introduction

Large quantities of mine water are discharged from deep underground to the surface during coal mining processes [1]. Polluted mine water released to the surface severely damages the ecological environment of mining areas [2,3]. Mine water quality is primarily determined by water sources in the mine, fragmented ore, and coal strata, as well as mechanical materials and waste discharge related to human activities [4,5]. Therefore, to implement groundwater pollution prevention and control in coal mining areas, it is essential to first clarify the hydrochemical characteristics and formation mechanisms of mine water and surface water in the mining area. Microbial community structures in water can largely reflect and influence these hydrochemical characteristics [6,7,8]. Current research on microorganisms in coal mining areas predominantly focuses on the formation mechanisms of acidic goaf water and its ecological impacts after discharge to the surface [9,10,11], while studies on the response relationships between microbial community structures and hydrochemical characteristics across different underground and surface functional zones in coal mines remain scarce.
Microbial community structures and hydrochemical characteristics vary across different coal mine zones (e.g., working faces, goaf areas, coal roadways, rock roadways, sumps, and surface drainage systems) due to distinct disturbance environments and material sources in these regions [12]. The coal extracted from working faces contains abundant organic matter and associated minerals (e.g., sulfides), which can provide nutrients for microbial growth [13]. After goaf areas are sealed, collapsed roof materials fill the working faces, and water accumulates among the collapsed coal and rock masses. Over time, rising water levels and declining oxygen concentrations drive dynamic water–coal and water–rock reactions mediated by microorganisms [14,15]. As main ventilation channels, coal and rock roadways, with their relatively high oxygen levels, may host redox-sensitive bacteria [16]. Sumps (particularly mine-bottom sumps), which collect mine water, likely integrate the microbial community structures and hydrochemical features of all underground zones.
This study selects Xinji No. 2 Coal Mine in the Maoji Experimental District, Huainan City, Anhui Province, as a representative Carboniferous–Permian coalfield. A total of 15 water samples were collected from six functional zones involved in mine water formation, collection, and discharge (including 4 surface water, 2 goaf water, 1 sump water, 2 working face drainage, 3 rock roadway water, and 3 coal roadway water samples) for hydrochemical composition analysis and microbial community sequencing. Multivariate statistical methods were applied to explore the coupled response relationships between microbial community structures and hydrochemical characteristics across different functional zones, aiming to elucidate microbial features and environmental response processes. This research aims to investigate the regional characteristics of hydrochemistry and microbiology of mine water throughout its entire life cycle underground, which can provide strategies for efficient utilization and pollution prevention of mine water.

2. Materials and Methods

2.1. Study Area Overview and Sample Collection

Xinji No. 2 Coal Mine is located in the Huaihe River alluvial plain, where surface water systems are well developed, including the Xi Fei River, which receives mine drainage from the mine and flows southeast into the Huaihe River. The mine began operations in 1996 with an annual production capacity of 2.7 million tons. It is divided into three levels: above −550 m, −550 to −750 m, and below −750 m, with an auxiliary level at −650 m. Current production focuses on the −550 to −750 m level in Zones 22 and 23, primarily targeting the No. 9, 8, 6-1, and 1 coal seams. Over the past three years (January 2020 to October 2022), the maximum mine water inflow was 421.7 m3/h, with a normal inflow of 350.1 m3/h. The mine water mainly originates from mixed water sources of roof sandstone and nappe structures in the 13-1 and 11-2 coal seams, supplemented by roof sandstone water from the No. 8 and 6 coal seams. No limestone water inflow from the floor was observed during the mining of the No. 1 coal seam.
During coal seam mining, water sources flow through water-conducting fractures to form initial mine water, which then passes through rock roadways, coal roadways, or goaf areas before being collected in the central sump and pumped to surface storage ponds for temporary retention and treatment. To study mine water throughout its entire life cycle, 15 sampling points were established across six surface and underground functional zones. The research team collected 2 working face drainage samples, 3 rock roadway seepage samples, 3 coal roadway water accumulation samples, 2 goaf water samples with different cessation periods, 1 shaft-bottom sump water sample, and 4 surface water samples. Detailed descriptions of each sample are provided in Table 1. Each water sample was divided into two polyethylene bottles (2 L and 5 L), and stored and transported at 4 °C in dark conditions. The 2 L samples were used for hydrochemical analysis, while the 5 L samples were filtered through sterile 0.22 μm polytetrafluoroethylene membranes. The filter membranes were stored at −80 °C for subsequent microbial testing.

2.2. Hydrochemical Characterization

During on-site sampling, water quality parameters including pH, oxidation-reduction potential (ORP), dissolved oxygen (DO), and electrical conductivity (EC) were measured using a multiparameter water quality analyzer (HI 9829, Hanna, Italy). This water quality analyzer was calibrated and verified in situ before the measurements. Within 48 h of sampling, bicarbonate (HCO3) and carbonate (CO32−) concentrations were determined in the laboratory using a titrator (887 Titino plus, Metrohm, Switzerland). Inductively coupled plasma optical emission spectrometry (ICP-OES, VARIAN, Germany) was employed to analyze Na+ + K+, Ca2+, Mg2+, and Fe concentrations. Nitrate (NO3), nitrite (NO2), sulfate (SO42−), and chloride (Cl) were measured using ion chromatography (MagIC Net, Metrohm, Switzerland). Total dissolved solids (TDS) were quantified via the gravimetric method. The limits of quantification and precision are shown in Supplementary Table S1.

2.3. DNA Extraction and 16S rRNA Gene Sequencing

For microbial analysis, total DNA was extracted using a soil genomic DNA extraction kit (MP Biomedical, Santa Ana, CA, USA). The concentration and purity of the extracted DNA were assessed using a NanoDrop 2000 UV-Vis spectrophotometer (Thermo Scientific, Wilmington, DE, USA). PCR products were excised from 2% agarose gels, purified using the AxyPrep DNA Gel Extraction Kit (Axygen Biosciences, Union City, CA, USA), and quantified before sequencing on the MiSeq PE300 platform (Illumina, San Diego, CA, USA). Other details are explained in Supplementary Materials.

2.4. Tools for Processing and Statistical Analysis

Microbial sequence data underwent OTU (Operational Taxonomic Unit) clustering via the UPARSE 11 algorithm (97% similarity threshold), with subsequent OTU frequency and diversity statistics calculated using Usearch 11 tools. Representative OTU sequences were classified using both the RDP Classifier 2.13 and the SILVA rRNA database to ensure robust taxonomic assignment [17]. Chao, Shannon, and Simpson indices were calculated using Mothur 1.30.2 after rarefying all samples to the minimum sequencing depth. Bray–Curtis dissimilarity matrices were generated and visualized via non-metric multidimensional scaling analysis (NMDS) in Qiime 1.9.1. KEGG Ortholog (KO) profiles were inferred using PICRUSt2 2.2.0.
Hydrochemical analysis was performed using AqQA software to generate Piper and Durov diagrams for water type classification. Half-box plots were constructed using Origin 2024 to visualize parameter distributions. Prior to co-occurrence network construction, correlation analyses were computed using R (Version 4.1.3) with the psych package, applying Spearman’s rank correlation with false discovery rate (FDR) correction. In the Gephi-0.9.2 software, a co-occurrence network was constructed to visualize the relationships between microbial communities and environmental variables [18]. Microbial functional profiles were inferred through PICRUSt2 (Phylogenetic Investigation of Communities by Reconstruction of Unobserved States) analysis of 16S rRNA amplicon data, employing the default pipeline with KEGG (Kyoto Encyclopedia of Genes and Genomes) Orthology pathway predictions [19].

3. Results and Discussion

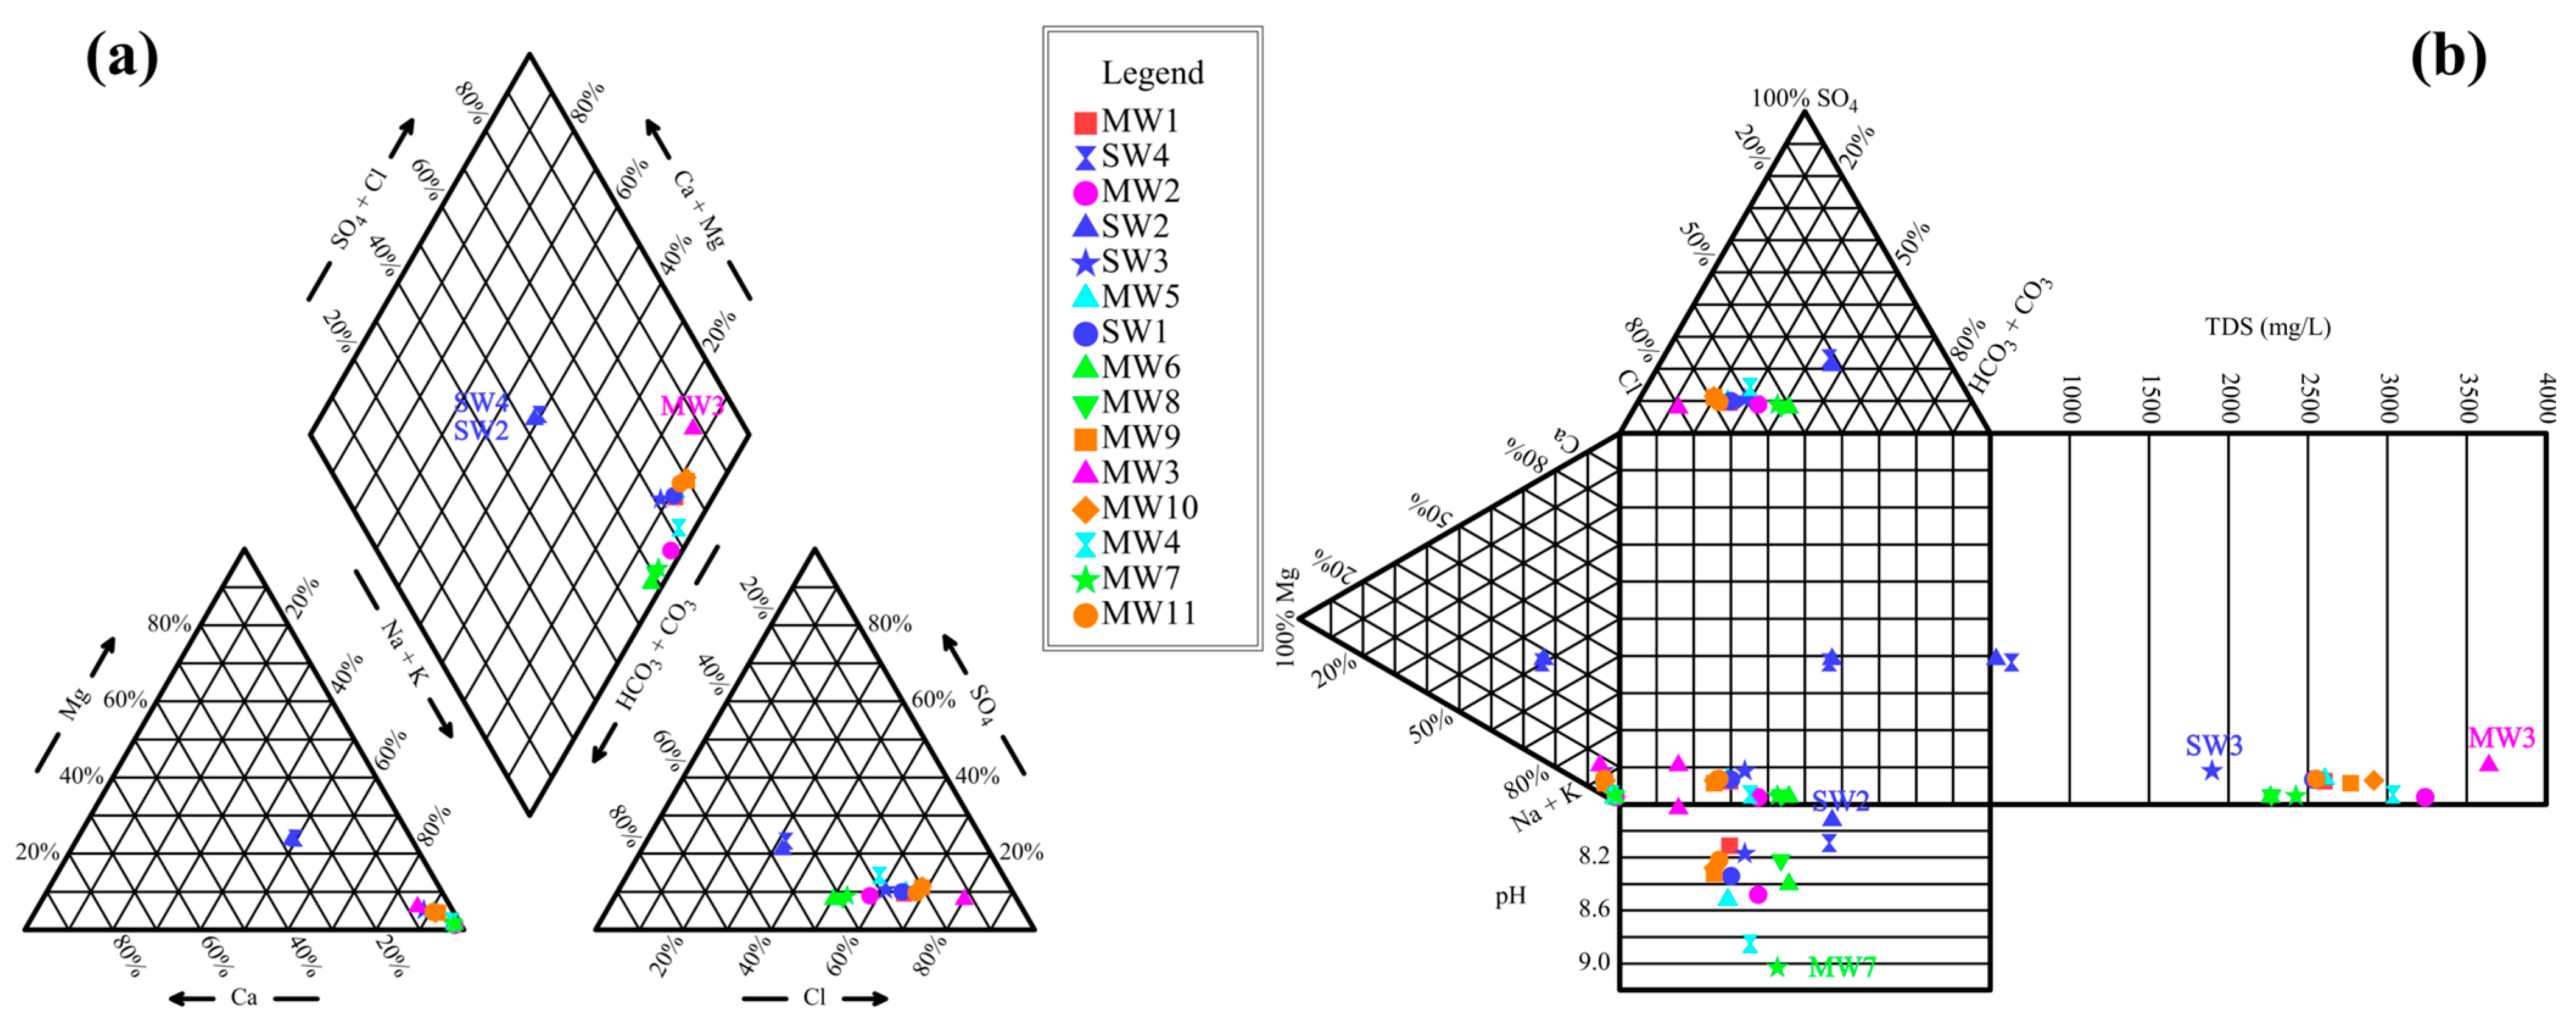
3.1. Spatial Distribution Characteristics of Hydrochemical Components

The hydrochemical characteristics of surface water and mine water from six functional zones, as obtained from testing, are shown in Figure 1. The upstream Xi Fei River sample (SW2) and downstream Xi Fei River sample (SW4) cluster closely, but are distant from all other samples. Their hydrochemical type is HCO3 Na·Ca, distinct from other samples (Cl-Na type), with significantly lower TDS (0.54 g/L and 0.64 g/L, respectively), indicating weak hydraulic connectivity between surface water and mine aquifer recharge in the mining area. Additionally, the surface drainage outlet sample (SW1) and the confluence of surface drainage and river sample (SW3) share the same hydrochemical type as other mine water samples, suggesting that during the confluence at SW3, mine drainage volume exceeds river flow, resulting in hydrochemical consistency with mine water. However, at the downstream SW4 sampling point, continuous upstream water replenishment ultimately restores the hydrochemical type to surface water characteristics. Furthermore, the goaf water samples from the West Main Roadway sealed walls at −650 m (MW2) and −550 m (MW3) show distinct clustering, with MW3 exhibiting higher Cl concentrations than MW2. This indicates longer closure time and stronger rock-salt leaching in the −550 m goaf compared to the −650 m goaf. Both samples, however, display low sulfate (SO42−) concentrations, suggesting limited pyrite oxidation in the mine.
To analyze similarities and differences in hydrochemical characteristics across the six functional zones, half-box plots of hydrochemical components were plotted (Figure 2). The goaf water samples MW3 and MW2 exhibit significantly higher TDS (3.64 g/L and 3.24 g/L, respectively) than other zones. The primary contributors to TDS are Cl (1.82 g/L and 1.22 g/L), HCO3 (0.48 g/L and 1.17 g/L), and K+ + Na+ (1.20 g/L and 1.14 g/L), with minimal contributions from SO42− (0.24 g/L and 0.26 g/L). The reasons are as follows: (1) Oxidation dominance: High DO and ORP in goaf water indicate suboptimal goaf sealing, promoting oxidative reactions that elevate TDS. (2) Pyrite oxidation: Goaf water SO42− (0.24–0.26 g/L) exceeds rock roadway water (0.16–0.17 g/L), despite similar direct water sources. This suggests pyrite oxidation in the goaf, generating SO42−, H+, and iron hydroxides (Equations (1)–(3)), increasing SO42−concentrations by 50.95% compared to rock roadway water. (3) Hydraulic retention: Longer closure time in the −550 m goaf enhances water—rock interactions, leading to higher TDS than the −650 m goaf. Previous studies have revealed that even across different mining areas, regardless of variations in coal seam formation age, mining depth, and coal type, the pH in goaf is consistently the lowest among all underground zones [20]. This indicates that after formation, goaf undergoes similar environmental changes, such as progressive hypoxia and reduced organic input, leading to unique biogeochemical reactions. Importantly, these reactions exhibit cross-regional consistency. The environmental dynamics occurring in goaf areas may follow identical mechanisms. Understanding these patterns enables both ecological risk early warning and proactive intervention during the “critical window period”.
Additionally, the rock roadway water sample MW7 exhibited the highest pH value in the entire study area at 9.03, primarily due to the release of OH ions from calcium oxide in the shotcrete lining of the rock roadway reacting with water. In contrast, the goaf water sample MW3 recorded the lowest pH of 7.83 in the study area, lower than the pH of 8.48 for MW2, a goaf water sample with a shorter closure period. This further demonstrates that after the cessation of coal mining in working faces, the formation of goaf areas leads to rising water levels in sealed zones, where goaf water permeates collapsed coal and rock masses. Enhanced pyrite oxidation reactions in these conditions release H+, resulting in pH reduction. The pH values of surface drainage outlet SW1 (8.34), surface drainage-river confluence SW3 (8.17), downstream Xi Fei River SW4 (8.09), and upstream Xi Fei River SW2 (7.92) collectively indicate that mine water generally exhibits higher pH levels compared to surface water. Notably, the nitrate concentration (NO3) in the downstream Xi Fei River (0.07 g/L) far exceeds levels in other mine and surface water samples. This suggests that the influx of mine water significantly elevates nitrate concentrations in mid-to-lower river reaches—a particularly intriguing phenomenon requiring further analysis through subsequent testing.
2FeS2 + 7O2 + 2H2O → 2FeSO4 + 2H2SO4
FeSO4 + 2H2O → Fe(OH)2 + 2H2SO4
4Fe(OH)2 + O2 + 2H2O → 4Fe(OH)3

3.2. Differences in Microbial Diversity and Community Structure Across Zones

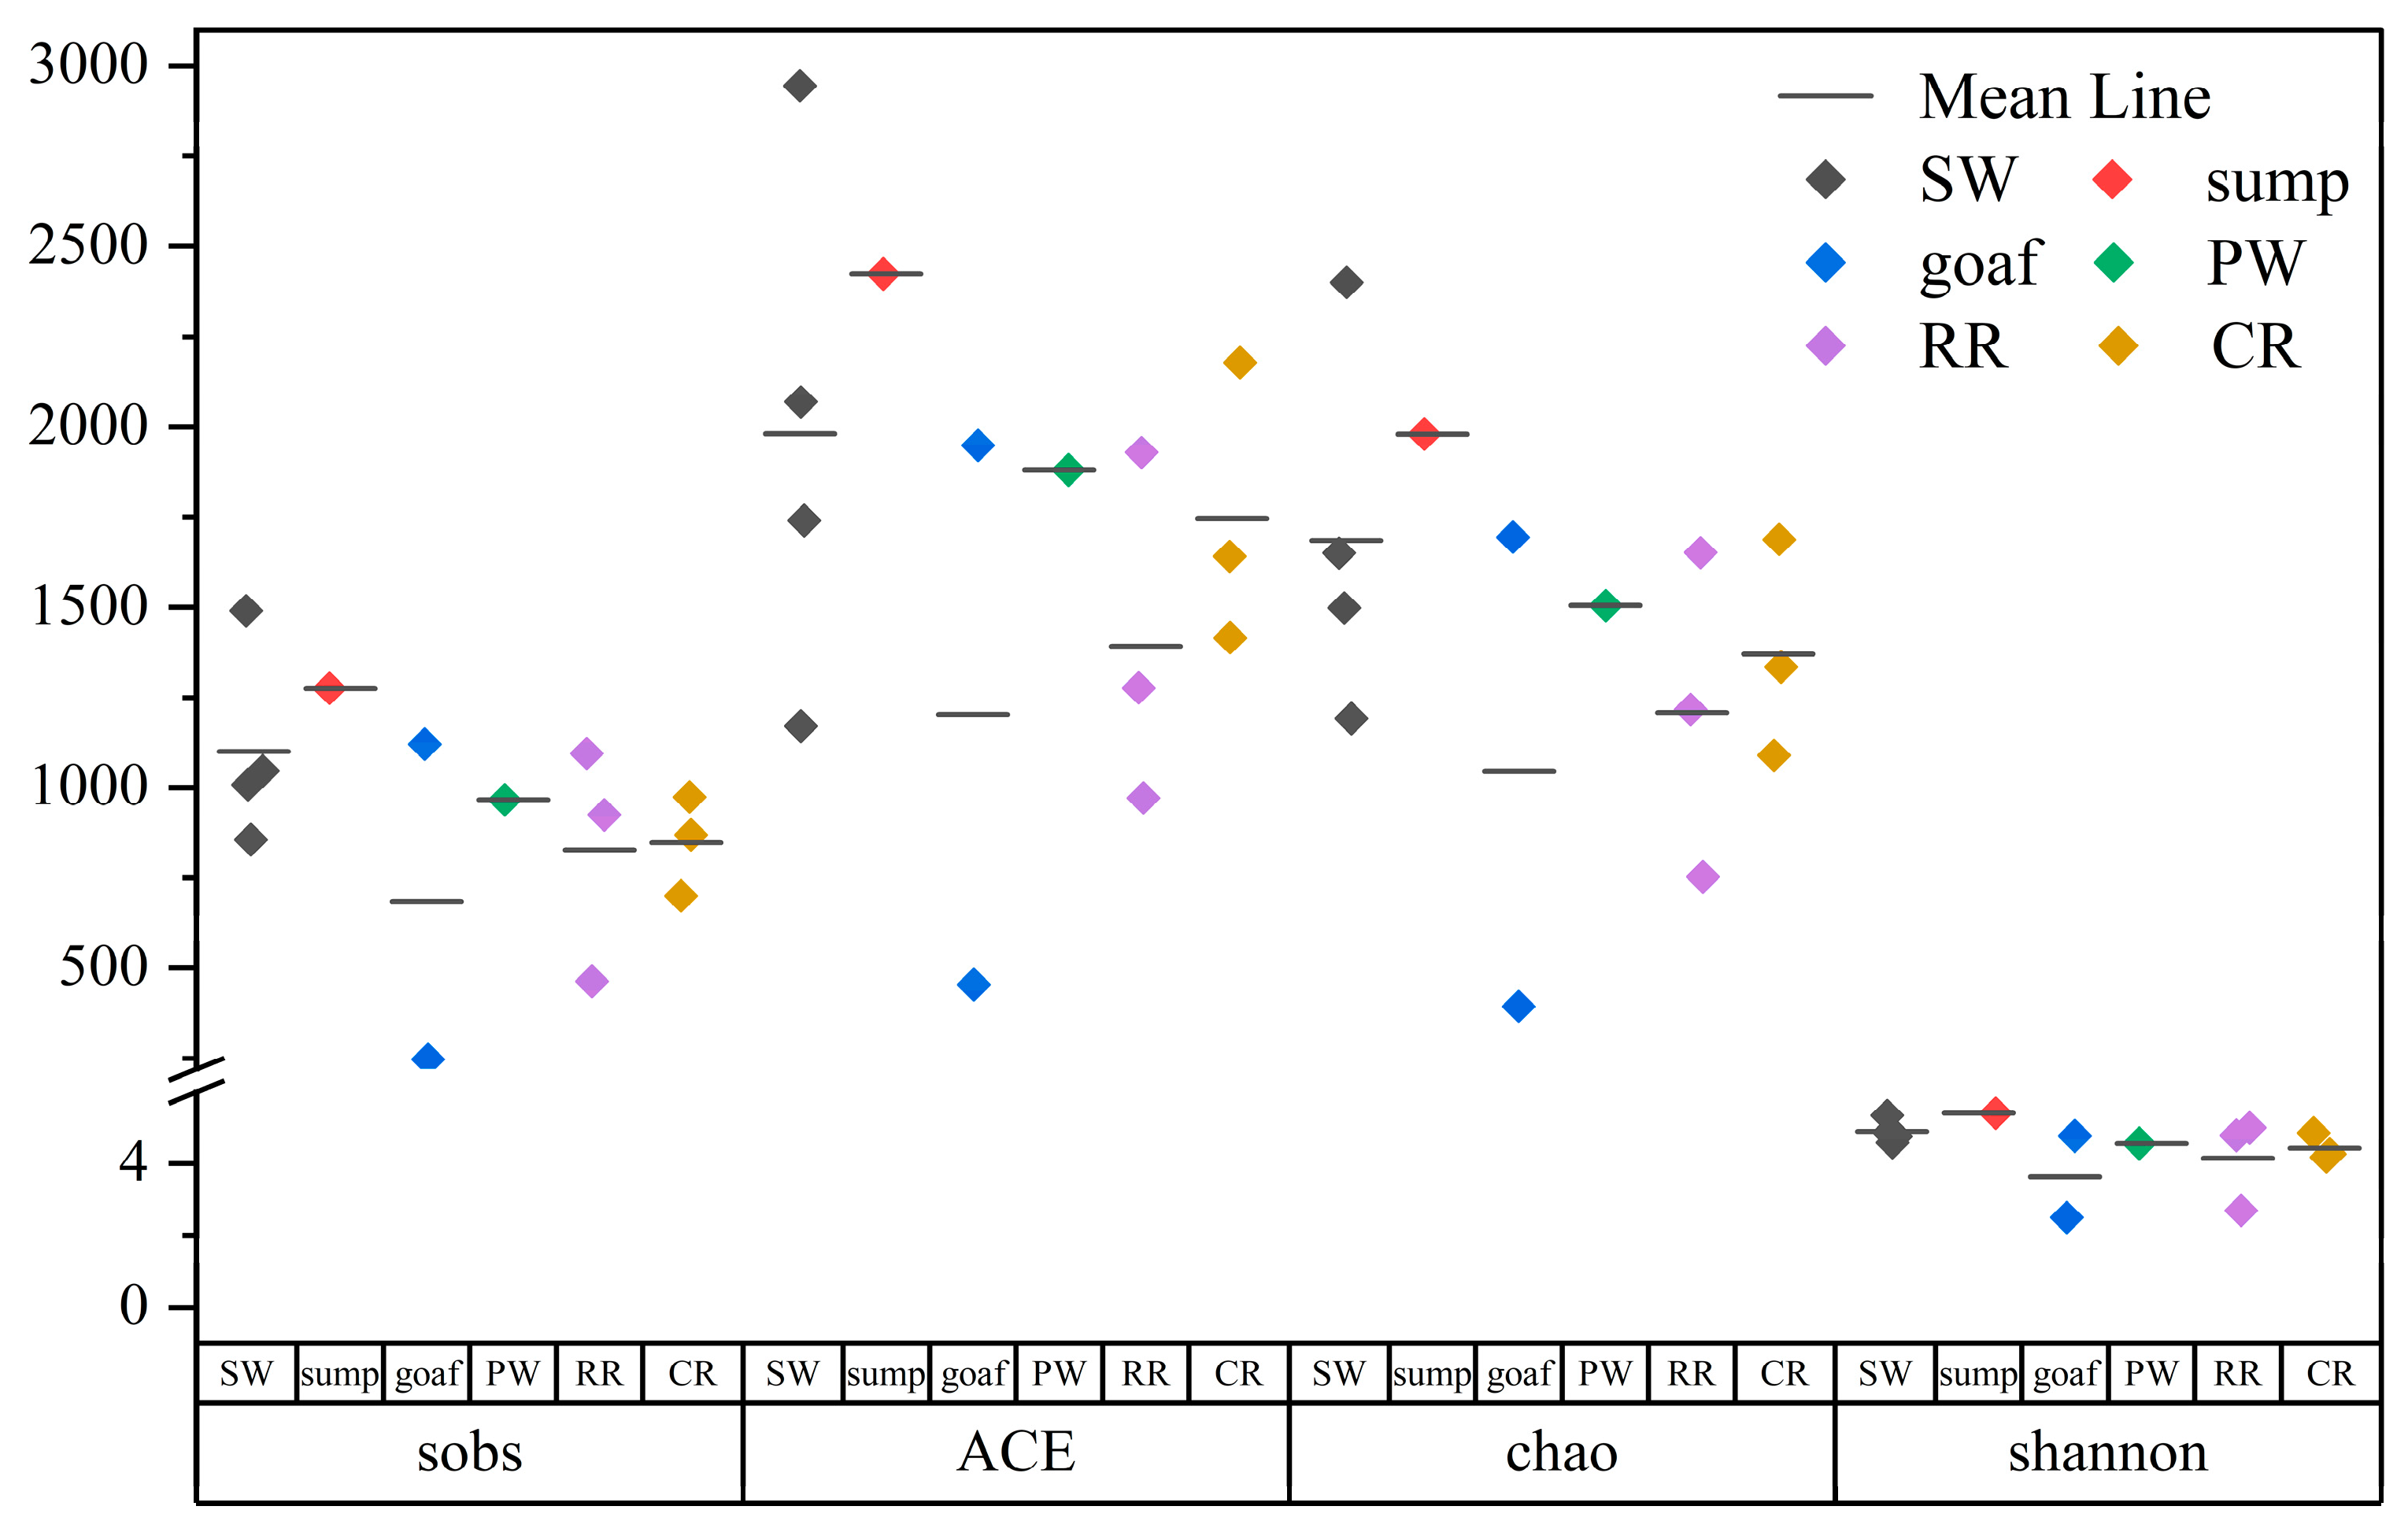
3.2.1. Analysis of Microbial Community Diversity

Miseq high-throughput sequencing successfully generated sequence data for 14 samples (sample MW4 from working face drainage was excluded due to insufficient DNA extraction for microbial analysis). The diversity indices of microbial communities in water samples from different functional zones were calculated based on the sequencing data of the 14 samples, as shown in Figure 3 and Table S2. The ACE and Chao indices estimate microbial community richness, with higher values indicating greater richness. The Shannon and Simpson indices assess diversity: a higher Shannon index or a lower Simpson index corresponds to increased diversity. The Coverage index (sequencing depth) evaluates sampling completeness, where values closer to 100% imply more reliable sequencing data. The effective sequence counts per sample ranged from 49,091 to 65,285. The number of observed OTUs (Sobs) per sample varied between 248 and 1491, with sample coverage ranging from 96.75% to 99.53%, indicating high microbial detection rates.
The average richness and diversity of microbial communities across zones followed the order: sump water > surface water > working face drainage > coal roadway water > rock roadway water > goaf water. Sump water samples exhibited the highest richness and diversity, while goaf water samples showed the lowest. This disparity arises because sumps collect mine water from various zones and contain bottom sediment sludge, creating favorable conditions for diverse microbial survival. In contrast, goaf areas are relatively enclosed with weak hydraulic conditions, leading to prolonged biogeochemical reactions that simplify microbial community structures and reduce evenness. These findings align with previous research on the Menkeqing Coal Mine in Ordos [21]. Additionally, surface drainage outlet sample SW1 displayed the highest individual richness, suggesting that temperature changes, oxygenation, and light exposure after sump water discharge to the surface promote the growth of certain bacterial genera, enhancing sample richness. Goaf water sample MW2 (−650 m) exhibited the lowest richness and diversity, indicating a singular community structure and poor habitat conditions. In contrast, MW3 (−550 m), another goaf water sample, showed distinct characteristics, possibly due to inherently simpler microbial communities during its formation or differences in closure duration and hydraulic conditions.
After rarefying the total sequence data from all samples, species analysis revealed the distribution of unique and shared microbial taxa at the genus level across the six functional zones (Figure 4). Surface water samples (SW) contained the highest number of unique taxa, further supporting the notion that sump water discharge to the surface stimulates the growth of specific bacterial genera, as seen in SW1’s exceptional richness. Working face drainage samples (PW) had the fewest unique taxa, primarily due to high coal dust content in the drainage, where organic compounds in coal exhibit toxic effects on microorganisms, particularly in high-coal drainage channels. Although sump water samples displayed the highest average richness and diversity, their unique taxa count was relatively low, as sumps integrate drainage from all underground zones, inheriting most microbial genera from these areas and lacking distinct uniqueness.
Non-Metric Multidimensional Scaling (NMDS) analysis reflects the similarity and diversity of microbial community composition between samples through distances between sample points. The stress value < 1 indicates reliable ordination results. The distribution of microbial community differences among the 14 samples is shown in Figure 5, with a stress value of 0.078, confirming the reliability of the analysis. The relatively clustered distribution of sample points within each group suggests similarity in community structures within groups. Within the SW group, the distribution of sample points indicates that the microbial community structure of surface river water is influenced by mine drainage. Specifically, the discharge of high-richness mine drainage from SW1 into the Xi Fei River results in elevated microbial richness at the confluence (SW3) compared to upstream river water (SW2), with a subsequent moderate increase in richness observed in downstream river water (SW4). Sump water sample MW1, working face drainage sample MW5, and coal roadway water (CR) group samples cluster in the same region, indicating that the microbial community structure of sump water remains largely unchanged after collecting partial mine drainage.

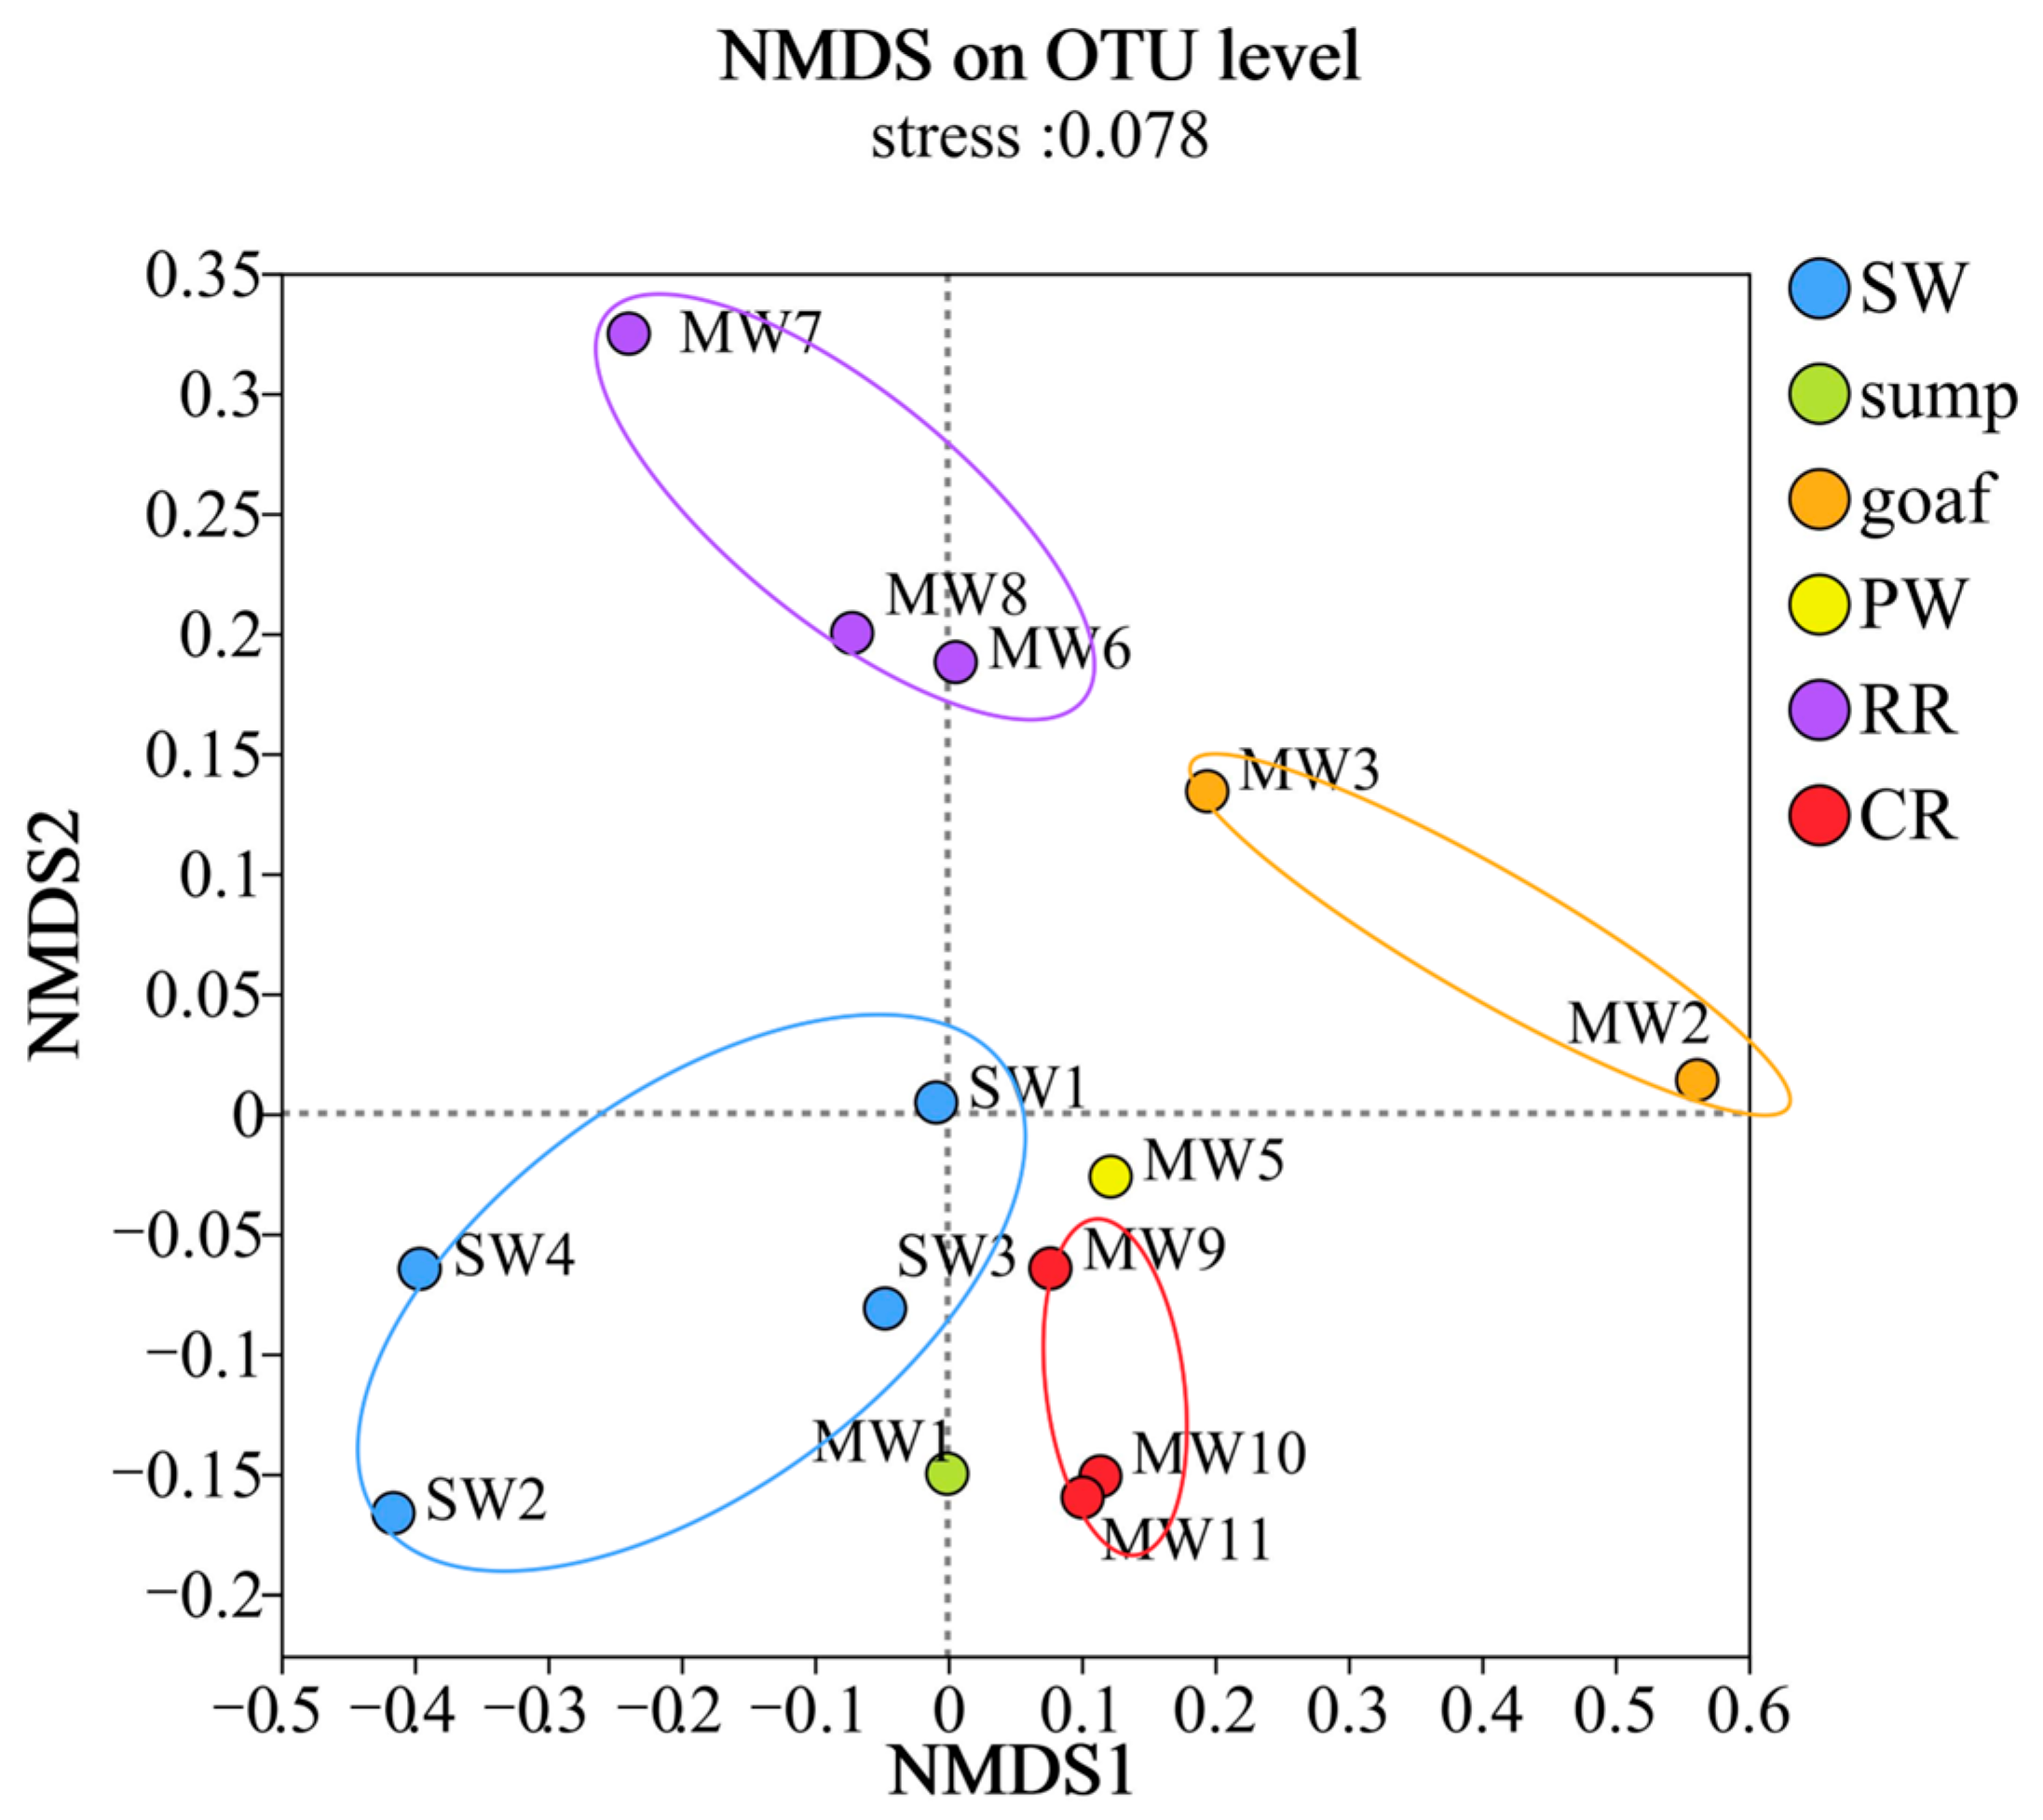
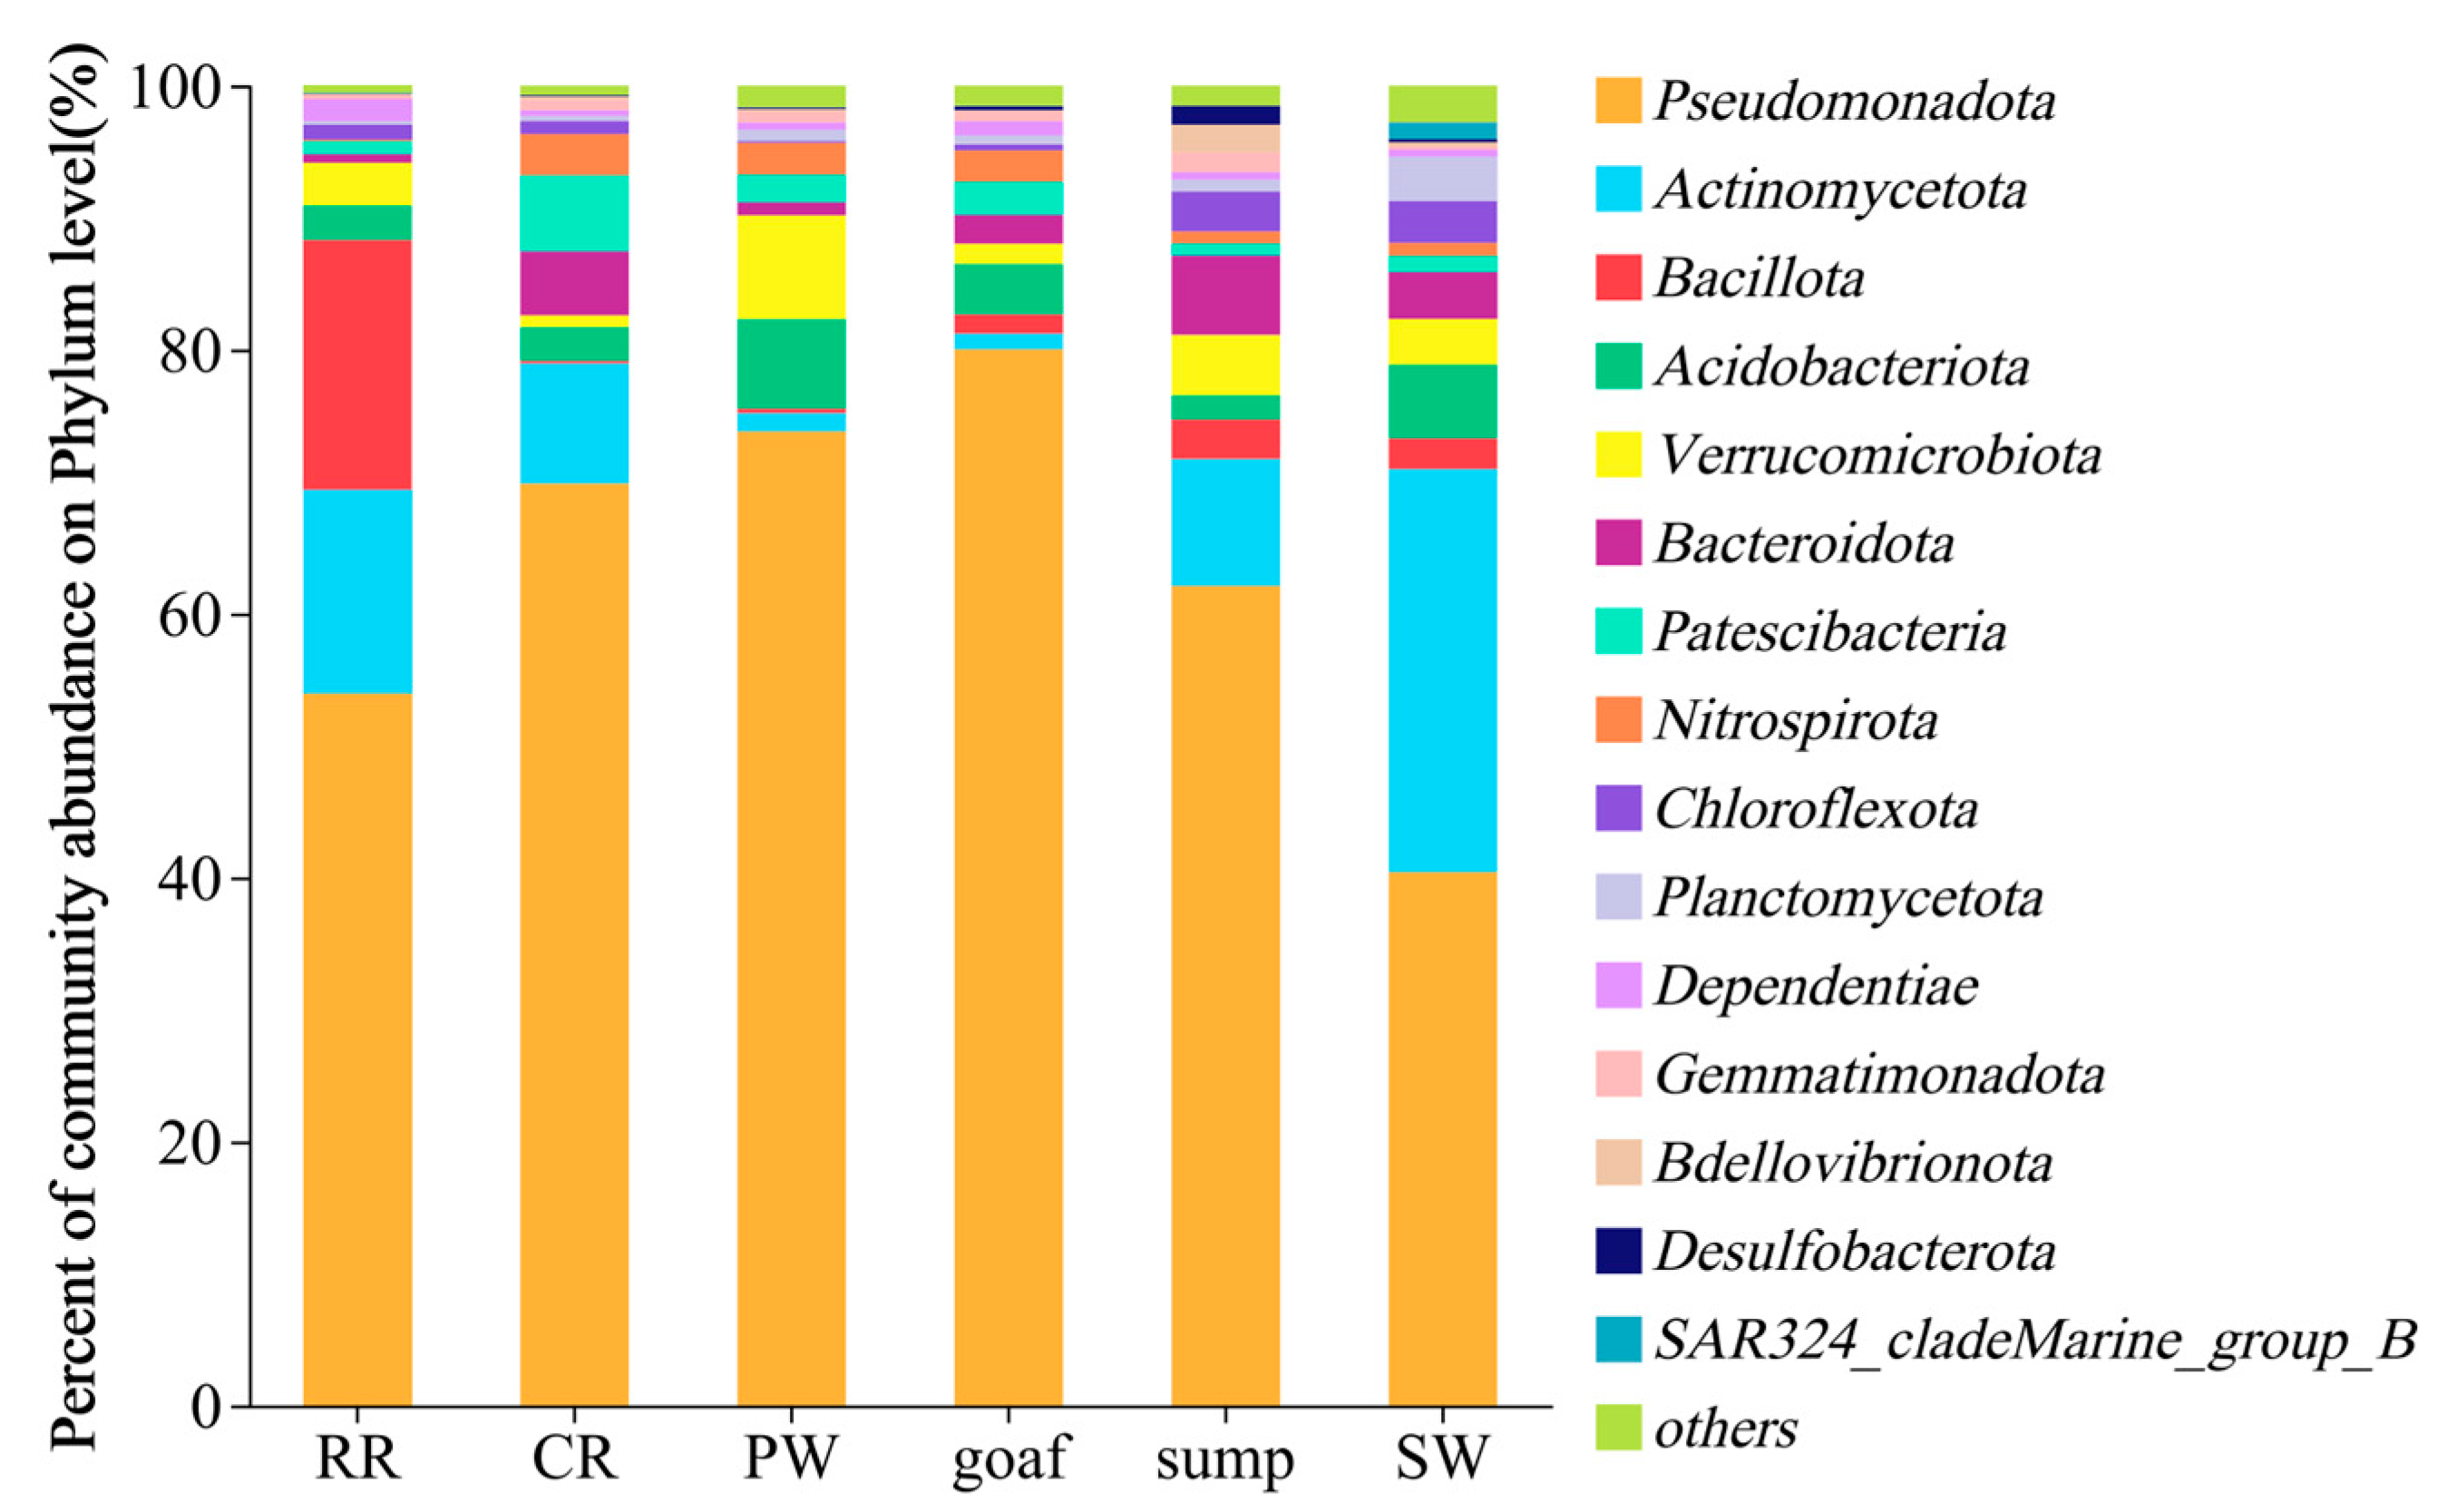
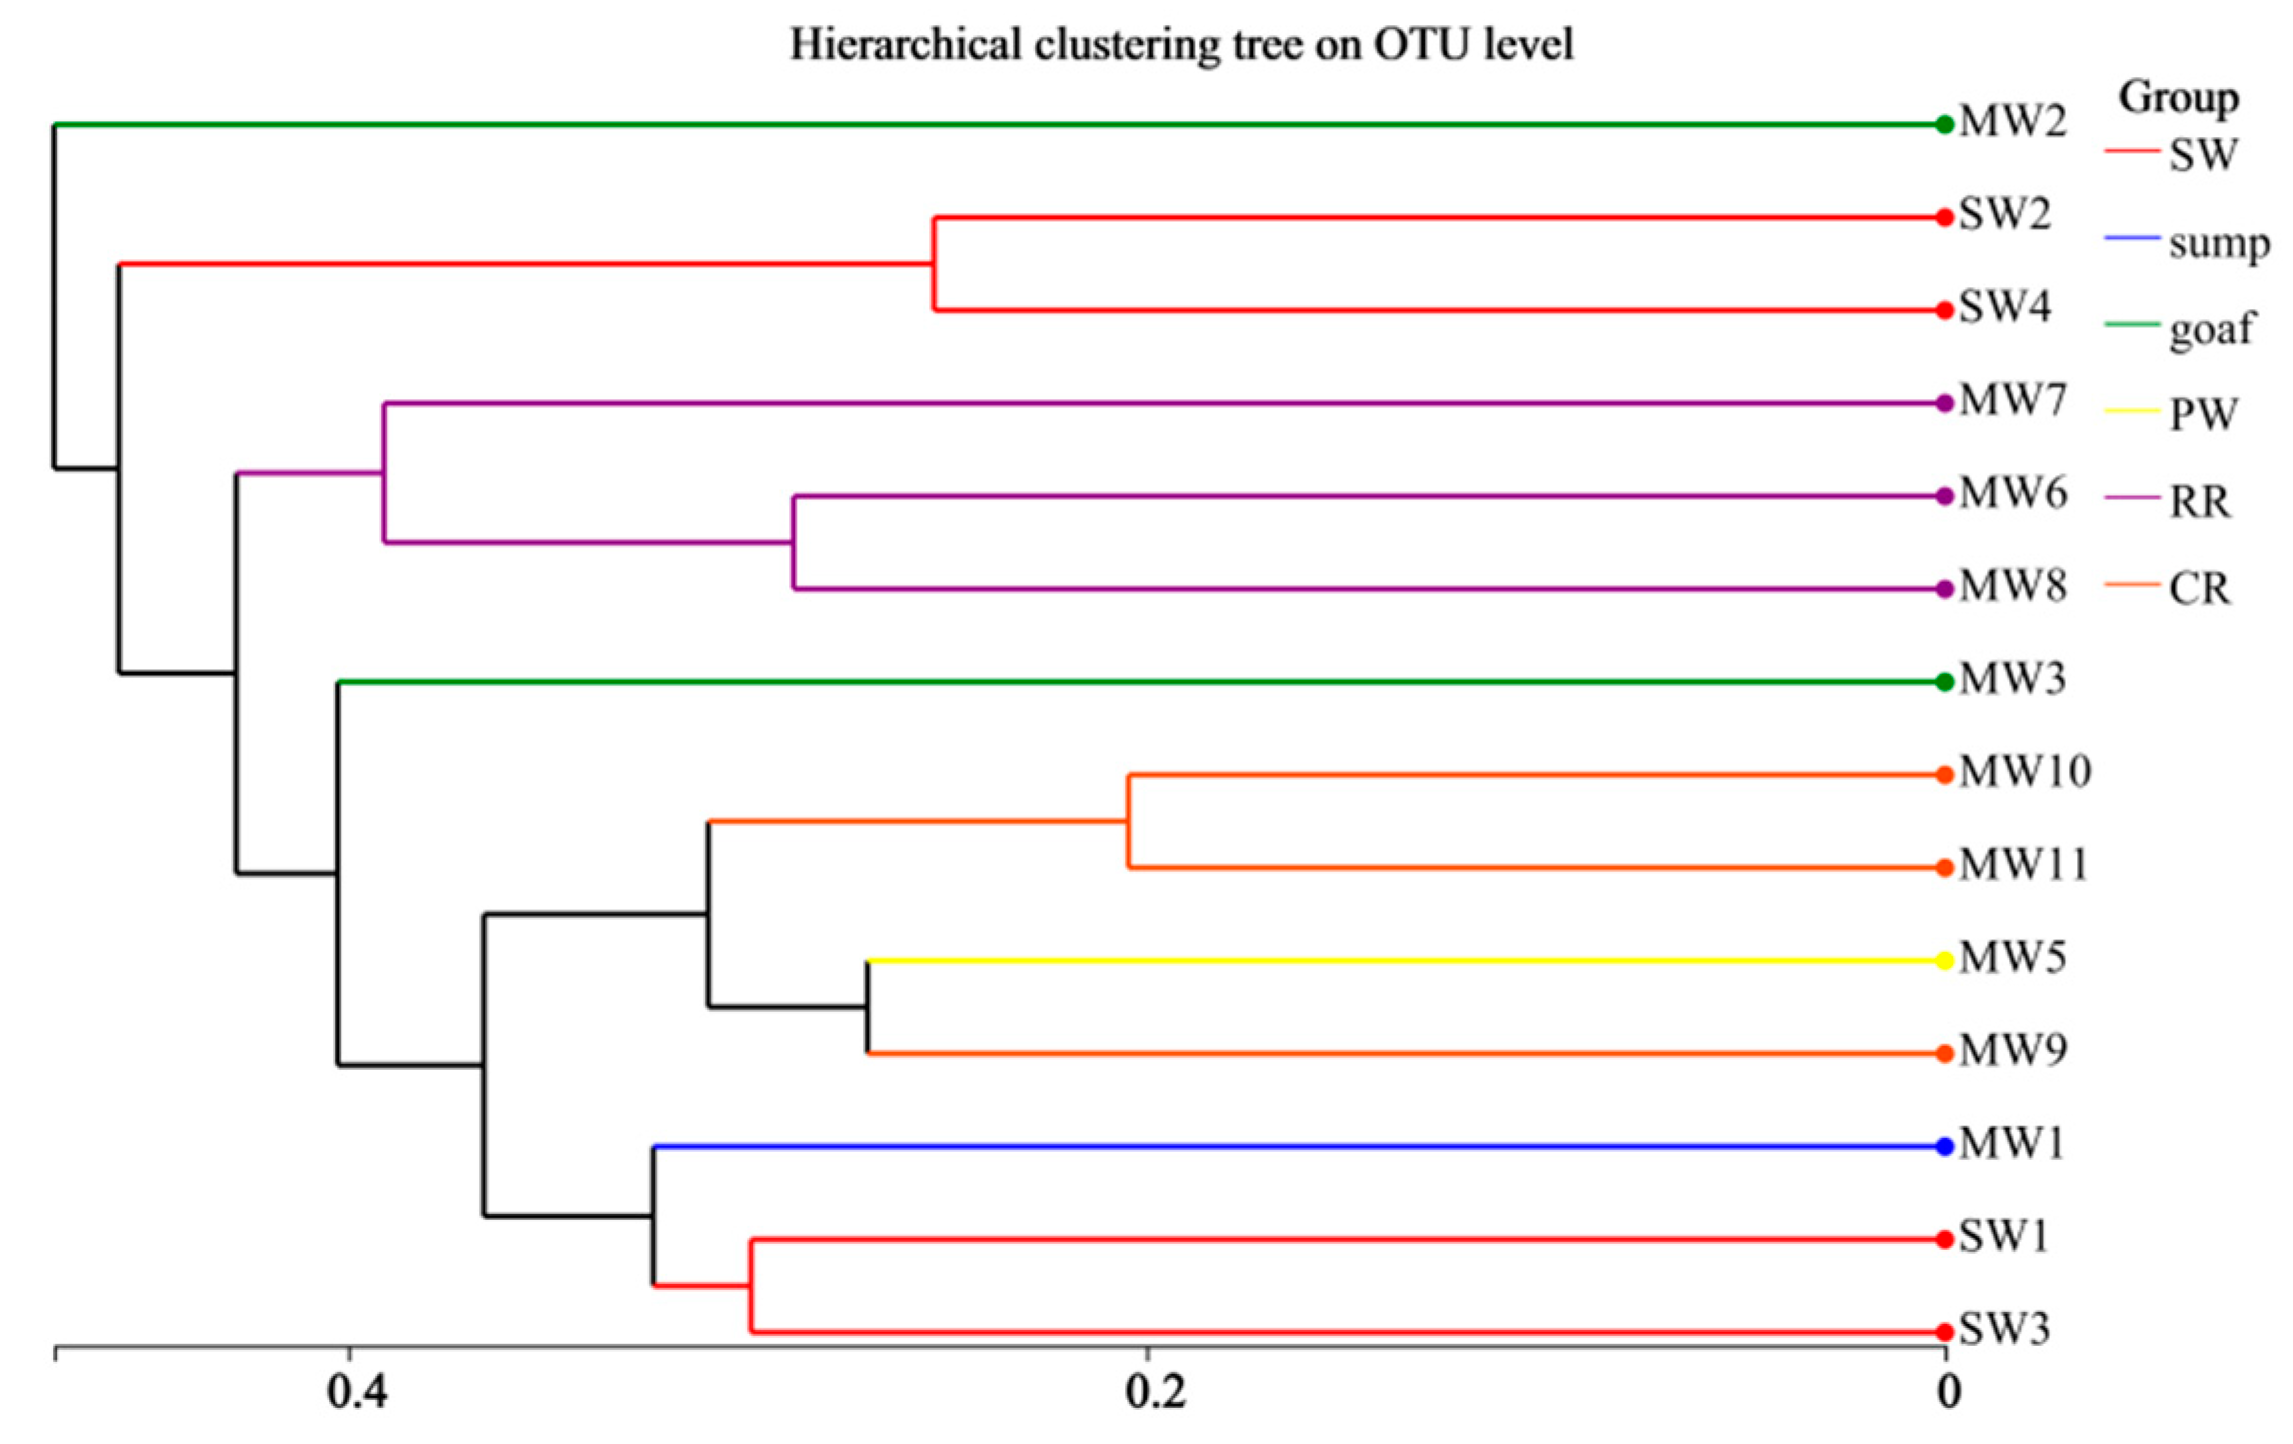
3.2.2. Composition and Differential Analysis of Microbial Community Structures

After merging bacterial phyla with relative abundances below 1%, a relative abundance bar chart at the phylum level was generated for each sample group (Figure 6). A total of 15 phyla were detected, with Pseudomonadota (40.40–80.00%) being the most abundant, followed by Actinomycetota (1.20–30.55%). These results align with dominant phyla reported in other mining areas [21]. Additionally, Bacillota, Acidobacteriota, and Verrucomicrobiota were detected in all groups. The rock roadway water (RR) group exhibited the highest mean abundance of Bacillota (18.91%), while Acidobacteriota and Verrucomicrobiota showed peak abundances in the working face drainage (PW) group (6.77% and 7.87%, respectively).
To further investigate differences in microbial community structures between groups, the Kruskal–Wallis H test was applied. This test is suitable for comparing multiple groups (≥3) with ≥2 samples per group. Surface water (SW), rock roadway water (RR), and coal roadway water (CR) groups met these criteria. The test results at the phylum level (Figure 7) revealed significant differences (p < 0.05) in the abundances of Actinomycetota, Bacillota, Patescibacteria, and Nitrospirota among the three groups. These differences correlate with environmental parameter variations and the survival requirements of these phyla. For example, Actinomycetota, predominantly aerobic, exhibited higher abundance in the surface water (SW) group.
On the genus level, after merging taxa with relative abundances below 2%, a relative abundance bar chart was plotted (Figure 8). Dominant genera included Erythrobacter (0.65–21.08%), Pedomicrobium (0.27–8.86%), and Novosphingobium (0.40–9.45%). Goaf water samples showed the highest abundance of Erythrobacter but lower abundances of Pedomicrobium and Novosphingobium. Erythrobacter, a key genus in organic matter degradation [22], releases Cl and elevates HCO3 during chlorinated organic compound degradation. This aligns with Figure 2, where goaf water samples exhibited the highest Cl and HCO3 concentrations, with MW2 showing the peak HCO3 value. Additionally, hgcI_clade reached 6.32% abundance in surface water (SW) samples but was undetected in goaf water. Norank_f__Xanthomonadaceae and Roseovarius were highly abundant in goaf water (10.27% and 8.83%, respectively) but scarce in other groups.
The results of genus-level intergroup differential significance testing for surface water (SW), rock roadway water (RR), and coal roadway water (CR) groups are shown in Figure 9. Among the top 15 genera in abundance, seven genera—CL500-29_marine_group, Dietzia, Aquicella, norank_o__Zavarziniales, Limnohabitans, TM7a, and Mycobacterium—exhibited significant differences (p < 0.05) across the three groups, accounting for nearly half of the total. This highlights distinct microbial community structures among the SW, RR, and CR groups. CL500-29_marine_group showed higher abundance in the SW group, a genus previously identified as dominant in surface water systems such as rivers and lakes [23]. The RR group exhibited notably high abundance of Dietzia, a genus known for hydrocarbon degradation capabilities.
To investigate differences in community structures, hierarchical clustering analysis was performed on the sample distance matrix, generating a clustering tree (Figure 10). Branch lengths represent sample dissimilarities, with colors denoting group affiliations. All samples initially split into two major clusters: one containing the −650 m goaf water sample MW2, and the other encompassing the remaining samples. Within the latter cluster, upstream (SW2) and downstream (SW4) river samples formed a sub-cluster, while surface drainage outlet (SW1), drainage-river confluence (SW3), and bottom sump water (MW1) grouped together, reflecting that the sump serves as the final collection point before mine water discharge to the surface. Rock roadway water samples (MW6, MW7, MW8) clustered into a single branch with similar community compositions. Coal roadway water samples (MW9, MW10, MW11) and working face drainage sample MW5 formed another branch, indicating shared material sources and environmental conditions between coal roadway water and working face drainage. The −550 m goaf water sample MW3, formed earlier than the −650 m goaf sample MW2, occupied a distant branch, reflecting temporal and environmental divergence. The hierarchical clustering analysis reveals two critical insights: Goaf water as a pollution control priority: Due to its long-term retention and enclosed nature, goaf water requires targeted pollution prevention measures. Representative sampling strategy: The sampling design effectively captures the full life cycle of mine water formation, collection, and discharge. Additionally, coal roadway water, as a precursor to goaf water, offers an opportunity for early intervention. If goaf water is identified as a pollution source, preventive measures can be implemented during the coal roadway water stage to mitigate contamination risks.

3.3. Correlation Between Microbial Communities and Environmental Characteristics

Due to interactions and transformations among environmental factors, collinear relationships exist between some variables. Using variance inflation factor (VIF) analysis, 10 environmental factors with low collinearity and strong relevance to microbial activities were selected. Canonical correspondence analysis (CCA) at the genus level was conducted (Figure 11). Points represent samples, and vectors represent environmental factors. In Figure 11, sample points generally cluster by group but include intra-group outliers: Surface water (SW) samples SW2 and SW4 are distant from others because they originate from surface rivers with no direct hydraulic connection to mine water. Goaf water sample MW2 (−650 m) is isolated, likely due to its prolonged closure time or its unique environmental features, such as the highest dissolved oxygen (DO: 6.97 mg/L) and HCO3 concentration among all samples. Rock roadway water (RR) sample MW7 is an outlier, possibly due to its lowest DO (1.84 mg/L), highest CO32− concentration, and highest pH (9.03) in the dataset. Samples from the RR group cluster in the fourth quadrant, showing negative correlation with DO. Environmental factor vectors reveal strong correlations (p < 0.05) between microbial community composition and six factors: K+ + Na+ (r2 = 0.711, p = 0.001), HCO3 (r2 = 0.739, p = 0.001), CO32− (r2 = 0.84, p = 0.026), SO42− (r2 = 0.506, p = 0.013), pH (r2 = 0.627, p = 0.027), and DO (r2 = 0.739, p = 0.013). Among these, K+ + Na+ and HCO3 exhibit highly significant correlations. K+ + Na+, the dominant cations in water chemistry, positively correlate with TDS, while HCO3 is closely linked to microbial metabolic activity. The “anomalous” microbial community compositions reflect unique environmental conditions, and microbial growth activities reciprocally drive changes in mine water quality.
For the top 50 genera in relative abundance across samples, Spearman correlation coefficients were calculated to quantify relationships between microorganisms and environmental factors. Genera–environment pairs with absolute correlation coefficients |r| > 0.5 and p < 0.05 were retained. A co-occurrence network was constructed using Gephi-0.9.2 to visualize interactions (Figure 12). Nodes in the network are color-coded by modules, with node size proportional to abundance (concentration). Red and green edges represent positive and negative correlations, respectively, with edge thickness indicating correlation strength. Modularity analysis divided the network into five modules, accounting for 10.53%, 5.26%, 26.32%, 34.21%, and 23.68% of the network, respectively. Except for Module 2, the “hub” nodes (most connected nodes) in all modules were environmental factors: HCO3, TDS, SO42−, and DO. Module 1 (HCO3 hub): HCO3 exhibited strong correlations with seven genera. Notably, it showed a negative correlation with CL500-29_marine_group (r = −0.704, p = 0.005) and a positive correlation with Dietzia (r = 0.697, p = 0.006). CL500-29_marine_group efficiently utilizes dissolved organic matter (DOM) and often associates with hgcl_clade [24]. Reduced DOM consumption decreases HCO3, a key byproduct of microbial organic degradation, explaining the negative correlation. Dietzia, a potent degrader of petroleum hydrocarbons and polycyclic aromatic hydrocarbons (PAHs), showed positive correlations with environmental factors. Module 3 (TDS hub): TDS had 10 correlations, with only three genera showing positive relationships. Most genera, such as Exiguobacterium and Mycobacterium, were negatively correlated with TDS, indicating poor adaptation to high salinity. In contrast, Roseovarius (salt-tolerant species) and Mesorhizobium (heavy metal resistance) showed positive correlations [25]. Module 4 (SO42− hub): SO42−, the most central node with the highest connectivity, highlights sulfur’s role as a critical energy source for microbial communities. Generated from coal seams and mining equipment, SO42− is a major pollutant in mine water, making its associated microbial groups vital for groundwater pollution control using microbial technologies. Module 5 (DO hub): All edges in this module were negative (red), including correlations with typically aerobic genera like Dietzia. This suggests multiple Dietzia species in the mining area, whose survival depends not solely on oxygen but also on salinity, pH, and other factors. However, low DO due to poor ventilation and hydraulic conditions reduce microbial diversity and community stability compared to surface environments.

3.4. Impact of Mine Drainage on Microbial Community Structures in Surface Rivers

Mine water collected in the bottom sump is discharged to the surface after treatment. Whether the discharged mine water affects the microbial community structure and water quality of rivers requires further verification. A genus-level microbial community bar chart was generated for four samples: upstream Xi Fei River (SW2), surface drainage outlet (SW1), drainage-river confluence (SW3), and downstream Xi Fei River (SW4). Taxa with abundances below 2% were merged (Figure 13). CL500-29_marine_group and hgcI_clade were dominant genera in surface river water, both commonly found in surface water systems [26]. CL500-29_marine_group accounted for 17.92% and 16.0% in upstream (SW2) and downstream (SW4) river samples, respectively, while hgcI_clade constituted 17.87% and 3.63% in the same samples. This suggests that CL500-29_marine_group exhibits stronger environmental adaptability than hgcI_clade. After mine water inflow at the confluence (SW3), both genera declined in abundance due to environmental changes. However, CL500-29_marine_group gradually recovered to upstream levels downstream, likely due to its adaptability. Mycobacterium (a genus of aerobic heterotrophs) was detected in all surface samples but reached its highest abundance (13.11%) at the confluence (SW3). This proliferation reflects the combined effects of nutrient influx from mine drainage and aerobic conditions in surface environments. While underground environments offer abundant nutrients but limited oxygen, surface settings provide oxygen but fewer nutrients. The confluence zone uniquely combines both factors, promoting Mycobacterium growth. Genera such as norank_f__Blastocatellaceae and Aquicella were exclusively detected in the surface drainage outlet (SW1) and confluence (SW3) samples. This highlights distinct microbial compositions between mine drainage and natural river water, as well as the sensitivity of certain taxa to environmental shifts. Changes in water conditions (e.g., nutrient availability, oxygen concentrations) may eliminate or reduce the abundance of specific microorganisms.
As shown in Figure 14, after mine drainage enters the river, the pH and TDS values of the river water increase significantly, with a slight rise in dissolved oxygen (DO). However, by the downstream section, the concentrations of major ions (SO42−, HCO3) and TDS return to upstream levels, while NO3 concentrations continue to rise, reaching 73.6 mg/L downstream—a tenfold increase. This indicates that mine drainage influences nitrogen cycling in the water. The elevated HCO3 levels may result from increased surface oxygen levels and the influx of nitrogen cycle-related bacteria and organic matter from mine water, which enhance microbial activity and carbon/nutrient availability. Studies have shown that hgcI_clade, a dominant genus in surface rivers, is closely linked to nitrogen cycling, with responsive relationships to denitrification and nitrogen fixation genes [27]. Based on the KEGG database, nitrogen metabolism-related pathways and gene distributions were analyzed (Figure 15). In the four surface water samples, the abundance of nitrification genes (pmoA-amoA, pmoB-amoB, pmoC-amoC, and hao) increased sharply in the downstream sample (SW4) but remained lower in upstream (SW2) and drainage outlet (SW1) samples, with a notable decline at the confluence (SW3). This suggests that mine drainage exhibits the strongest denitrification capacity, supported by its low DO and NO3 concentrations. The influx of carbon/nitrogen sources and microorganisms from mine drainage, combined with elevated oxygen concentrations in discharge water, may alter redox reaction directions. Controlling the oxygen levels in certain areas of a coal mine site (via nitrogen injection) may induce positive changes in the concentrations of redox-sensitive components.
Additionally, HCO3 is one of the products of microbial organic degradation. Previous diversity index analysis revealed that the surface drainage outlet (SW1) and drainage-river confluence (SW3) samples exhibit higher microbial richness than upstream and downstream river samples, with SW1 showing the highest diversity. This suggests frequent microbial degradation reactions at these locations. The elevated temperature of underground mine water discharged to the surface may also accelerate degradation rates, leading to higher HCO3 concentrations detected at these points. Downstream, as microbial communities stabilize and water temperatures equilibrate with the river, HCO3 concentrations decrease accordingly.
Sulfur-bearing minerals in coal, such as pyrite and gypsum, interact with groundwater during mining activities through dissolution and oxidation, increasing SO42− concentrations in mine water. Consequently, SO42− levels at the drainage outlet (SW1) and confluence (SW3) exceed those in upstream and downstream river samples. For microbial communities, SO42− serves as a reactant for sulfate-reducing bacteria (SRB, e.g., norank_f__Desulfuromonadaceae) during organic matter degradation. Downstream reductions in SO42− concentrations are attributed to river dilution and SRB-mediated sulfate reduction processes. These findings indicate the potential of employing SRB-based biotechnological approaches to mitigate sulfate levels in coal mine drainage.
In summary, mine drainage does not significantly alter major ion concentrations in surface water but profoundly affects redox-sensitive substances (e.g., NO3) and induces shifts in microbial community composition. Furthermore, during winter sampling, the higher temperature of mine drainage compared to surface water influenced not only chemical reaction rates but also microbial survival, thereby shaping aquatic community structures and physicochemical properties. Therefore, the long-term and comprehensive impacts of mine drainage on river microbial communities and their environments require further investigation to establish holistic conclusions.

4. Conclusions

In summary, this study conducted sampling and analysis of hydrochemical and microbial community characteristics in different zones affected by coal mining disturbances. It investigated zonal features in mine water quality formation and explored microbial community-driven mechanisms of water quality evolution, providing new regional management and microbial-based strategies for mine water pollution control. The main conclusions are as follows:
(1)
The hydrochemical type of mine water in the Xinji mining area is Cl-Na, while surface water exhibits a HCO3−Na·Ca type. This distinct difference indicates weak hydraulic connectivity between mine aquifers and surface water. The hydrochemical characteristics of goaf water are closely related to closure duration, sealing efficiency, and associated minerals in coal. Microbial community richness and diversity across six functional zones follow the order: sump water > surface water > working face drainage > coal roadway water > rock roadway water > goaf water. After sump water is discharged to the surface, changes in temperature, light exposure, and oxygenation promote the growth of specific bacterial genera, resulting in the highest richness at the surface drainage outlet (SW1).
(2)
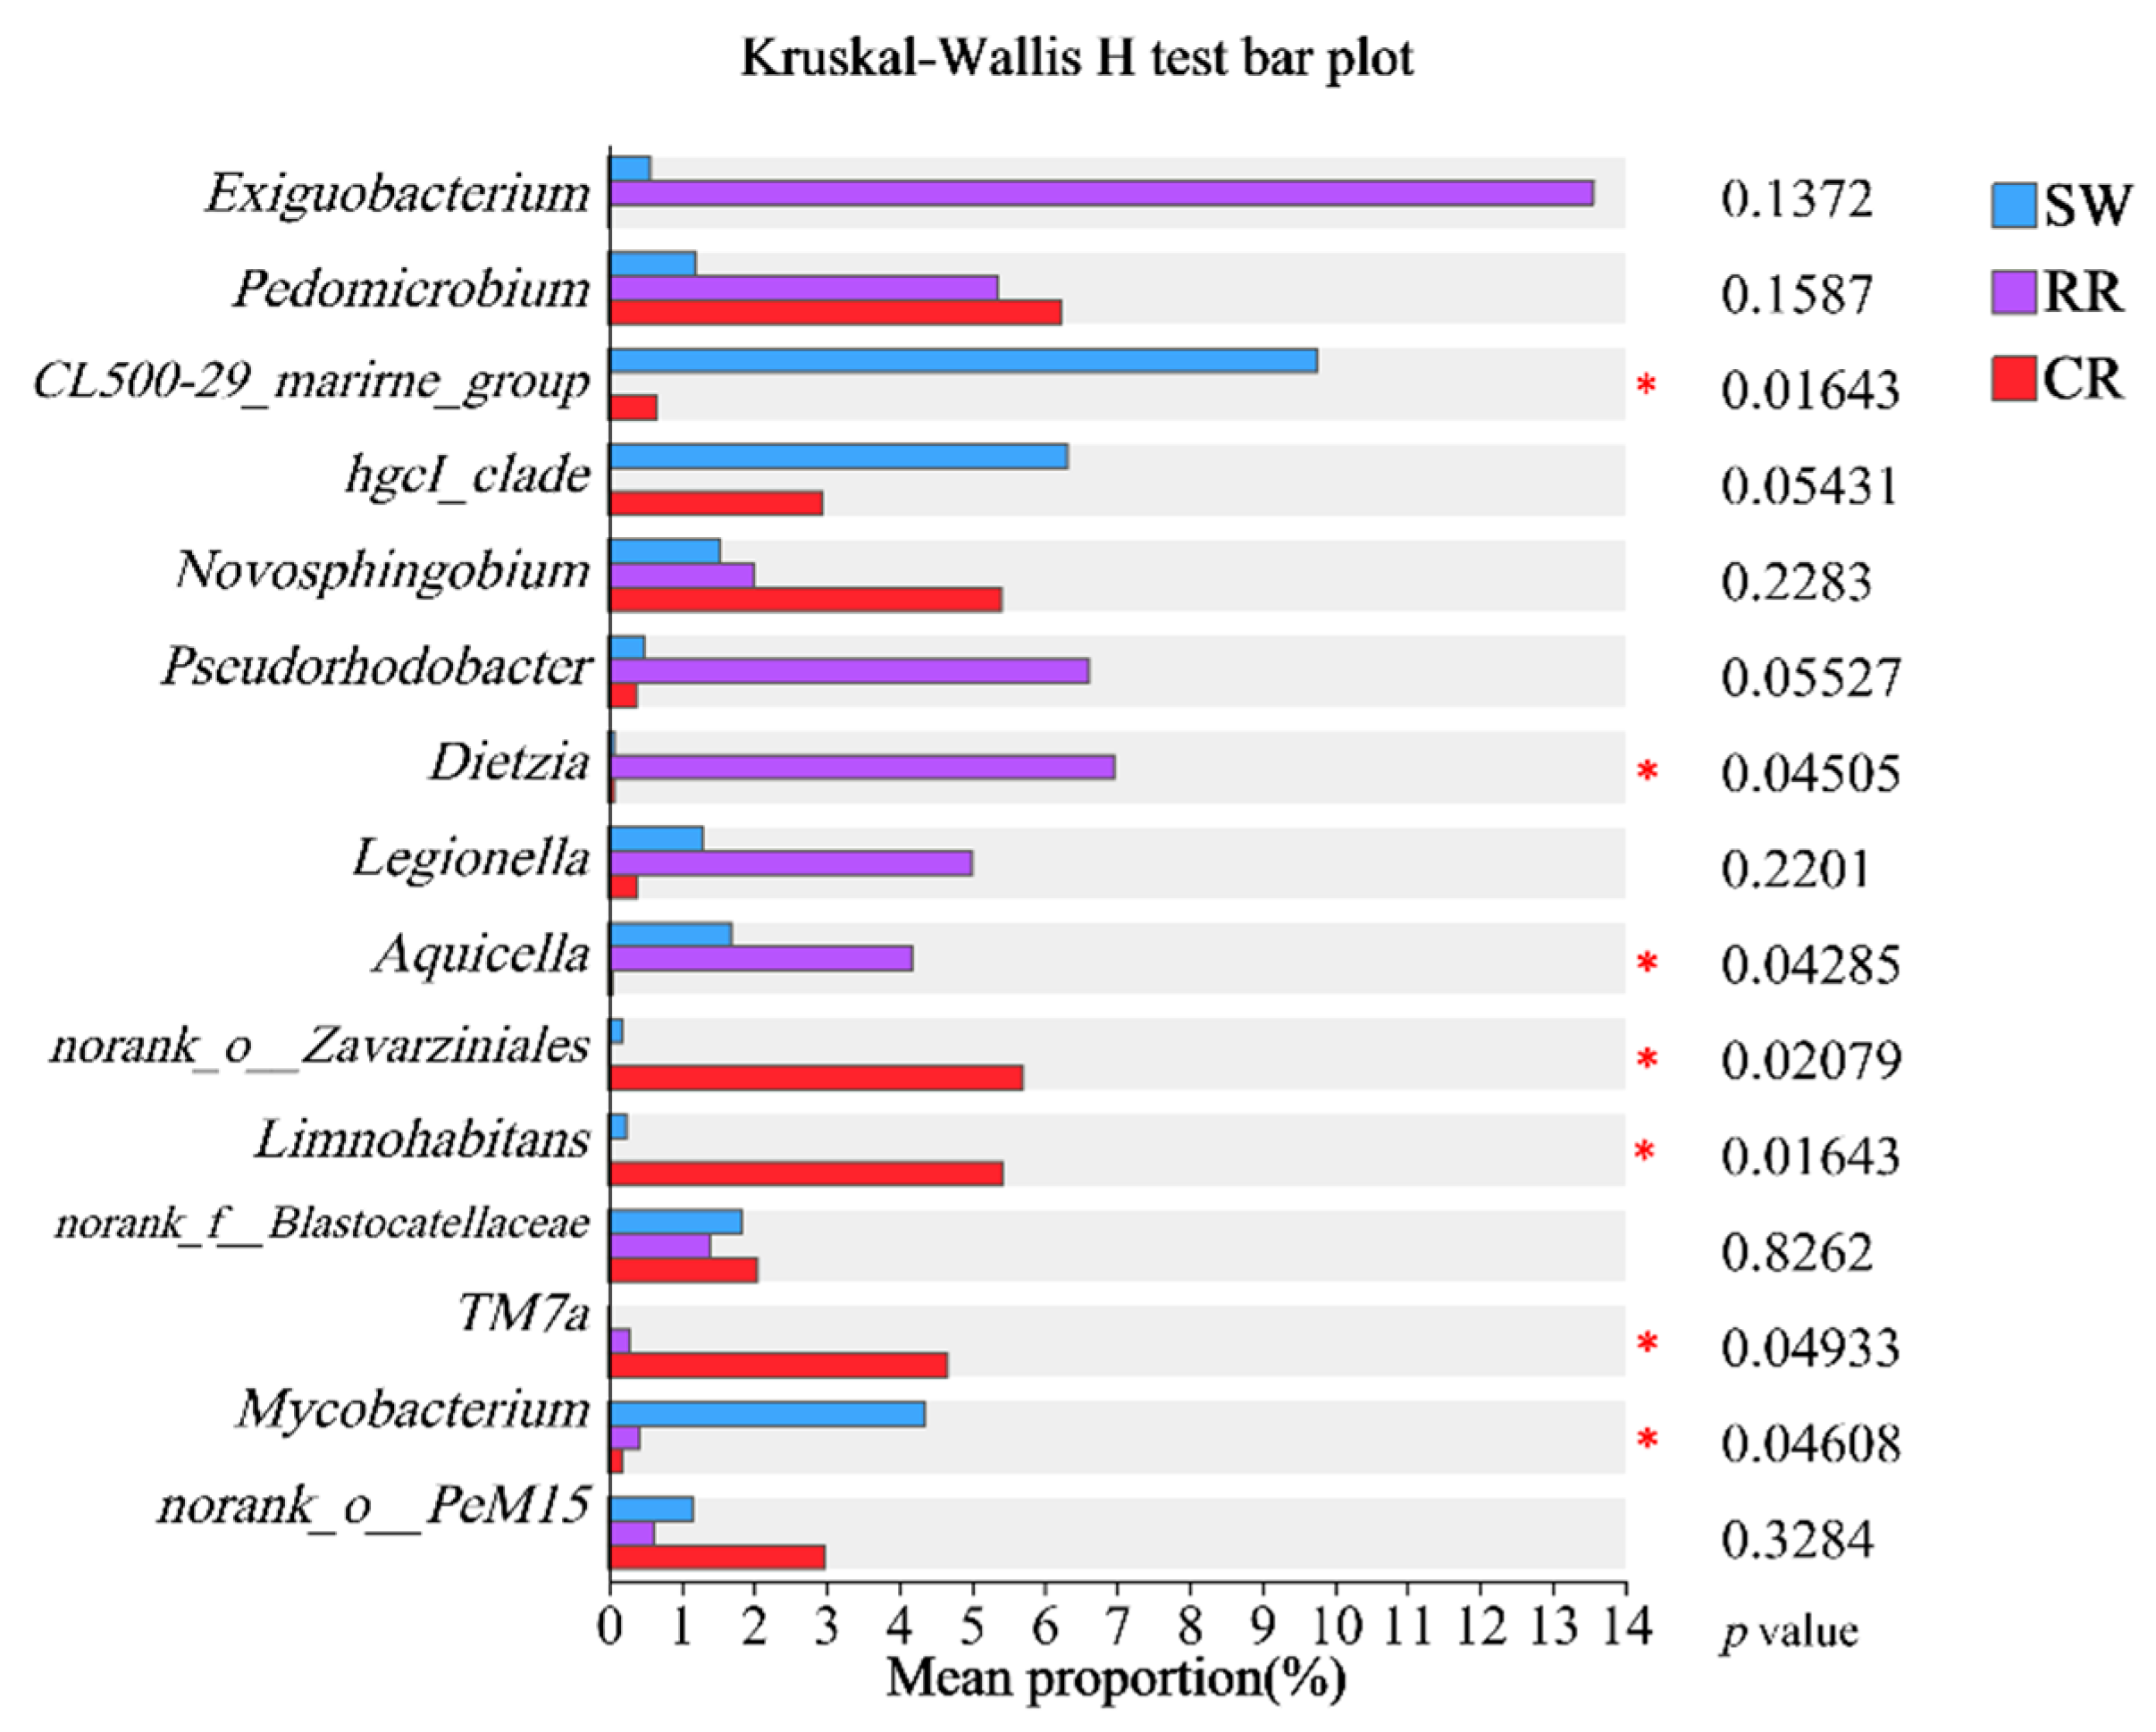
At the phylum level, Pseudomonadota is the most abundant, followed by Actinomycetota. Aerobic Actinomycetota dominates surface water samples. At the genus level, dominant taxa include Erythrobacter, Pedomicrobium, and Novosphingobium. CL500-29_marine_group, previously identified as a dominant genus in surface water systems such as rivers and lakes, shows high abundance in surface water samples. The rock roadway water samples exhibit notably high abundance of Dietzia, a genus with hydrocarbon degradation capabilities.
(3)
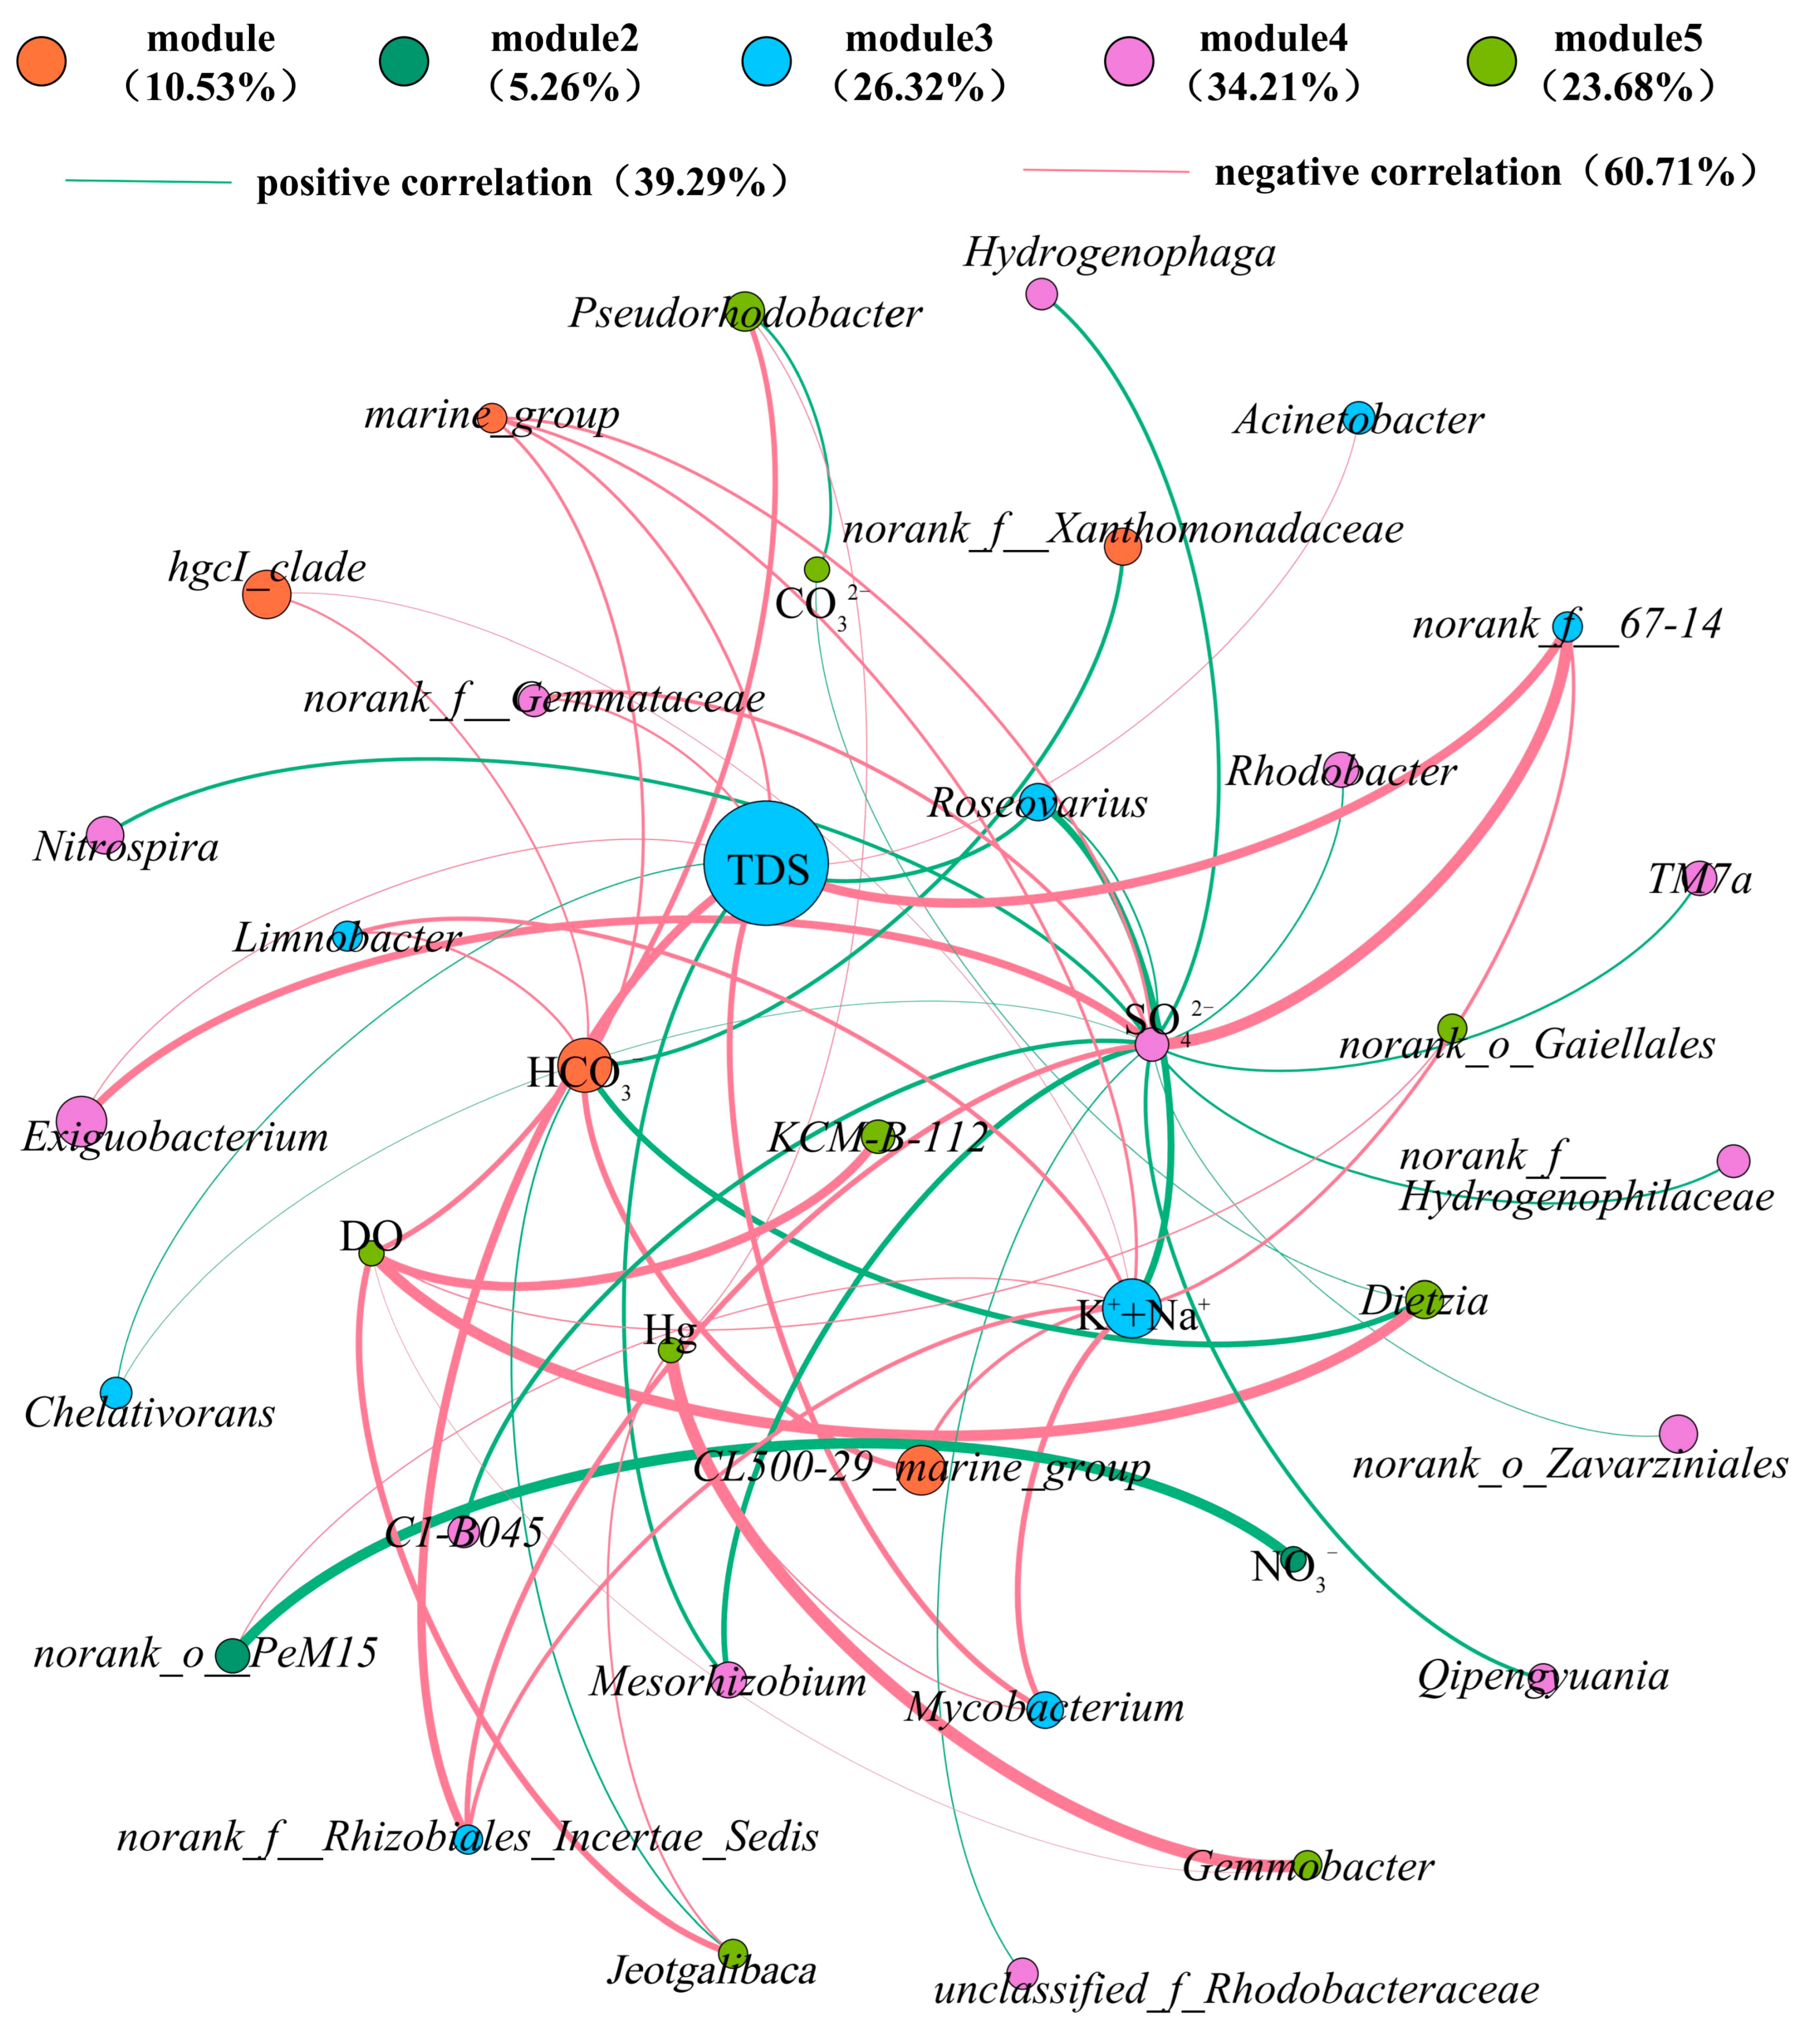
Environmental factors including K+ + Na+, SO42−, HCO3, CO32−, pH, and DO exhibit strong correlations with microbial community structures. The negative correlation between microorganisms and TDS indicates that most genera cannot adapt to high-salinity environments. Sulfur, as a critical energy-supplying element for microbial survival, is closely linked to bacterial community distribution. Microbial communities responsive to SO42− hold significant importance for groundwater pollution control in coal mining areas using microbial technologies. Low DO levels in mines, caused by poor hydraulic conditions and inadequate ventilation, hinder the formation of stable microbial communities compared to surface environments.
(4)
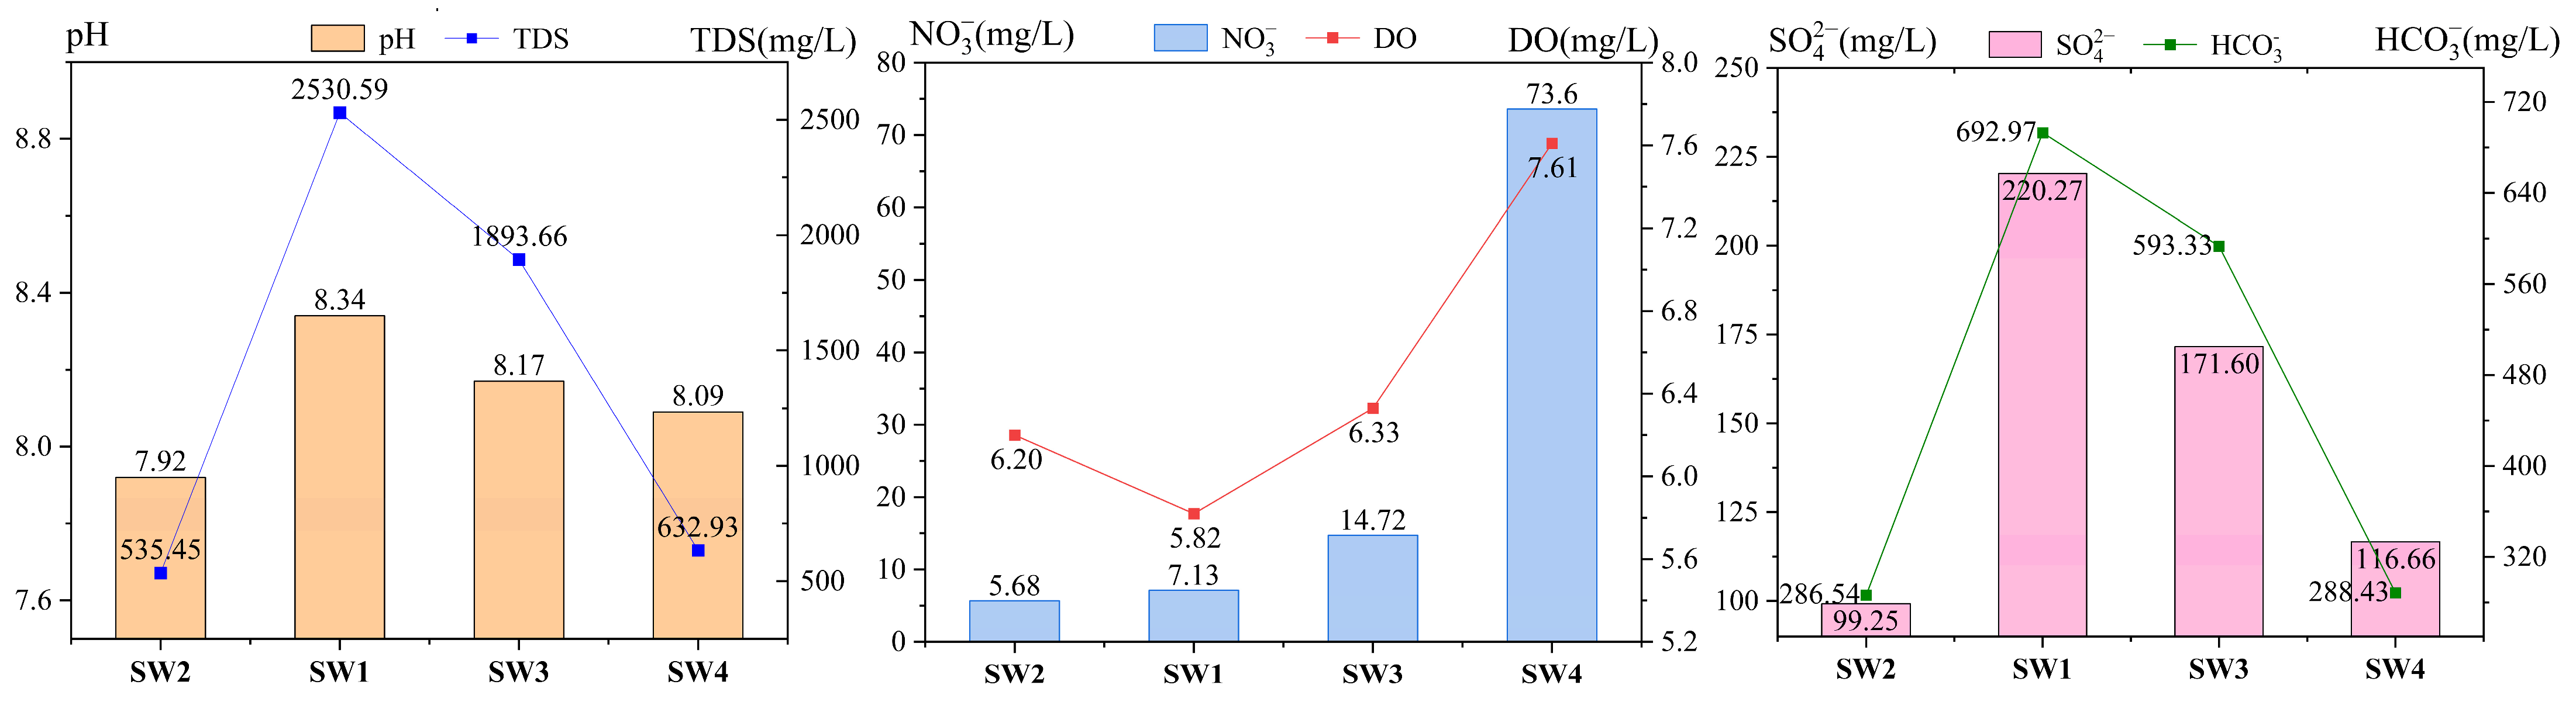
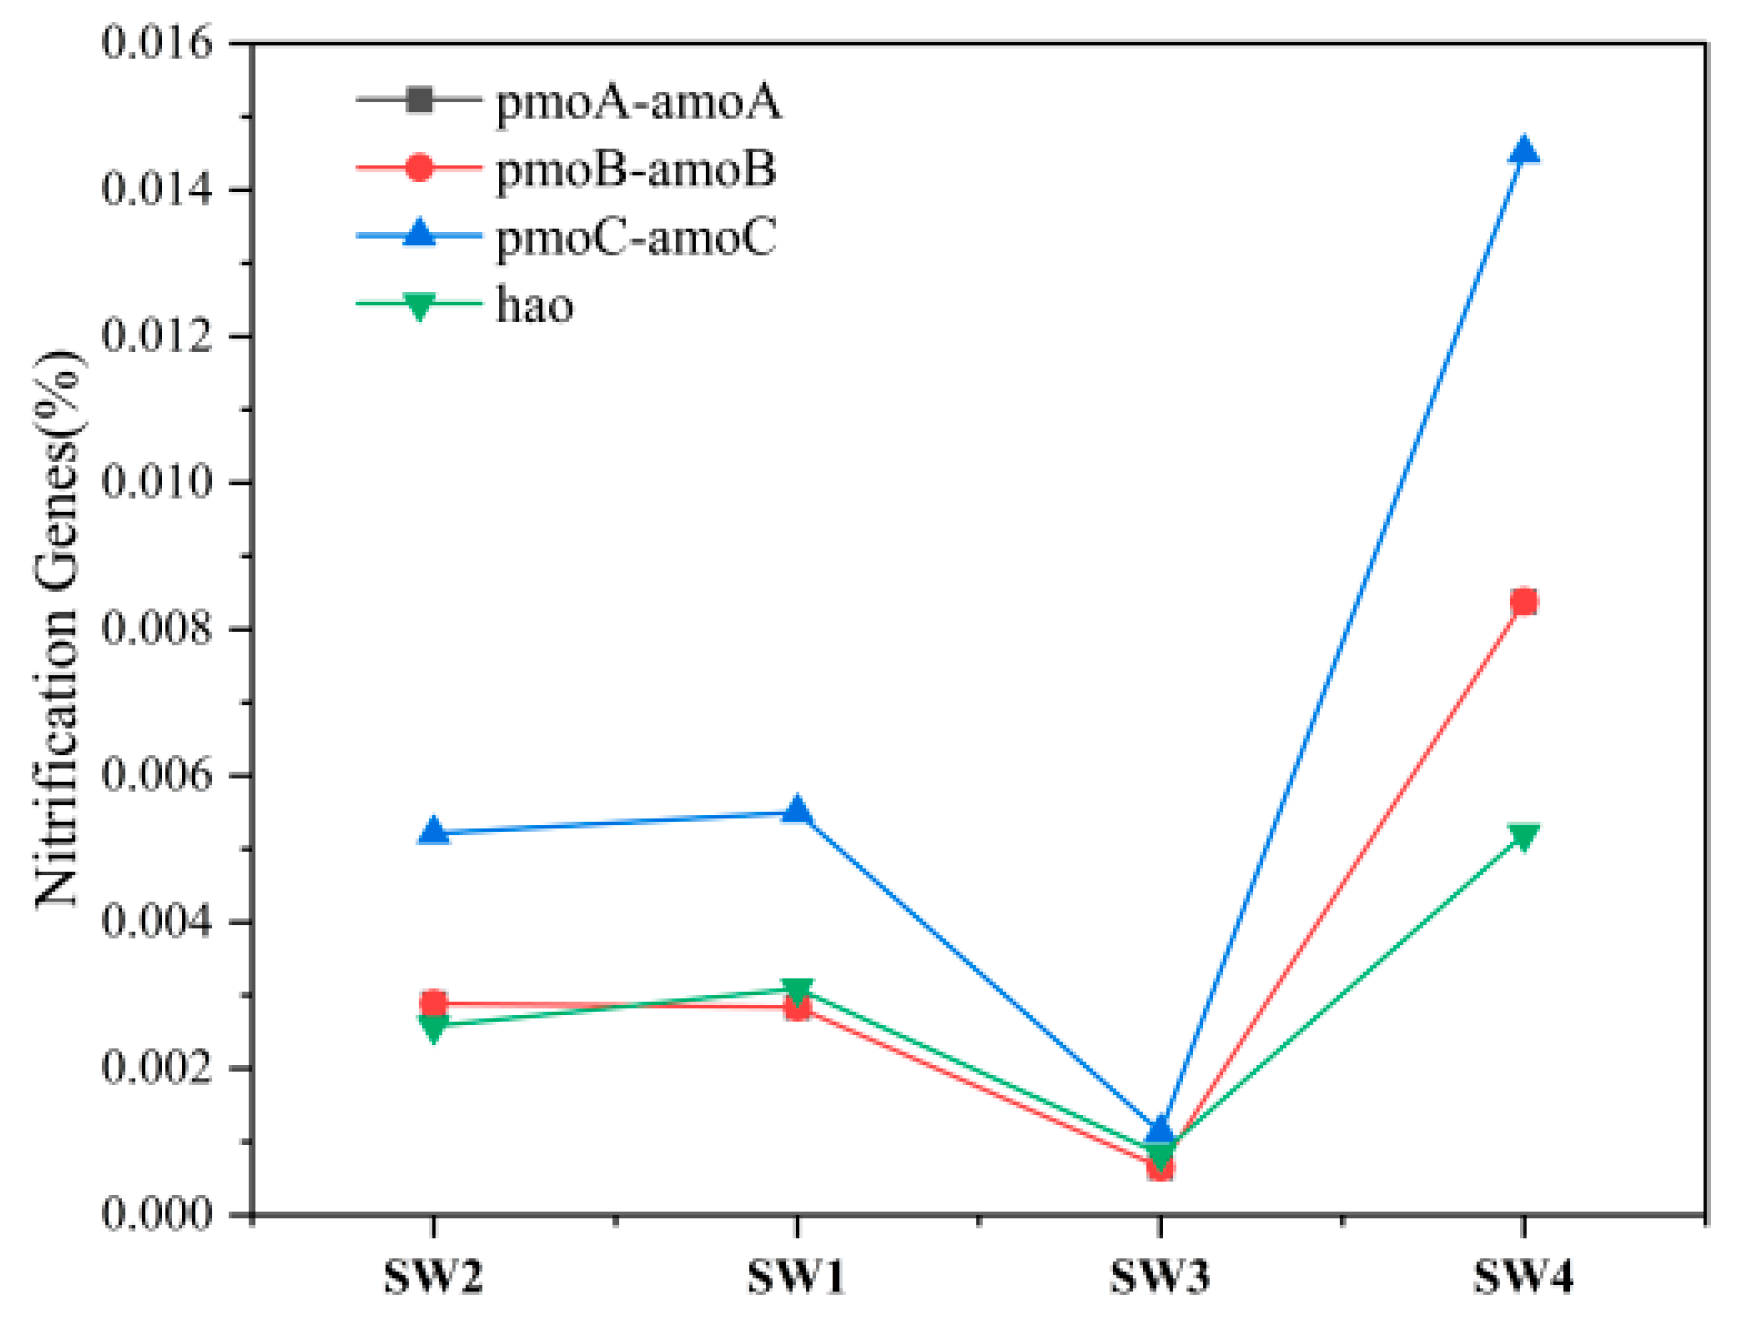
After mine drainage enters the river, the confluence zone (SW3) shows a significant increase in HCO3 concentration—a byproduct of microbial organic degradation—due to its higher microbial richness compared to upstream. Additionally, the discharge of mine water with elevated SO42− concentrations raises SO42− levels at the confluence above upstream values. Downstream, microbial richness returns to upstream levels, accompanied by a decline in HCO3. SO42− concentrations also decrease to upstream levels due to sulfate reduction by SRB (e.g., norank_f__Desulfuromonadaceae). However, NO3 concentrations increase more than tenfold downstream, suggesting that nitrogen cycle-related bacteria and organic matter from mine water enhance microbial activity, driving continuous nitrate accumulation in surface water.
While this study provides systematic characterization of microbial communities in typical mining zones, certain critical areas (e.g., groundwater aquifers) remained unsampled due to field accessibility constraints during the limited sampling window. The inherent complexity of coal mine ecosystems, involving dynamic interactions among geological, hydrological, and anthropogenic factors, necessitates future studies on tracking more parameters and continuous sampling. The current 16S rRNA sequencing approach, while effective for community profiling, has inherent resolution limits. Integrated multi-omics approaches will be implemented in future studies.

Supplementary Materials

The following supporting information can be downloaded at: https://www.mdpi.com/article/10.3390/su17094000/s1, Materials and Methods—Hydrochemical Characterization; Table S1. Limit of quantification and precision of hydrochemical test; Materials and Methods—DNA Extraction and 16S rRNA Gene Sequencing; Table S2. Alpha diversity indices of microbial community of water in different zones; Table S3. The versions of analysis software or databases.

Author Contributions

Conceptualization, Z.Z.; methodology, L.Z.; data analysis, Y.G.; writing—original draft preparation, Y.G.; writing—review and editing, Z.Z.; funding acquisition, Y.S. All authors have read and agreed to the published version of the manuscript.

Funding

This research was funded by the National Key Research and Development Program of China, grant number 2019YFC1805400.

Institutional Review Board Statement

Not applicable.

Informed Consent Statement

Not applicable.

Data Availability Statement

The data presented in this study are available on request from the corresponding author.

Conflicts of Interest

The authors declare no conflicts of interest.

References

  1. Sun, Y.; Zhang, L.; Xu, Z.; Chen, G.; Zhao, X.; Li, X.; Gao, Y.; Zhang, S.; Zhu, L. Multi field action mechanism and research progress of coal mine water quality formation and evolution. J. China Coal Soc. 2022, 47, 423–437. [Google Scholar]
  2. Sun, W.J.; Ren, S.L.; Wu, Q.; Dong, D.; Gan, X. Water pollution’s prevention and comprehensive utilization of abandoned coal mines in China under the new normal life. J. China Coal Soc. 2022, 47, 2161–2169. [Google Scholar]
  3. Price, P.; Wright, I.A. Water Quality Impact from the Discharge of Coal Mine Wastes to Receiving Streams: Comparison of Impacts from an Active Mine with a Closed Mine. Water Air Soil Pollut. 2016, 227, 155. [Google Scholar] [CrossRef]
  4. Cao, Q.; Yan, R.; Yang, L.; Takaoka, M. Effects of water-coal interactions on coal mine water quality in China: A lixiviation experiment and actual water quality investigation. Environ. Sci. Pollut. Res. 2023, 30, 107350–107364. [Google Scholar] [CrossRef]
  5. Gu, D.; Li, T.; Li, J.; Guo, Q.; Jiang, B.; Bian, W.; Bao, Y. Current status and prospects of coal mine water treatment technology in China. Coal Sci. Technol. 2021, 49, 11–18. [Google Scholar]
  6. Yang, F.; Liu, S.; Jia, C.; Wang, Y. Identification of groundwater microbial communities and their connection to the hydrochemical environment in southern Laizhou Bay, China. Environ. Sci. Pollut. Res. 2022, 29, 14263–14278. [Google Scholar] [CrossRef]
  7. Méheust, R.; Castelle, C.J.; Carnevali, P.B.M.; Farag, I.F.; He, C.; Chen, L.-X.; Amano, Y.; Hug, L.A.; Banfield, J.F. Groundwater Elusimicrobia are metabolically diverse compared to gut microbiome Elusimicrobia and some have a novel nitrogenase paralog. Isme J. 2020, 14, 2907–2922. [Google Scholar] [CrossRef]
  8. Ding, Y.; Zhang, Y.; Zhong, M.; Qi, P.; Xu, Z. Mutual Effects of Temperature and Microorganisms on the Chemical Characteristics of Coal Mine Drainage. Geomicrobiol. J. 2023, 40, 676–687. [Google Scholar] [CrossRef]
  9. Bao, Y.; Guo, C.; Wang, H.; Lu, G.; Yang, C.; Chen, M.; Dang, Z. Fe- and S-metabolizing microbial communities dominate an AMD-contaminated river ecosystem and play important roles in Fe and S cycling. Geomicrobiol. J. 2017, 34, 695–705. [Google Scholar] [CrossRef]
  10. Zhang, X.; Tang, S.; Wang, M.; Sun, W.; Xie, Y.; Peng, H.; Zhong, A.; Liu, H.; Zhang, X.; Yu, H.; et al. Acid mine drainage affects the diversity and metal resistance gene profile of sediment bacterial community along a river. Chemosphere 2019, 217, 790–799. [Google Scholar] [CrossRef]
  11. Jin, L.; Gerson, J.R.; Rocca, J.D.; Bernhardt, E.S.; Simonin, M. Alkaline mine drainage drives stream sediment microbial community structure and function. Sci. Total Environ. 2022, 805, 150189. [Google Scholar] [CrossRef]
  12. Zhang, H.; Xu, G.; Chen, X.; Li, X.; Li, Z.; Zhang, Y.; Zhang, G.; He, J. Microbial community characteristics and environmental response of water bodies in different environmental areas underground coal mine. J. China Coal Soc. 2025, 50, 1276–1293. [Google Scholar]
  13. Hu, G.Q. Environmental Geochemistry and Cleanliness Grade Evaluation of Typical Hazardous Elements at Huainan Coalfield. Ph.D. Dissertation, University of Science and Technology of China, Hefei, China, 2019. [Google Scholar]
  14. Chen, J.; Gui, H.; Guo, Y.; Li, J. Microbial community characteristics of deep groundwater in Huaibei coalfield and its significance in water source tracing. J. China Coal Soc. 2022, 47, 3503–3512. [Google Scholar]
  15. Raudsepp, M.J.; Gagen, E.J.; Evans, P.; Tyson, G.W.; Golding, S.D.; Southam, G. The influence of hydrogeological disturbance and mining on coal seam microbial communities. Geobiology 2016, 14, 163–175. [Google Scholar] [CrossRef]
  16. Zhang, L.; Xu, Z.; Sun, Y.; Gao, Y.; Zhu, L. Coal Mining Activities Driving the Changes in Microbial Community and Hydrochemical Characteristics of Underground Mine Water. Int. J. Environ. Res. Public Health 2022, 19, 13359. [Google Scholar] [CrossRef]
  17. Wang, Q.; Garrity, G.M.; Tiedje, J.M.; Cole, J.R. Naive Bayesian classifier for rapid assignment of rRNA sequences into the new bacterial taxonomy. Appl. Environ. Microbiol. 2007, 73, 5261–5267. [Google Scholar] [CrossRef]
  18. Bastian, M.; Heymann, S.; Jacomy, M. Gephi: An open source software for exploring and manipulating networks. In Proceedings of the Third International Conference on Weblogs and Social Media, San Jose, CA, USA, 17–20 May 2009. [Google Scholar]
  19. Douglas, G.M.; Maffei, V.J.; Zaneveld, J.R.; Yurgel, S.N.; Brown, J.R.; Taylor, C.M.; Huttenhower, C.; Langille, M.G.I. PICRUSt2: An improved and extensible approach for metagenome inference. Nat. Biotechnol. 2020, 38, 685–688. [Google Scholar] [CrossRef]
  20. Xu, Z.; Zhang, L.; Gao, Y.; Tan, X.; Sun, Y.; Chen, W. Effects of Coal Mining Activities on the Changes in Microbial Community and Geochemical Characteristics in Different Functional Zones of a Deep Underground Coal Mine. Water 2024, 16, 1836. [Google Scholar] [CrossRef]
  21. Zhang, L.; Xu, Z.; Sun, Y.; Zhu, L.; Chen, G.; Gao, Y.; Zhao, X. Hydrochemistry and microbial community composition characteristics and their environmental response in different zones of a coal mine in Ordos. Coal Sci. Technol. 2023, 51, 180–196. [Google Scholar]
  22. Tourova, T.; Sokolova, D.; Nazina, T.; Grouzdev, D.; Kurshev, E.; Laptev, A. Biodiversity of microorganisms colonizing the surface of polystyrene samples exposed to different aqueous environments. Sustainability 2020, 12, 3624. [Google Scholar] [CrossRef]
  23. Xiao, X.Y.; Chen, C.L.; Li, H.R.; Li, L.H.; Yu, X. The variation of microbiological characteristics in surface waters during persistent precipitation. Front. Environ. Sci. Eng. 2024, 18, 111. [Google Scholar] [CrossRef]
  24. Lindh, M.V.; Lefébure, R.; Degerman, R.; Lundin, D.; Andersson, A.; Pinhassi, J. Consequences of increased terrestrial dissolved organic matter and temperature on bacterioplankton community composition during a Baltic Sea mesocosm experiment. Ambio 2015, 44, 402–412. [Google Scholar] [CrossRef]
  25. Frisk, J.H.; Pejler, G.; Eriksson, S.; Wang, L. Heavy metal tolerance of Mesorhizobium delmotii thymidylate kinase. Nucleosides Nucleotides Nucleic Acids 2022, 41, 1305–1317. [Google Scholar] [CrossRef]
  26. Liu, Z.; Iqbal, M.; Zeng, Z.; Lian, Y.; Zheng, A.; Zhao, M.; Li, Z.; Wang, G.; Li, Z.; Xie, J. Comparative analysis of microbial community structure in the ponds with different aquaculture model and fish by high-throughput sequencing. Microb. Pathog. 2020, 142, 104101. [Google Scholar] [CrossRef]
  27. Ruprecht, J.; Birrer, S.; Dafforn, K.; Mitrovic, S.; Crane, S.; Johnston, E.; Wemheuer, F.; Navarro, A.; Harrison, A.; Turner, I.; et al. Wastewater effluents cause microbial community shifts and change trophic status. Water Res. 2021, 200, 117206. [Google Scholar] [CrossRef]
Figure 1. Piper (a) and Durov (b) diagrams of the water samples in different zones. (RR: rock roadways; CR: coal roadways; PW: working face drainage; goaf: goaf; sump: water sumps; SW: surface water).
Sustainability 17 04000 g001
Figure 2. Half-box diagrams of the major hydrochemical components in different functional zones (RR: rock roadways; CR: coal roadways; PW: working face drainage; goaf: goaf; sump: water sumps; SW: surface water).
Sustainability 17 04000 g002
Figure 3. Scatter plot of microbial community alpha diversity indices in water bodies from different zones (RR: rock roadways; CR: coal roadways; PW: working face drainage; goaf: goaf; sump: water sumps; SW: surface water).
Sustainability 17 04000 g003
Figure 4. The numbers of unique species and shared species of the microorganisms in different zones on OTU level. (RR: rock roadways; CR: coal roadways; PW: working face drainage; goaf: goaf; sump: water sumps; SW: surface water).
Sustainability 17 04000 g004
Figure 5. Non-metric multidimensional scaling analysis of microbial community. (RR: rock roadways; CR: coal roadways; PW: working face drainage; goaf: goaf; sump: water sumps; SW: surface water).
Sustainability 17 04000 g005
Figure 6. Histograms of relative abundance on phylum levels. (RR: rock roadways; CR: coal roadways; PW: working face drainage; goaf: goaf; sump: water sumps; SW: surface water).
Sustainability 17 04000 g006
Figure 7. The results of Kruskal–Wallis H test on phylum levels in different zones. (RR: rock roadways; CR: coal roadways; SW: surface water. *: p < 0.05).
Sustainability 17 04000 g007
Figure 8. Histograms of relative abundance on genus levels of different group samples. (RR: rock roadways; CR: coal roadways; PW: working face drainage; goaf: goaf; sump: water sumps; SW: surface water).
Sustainability 17 04000 g008
Figure 9. The results of Kruskal–Wallis H test on genus levels in different zones. (RR: rock roadways; CR: coal roadways; SW: surface water. *: p < 0.05).
Sustainability 17 04000 g009
Figure 10. Hierarchical clustering tree on OTU level based on Bray–Curtis. (RR: rock roadways; CR: coal roadways; PW: working face drainage; goaf: goaf; sump: water sumps; SW: surface water).
Sustainability 17 04000 g010
Figure 11. CCA analysis of microbial genus classification community and environmental factors. (RR: rock roadways; CR: coal roadways; PW: working face drainage; goaf: goaf; sump: water sumps; SW: surface water).
Sustainability 17 04000 g011
Figure 12. Network of correlation between bacterial genera (top 50 most abundant species) and environmental variables. The size of each node is proportional to the number of connections; the thickness of each connection between two nodes is proportional to the absolute value of Spearman’s correlation coefficients. The connections indicate strong (|r| > 0.5) and significant (p < 0.05) correlations.
Sustainability 17 04000 g012
Figure 13. Histograms of relative abundance on genus levels of surface water samples.
Sustainability 17 04000 g013
Figure 14. The change of surface river water environment after mine drainage inflow.
Sustainability 17 04000 g014
Figure 15. Proportion of nitrogen metabolism related gene abundance in surface water samples.
Sustainability 17 04000 g015
Table 1. Details of water sample collection in each functional partition.
ZonesSample IDSampling LocationZonesSample IDSampling Location
Surface Water (SW)SW1Surface drainage outletGoaf Water (goaf)MW2West Main Roadway Sealed Wall (−650 m)
SW2Upstream of Xi Fei River
SW3Confluence of surface drainage and riverMW3West Main Roadway Sealed Wall (−550 m)
SW4Downstream of Xi Fei River
Sump Water (sump)MW1Mine-bottom sump (−750 m)Working Face Drainage (PW)MW4230106 Working Face Drainage (−750 m)
MW5230106 Working Face Drainage (−750 m)
Rock Roadway Water (RR)MW6East Wing Track Gate (−750 m)Coal Roadway Water (CR)MW92201 East District Coal Transport Rise (−650 m)
MW7MW10
MW8MW11
Disclaimer/Publisher’s Note: The statements, opinions and data contained in all publications are solely those of the individual author(s) and contributor(s) and not of MDPI and/or the editor(s). MDPI and/or the editor(s) disclaim responsibility for any injury to people or property resulting from any ideas, methods, instructions or products referred to in the content.

