Abstract
As climate change accelerates and urbanization intensifies, mitigating the Urban Heat Island (UHI) effect has become crucial for sustainable urban planning. This study evaluated the role of four key urban indicators—buildings, greenery, streets, and pedestrian paths—in reducing air temperature and improving energy efficiency within the Kartal District of Istanbul. To ensure accurate and data-driven results, multiple advanced software tools were integrated throughout the research process. QGIS, Google Earth, and OpenStreetMap were used to generate high-resolution land use/land cover (LULC) maps, while Meteoblue climate data and the Global Heat Island Map provided essential climatic parameters. The InVEST Urban Cooling Model was employed to simulate temperature reduction effects, and eQuest energy simulation software assessed the impact of building modifications on energy consumption. The study tested multiple UHI mitigation scenarios, including green roofs, increased street tree cover, grass-covered pedestrian paths, and high-albedo pavement, comparing their individual and combined effects. The results indicated that integrating all strategies achieved the most significant cooling impact, reducing air temperatures by 1.14 °C and improving energy efficiency by 61%. Among the individual interventions, green roofs provided the highest building energy savings (28% reduction), while grass-covered pedestrian paths homogenized the district-wide temperature distribution. These findings underscore the importance of combining GIS-based spatial analysis, climate modeling, and energy simulation tools to develop reliable, scalable, and effective urban heat mitigation strategies. Future urban planning should prioritize a multi-software approach to enhance sustainability, optimize energy efficiency, and improve urban resilience.
1. Introduction
Climate change, along with other Urban Heat Island (UHI) phenomena, is among the most serious environmental challenges of the 21st century [1]. According to [2], this is mainly attributable to changes in land cover as a consequence of urbanization. The overall climate of the city is effectively changed due to transformations in urban forms and functions, with a subsequent temperature rise of about 2 °C to 3 °C compared to surrounding areas [3].
Such changes interfere with the heat and momentum transfer between the surface, atmosphere, and subsurface. The contributing factors include the buildings’ heat-absorbing capacity, pollution from urban activities, dark roofing materials, industrial activities, roads and pavements, vehicle emissions, reduced vegetation, and a greatly inhibited wind speed which impedes heat transport [4]. These changes in the surface energy balance keep urban areas consistently warmer than their rural surroundings. The impacts of UHIs vary, leading to increased energy use for cooling and thus worsening air pollution [5]. Besides increasing electricity use and temperatures, the UHI effect also profoundly affects urban pollutant levels [6].
In addition, it affects regional climatology through changes in wind direction, humidity, cloud and fog formation, and rainfall frequency. Furthermore, increased temperatures lead to smog (ozone) formation, which presents a major environmental and public health problem. This pollution can cause multiple health problems, some with high annual mortality rates, which makes the UHI effect a significant factor in urban environmental and health problems.
The climate is a key determinant influencing the use and quality of both indoor and outdoor spaces. Consequently, the built environment and its landscape should be thoughtfully designed to align with the prevailing climatic conditions [1]. The characteristics of the built environment such as its composition, density, proportions, exposure to airflow, and material choices should not only respond to climate but also have the potential to alter the climatic conditions.
Thus, climate change and UHI challenges significantly impact quality of life by influencing human thermal comfort and their interaction with the built environment and landscape. These issues are critical considerations in addressing environmental sustainability, social vulnerability, efficiency, and public health.
Literature Review
The research on UHIs can be categorized into three main areas [7].
Assessing Methodologies to Measure UHI Intensity: This category encompasses studies from 2014 to 2021 that established foundational methodologies using environmental metrics to measure UHI intensity. Innovations between 2016 and 2021 expanded this field by incorporating urban boundary-layer interactions and microclimate analyses using advanced sensor arrays.
Impact of UHIs on Environmental and Social Factors: Early studies (1998–2008) explored UHIs’ effects on CO2 levels and indoor environments. More recent research (2016–2023) has shifted to examining the health impacts and energy consumption associated with UHI effects, reflecting the growing awareness of UHIs’ human-centric implications. However, a notable research gap persists in the United States and Canada regarding these aspects.
Effect of Environmental Parameters on the UHI Effect: This is the most active area of UHI research, which focuses on how environmental factors influence the UHI effect. Between 2019 and 2021, the research focused on the important role of urban greenery in reducing the UHI effect.
By 2022, approaches like subsurface temperature assessments and microclimate mapping emerged, offering fresh insights into data collection and laying the groundwork for future exploration. This progression underscores the evolution of UHI studies, transitioning from methodological advancements to a broader focus on environmental and societal implications.
Refs. [3,8] explained the intersection between climate change, urban heat-related challenges, and the Sustainable Development Goals (SDGs), which were established in 2015 under the UN 2030 Agenda. This Agenda aims to create sustainable districts that address both human and environmental needs by 2030 and beyond. Addressing “Urban Overheating” through green infrastructure, public awareness campaigns, and early warning systems aligns with SDG 11 (Sustainable Cities and Communities) and SDG 3 (Good Health and Well-Being). Correspondingly, mitigating UHI effects using green roofs, cool pavements, and urban planning strategies that prioritize public spaces links directly to SDG 11 and SDG 7 (Affordable and Clean Energy). These strategies exemplify how sustainable urban development solutions can simultaneously address pressing climate challenges and advance global sustainability goals.
Numerous studies [9] have highlighted the potential of green roofs as an effective passive strategy to improve both indoor and outdoor thermal comfort. This approach is especially significant given the extensive surface area covered by building roofs in urban settings. Furthermore, green roofs present a cost-effective and space-efficient alternative, addressing the challenges posed by limited and expensive urban land availability.
At the building scale, green roofs offer significant benefits, including
- Lowering indoor air temperatures, contributing to enhanced thermal comfort.
- Reducing cooling energy demands, particularly in hot climates, leading to energy savings and cost efficiency.
- Improving indoor thermal comfort by minimizing heat flux from the roof.
Ref. [10] indicated that incorporating greenery to cool the air entering fresh air inlet devices effectively reduced the cooling demand by 26%.
The efficiency of green roofs is influenced by several factors, such as their scale, the air temperature above the green roof, air temperature at pedestrian level, physiological equivalent temperature, and mean radiant temperature [9].
The following literature reviews illustrate how some recent research examined the impact of greenery on the buildings’ energy performance. Several studies explored the role of green spaces in enhancing thermal comfort and efficiency [11]. For instance, one study employed the heat flow meter method to assess the U value of a flat concrete roof. Measurements were taken before the energy refurbishment of the building, following the application of a thermal insulation layer on the roof, and after the implementation of a green roof, allowing for a comprehensive evaluation of thermal performance. Another study focused on the evaluation of the microclimate conditions and thermal transmittance in the vicinity of public buildings in Novi Sad (Republic of Serbia) and Osijek (Republic of Croatia), utilizing multi-year monitoring datasets collected across various seasons [12]. Another study underscored the benefits and implications of vertical greenery for sustainable urban development. The study employed methods such as a literature review, case study analysis, expert interviews, stakeholder engagement, conceptual framework development, and policy analysis [13]. Some research focused on the effect of integrating vegetation into architecture to create a built ecosystem capable of quantifiable carbon sequestration and habitat provisioning; the methodology involved structuring a questionnaire for experts [14]. The relationship between intensive green roofs and mental health among residents in residential buildings was investigated through a survey questionnaire administered to the target population [15]. Additionally, a study evaluated tree coverage and its associated benefits using the integrated online tool i-Tree Canopy, which quantifies ecosystem functions from economic and pollution sequestration perspectives [16].
This study presents a novel approach by not only recognizing the well-documented potential of greenery, particularly green roofs, in reducing air temperatures, but also by strategically integrating greenery with the core physical elements found in every urban district: buildings, greenery, streets, and pedestrian paths. Unlike previous research, this work focused on optimizing the complementary relationships between these elements, transforming them into active agents of environmental sustainability and energy efficiency at the district scale. By addressing the UHI effect and enhancing energy savings, the study investigated the specific conditions under which these benefits are realized and quantified their impact on district residents and users. The uniqueness of this research lies in its framing and perspective of these fundamental urban components as both challenges and opportunities, particularly in densely populated districts with high traffic congestion and limited green space. While most existing studies were conducted at the city scale, and a limited number focused on the neighborhood scale, this study’s street-scale focus enables a detailed examination of these indicators through an integrated methodological framework, employing advanced tools such as the Urban Cooling Model in InVEST and energy simulation software to deliver comprehensive insights. Accordingly, this study sought to answer the following research question: How does the integration of greenery with core urban district elements influence their effectiveness in mitigating the UHI effect and enhancing energy efficiency?
2. Methodology
This study evaluates how four key urban indicators (buildings, greenery, streets, and pedestrian paths) influence UHI mitigation and energy efficiency. A data-driven approach was used to assess the thermal and energy-saving impacts of various interventions. The methodology consisted of data acquisition, simulation modeling, scenario development, and impact assessment.
To achieve the research objectives and evaluate the selected indicators—buildings, greenery, pedestrian paths, and streets—and their contributions to creating a sustainable district, a structured methodology was employed, as detailed in Figure 1. The study leverages the complementary functionalities of various software tools, including QGIS 3.40.6, Google Maps 25.17.0, Google Earth 7.3.6, eQuest 3.64, and InVEST 3.14.0. These tools were utilized to collect data, construct a case study model, simulate multiple scenarios, analyze results, and conduct comparative evaluations. The specific roles and contributions of each software tool are explained in the data processing section.
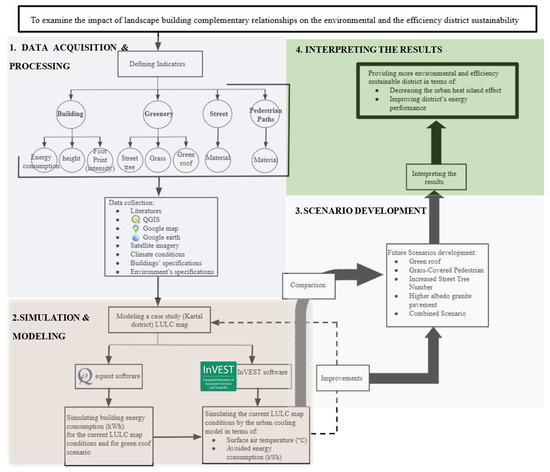
Figure 1.
Methodological framework.
2.1. Data Acquisition and Processing Based on Defined Key Urban Indicators
It requires a combination of remote sensing, GIS analysis, and climate datasets to collect and preprocess data.
Land Use and Urban Features Data
The main data were sourced from Google Earth 7.3.6 and OpenStreetMap plugin which is processed using QGIS 3.40.6. The dataset provides a 1-square-meter resolution of district land cover, enabling a detailed definition of various elements such as
- Buildings (including rooftops and built-up areas):
- Greenery (comprising trees, grass, and green roofs);
- Streets (featuring asphalt and alternative materials);
- Pedestrian paths (comparing paved with grass-covered walkways).
Climatic Data
- Reference air temperature and humidity data were collected from Meteoblue [17].
- The Urban Heat Island Magnitude was obtained from the Global Heat Island Map.
Building Energy Consumption Data
The building energy consumption data represented the total electrical energy consumption per unit area of a building, measured in kWh/(m2·°C). These data were simulated using eQuest software, which provides monthly and annual energy consumption estimates. The eQuest simulation is essential, as its results serve as input for the urban cooling model within the InVEST software, enabling a comprehensive analysis of energy efficiency and thermal performance.
An evapotranspiration map was obtained from the NASA website for the month of July [18].
Key Parameters for Analysis
Each urban indicator was assigned biophysical parameters to simulate its impact, as detailed in Table 1:

Table 1.
Biophysical parameters of the indicators in the simulated scenarios.
- Crop coefficient (Kc): The cumulative impacts resulting from alterations in leaf area, plant height, crop attributes, irrigation technique, crop growth rate, planting date, extent of canopy coverage, canopy resistance, soil, and climate conditions, as well as agricultural management practices [19]. The street trees in the study area are non-evergreen oak trees, with their albedo and that of grass obtained from references [20,21]. Building, street, and tile surfaces were assigned a minimal Kc value of 0.001 to prevent vacant grid cells in the intermediate model outputs. This configuration aligns with the recommendations for other InVEST software models, such as the Seasonal Water Yield model [22].
- Shade: The proportion of the area covered by shade. Assumptions were made for shade values based on the specific characteristics of the study area.
- Albedo: The proportion of reflected solar radiation based on surface cover [23]. Albedo values were sourced from references [22,24,25,26,27,28,29,30].
- Within the urban cooling model, green elements were given a value of 1, while non-green elements were given a value of 0.
2.2. Simulating and Modeling the Existing Case
To quantify the effectiveness of interventions, computational models were used.
Urban Cooling Model (InVEST)
- Simulates air temperature reductions due to greenery and surface modifications;
- Computes the heat mitigation index (HM) for each intervention.
Energy Consumption Model (eQuest)
- Simulates changes in building energy demand under different roofing conditions;
- Evaluates cooling load reductions from green roofs and temperature shifts.
Computational Equations
- Air temperature reduction [urban cooling model-InVEST]:
Tair: air temperature (°C).
Tair,ref: reference air temperature of a rural area (°C).
HM: heat mitigation index calculated by software model.
UHI: magnitude of the urban heat island effect (°C).
- Energy Savings Calculation [eQuest]:
Tair, MAX: the maximum temperature over the landscape (°C).
Tair, MAX − Tair: the average difference in air temperature (°C).
Figure 2 shows the integration of the interrelated input layers along with the various biophysical parameters discussed above to develop the environmental model. In order to provide ecosystem services that mitigate the urban heat island effect, the model can be used to assess the indicators’ effects on air temperature reduction and quantify the resulting energy savings.
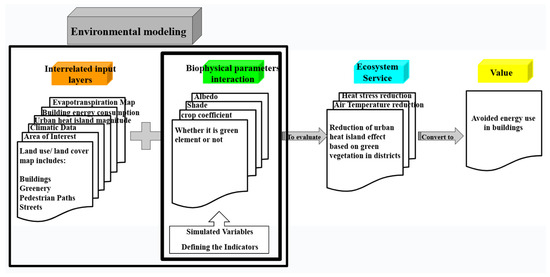
Figure 2.
Data processing and workflow.
2.3. Scenario Development
The study modeled five intervention scenarios to evaluate the impact of the key indicators: greenery, buildings, streets, and pedestrian paths. These scenarios focused on enhancing greenery coverage, integrating it with the other landscape indicators, and modifying street and pathway materials to optimize sustainability and environmental performance by mitigating the UHI effect and enhancing energy savings.
2.4. Interpreting the Results
After implementing and simulating the proposed development scenarios, each scenario was compared to the existing conditions by analyzing changes in air temperature and energy savings. The effectiveness of each scenario in mitigating the UHI effect and improving energy efficiency was evaluated. Finally, the scenario integrating all interventions was assessed against the current conditions to determine its overall impact on environmental sustainability and energy efficiency.
3. Study Area
This study evaluated the impact of selected urban indicators (buildings, greenery, streets, and pedestrian paths) on UHI effects and improving energy efficiency within the Kartal District, Istanbul. The case study focused on Kızılay Boulevard Street, as it is representative of an urban area with a high population density characterized by limited green spaces and a mix of residential and commercial structures with high traffic issues. The study area covers 212,428 m2, with a population density that intensifies the UHI effect, making it an ideal location for assessing sustainable urban interventions (Figure 3).
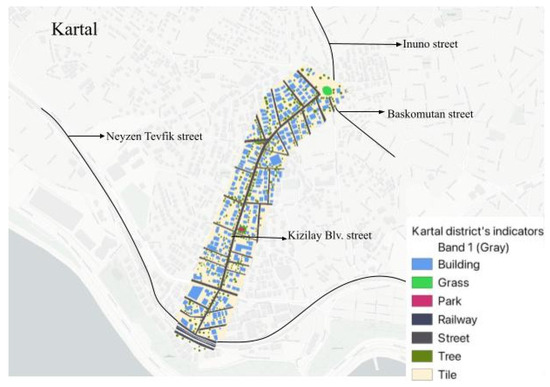
Figure 3.
Map of case study area in Kartal.
The case study’s indicators presented in Figure 4 include key elements of the urban landscape that play a critical role in energy efficiency and environmental sustainability.
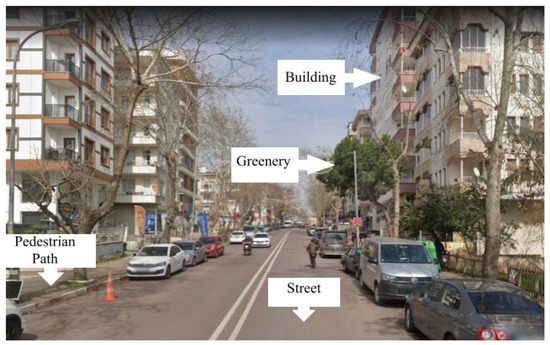
Figure 4.
Case study’s indicators.
Buildings: Evaluated for their energy performance, temperature mitigation effect, and potential for green roof implementation.
Greenery: Includes trees, green roofs, and grass surfaces, which were assessed for their cooling effects, contribution to reducing the urban heat island effect, and their importance for reducing energy consumption.
Pedestrian Paths: Studied in terms of material changes, such as converting tiles to grass, to enhance thermal comfort and energy performance.
Streets: Examined for the impact of converting asphalt into high-albedo materials on the surface temperature and overall cooling efficiency.
These indicators were analyzed individually and collectively to understand their roles in developing a sustainable urban district.
3.1. Data Acquisition and Processing
The study employed a multi-source data acquisition strategy to ensure accuracy and reliability. The following datasets and tools were integrated.
Land Use and Urban Features Data: Collected from Google Earth and OpenStreetMap, and processed using QGIS to classify urban elements (buildings, streets, greenery, and pedestrian pathways) at a 1 m2 resolution.
- Specific Case Study DataClimatic Data: Reference air temperature and humidity data were obtained from Meteoblue [17], while UHI intensity data were sourced from the Global Heat Island Map [31].
- ○
- Reference Air Temperature: 36 °C on the hottest day in July in Sahilköy.
- ○
- Urban Heat Island Magnitude: 2.04 °C during the daytime in July.
- ○
- Humidity Levels: 70% for July.
- Building Energy Consumption Data: Simulated using eQuest software, providing monthly and annual energy demand estimates for various urban scenarios.
- ○
- Baseline Energy Use: 13.42 kWh/m2 for July.
- ○
- Green Roof Scenario: 12.95 kWh/m2 for July.
- Evapotranspiration Data: represents water loss through transpiration and evaporation. The data were extracted from NASA’s MODIS database [18].
- ○
- Each dataset was processed using GIS-based techniques to assign biophysical parameters such as albedo, a crop coefficient (Kc), and shading percentages. These parameters served as inputs for the simulation models to evaluate the effectiveness of urban interventions.
Additionally, two key parameters were required for the urban cooling model.
- Air Blending Distance: Assigned a value of 2 m, reflecting the small scale of the study area, which focuses on a district surrounding Kızılay Boulevard in Kartal.
- Cooling Distance: Defined as the distance from a green area larger than 2 hectares; assigned a value of 600 m.
Table 2 summarizes the data collected for the presented study.
Table 2.
Summary of the collected data, their sources, and corresponding software applications used to process them.
3.2. Simulation and Modeling
The methodology employs computational modeling to quantify the cooling potential of different interventions.
- Energy Consumption Model (eQuest): Evaluates the impact of temperature changes on building energy demand for cooling based on a specific building’s features and its envelope’s features, as clarified in Figure 5.
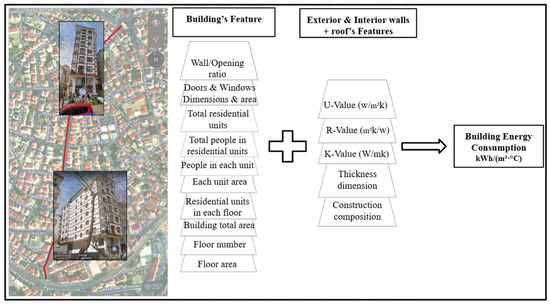 Figure 5. Building energy modeling.
eQUEST conducts energy simulation by defining the building’s physical and operational features, such as geometry, construction materials, HVAC systems, lighting, occupancy schedules, and local climate data. It calculates energy loads, system performance, and energy consumption for heating, cooling, lighting, and other end-uses. So, the main concept of eQUEST simulation is the interactions between internal and external factors such as weather, building usage, and system efficiencies. It provides monthly and annual energy consumption results.
- Urban Cooling Model (InVEST): Simulates temperature reductions based on vegetation cover, surface albedo, and evapotranspiration rates (see Figure 6).
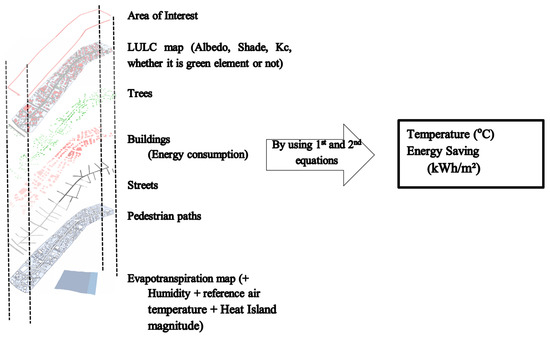 Figure 6. Urban cooling modeling.
3.3. Scenario Development
Each intervention scenario was mapped onto the case study area.
Scenario 1: Grass on Pedestrian Paths
- Identified high-traffic pedestrian zones;
- Converted tile walkways into grass surfaces.
Expected Outcome: Standardized temperatures, localized cooling.
Scenario 2: Increased Street Tree Cover
- Mapped street segments with minimal tree coverage;
- Increased tree density along streets.
Expected Outcome: Enhanced shading, moderate cooling.
Scenario 3: Green Roof Implementation
- Selected buildings suitable for green roof retrofitting;
- Converted conventional rooftops to green roofs.
Expected Outcome: Reduced building energy demand.
Scenario 4: High-Albedo Granite Pavement
- Applied material change along major streets;
- Replaced asphalt with high-reflective granite.
Expected Outcome: Limited but localized heat reduction.
Scenario 5: Combined Scenario
- Integrated all interventions simultaneously into a comprehensive district strategy.
Expected Outcome: Maximal temperature reduction and energy savings.
3.4. Results and Interpretation
As outlined in the methodology, the interrelated input layers, combined with specific biophysical parameters, were simulated using the mentioned software to assess the ecosystem service of mitigating the urban heat island effect. This evaluation demonstrated how the reduction in urban heat contributes to tangible benefits for residents, particularly through improved building energy consumption.
As the initial step, the current conditions of the key indicators (buildings, greenery, pedestrian paths, and streets) on the LULC map of Kızılay Boulevard were simulated. The resulting outcomes are presented in Figure 7.
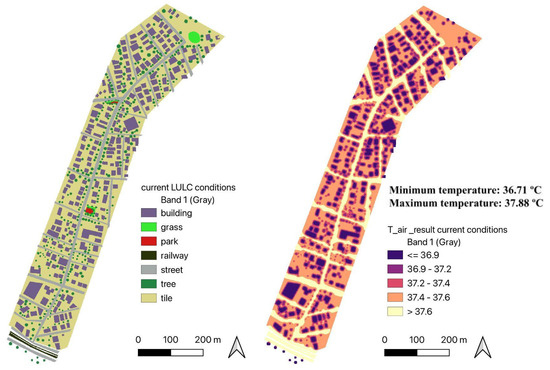
Figure 7.
The current LULC map and the air temperature results.
Figure 7 highlights notable variations in air temperatures across the district’s buildings, trees, and streets, which were recorded as approximately 36.8 °C, 37.2 °C, and 37.9 °C, respectively. Buildings exhibited the lowest air temperature, which was attributed to their complete shading and higher albedo, as detailed in Table 1 in the data processing section. Trees showed lower air temperatures than streets due to their natural green characteristics, including a crop coefficient of 0.48, combined with higher shading and albedo percentages.
For pedestrian pathways represented by the tile location on the LULC map, the proximity to buildings and trees significantly influenced their temperature variations. Pathways near buildings registered temperatures around 37.1 °C, while those near trees were slightly higher at approximately 37.4 °C. However, in areas outside the shading perimeters of buildings and trees, pedestrian pathways experienced temperatures reaching up to 37.6 °C. The average temperature across the entire district under the current conditions was 37.4 °C, with a temperature difference of 1.17 °C between the maximum and minimum values.
The InVEST software calculated the avoided energy consumption for the district’s current conditions to be 1,402,369 kWh. This value was derived by comparing the simulated conditions with a baseline scenario, modeled within the software, where no green elements are present, as outlined in its user guide.
Green elements play a dual role in mitigating air temperature and reducing building energy consumption, thereby contributing to cost savings. This highlights the importance of integrating greenery into urban environments. Based on the current conditions’ simulation results, it is evident that developing scenarios that foster the integration of buildings and green elements is essential for achieving the benefits of enhanced environmental efficiency and sustainability in the district.
As explained in Figure 1, five proposed scenarios were developed and simulated using the software to assess the impact of the study indicators on the targeted ecosystem service and its corresponding value.
In the LULC map scenario figures, the proposed changes are highlighted, while the other components (indicators) are displayed in grayscale.
Converting the pedestrian paths from tile into grass across the entire district, as illustrated in Figure 8, strongly decreased the air temperature of all the elements and locations within the area to around 36.7 °C, 0.7 °C less than the average temperature of the current LULC map. This conversion effectively standardized the temperature across the area, reducing the difference to just 0.05 °C between the minimum and maximum values. This demonstrates the importance of applying this scenario in terms of reducing and unifying the air temperature.
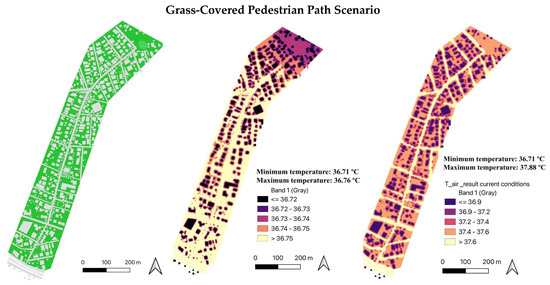
Figure 8.
Ground LULC map and the air temperature results for the scenario converting pedestrian paths from tile into grass compared to the current scenario’s results on the right.
For this scenario, the avoided energy consumption calculated for the studied district was 1,724,904 kWh, representing an improvement of approximately 23% compared to the current scenario. This improvement was attributed to the reduction in air temperature both inside and around the buildings, with a decrease of 0.1 °C indoors and 0.5 °C to 1 °C in the surrounding areas.
The results of the scenario with an increased number of trees (Figure 9) indicate a slight improvement in the district’s average temperature, reducing it to 37.34 °C—0.06 °C lower than the current scenario. Additionally, the temperature difference between the buildings and streets decreased to 0.5 °C, compared to 0.6 °C in the current scenario. Pedestrian paths closer to streets registered the same temperature as the streets (37.6 °C), while paths near buildings and trees recorded a lower temperature of 37.3 °C. In contrast, the current scenario showed a more noticeable temperature difference between pedestrian paths and streets throughout the district. However, there was a slight improvement in temperature variation, with the difference between the maximum and minimum values reduced to 1.09 °C—0.08 °C lower than in the current conditions.
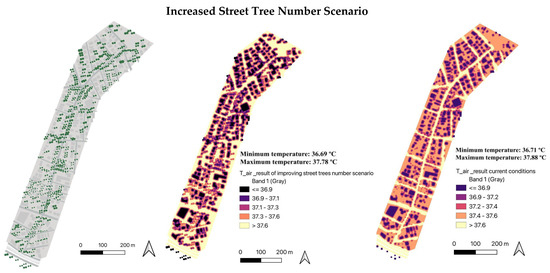
Figure 9.
LULC map and the air temperature results for the scenario converting increasing the number of street trees compared to the current scenario’s results on the right.
In this scenario, the district reduction in energy consumption was calculated to be 1,425,755 kWh, reflecting an approximate improvement of 1.7% compared to the current scenario. Thus, the slight improvements in temperature resulted in correspondingly slight improvements in energy savings.
In the green roof scenario, the district’s average temperature decreased to 37.13 °C, representing a reduction of 0.27 °C compared to the current conditions. Notably, this scenario also lowered the district’s minimum temperature to 36.33 °C, which is 0.38 °C cooler than the existing conditions.
The significance of implementing green roofs extends beyond their role as heat insulators for buildings; they also influence the surrounding environment through evaporation processes and shading effects. The average temperatures recorded for the different district elements were as follows: 36.5 °C for buildings, 36.9 °C for trees, 37.1 °C for pedestrian paths, and 37.2 °C for streets.
Despite the improvements, a 1.12 °C difference remained between the minimum and maximum temperatures in the district, as shown in Figure 10.
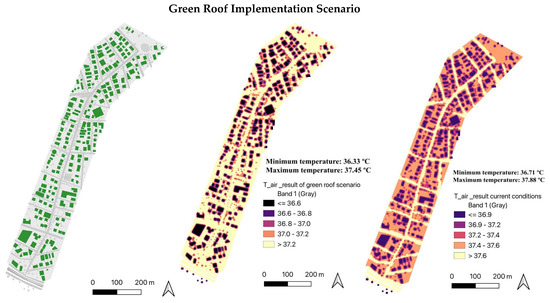
Figure 10.
LULC map and the air temperature results for the scenario implementing green roofs compared to the current scenario’s results on the right.
Regarding energy consumption improvements, converting building roofs to green roofs led to a significant reduction in energy use. The reduction in energy consumption amounted to 1,795,005 kWh, representing a 28% increase compared to the consumption under the current conditions. This improvement highlights the effectiveness of green roofs in decreasing cooling demands by minimizing heat transfer into buildings and lessening the dependence on mechanical cooling systems.
As shown in Figure 11, replacing asphalt with high-albedo granite pavement resulted in a modest temperature improvement, reducing the average temperature by 0.02 °C across the district. Additionally, this change lowered the maximum temperature to 37.73 °C, compared to 37.88 °C under the current conditions. However, the impact of this material change was less pronounced, as it lacked the cooling benefits of green, natural elements. Since the InVEST software primarily evaluates temperature based on vegetation, the effect of using high-albedo pavement remained limited.
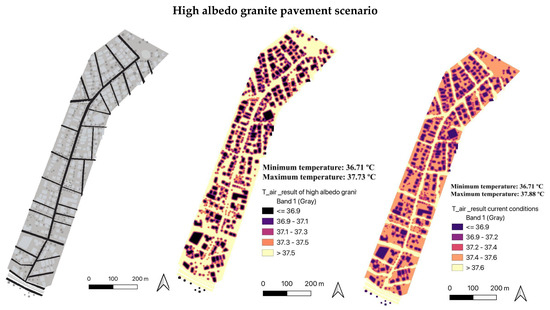
Figure 11.
LULC map and the air temperature results for scenario implementing higher-albedo granite pavement compared to the current scenario’s results on the right.
Consequently, the reduction in energy consumption was also modest, amounting to just 0.16% compared to the current scenario.
The analysis of Figure 12 revealed a noticeable transformation in the Land Use and Land Cover (LULC) map of the Kartal District, which, under the combined scenario, predominantly featured green areas. This shift indicates a high level of integration between greenery and the other urban elements. The proposed modifications included converting pedestrian pathways into grass-covered surfaces, transforming building roofs into green roofs, increasing the number of street trees, and replacing asphalt pavement with higher-albedo granite pavement.
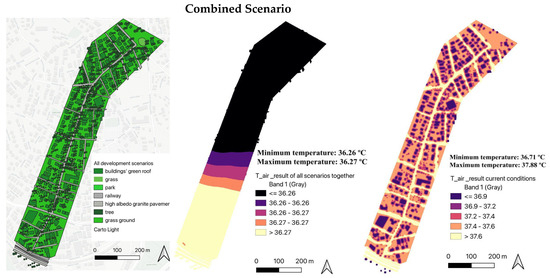
Figure 12.
LULC map and the air temperature results after applying all development scenarios compared to the current scenario’s results on the right.
Figure 12 further illustrates the combined positive effects of implementing all the development scenarios on the district’s LULC map and air temperature. The collective application of these strategies produced a more significant and widespread impact compared to implementing each strategy individually. For instance, the temperature differences between the district’s elements (pedestrian paths, streets, and buildings) were effectively eliminated, resulting in a uniform temperature of 36.26 °C across the district. This uniformity ensures that pedestrians experience consistent thermal comfort while moving through the area, without encountering hotspots, even when crossing streets. To better understand the impact of these integrated development strategies, a comparison with the current LULC conditions was conducted. The results indicated that the average air temperature decreased by 1.14 °C compared to the existing conditions. Additionally, the temperature variation across the district, which is currently 1.17 °C, nearly disappeared after applying all the scenarios, reducing it to just 0.01 °C. This uniform cooling significantly enhanced energy efficiency, with the reduction in energy consumption calculated at 2,252,383 kWh, representing an improvement of approximately 61% over the current conditions.
Table 3 summarizes the results and present them in a more concise and readable format. The combined implementation of all scenarios reduced the temperature of all indicators to approximately 36.26 °C, achieving temperature reductions of 1.62 °C for streets, 1.1 °C for pedestrian paths, 0.94 °C for trees, and 0.54 °C for buildings. Notably, when examining each scenario individually, converting pedestrian paths from tile to grass demonstrated a significant cooling effect, not only on the paths themselves but also on the temperatures of the other indicators (trees and streets). However, the buildings’ temperature remained the lowest at 36.50 °C under the green roof scenario, highlighting the unique thermal benefits of green roofs.
Table 3.
The approximate air temperature outcomes for the indicators under the simulated scenarios.
Furthermore, as illustrated in Table 4 and Figure 13, the principle that lower temperatures lead to lower energy demands is evident. The combined application of all scenarios demonstrated a significant impact on both temperature reductions and energy savings, reinforcing the findings discussed earlier. When analyzing each scenario individually, distinct patterns emerged regarding their impact on reducing energy consumption and the average air temperature.
Table 4.
The effect of each development scenario on energy efficiency.
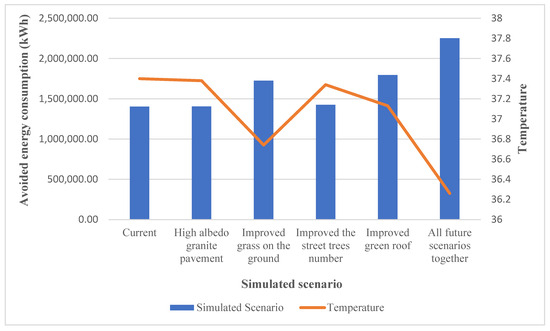
Figure 13.
Air temperature and reduction in energy consumption in different scenarios.
Green Roof Scenario: This scenario primarily reduced the temperature of buildings by acting as a heat insulator, leading to notable energy savings. While its cooling effect extended slightly to the surrounding environment, the primary benefit was observed in the reduction in building energy demands.
Pedestrian Path Conversion (Grass): Converting pedestrian paths from tiles to grass showed a strong localized cooling effect, significantly lowering the temperature of nearby elements. This scenario demonstrated the largest impact on non-building indicators, such as streets and trees, and contributed to reductions in energy consumption through indirect cooling benefits.
Street Trees Increase: Adding more trees along the streets improved shading and promoted evaporative cooling, moderately reducing temperatures across the urban surfaces. The energy savings were less pronounced compared to other scenarios but showed an overall improvement.
High-Albedo Pavement: Replacing asphalt with high-albedo granite pavement reduced the heat absorption of streets, effectively lowering air temperatures in those areas. While beneficial for street-level cooling, the broader impact on energy consumption was limited.
The results shown in Table 4 can be summarized as follows:
Temperature Reduction
- The highest impact was observed in the combined scenario (−1.14 °C).
- Implementing green roofs produced the highest localized cooling for buildings (−0.27 °C).
- Grass-covered paths significantly reduced pedestrian-level temperatures.
Energy Savings
- Implementing green roofs produced the highest reduction in energy demand (28%).
- All interventions together resulted in a 61% energy saving.
Each scenario, when applied alone, highlighted their specific contributions to urban cooling and energy efficiency. However, the most substantial benefits were realized when these strategies were combined, as demonstrated by the combined scenario analysis.
4. Conclusions
Each scenario was simulated, and the results were compared against current conditions. The key findings are as follows:
- In the baseline condition, the district’s average air temperature was 37.4 °C, with high variability across different surfaces.
- Implementing grass-covered pedestrian paths reduced the air temperature by 0.7 °C and improved the energy savings by 23%.
- Increasing the street tree cover achieved a modest 0.06 °C temperature reduction and 1.7% energy savings.
- Green roof implementation lowered the average temperature by 0.27 °C and reduced the energy demand by 28%.
- The use of high-albedo pavement provided a minor 0.02 °C cooling effect with negligible energy savings (0.16%).
The combined strategy yielded the most substantial benefits by integrating greenery with optimized urban surfaces. The simulation results indicate that green roofs were particularly effective in reducing building energy demands, while grass-covered pedestrian paths contributed significantly to lowering district-wide temperatures. The high-albedo pavement had a limited cooling effect, reinforcing the importance of prioritizing vegetation-based strategies for long-term urban sustainability.
Moreover, the relationship between air temperature and energy efficiency highlights how reducing urban heat translates into lower cooling loads and increased sustainability. The findings emphasize the necessity for district-wide, multi-indicator interventions rather than isolated modifications. Future urban planning in Kartal should adopt data-driven decision-making, ensuring that greenery integration, reflective materials, and passive cooling strategies are effectively combined to maximize environmental benefits.
The study confirms that integrated urban design strategies combining greenery, reflective materials, and smart landscape planning can effectively mitigate UHI effects and enhance energy efficiency. While the individual interventions provided measurable benefits, the combined scenario achieved the highest cooling impact. Future urban planning efforts in Kartal should prioritize multi-software analysis and district-wide implementation of these strategies to improve sustainability and urban resilience.
Given the direct relationship between air temperature and energy consumption, lowering air temperatures could reduce cooling energy demands and result in cost savings, improving energy efficiency and sustainability. These benefits contribute to the district’s overall sustainability by preserving resources, improving the environmental conditions, and promoting human well-being. Moreover, reducing temperatures can also address health concerns related to heat stress, enhance work productivity, and improve quality of life.
Furthermore, employing greenery to combat the urban heat island effect offers additional advantages, including improved visual aesthetics, reduced emissions, better water management, enhanced air quality, and optimized spatial patterns within the urban fabric. This integrated approach underscores the multifunctional value of green infrastructure in urban planning and development, emphasizing its interconnected contributions to urban and social sustainability.
This study proposed strategies and scenarios that are broadly applicable across urban districts; however, several limitations should be noted.
- The implementation of green roofs is feasible on both flat and inclined roofs. However, inclined roofs limit user accessibility, although their effectiveness in reducing temperature and conserving energy remains valid. Additionally, some buildings, particularly older structures, may not be structurally capable of supporting the added weight of green roofs and irrigation systems, which must be carefully assessed during the initial planning phase.
- The strategy of increasing street tree numbers may face constraints in areas where the sidewalks are too narrow or altogether absent. Furthermore, potential conflicts with existing underground infrastructure such as water pipes, electrical lines, or gas cables may arise, requiring thorough site assessments and coordination with utility services before implementation.
- Implementing grass along pedestrian pathways throughout an entire district may involve high initial costs and require regular maintenance. These expenses could be offset by the resulting decrease in ambient temperature and energy consumption. It is essential to consider the inclusion of accessible routes for individuals with disabilities and dedicated lanes for cyclists, as their movement may be hindered on grassy surfaces.
- Replacing conventional asphalt with high-albedo granite pavement, although beneficial for thermal mitigation, may be economically impractical for districts operating under limited budgets due to its relatively modest impact on temperature reduction and energy efficiency.
Given that landscape sustainability encompasses various aspects—environmental, efficiency, urban, and social aspects—each with numerous associated indicators, this study provides an example for future research. Subsequent studies can build upon and replicate this approach to evaluate other sustainable landscape indicators. By integrating these findings, Kartal District could serve as a comprehensive model of an inclusive and sustainable urban district. In addition, this kind of study can be applied to urban districts with a high population density, high traffic levels, and lack of green spaces.
Author Contributions
Methodology, H.S. and S.S.H.; Validation, H.S. and S.S.H.; Formal analysis, S.S.H.; Investigation, S.S.H.; Writing—original draft, S.S.H.; Writing—review & editing, H.S. All authors have read and agreed to the published version of the manuscript.
Funding
This project did not received any direct funding. However, the demonstration site and data were provided by the PED4ALL (Positive Energy Districts for All: Energising Neighbourhoods through Fair Strategies) project (Project No: 2022-EU-PED-1).
Institutional Review Board Statement
Not applicable.
Informed Consent Statement
Not applicable.
Data Availability Statement
The original contributions presented in this study are included in the article. Further inquiries can be directed to the corresponding author.
Conflicts of Interest
The funders had no role in the design of the study; in the collection, analyses, or interpretation of data; in the writing of the manuscript; or in the decision to publish the results.
References
- Kleerekoper, L.; Van Esch, M.; Salcedo, T.B. How to make a city climate-proof, addressing the urban heat island effect. Resour. Conserv. Recycl. 2012, 64, 30–38. [Google Scholar] [CrossRef]
- Deng, X.; Yu, W.; Shi, J.; Huang, Y.; Li, D.; He, X.; Zhou, W.; Xie, Z. Characteristics of surface urban heat islands in global cities of different scales: Trends and drivers. Sustain. Cities Soc. 2024, 107, 105483. [Google Scholar] [CrossRef]
- Deepthi, S.; Sudalaimani, K.; Priya, R.S.; Radhakrishnan, S. Evaluating urban heat island to achieve sustainable development goals: A case study of Tiruchirappalli city, India. Sustain. Cities Soc. 2024, 116, 105865. [Google Scholar]
- Rosenzweig, C.; Solecki, W.; Slosberg, R. Mitigating New York City’s Heat Island with Urban Forestry, Living Roofs, and Light Surfaces; New York State Energy Research and Development Authority: Albany, NY, USA, 2006. [Google Scholar]
- Acosta, M.P.; Vahdatikhaki, F.; Santos, J.; Jarro, S.P.; Dorée, A.G. Data-driven analysis of Urban Heat Island phenomenon based on street typology. Sustain. Cities Soc. 2024, 101, 105170. [Google Scholar] [CrossRef]
- Fu, S.; Wang, L.; Khalil, U.; Cheema, A.H.; Ullah, I.; Aslam, B.; Tariq, A.; Aslam, M.; Alarifi, S.S. Prediction of surface urban heat island based on predicted consequences of urban sprawl using deep learning: A way forward for a sustainable environment. Phys. Chem. Earth Parts A/B/C 2024, 135, 103682. [Google Scholar] [CrossRef]
- Ghorbany, S.; Hu, M.; Yao, S.; Wang, C. Towards a Sustainable Urban Future: A Comprehensive Review of Urban Heat Island Research Technologies and Machine Learning Approaches. Sustainability 2024, 16, 4609. [Google Scholar] [CrossRef]
- Ahmed, N.M.; Altamura, P.; Giampaoletti, M.; Hemeida, F.A.; Mohamed, A.F.A. Optimizing human thermal comfort and mitigating the urban heat island effect on public open spaces in Rome, Italy through sustainable design strategies. Sci. Rep. 2024, 14, 19931. [Google Scholar] [CrossRef]
- Abdalazeem, M.E.; Hassan, H.; Asawa, T.; Mahmoud, H. Review on integrated photovoltaic-green roof solutions on urban and energy-efficient buildings in hot climate. Sustain. Cities Soc. 2022, 82, 103919. [Google Scholar] [CrossRef]
- Maier, D. Perspective of using green walls to achieve better energy efficiency levels. A bibliometric review of the literature. Energy Build. 2022, 264, 112070. [Google Scholar] [CrossRef]
- de Oliveira Santos, T.D.; Pacheco, F.A.L.; Fernandes, L.F.S. A systematic analysis on the efficiency and sustainability of green facades and roofs. Sci. Total Environ. 2024, 932, 173107. [Google Scholar] [CrossRef]
- Savić, S.; Krstić, H.; Šećerov, I.; Dunjić, J. Decreasing the energy demand in public buildings using nature-based solutions: Case studies from Novi Sad (Republic of Serbia) and Osijek (Republic of Croatia). Energy Sustain. Soc. 2024, 14, 23. [Google Scholar] [CrossRef]
- Okwandu, A.C.; Akande, D.O.; Nwokediegwu, Z.Q.S. Green architecture: Conceptualizing vertical greenery in urban design. Eng. Sci. Technol. J. 2024, 5, 1657–1677. [Google Scholar] [CrossRef]
- Varshney, K. Regenerative Architecture: Carbon Sequestration and Habitat Provisioning Through Building Design. Ph.D. Dissertation, Te Herenga Waka-Victoria University of Wellington, Wellington, New Zealand, 2024. [Google Scholar]
- Abd Rahman, H.; Yusoff, N.S.M.; Omar, M. December. Perception of Green Roof Users with Their Mental Well-Being. In IOP Conference Series: Earth and Environmental Science; IOP Publishing: Bristol, UK, 2023; Volume 1274, p. 012036. [Google Scholar]
- Boancă, P.I.; Oprică, A.; Bodea, S.; Mărincean, A. Cover assessment, tree benefits report and landscape evaluation for reconstruction and expansion of the northern and northeastern vegetative barrier of the national ethnographic park “romulus vuia”. Agricultura 2023, 128, 82–104. [Google Scholar] [CrossRef]
- Available online: https://www.meteoblue.com/en/weather/historyclimate/climatemodelled/sahilk%c3%b6y_republic-of-t%c3%bcrkiye_747930 (accessed on 10 January 2024).
- NASA Website. Available online: https://ladsweb.modaps.eosdis.nasa.gov/search/order/4/MOD16A2--61/2022-01-10..2023-01-01/DNB/29.1,41,29.2,40.8> (accessed on 14 January 2024).
- Irmak, S. Evapotranspiration. In Encyclopedia of Ecology, Five-Volume Set; Elsevier Inc.: Amsterdam, The Netherlands, 2008; pp. 1432–1438. [Google Scholar] [CrossRef]
- Levitt, D.G.; Simpson, J.R.; Tipton, J.L. Water use of two landscape tree species in Tucson, Arizona. J. Am. Soc. Hortic. Sci. 1995, 120, 409–416. [Google Scholar] [CrossRef]
- Url4. Available online: https://www.researchgate.net/figure/Approximate-crop-coefficient-Kc-values-by-month-for-established-alfalfa-in-different_tbl1_268179711 (accessed on 18 September 2024).
- Zawadzka, J.E.; Harris, J.A.; Corstanje, R. Assessment of heat mitigation capacity of urban greenspaces with the use of InVEST urban cooling model, verified with day-time land surface temperature data. Landsc. Urban Plan. 2021, 214, 104163. [Google Scholar] [CrossRef]
- Dobos, E. Albedo. In Atmosphere and Climate; CRC Press: Boca Raton, FL, USA, 2020; pp. 25–28. [Google Scholar]
- Taha, H.; Akbari, H.; Rosenfeld, A.; Huang, J. Residential cooling loads and the urban heat island—The effects of albedo. Build. Environ. 1988, 23, 271–283. [Google Scholar] [CrossRef]
- Prado, R.T.A.; Ferreira, F.L. Measurement of albedo and analysis of its influence the surface temperature of building roof materials. Energy Build. 2005, 37, 295–300. [Google Scholar] [CrossRef]
- Salleh, S.A.; Latif, Z.A.; Pradhan, B.; Wan Mohd, W.M.N.; Chan, A. Functional relation of land surface albedo with climatological variables: A review on remote sensing techniques and recent research developments. Geocarto Int. 2014, 29, 147–163. [Google Scholar] [CrossRef]
- Barradas, V.L.; Adem, J. Albedo model for a tropical dry deciduous forest in western Mexico. Int. J. Biometeorol. 1992, 36, 113–117. [Google Scholar] [CrossRef]
- Jung, S.J. Pedestrian-path pavement materials to improve microclimate and air quality on current pedestrian paths. Urban Clim. 2024, 55, 101973. [Google Scholar] [CrossRef]
- Li, W.C.; Yeung, K.K.A. A comprehensive study of green roof performance from environmental perspective. Int. J. Sustain. Built Environ. 2014, 3, 127–134. [Google Scholar] [CrossRef]
- Url3. Available online: https://www.researchgate.net/figure/Assigned-values-for-emissivity-and-albedo-All-as-signed-values-are-from-Obe-1987_tbl5_250220857 (accessed on 18 September 2024).
- Url2. Available online: https://yceo.users.earthengine.app/view/uhimap (accessed on 14 January 2024).
Disclaimer/Publisher’s Note: The statements, opinions and data contained in all publications are solely those of the individual author(s) and contributor(s) and not of MDPI and/or the editor(s). MDPI and/or the editor(s) disclaim responsibility for any injury to people or property resulting from any ideas, methods, instructions or products referred to in the content. |
© 2025 by the authors. Licensee MDPI, Basel, Switzerland. This article is an open access article distributed under the terms and conditions of the Creative Commons Attribution (CC BY) license (https://creativecommons.org/licenses/by/4.0/).