Article

Pump Model for Drip Irrigation with Saline Water, Powered by a Photovoltaic Solar Panel with Direct and Intermittent Application

by
Vinicius Cossich
1,*,
Marcio Antonio Vilas Boas
1,
Antonio Augusto Alves Pereira
2,
Renato Guardini
3,
Allan Remor Lopes
4,
Naila Cristina Kepp
1,
Dário Machado Júnior
5 and
Altair Bertonha
6
1
Center for Exact and Technological Sciences, Graduate Program in Agricultural Engineering, State University of Western Paraná (UNIOESTE), University Street, n° 2069, Cascavel 85819-110, PR, Brazil
2
Department of Rural Engineering, Federal University of Santa Catarina (UFSC), Admar Gonzaga Highway, 1346, Itacorubi, Florianópolis 88034-000, SC, Brazil
3
Agricultural Research and Rural Extension Company of Santa Catarina (EPAGRI), Admar Gonzaga Highway, 1188, Itacorubi, Florianópolis 88034-000, SC, Brazil
4
Department of Agronomy, State University of Londrina (UEL), Rodovia Celso Garcia Cid, PR-445, Km 380-Campus Universitário, Londrina 86057-970, PR, Brazil
5
Department of Mechanical Engineering, State University of Maringá (UEM), Avenue Colombo, n° 5790, Zona 7, Maringá 87020-900, PR, Brazil
6
Department of Agronomy, State University of Maringá (UEM), Avenue Colombo, n° 5790, Zona 7, Maringá 87020-900, PR, Brazil
*
Author to whom correspondence should be addressed.
Sustainability 2025, 17(9), 3981; https://doi.org/10.3390/su17093981
Submission received: 31 December 2024 / Revised: 20 March 2025 / Accepted: 29 March 2025 / Published: 28 April 2025
(This article belongs to the Special Issue Environmental and Social Sustainability in Rural Development)

Abstract

:
Irrigation is crucial for agricultural production in dry regions. However, water salinity is a risk for the soil–plant combination and the longevity of the materials that make up the irrigation system. Drip irrigation using direct and intermittent photovoltaic pumping can be key for optimizing irrigation with saline water. This article compares two pump models to understand which has the greatest capacity to reduce the risks of salinity in irrigated agriculture, aiming to make the system more sustainable through more efficient irrigation, without the need for highly expensive corrective cleaning measures. The ideal pump was evaluated using the motor pump’s electrical and hydraulic parameters and the water’s quality parameters applied by irrigation. The results indicate that the diaphragm pump is more sensitive to disturbances in irrigation management when compared to the centrifugal pump; however, it stands out in the following areas: it is more efficient, that is, it operates for more hours of the day with a direct connection with the photovoltaic panels; delivers better distribution uniformity in both continuous and pulsed application; and it makes the drip irrigation system with saline water more resistant to clogging.

1. Introduction

Sustainable agriculture is defined as a strategy that seeks to optimize economic gains while preserving the integrity of the environment. To achieve this sustainability, it is essential to promote economic incentives aimed at developing and implementing precision technologies, ensuring that the waste generated is minimal and does not harm the environment [1].
Irrigation is crucial for agricultural production in dry regions. However, water salinity risks the soil–plant combination and the longevity of the materials that make up the irrigation system. This could turn irrigation into a practice that goes against the principles of sustainability.
Irrigation transports minerals to the soil, where they agglomerate, and as evaporation occurs, their concentration increases. To ensure that salinity levels in the soil do not damage crop development, the water must be adequate to meet the crop’s needs and remove salt from the root zone [2,3]. However, applying this strategy is restricted in various situations, such as when the water table in the area is shallow [4].
Drip irrigation, with its low flow rate and frequent application possibilities, allows high soil humidity in the root zone to be sustained without leaching [5]. The pattern of soil salinity depends on the properties of the soil, water quality, fertilizer management, and irrigation design. Several studies have investigated the effects of irrigation parameters with saline water.
Nightingale et al. (1991) concluded that increasing the amount of irrigation reduced salinity in the soil depth below the drip line [6]. Experiments conducted by Khan et al. (1996) showed that the concentration of solutes in the soil increased with the input concentration, the amount applied, and the application speed [7]. Laasri et al. (2024) and Mortadi et al. (2024), on the other hand, looked at the quality of the water in a solar-powered desalination process for domestic wastewater and seawater, respectively, concluding that both are suitable for irrigation [8,9]. Meerbach et al. (2000) showed that salt agglomeration within the cotton root zone changes with the change in irrigation layout [10]. Souza et al. (2009) demonstrated the advantage of applying lower solution doses in more frequent irrigation shifts to reduce losses due to the leaching of water and solutes [11]. Guan et al. (2013) showed that the low uniformity of irrigation application leads to a significant fluctuation in the salt content of the soil layers at a depth of 60 cm [12].
The results above contribute to the development of the design, operation, and management of drip irrigation systems using saline water. They also guide the development of new technologies and processes that can be applied to irrigation with saline water, such as drip irrigation with direct and intermittent photovoltaic pumping, which is the focus of this article.
Solar pumping projects first appeared in the late 1970s, aimed at supplying water to remote rural communities [13]. Their use has spread worldwide, mainly in developed countries, and they currently represent a reliable and consolidated technology backed by more than four decades of accumulated experience.
Several photovoltaic pumping projects have been developed and tested [14]. These systems work with either alternating or direct current, with voltage variation. They are connected directly or with batteries, use different types of pumps, and operate in different climatic conditions. Kumar et al. (2015) proposed a gravity irrigation system integrated with a low-cost solar pumping system [15]. Pande et al. (2003), for example, instigated a design format based on the uniformity of an application [16]. Reca et al. (2016) and Zavala et al. (2020) analyzed the multisectoral application of this irrigation pattern [17,18]. Cervera-Gasco et al. (2020) suggested adding mathematical models to design drip irrigation systems limited to this energization system [19].
In particular, the direct and intermittent application of photovoltaic pumping, i.e., operating without the use of batteries or water storage tanks and with the aid of a timer to apply the blade in pulses, is noteworthy. This setup allows the system to operate throughout the morning and part of the afternoon; thus, irrigation benefits from long operating times and fluctuating pressure levels due to fluctuating irradiance. According to Qiang Li (2019), drip irrigation with a longer floating pressure period is better at reducing clogging caused by chemical precipitates [20]. Calcium and magnesium precipitates, for example, are formed, especially when the system is not in operation. In alternating wet and dry periods of long-term irrigation, the adhesion layer of the chemical deposit on the inner wall of the hose gradually thickens, increasing the adhesive force of the wall and, thus, compromising the flow rate of the emitter [21].
Regarding technology, photovoltaic water pumping systems have significantly advanced in the last decade. According to Protoger and Pearce (2000), there are two types of photovoltaic pumping technologies: the first uses centrifugal (dynamic) pumps, which have hydraulic efficiency ranging from 25 to 35% and perform less efficiently in low solar radiation situations [22]. The second technology uses positive displacement pumps (diaphragm pumps), characterized by lower power requirements and high hydraulic efficiency, which can reach up to 70%. However, the flow rate is directly proportional to the amplitude of the applied voltage.
In photovoltaic pumping projects, electronics optimize the system’s efficiency. When operating without the aid of controllers, the pump can suffer from energy peaks at times of high and low irradiance. Thus, according to Chandel et al. (2015), using electronic systems that can control the instantaneous power delivered to the pump results in better system performance [13]. Centrifugal pumps, for example, exhibit load characteristics that are very close to the point of maximum photovoltaic power, allowing them to operate well in this connection model. Positive displacement pumps, on the other hand, have different speed–torque characteristics and are not suitable for direct connection to photovoltaic panels. A power conditioning unit and a power point tracking system are advisable when these pumps are used.
Against this background, this work is divided into two stages. Firstly, the aim is to determine the performance of a bench drip irrigation system with direct and autonomous photovoltaic pumping, operating under two pumps with similar powers and different technologies. The second stage is to ascertain the quality of irrigation using the most suitable pump for application with saline water in a pulsed pumping system.
Thus, the innovative aspect of this research is that it compares two different pumps based on a specific application—irrigation with saline water. In addition to highlighting the characteristics of the equipment, care is taken to assess whether certain limitations are unfavorable for the application. As a result, the work is also concerned with recommending auxiliary parts when necessary, such as the DC converter, as well as management methods that improve irrigation results, such as pulsed application.

2. Materials and Methods

2.1. Site Characterization

The experiment occurred from October 2023 to November 2024 in two locations. The first stage was carried out at the Irrigation and Fertigation Laboratory of the State University of Western Paraná (UNIOESTE), in Cascavel, Paraná, Brazil, with geographical coordinates of 24°58′0″ south and 53°31′48″ west. Moreover, the last stage was carried out at the training center of the Agricultural Research and Rural Extension Company of Santa Catarina (EPAGRI), in Florianópolis, Santa Catarina, Brazil, with geographical coordinates of 27°34′54″ south and 48°30′22″ west.

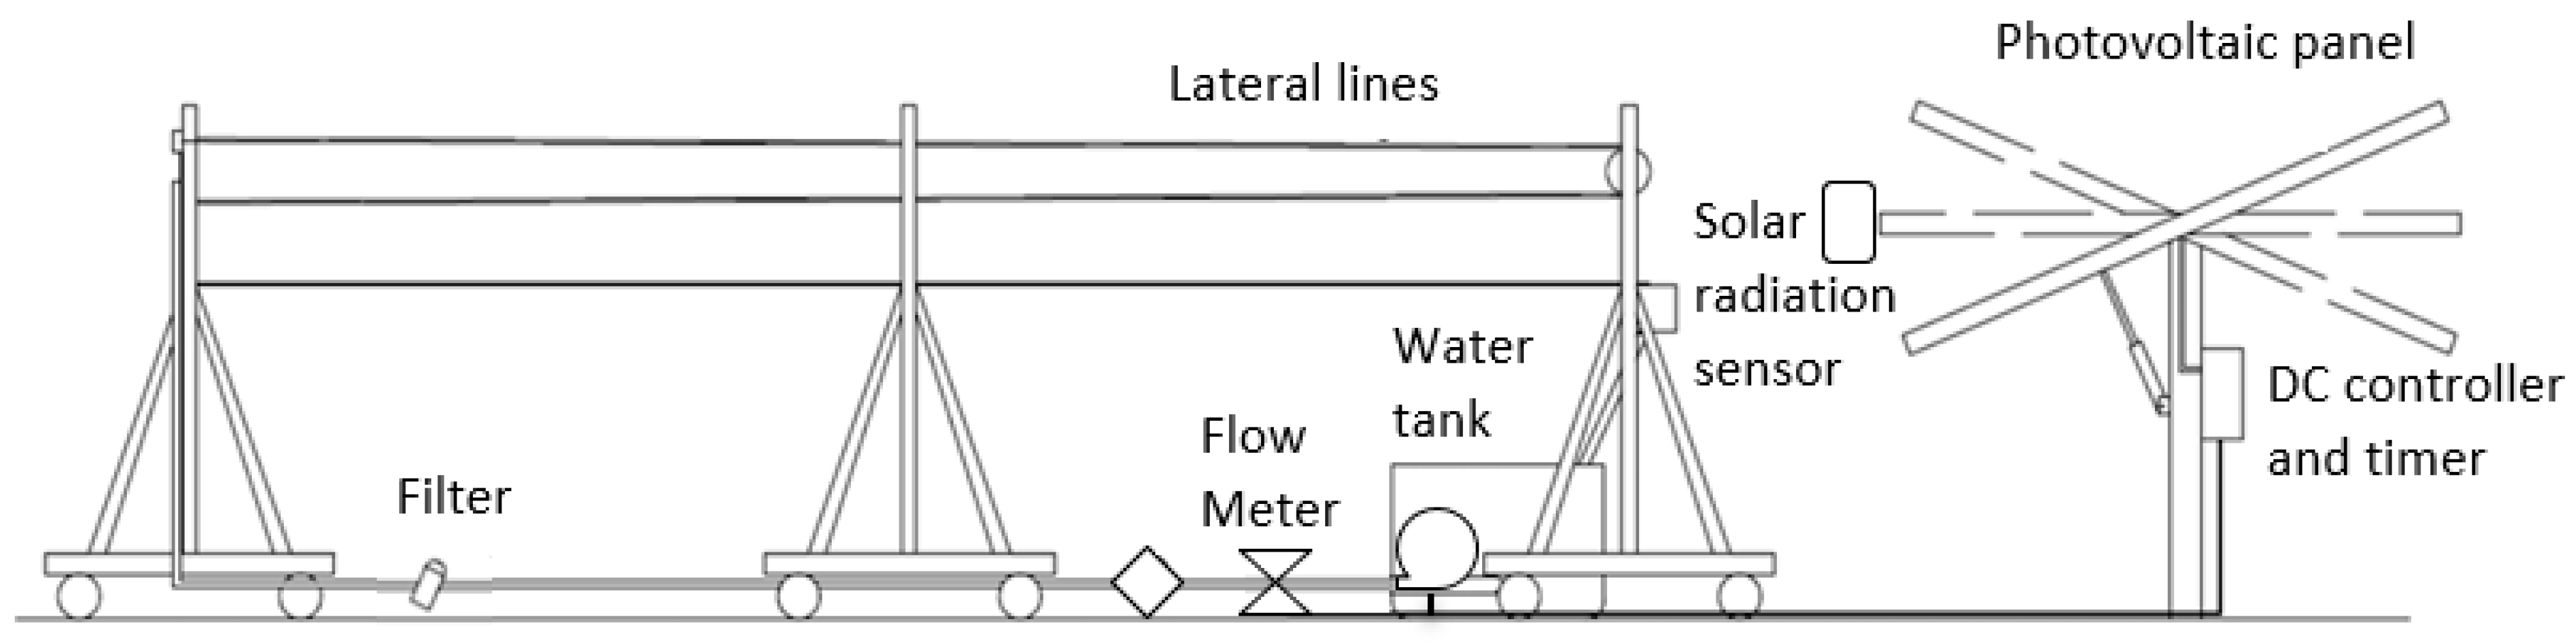
2.2. Irrigation System

The hose selected for this study was the Aries 16200 (Netafim—Sao Paulo, Brazil), with a spacing of 0.40 m and a flow rate of 1.5 L· h 1 at 1 bar. The pipe has a diameter of 16 mm, a thickness of 0.5 mm, a discharge coefficient of 0.52, and a discharge exponent of 0.46, resulting in a characteristic flow–pressure equation, represented by the potential Equation (1):
q = 0.52 × h 0.46
where q is the flow rate of the emitter (L· h 1 ); and h is the hydraulic pressure at the water inlet to the emitter (KPa).
A 200-mesh filter, a 2.5 bar pressure sensor, and a flow meter were installed. Table 1 shows the measuring ranges and accuracies of both sensors.
A RS6E 150P (Resun—Changzhou City, Jiangsu Province, China) solar module was used to validate the irrigation setup. Measures were implemented to ensure the cleanliness of the panel and minimize external impacts. The characteristics of the photovoltaic panels are shown in Table 2.
Energy production data were collected using an M430 ammeter voltmeter. The irradiation indices were detected using a portable meter, model SM206. Table 1 shows the measurement scale and accuracy of the sensors.
This study used two Seaflo motor pumps. The first model, SFSP-G500-02A, is a centrifugal pump with a flow rate of 31 L· m i n 1 , a height of 7 m, operating at 12 v, 4.5 A, with a maximum current of 7.5 A. The second model, SFDP1-010-035-21, is a diaphragm pump, with a flow rate of 3.8 L· m i n 1 , operating at 12 V, 1.6 A, with a maximum current of 2.5 A, and a height of 28 m.
The converter under analysis was an XL4016 step-down voltage regulator that converts an input voltage of 8 V to 40 V into an output voltage of 1.25 V to 36 V.
The entire irrigation system was installed on a test bench (Figure 1). These tests—conducted in a protected environment—were designed to reduce the effects of the weather on the irrigation system as much as possible, i.e., without drying out, without the risk of clogging by soil particles, and with a stable temperature. This bench measured 5.0 × 1.5 m and had four 10 m long lateral lines, a gutter for water reuse, and a 200-L reservoir.
The last stage was carried out with an irrigation system installed in the field under the open sky, with the exact dimensions as the first stage. Unlike the first stage, the impact of time on the irrigation system was designed to represent—as closely as possible—the dynamics of emitter clogging in a real irrigation project.

2.3. Experimental Design

The experimental project was carried out in two phases. The first phase evaluated the system’s power, efficiency, current, and voltage using a 2 × 2 × 2 factorial scheme. Two hydraulic designs (attached and detached from the lateral lines), the presence and absence of the DC converter, and the type of pump (centrifugal and diaphragm) were evaluated, with 25 samples in four irradiance ranges: 0 to 300 W· m 2 ,   301 to 600 W· m 2 ,   601 to 900 W· m 2 ,   a n d   901 to 1200 W· m 2 .
In the second phase, 25 samples were taken to check the uniformity of the irrigation blade under irradiation from 0 to 300 W· m 2 , without the DC converter. These same 25 uniformity tests were also carried out using a diaphragm pump with a DC converter and a centrifugal pump without a DC converter, with 5-min intermittent applications using saline water.
The saline water came from mixing fertilizers in drinking water, adhering to the minimum application guidelines recommended by each fertilizer’s manufacturer. The dilutions were as follows: urea at 5 g· L 1 , and calcium nitrate, magnesium sulfate, potassium chloride, sodium nitrate, and iron sulfide, all at a concentration of 1.2 g · L 1 . The simultaneous dilution of all fertilizers was designed to simulate the worst conditions to be encountered in a real application. The physicochemical analysis of the saline water followed the APHA methodology [24]. The parameters are described in Table 3.
It is worth adding that before the 25 uniformity tests with saline water were carried out, the irrigation system was fed with the same water for two months, also in a pulsed manner, twice a week. To do this, 200 L of saline water were separated in a reservoir and applied until the tank was empty. The pulsed regime was carried out manually using a stopwatch, alternating between 5 min on and 10 min off.

2.4. Experimental Procedure

Table 4 shows the equations used to calculate the performance factors in this study. These are solar power (Equation (2)), electrical power from the panel-pump assembly (Equation (3)), hydraulic power (Equation (4)), motor assembly efficiency (Equation (5)), and total system efficiency (Equation (6)).
P o t S o l = A × I r r
P o t e = U × I
P o t h = ρ × g × Q × H
n m o t o r   p u m p = P o t h P o t e × 100
n T o t a l = P o t h P o t S o l × 100
The flow versus head graph for the proposed photovoltaic pumping system was made at irradiance levels above 1000 W· m 2 . To do this, the methodology recommended by Cossich et al. (2024) was used to evaluate the pump’s flow rate and pressure across different manometric heights and compare these measurements with the reference values provided by the manufacturer [27]. Ten repetitions were carried out at seven different heights, with the panel oriented north and inclined at 15°, always between 11:30 and 12:30 on clear, sunny days.
Data were collected to assess the uniformity of the applied irrigation water distribution, according to the method by Keller and Karmeli (1974) [28]. To do this, the flow rates of the first dripper, located 1/3 and 2/3 along the line, as well as the last dripper, were measured in all four system lines. The flow rate of the emitters was measured using the gravimetric method, with volume collected for 5 min. A digital scale, accurate to 0.1 g, was used to weigh the samples, and the volume was calculated considering the density of water equal to 1000 kg· m 3 .
The hydraulic evaluations used the ISO standard [29]. The flow rate was calculated according to Equation (7):
q = v 1000   ×   t ×   60
where q—dripper flow rate (L· h 1 ); V—collected volume (mL); and t—collection time (minutes).
The distribution uniformity coefficient (DUC), proposed by (Merrian and Keller 1978), was used, as shown in Equation (8) [30].
D U C = 100 X 25 X m e d
where DUC—distribution uniformity coefficient (%); X 25 —average of the lowest quartile of the volumes of water collected in the drains (mm); and X m e d —overall average of the volumes of water harvested (mm).
Table 5 presents the criteria used to classify the irrigation system’s efficiency, according to Keller and Bliesner (1990) [31].
The Montgomery (2016) [32] procedure was used to understand the Shewhart and EWMA control charts of the DUC values.
In the Shewhart control chart, the number of observations in the sample is n = 1, consisting of a single individual unit. Control charts were used for individual measurements based on the moving intervals of two consecutive observations to estimate process variability [32]. The upper and lower control limits were calculated using Equations (9) and (10), respectively.
U C L = X ̿ + L M R d 2
L C L = X ̿ L M R d 2
where X ̿ —mean of the averages; L—distance from the control limits to the center line, in units of standard deviation; MR—mean of the amplitudes of the data; and d 2 = 1.128 for n = 2, with unique measures, according to [32].
In the Shewhart control chart, control limits with L = 3 indicate that 370 samples are needed to detect an out-of-control condition, while L = 2 allows this detection with 22 samples. Common causes drive the data, which follows a normal distribution.
The EWMA control chart effectively evaluates sequential data, prioritizes recent information, and is more suitable than the Shewhart chart for non-normal data. It is defined by Equation (11):
Z i = λ x i + 1 λ   z i 1
where 0 < λ ≤ 1; Z i = u 0 = X ̿ . The variance of the Z variable is shown in Equation (12).
σ z i 2 = σ 2 λ 2 λ 1 1 λ 2 i
where σ is the standard deviation of the data from the mean, λ is the weight assigned to each sample, and i is the order of the samples selected.
The UCL and LCL of the EWMA control chart can be estimated using Equations (13) and (14), respectively:
U C L = X ̿ + L σ λ 2 λ 1 1 λ 2 i
L C L = X ̿ L σ λ 2 λ 1 1 λ 2 i
where X ̿ —mean of the data; λ—weight attributed to each sample, which varies from 0 to 1; L—number of standard deviations applied to control the mean to be found; and i—sample order utilized. The sample weight constant is 0.25, and the limit width factor, is L = 2, as in the Shewhart control chart.
The data normality was checked for statistical tests using Anderson–Darling and Kruskal–Wallis tests. Graphs were made using MINITAB software, version 16.

3. Results and Discussion

Figure 2 illustrates the graphs depicting the electrical power delivered to the motor pump in relation to the instantaneous irradiance for both pump models, functioning autonomously and detached from the irrigation system.
It should be noted that both pumps stabilized in a certain power range (50 W for the centrifugal pump and 24 W for the diaphragm pump), even with the increase in irradiance. However, the first difference between the two pumps lies in the equivalent circuit formed with the photovoltaic panel. Due to differences in equivalent resistance, the current and voltage supplied to the motor pumps are different—to the point where the centrifugal pump reaches a maximum of 52.6 W, and the diaphragm pump reaches 25.2 W.
Vick et al. (2011) investigated similar curve patterns when investigating four diaphragm motor pumps in photovoltaic solar pumping [33]. The choice of a motor pump for an application attached directly to the photovoltaic panel is not based on a comparison of the electrical power provided to the pump, as the pumps differ in structure and operating mechanisms, and electrical power does not directly reflect their hydraulic efficiency.
However, in Figure 2, the diaphragm pump approaches its maximum electrical power values at lower radiation rates (around 200 W· m 2 ) compared to the diaphragm pump (at around 580 W· m 2 )).
This characteristic, i.e., reaching maximum electrical power early, favors the diaphragm pump for irrigation with saline water since operating with lower irradiation allows the system to stay on for more hours of the day.
According to Liu et al. (2017), calcium and magnesium deposits primarily occur when the system is inactive [21]. During prolonged drip irrigation, which alternates between wet and dry conditions, a layer of chemical deposits builds up on the inner surface of the flow channel over time. This accumulation increases the adhesive strength against the wall, gradually reducing the capacity of the flow channel emitter.
Since all treatments showed similar power supply curves in relation to irradiance, Figure 3 shows the maximum electrical power values achieved for each treatment.
According to the graph, the power of the pump operating at the zero head is 54 W for the centrifugal pump and 48 W for the diaphragm pump, according to the manufacturer’s information.
With photovoltaic pumping, the centrifugal pump obtained power with a variation of less than 10%, relative to the manufacturer’s specifications, even with the increase in pressure drop; the diaphragm pump reduced between 34 and 64%, also relative to the manufacturer’s characteristics.
Still, in Figure 3, the inverter increased electrical power by around 10% when using the centrifugal pump, and with the diaphragm pump, it decreased between 40 and 56%. Lastly, it is important to highlight that only the diaphragm pump showed a variation in electrical energy when attached to the lateral irrigation pipes, increasing from 24% to 37%.
When studying a centrifugal pump, Mokeddem et al. (2011) found similar results when investigating a photovoltaic system for pumping water at a set height of 11 m [34]. With a 750 W pump, the electrical power supplied reached around 850 W, i.e., 13% more than the nominal electrical power.
Regarding diaphragm pumps, Vick et al. (2011) observed a drop of approximately 54% when using a 150 W pump at a height of 20 m, with the power supplied stabilizing at approximately 70 W [33].
The sensitivity of the diaphragm pump’s electrical power—as a function of the addition of the converter or loss of load, here, specifically in the irrigation system—occurs because, in the case of the converter, resistance is added in series within the circuit, thus reducing its voltage [35].
As for the loss of load, the electrical power rises; by restricting the flow, the motor shaft uses more force to transport the same amount of fluid, and this leads to an increase in the motor’s electrical current [36].
Therefore, it is worth emphasizing the importance of preventive maintenance in the case of its use in irrigation with saline water. The corrosion of internal parts and clogging of the irrigation system can increase the power of the motor pump, causing it to break down long before the useful life calculated by the manufacturer. According to Vick et al. (2011), one diaphragm pump manufacturer recommended that the pumps be retrofitted with new parts after one or two years [33].
Table 6 shows the behavior of the flow rate and pressure on the pipe wall at the motor pump outlet, according to the manufacturer and when the pump operates autonomously with the photovoltaic system.
The photovoltaic system proposed in this project reduced the flow rate of the centrifugal pump, for example, to zero head. This reduction was 50%. With the diaphragm pump, the flow rate increased by around 20%.
According to Cossich et al. (2024), the pressure on the pipe wall at the pump outlet differs from the (total) manometric height [27]. Figure 4 shows the conformity between the total head and pressure at the manometer for both pumps. At 5% significance, the linear model correctly represented 95% and 90% of the relationship between the total head and pressure at the pump outlet for the diaphragm and centrifugal pumps, respectively.
According to the behaviors of the total and manometric heights, as shown in Figure 5, the average total height of the photovoltaic irrigation system with the diaphragm pump stood out. While the total height did not exceed 5 m in the other treatments, in the treatment with the diaphragm pump attached to the irrigation lines, the height values were 26.3 and 19.7 m when disconnected and connected to the DC converter, respectively.
This is because diaphragm pumps experience slight variations in flow as the load increases, and in the case of irrigation, part of this energy is converted into pressure. Chandel et al. (2015) stated that centrifugal pumps have a diffuse flow, while the diaphragm pump propels water radially, converting it into helpful pressure, making the flow rate directly proportional to the pump speed [13].
This high overall height of the diaphragm pump is highly beneficial for drip irrigation with saline water because, combined with the high operating time mentioned above and the possibility of pulsed operation, the irrigation equipment is less likely to clog since the amplitude of the fluctuating pressure is greater. According to Li et al. (2019), drip irrigation with a longer floating pressure period was better at reducing clogging caused by chemical precipitates [20].
The characteristics of each pump under study are reflected in the system’s median total flow, as shown in Figure 6. Due to the diffuse flow, when the centrifugal pump was added to the irrigation system, the flow rate fell by approximately 57%, while with the centrifugal pump and its proportional speed, the drop was 30%. However, it is worth noting that the head increased by approximately 90%.
Comparing flow rates to decide which pump to use for applying low-quality water, such as saline water, is not advisable, as each pump has different advantages. One advantage of choosing a centrifugal pump is that its flow rate is low, allowing for a higher flow rate emitter, which reduces the risk of physical clogging since the diameter of the emitter orifice is larger [38].
The advantage of opting for a diaphragm pump, on the other hand, is that because it has higher flow rates, there is the opportunity to operate the system in pulsed mode with shorter pulse times.
When comparing the flow rates and pressures in the graphs in Figure 5 and Figure 6, the diaphragm pump’s total head and flow rate decrease with the converter’s use.
Evaluating the hydraulic power, as shown in Figure 7, when detached from the irrigation system, both pumps under study achieve similar power outputs of between 1.6 and 3.2 W. However, when the lateral irrigation lines are attached to the pumping system, how each pump exerts pressure on the system explains why the hydraulic power decreases with the centrifugal pump to 1.4 W and increases with the membrane pump to between 9.1 and 15.5 W.
Regarding the efficiency values shown in Figure 8, hydraulic efficiency is higher when the diaphragm pump is used and even higher when coupled to the irrigation system. The maximum values found were 12.7%, 10.6%, 5.3%, and 4.3%, 17.7%, 18.3%, 55.2%, and 50.6% for treatments T01, T02, T03, T04, T05, T06, T07, and T08, respectively.
Mokeddem (2011) found similar hydraulic efficiency results with a centrifugal pump at an 11 m head, achieving hydraulic efficiency in the range of 12% [34]. Vick et al. (2011) investigated the behaviors of two diaphragm pumps and observed efficiencies ranging from 25% to 48% at 20 and 70 m heights [33].
Evaluating hydraulic pump technologies by comparing their hydraulic efficiencies is incorrect. The centrifugal pump usually has different electrical characteristics and is disadvantaged because it has higher electric current values. In this sense, the total efficiency values are used to obtain a better picture.
Figure 9 shows the total efficiency values for both pumps in this study. Notably, the median of the treatments detached from irrigation was close to 1%, and the median total efficiency of the diaphragm pump attached to irrigation was higher than the other treatments. However, the difference was minor compared to hydraulic power.
Since the total efficiency of the centrifugal pump attached to irrigation reached 0.4% and the diaphragm pump reached medians in the 1 to 2% range, diaphragm pumps are generally more advisable for irrigation applications. Since they are more efficient and have more robust designs, they will require fewer solar panels or smaller pumps, which usually cost less.
Hamidat and Benyoucef (2008) found similar results in hydraulic efficiency for the hydraulic and total efficiencies involving centrifugal and diaphragm pump models [39]. Vick et al. (2011) also had similar results, with a peak total system efficiency measured for diaphragm pumps of 5% [33].
Different results were found involving the centrifugal pump. Kolhe (2004) obtained total efficiencies of around 3% [26]. Benghanem et al. (2012) achieved total efficiencies of around 8% [40]. According to Cossich et al. (2024), this difference is linked to the author’s use of photovoltaic panel associations, which allow the motor to operate close to its maximum power point, thus increasing the system’s total efficiency [27].
Figure 10 plots the electric current of the motor pump against the voltage for the treatments attached to the irrigation lines. The converter reduced the centrifugal pump voltage from 13.7 V to 12.1 V and increased the current from 4 A to 4.8 A. Moreover, with the diaphragm pump, the converter reduced the voltage from 17.4 V to 12.1 V and increased the current from 1.8 A to 2 A.
According to the manufacturer, this change caused by the converter reveals the need for its use since pumps are not recommended to operate above 12 V. Hilali et al. (2022) stated that using a controller in the direct connection of a pump with a solar panel provides good efficiency, stability, and robustness [41].
Figure 11 presents the graphs related to the overlap of the pump’s current versus voltage curve with the photovoltaic panel curves for the system using the DC converter.
This graph clearly shows whether the photovoltaic arrangement is the most suitable for the proposed irrigation pumping system. In both cases, it would be possible to associate lower-power 150 W panels parallel to achieve currents closer to 7.5 A and 4A for the centrifugal and diaphragm pumps, respectively.
Regarding irrigation quality, attention should be paid to application uniformity when the hydraulic power of drip irrigation with photovoltaic pumping is low. As can be seen in Figure 12, hydraulic power when irradiance is less than 300 W· m 2 is unstable and increasing. According to Cossich et al. (2024), if application uniformity is satisfactory at this stage of hydraulic power instability, irrigation quality is guaranteed for all periods of system operation [27].
Figure 13 presents the Shewhart control chart and exponential-weighted moving average chart for irradiance from 0 to 300 W· m 2 for the irrigation system pumped without a DC converter for both pumps under study.
Figure 13a shows that the system’s behavior across the 25 tests remained above the Shewhart lower control limit for both pump technologies. Furthermore, the tests were in statistical control, as shown in Figure 13b, as not a single test fell outside the lower control limit of the exponential-weighted moving average graph.
Thus, despite average uniformity values of 96.2% and 97.3% for the centrifugal and diaphragm pumps, respectively, if only the lower control limit is considered, under these irradiance conditions, there would be uniformities of over 90.7%, classified as excellent according to the irrigation quality classification proposed by Keller and Bliesner (1990) [31].
However, comparing the uniformity of both pumps would help choose the best pump for drip irrigation with saline water. The diaphragm pump would be adopted, as its lower control limit values were higher in both the Shewhart control chart and the EWMA chart, equal to 94.5% and 96.4%, respectively.
Santra (2021) investigated the performance of 1 HP solar photovoltaic pumps and found good irrigation uniformity [42]. This system can operate mini-sprinklers, micro-sprinklers, and drippers to irrigate shallow water. The authors also highlighted that low-power solar pumping systems can help small farmers cope with water scarcity and climate change. They also stated that many regions with high brackish water levels face this scarcity.
Other authors have used process control statistics to monitor drip irrigation systems. Kepp et al. (2023) and Lopes et al. (2021) reinforced the potential of both the Shewhart control chart and the EWMA chart in contributing to the monitoring of irrigation processes [43,44].
Berwanger et al. (2023) used statistical process control to evaluate the distribution uniformity of drip irrigation systems using direct photovoltaic pumping [45]. The values found by the author are similar to those found in this research, with CUD reaching 93% of the lower control limit.
Figure 14 presents the Shewhart control chart and the exponential-weighted moving average chart for irradiance levels between 0 and 300 W· m 2 , for the irrigation system using the diaphragm pump with a DC converter and the centrifugal pump without a DC converter, both with saline water and pulsed application.
In Figure 14a, we can again see that the system’s behavior with the diaphragm pump and the centrifuge was above the lower Shewhart control limit. In addition, Figure 14b shows that none of the tests were below the lower control limit of the exponential-weighted moving average graph, indicating that the tests were under statistical control.
Thus, the centrifugal pump had an average uniformity of 85%, and the diaphragm pump was 94.3%. Considering only the lower control limits, according to Keller and Bliesner (1990), irrigation quality would be “acceptable” when using the centrifugal pump and “good” with the diaphragm pump [31].
Comparing the graphs in Figure 13 and Figure 14, the application uniformity with the centrifugal pump decreased by approximately 11%, while with the diaphragm pump, the decrease was only 3%. This difference shows that the centrifugal pump is unsuitable for pulsed saline water application.
One explanation for the difference in the decrease in uniformity between pumps lies in the fluid retention capacity in the discharge pipe—an ability maintained by the diaphragm pump but not the centrifugal pump. According to Lozano (2020), the longer the filling time of the irrigation hoses during pulsed application, the lower the application uniformity [46].
Pulsed application in drip irrigation not only improves water use efficiency [47,48] but is also able to prevent clogging in drip irrigation. This is because using emitters with larger orifices in pulsed operation—instead of emitters with smaller orifices in continuous application—to maintain the same application rate provides a greater opening for particles to pass through without accumulating or causing clogging in the emitters [49].
Evaluating Figure 14, it is impossible to identify a variation in irrigation behavior caused by water salinity. The hypothesis that there was no clogging of the emitters by chemical precipitation may have been caused by the pressure fluctuation. However, the application time of the experiment may have been insufficient to create enough obstruction to reduce the quality of the application uniformity.
However, even with a short application time, precipitates could be observed accumulating within the irrigation system. Figure 15 shows the filter’s state and the lateral line’s last emitters after the tests.
Several factors can cause partial or total clogging of emitter nozzles and pipes, affecting their distribution along lateral lines. These factors include chemical precipitation by ions such as calcium and magnesium carbonates, which is common in arid regions [50].
Chemical precipitates form when the water’s pH, temperature, and dissolved solids change, mainly due to evaporation, which causes the concentration of salts to rise above the solubility limit. Obstructions form gradually and are difficult to detect [51,52].
The work by Hills et al. (1989) [53] stands out among studies aimed at observing and preventing carbonate precipitation. They analyzed the impact of chemical precipitates on emitter clogging and irrigation uniformity for 100 days [53]. They observed clogging in all water management scenarios featuring high concentrations of salts and high pH levels.
Within this scenario, the recommendation for future studies involving direct and intermittent photovoltaic pumping with saline water is to evaluate the irrigation system over a more extended period of use and with water containing different salt concentrations. It is worth noting that the concentration of chemical elements (Table 5) that increase the risk of emitter clogging in the water used in this experiment was above the limit for severe risk. However, according to Gilbert and Ford (1986), a pH of 4.97 indicates a low risk of clogging [25].

4. Conclusions

The diaphragm pump reaches its maximum efficiency under low irradiance levels, making it ideal for saline water irrigation applications since the system is on for longer hours.
Continuous monitoring is required if the diaphragm pump is irrigated with saline water. It shows fluctuations in electrical power when the system is disturbed by adding new equipment or from load loss.
The diaphragm pump’s total height and high flow rate are highly beneficial for drip irrigation with saline water. They allow for pulsed operation, meaning the risk of clogging in the irrigation equipment is reduced.
Diaphragm pumps are more sustainable for use in irrigation, as they have higher total efficiency and, in more robust projects, require fewer solar panels and lower-power pumps, reducing the final cost.
The diaphragm pump has better distribution uniformity than the centrifugal pump, making it more reliable for low-quality irrigation.
For drip irrigation with saline water, pulsed application combined with direct photovoltaic pumping using the diaphragm pump is more advisable.
It can be seen that the diaphragm pump stands out in several respects compared to the centrifugal pump. However, more studies should be carried out to ensure its sustainability. These should include investigating the use of pumps with greater power, different water quality conditions, and mapping their useful life, among other factors. These new studies could encourage the market to invest more in diaphragm pumps for irrigation. This is important, as the availability of this equipment is still limited and, consequently, it is still expensive.

Author Contributions

Conceptualization, V.C.; methodology, M.A.V.B.; validation, A.R.L., A.A.A.P. and D.M.J.; investigation, V.C. and N.C.K.; resources, R.G. and M.A.V.B.; data curation, A.R.L. and A.B.; writing—original draft preparation, N.C.K. and D.M.J.; writing—review and editing, V.C. and A.B.; Supervision, M.A.V.B., A.A.A.P. and A.B. All authors have read and agreed to the published version of the manuscript.

Funding

This work was carried out with the support of the Coordination for the Improvement of Higher Education Personnel—Brazil (CAPES)—Financing Code 001.

Data Availability Statement

The data presented in this study are available on request from the corresponding author.

Conflicts of Interest

Author Renato Guardini was employed by the Agricultural Research and Rural Extension Company of Santa Catarina (EPAGRI). The remaining authors declare that the research was conducted in the absence of any commercial or financial relationships that could be construed as a potential conflict of interest.

References

  1. Oster, J.D.; Wichelns, D. Sustainable irrigation is necessary and achievable, but direct costs and environmental impacts can be substantial. Irrig. Sci. 2003, 22, 107–120. [Google Scholar]
  2. Rhoades, J.D. Drainage for salinity control. In Drainage for Agriculture; van Schilfgarde, J., Ed.; ASA Monograph. No. 17; Amer Soc Agronomy: Madison, WI, USA, 1974; pp. 433–467. [Google Scholar] [CrossRef]
  3. Burt, C.M.; Isbell, B. Leaching of accumulated soil salinity under drip irrigation. Trans. ASAE 2005, 48, 2115–2121. [Google Scholar] [CrossRef]
  4. Tanji, K.K. Nature and extent of agricultural salinity and sodicity. In Agricultural Salinity Assessment and Management; Tanji, K.K., Ed.; ASCE Manuals and Reports on Engineering Practice No. 71; American Society of Civil Engineers: New York, NY, USA, 1990; pp. 1–17. [Google Scholar]
  5. Kang, Y.; Chen, M.; Wan, S. Effects of drip irrigation with saline water on waxy maize (Zea mays L. var. ceratina Kulesh) in North China Plain. Agric. Water Manag. 2010, 97, 1303–1309. [Google Scholar] [CrossRef]
  6. Nightingale, H.I.; Hoffman, G.J.; Rolston, D.E.; Biggar, J.W. Trickle irrigation rates and soil salinity distribution in an almond (Prunus amygdalus) orchard. Agric. Water Manag. 1991, 19, 271–283. [Google Scholar] [CrossRef]
  7. Khan, A.A.; Yitayew, M.; Warrick, A.W. Field evaluation of water and solute distribution from a point source. J. Irrig. Drain. Eng. 1996, 122, 221–227. [Google Scholar] [CrossRef]
  8. Laasri, S.; El Hafidi, E.M.; Mortadi, A.; Chahid, E.G. Solar-powered single-stage distillation and complex conductivity analysis for sustainable domestic wastewater treatment. Environ. Sci. Pollut. Res. 2024, 31, 29321–29333. [Google Scholar]
  9. Mortadi, A.; Laasri, S. Study on a new solar-powered desalination system to alleviate water scarcity using impedance spectroscopy. Mater. Today Proc. 2024; in press. [Google Scholar]
  10. Meerbach, D.; Dirksen, C.; Cohen, S.; Yermiyahu, U.; Wallach, R. Influence of drip irrigation layout on salt distribution and sap flow in effluent irrigated cotton. In Proceedings of the Third International Symposium on Irrigation of Horticultural Crops, Lisbon, Portugal, 28 June–2 July 1999. [Google Scholar]
  11. Souza, C.F.; Folegatti, M.V.; Or, D. Distribution and storage characterization of soil solution for drip irrigation. Irrig. Sci. 2009, 27, 277–288. [Google Scholar] [CrossRef]
  12. Guan, H.-J.; Li, J.-S.; Li, Y.-F. Effects of drip system uniformity and irrigation amount on water and salt distributions in soil under arid conditions. J. Integr. Agric. 2013, 12, 924–939. [Google Scholar] [CrossRef]
  13. Chandel, S.S.; Naik, M.N.; Chandel, R. Review of solar photovoltaic water pumping system technology for irrigation and community drinking water supplies. Renew. Sustain. Energy Rev. 2015, 49, 1084–1099. [Google Scholar] [CrossRef]
  14. Moechtar, M.; Juwono, M.; Kantosa, E. Performance evaluation of a.c. and d.c. direct coupled photovoltaic water pumping system. Energy Convers. Manag. 1991, 31, 521–527. [Google Scholar] [CrossRef]
  15. Kumar, M.; Reddy, K.S.; Adake, R.V.; Rao, C.V.K.N. Solar powered micro-irrigation system for small holders of dryland agriculture in India. Agric. Water Manag. 2015, 158, 112–119. [Google Scholar] [CrossRef]
  16. Pande, P.C.; Singh, A.K.; Ansari, S.; Vyas, S.K.; Dave, B.K. Design development and testing of a solar PV pump-based drip system for orchards. Renew. Energy 2003, 28, 385–396. [Google Scholar]
  17. Reca, J.; Torrente, C.; López-Luque, R.; Martínez, J. Feasibility analysis of a standalone direct pumping photovoltaic system for irrigation in Mediterranean greenhouses. Renew. Energy 2016, 85, 1143–1154. [Google Scholar] [CrossRef]
  18. Zavala, V.; López-Luque, R.; Reca, J.; Martínez, J.; Lao, M.T. Optimal management of a multisector standalone direct pumping photovoltaic irrigation system. Appl. Energy 2020, 260, 114261. [Google Scholar] [CrossRef]
  19. Cervera-Gascó, J.; Montero, J.; del Castillo, A.; Tarjuelo, J.M.; Moreno, M.A. EVASOR, an integrated model to manage complex irrigation systems energized by photovoltaic generators. Agronomy 2020, 10, 331. [Google Scholar] [CrossRef]
  20. Li, Q.; Song, P.; Zhou, B.; Yang, X.; Mihammad, T.; Liu, Z.; Zhou, H.; Li, Y. Mechanism of intermittent fluctuated water pressure on emitter clogging substances formation in drip irrigation system utilizing high sediment water. Agric. Water Manag. 2019, 215, 16–24. [Google Scholar] [CrossRef]
  21. Liu, L.; Niu, W.Q.; Wu, Z.G. Risk and inducing mechanism of acceleration emitter clogging with fertigation through drip irrigation systems. Trans. Chin. Soc. Agric. Mach. 2017, 48, 228–236. [Google Scholar] [CrossRef]
  22. Protoger, C.; Pearce, S. Laboratory evaluation and system sizing charts for a second generation direct PV-powered, low-cost submersible solar pump. Solar Energy 2000, 68, 453–474. [Google Scholar]
  23. Resun Solar Energy. RS6E-150P. 2024. Available online: https://www.resunsolar.com/ (accessed on 5 June 2024).
  24. American Public Health Association—APHA. Standard Methods for the Examination of Water and Wastewater; APHA: Washington, DC, USA, 2012; 1496p. [Google Scholar]
  25. Gilbert, R.G.; Ford, H.W. Operational principles/emitter clogging. In Trickle Irrigation for Crop Production; Nakayama, F.S., Bulks, D.A., Eds.; Elsevier: Amsterdam, The Netherlands, 1986; pp. 142–163. [Google Scholar] [CrossRef]
  26. Kolhe, M.; Joshi, J.C.; Kothari, D.P. Análise de desempenho de um sistema fotovoltaico de bombeamento de água diretamente acoplado. Transações IEEE Sobre Conversão Energ. 2004, 24, 613–618. [Google Scholar] [CrossRef]
  27. Cossich, V.; Boas, M.A.V.; Kepp, N.C.; Lopes, A.R.; Junior, D.M. Methodology for validating autonomous and direct photovoltaic pumping in drip irrigation. Irrig. Sci. 2024, 1319–1432. [Google Scholar] [CrossRef]
  28. Keller, J.; Karmeli, D. Trickle irrigation design parameters. Rain Bird Sprink. Manuf. Corp. 1974, 17, 0678–0684. [Google Scholar]
  29. ABNT NBR ISO 9261; Equipamentos de Irrigação Agrícola-Emissores e Tubos Emissores-Especificações e Métodos de Ensaio. ISO: São Paulo, Brazil, 2006.
  30. Merrian, J.L.; Keller, J. Farm Irrigation System Evaluation: A Guide for Management; Civil and Environmental Engineering Faculty Publications; Utah State University: Logan, UT, USA, 1978. [Google Scholar]
  31. Keller, J.; Bliesner, I.D. Sprinkler and Trickle Irrigation; Van Nostrand Reinhold: NY, USA, 1990. [Google Scholar]
  32. Montgomery, D.C. Introdução ao Controle Estatístico de Qualidade, 7th ed.; LTC Group: Rio de Janeiro, Brazil, 2016. [Google Scholar]
  33. Vick, B.D.; Clark, R.N. Experimental investigation of solar powered diaphragm and helical pumps. Solar Energy 2011, 85, 945–954. [Google Scholar] [CrossRef]
  34. Mokeddem, A.; Midoun, A.; Kadri, D.; Hiadsi, S.; Raja, I.A. Performance of a directly coupled PV water pumping system. Energy Convers. Manag. 2011, 52, 3089–3095. [Google Scholar] [CrossRef]
  35. Neto, J.C.; Azevedo, T.; Salazar, A. Rastreamento de Máxima Potência em Sistemas Fotovoltaicos Baseado na Técnica One Cycle Control. 2014. Available online: https://www.researchgate.net/publication/264187930_Rastreamento_de_Maxima_Potencia_em_Sistemas_Fotovoltaicos_Baseado_na_Tecnica_One_Cycle_Control (accessed on 5 September 2024).
  36. Rondón, P.P.; Kriuskova, E.R.; Sobrevilla, L.P.; Hernández, R.D.; Calderín, R.C. Evaluación de dos bombas hidráulicas de engranajes de desplazamientos 32 y 50 cm3/rev. Rev. Cienc. Técnicas Agropecu. 2013, 22, 58–62. [Google Scholar]
  37. Seaflo. 2024. Available online: https://seaflo.com.br/ (accessed on 5 September 2024).
  38. Cossich, V.; Boas, M.A.V.; Kepp, N.C.; Lopes, A.R.; Machado, D. Statistical process control in pulsed drip irrigation systems. Rev. Ambiente Água 2024, 19, e2933. [Google Scholar] [CrossRef]
  39. Hamidat, A.; Benyoucef, B. Mathematic models of photovoltaic motor-pump systems. Renew. Energy 2008, 33, 933–942. [Google Scholar] [CrossRef]
  40. Benghanem, M.; Daffallah, K.O.; Joraid, A.A.; Alamri, S.N.; Jaber, A. Performances of solar water pumping system using helical pump for a deep well: A case study for Madinah, Saudi Arabia. Energy Convers. Manag. 2013, 65, 50–56. [Google Scholar] [CrossRef]
  41. Hilali, A.; Mardoude, Y.; Essahlaoui, A.; Rahali, A.; El Ouanjli, N. Migration to solar water pump system: Environmental and economic benefits and their optimization using genetic algorithm Based MPPT. Energy Rep. 2022, 8, 10144–10153. [Google Scholar] [CrossRef]
  42. Santra, P. Performance evaluation of solar PV pumping system for providing irrigation through micro-irrigation techniques using surface water resources in hot arid region of India. Agric. Water Manag. 2021, 245, 106554. [Google Scholar] [CrossRef]
  43. Kepp, N.C.; Boas, M.A.V.; Haupentha, S.W.; Lopes, A.R.; Cossich, V. Monitoring urea concentration at different slope angles in drip fertigation. Rev. Ambiente Água 2023, 18, e2928. [Google Scholar] [CrossRef]
  44. Lopes, A.R.; Boas, M.A.V.; Pazuch, F.A.; Dalla Corte, L.; Gomes, B.M.; Prates, R.T.C. Uniformity of drip irrigation system with liquid peat on different slopes. Irriga 2021, 1, 357–366. [Google Scholar] [CrossRef]
  45. Berwanger, D.; Haupenthal, S.W.; Siqueira, J.A.C.; Boas, M.A.V. Uniformity of drip irrigation with autonomous photovoltaic energy using solar tracker. Res. Soc. Dev. 2023, 12, e36121444496. [Google Scholar] [CrossRef]
  46. Lozano, D.; Ruiz, N.; Baeza, R.; Contreras, J.I.; Gavilán, P. Effect of pulse drip irrigation duration on water distribution uniformity. Water 2020, 12, 2276. [Google Scholar] [CrossRef]
  47. Abdelraouf, R.E. Saving 50% irrigation water, energy, reducing of soil salts accumulation and weeds growth by a new and simple method for cultivation in small pieces of pvc pipes. Plant Arch. 2019, 19 (Suppl. S2), 1912–1921. [Google Scholar]
  48. Arriero, S.S.; Almeida, W.F.; Paz, V.P.S.; Damasceno, L.F. Yield of eggplant using low quality water and pulse drip irrigation. Rev. Bras. Eng. Agríc. Ambient. 2020, 24, 822–826. [Google Scholar] [CrossRef]
  49. Al-Amoud, A.I.; Saeed, M. The effect of pulsed drip irrigation on water management. In Proceedings of the 4th International Micro-Irrigation Congress, Albury-Wodonga, Australia, 23–28 October 1988; Proceedings ICID. pp. 120–144. [Google Scholar]
  50. de Mélo, R.F.; Coelho, R.D.; Teixeira, M.B. Entupimento de gotejadores convencionais por precipitados químicos de carbonato de cálcio e magnésio, com quatro índices de saturação de Langelier. Irriga 2008, 13, 525–539. [Google Scholar] [CrossRef]
  51. Plugging, C.O.E. Causes and Prevention of Emitter Plugging in Microirrigation System; University of Florida: Gainesville, FL, USA, 1990. [Google Scholar]
  52. Pizarro Cabello, F. Riegos Localizados de Alta Frecuencia RLAF: Goteo, Microaspersión, Exudación; FAO: Roma, Italy, 1996. [Google Scholar]
  53. Hills, D.J.; Nawar, F.M.; Waller, P.M. Effects of chemical clogging on drip-tape irrigation uniformity. Trans. ASAE 1989, 32, 1202–1206. [Google Scholar] [CrossRef]
Figure 1. Representation of the irrigation system laboratory bench.
Sustainability 17 03981 g001
Figure 2. Electrical power supplied by a pump without a DC converter, detached from irrigation.
Sustainability 17 03981 g002
Figure 3. Maximum values of electrical power supplied.
Sustainability 17 03981 g003
Figure 4. The total head of the pumping system with a DC converter attached to irrigation.
Sustainability 17 03981 g004
Figure 5. Average total height.
Sustainability 17 03981 g005
Figure 6. Median total flows.
Sustainability 17 03981 g006
Figure 7. Hydraulic power.
Sustainability 17 03981 g007
Figure 8. Hydraulic Efficiency
Sustainability 17 03981 g008
Figure 9. Total efficiency.
Sustainability 17 03981 g009
Figure 10. Pump working voltage and current characteristics.
Sustainability 17 03981 g010
Figure 11. Superposition values of the current versus voltage curve of the pump with those of the photovoltaic panel.
Sustainability 17 03981 g011
Figure 12. Hydraulic power and irradiance for the treatments attached to the lateral irrigation lines.
Sustainability 17 03981 g012
Figure 13. (a) Shewhart control chart and (b) exponential-weighted moving average (EWMA) chart of the DUC for irrigation with potable water and continuous application.
Sustainability 17 03981 g013
Figure 14. (a) Shewhart control chart and (b) exponential-weighted moving average (EWMA) chart of the DUC for irrigation with saline water and pulsed application.
Sustainability 17 03981 g014
Figure 15. The state of the filter and the lateral line’s last emitters after the tests ended.
Sustainability 17 03981 g015
Table 1. Measuring instruments and their accuracy.
ParameterInstrumentMeasuring Range (Accuracy)
FlowHCS008 (RainPint—Santa Catarina, Brasil) 20–2400 L· h 1 (5%)
PressureDN63 (Genebre—São Paulo, Brasil)0–2.5 bar (2.5%)
IrradianceSM206 (IMPAC—São Paulo, Brasil)1–3999 W· m 2 (5%)
VoltageM430 (Raidanfade—São Paulo, Brasil)0–100 V (1%)
CurrentM430 (Raidanfade—São Paulo, Brasil)0–10 A (1%)
Table 2. Characteristics of the RS6E 150P photovoltaic module.
Rated Power in Watts—Pmax (Wp)150 W
Open circuit voltage—Voc (V)22.3 V
Short Circuit Current—Isc (A)8.82 A
Maximum Power Voltage—Vmp (V)17.91 V
Maximum power Current—Imp (A)8.38 A
Module Efficiency (%)15.29%
STC: irradiance: 1000 W/m2, cell temperature 25 °C, air mass AM1.5 according to EN 60904-3 [23].
Table 3. Physicochemical parameters of the saline water used in the pulsed drip experiment [25].
Clogging FactorSevere RiskSampleWater QualitySevere Use RestrictionSample
Suspended solids>100 mg· L 1 112 mg· L 1 Conductivity (EC)>3.0 dS· m 1 9.84 dS· m 1
Dissolved solids>2000 mg· L 1 5082 mg· L 1 Nitrogen ( N O 3 N )>3 mg· L 1 1280.1 mg· L 1
Total iron>1.5 mg· L 1 261.6 mg· L 1 RAS>915.4
Manganese>1 mg· L 1 366.8 mg· L 1 Sodium-231 mg· L 1
pH>8.04.97Calcium-264 mg· L 1
Magnesium-186.8 mg· L 1
Table 4. Performance factors, equations, and variables [26].
FactorsEquationVariables
Solar power P o t S o l = A × I r r P o t S o l —solar power (W)
Area of the photovoltaic panel (m2)
Irr—Irradiance (W· m 2 )
Electrical power P o t e = U × I P o t e —electric power (W)
I—electric current (A)
U—voltage (V)
Hydraulic power P o t h = ρ × g × Q × H P o t h —hydraulic power (W)
ρ—specific mass of water (kg m 3 )
g—gravitational strength (m· s 2 )
Q—flow rate ( m · s 1 )
H—height (m.c.a.)
Motor pump efficiency n m o t o r   p u m p = P o t h P o t e × 100 n m o t o r   p u m p —motor pump efficiency (%)
Total efficiency n T o t a l = P o t h P o t S o l × 100 n T o t a l —total efficiency (%)
Table 5. Criteria for evaluating the distribution uniformity coefficient.
RatingDUC (%)
Excellent>90
Good85–90
Acceptable65–85
Poor<65
Source: [31].
Table 6. Performance characteristics of the centrifuge and diaphragm pumps [37].
CentrifugeDiaphragm
Height (M)ManufacturerPhotovoltaic PumpingManufacturerPhotovoltaic Pumping
Flow   ( L · m i n 1 ) Flow   ( L · m i n 1 ) Pressure * (m) Flow   ( L · m i n 1 ) Flow   ( L · m i n 1 ) Pressure * (m)
031.015.50.04.14.90
125.114.00.03.94.80
223.912.10.03.754.70
320.09.90.73.634.71.07
416.08.03.33.514.61.78
510.67.05.73.424.52.14
62.02.86.3.354.52.80
70.00.78.33.34.43.46
* Pressure at the pump outlet.
Disclaimer/Publisher’s Note: The statements, opinions and data contained in all publications are solely those of the individual author(s) and contributor(s) and not of MDPI and/or the editor(s). MDPI and/or the editor(s) disclaim responsibility for any injury to people or property resulting from any ideas, methods, instructions or products referred to in the content.

