Abstract
Promoting the comprehensive green transformation (CGT) of China’s economy and society is vital for achieving high-quality economic growth and building a beautiful China. This study establishes a CGT evaluation index system across four dimensions: comprehensiveness, synergy, innovation, and security. Using the entropy weighting method, it evaluates the CGT development level across 30 Chinese provinces from 2011 to 2022. Subsequently, it examines regional differences and convergence features in CGT development through the application of the Theil index, kernel density estimation (replaced by KDE below), and convergence analysis methods. The findings indicate the following: Firstly, the CGT development level nationwide and within the four key regions has been on the rise annually; yet, regional variations persist. Secondly, both the overall disparities in CGT development across China’s economy and society and the discrepancies within the four key regions are diminishing. Furthermore, interregional variations are the main contributor to the overall disparities in CGT development. Thirdly, while the number of provinces achieving CGT development has gradually increased nationwide, their unevenness has also intensified. Fourthly, regarding convergence characteristics, σ-convergence, along with both absolute and conditional β-convergence are observed in all regions but the central; in the central region, absolute β-convergence is not statistically significant, but conditional β-convergence is. Conclusions from this study can offer theoretical insights for further elevating the CGT level of China’s economy and society and fostering coordinated regional development.
1. Introduction
During the recent period, China’s economy has witnessed remarkable growth, attracting global attention. However, this growth has incurred certain costs. Resource and energy consumption have been intensive, and carbon emissions have increased significantly. The economic growth model that relies on sacrificing resources, energy, and environmental quality not only impairs the quality and efficiency of development but also imposes a substantial environmental burden. In the face of this challenge, a comprehensive green transformation (replaced by CGT below) of China’s economy and society has emerged as a vital route to sustainable development. In July 2024, the Third Plenary Session of the 20th Party Congress put forward a plan to expedite the CGT of economic and social development, presenting a series of measures. These involve optimizing the spatial arrangement of the national territory, facilitating the green and low-carbon transformation and upgrading of industries, promoting the transition of the energy structure, and enhancing transportation patterns, all with the aim of comprehensively propelling the green transformation. China’s economic and social development is at a critical stage of transforming from old growth drivers to new ones. Hastening China’s CGT of economic and social development is crucial for promoting economic restructuring and attaining high-quality development. In summary, China’s CGT of economic and social development has become increasingly important, providing a firm basis for propelling the course of high-quality development. In this context, exploring the development path, regional disparities, and convergence patterns of China’s CGT of economic and social development has profound implications for achieving Chinese-style modernization.
In the context of CGT in China, this research focuses on solving the dilemma of resource constraints and increasing environmental pressure and systematically analyzes the progression rationale and spatial characteristics of China’s CGT of economic and social development. Inspired by the CGT strategy proposed in the Third Plenary Session of the 20th Party Congress, this paper constructs an innovative and comprehensive index system with four key dimensions: comprehensiveness, synergy, innovation, and security. Using panel data models and spatial analysis methods, the study empirically explores the convergence features and driving factors of regional CGT. This study not only provides a quantitative basis for cracking the “high pollution—high energy consumption” locking effect but also enriches academic discussions on creating a Chinese modernization path featuring harmony between humanity and nature. Through a combination of theoretical interpretation and empirical analysis, this study not only responds to the doctrinal needs of the new development concept but also provides a systematic solution to the structural contradiction between development and environmental protection.
2. Literature Review
Over the last few yars, the green transformation has been recognized as a vital impetus for fostering high-quality economic and social development and promoting ecological civilization. This view has spurred extensive debates among many scholars [1,2,3,4]. Ever since the “dual-carbon” strategic goal was put forward, the academic community has demonstrated growing concern about green transformation, and the research focus of scholars has gradually converged on four core areas: the conceptual characteristics of green transformation, market mechanisms, measurement methods, and distributive justice. First, the study of the conceptual characteristics of green transformation aims to explain its core meaning, which is the pursuit of environmental harmony, resource conservation, and development sustainability; second, academics are delving into methods to facilitate green transformation by the optimization of market mechanisms, and are committed to the development of effective quantitative tools to assess the transformation process.
Transformation refers to the process by which entities shift from their original forms, movements, and states to adapt to developmental needs, subsequently establishing new development models and operational mechanisms. In the academic realm, the concept of transformation is typically interpreted through several key dimensions, including institutional, economic, social, stage-based, and growth-mode transformations [5]. Although the notion of a “green economy” was introduced by academics as early as the 1990s [6], the connotation of green economic transformation has evolved continuously. Scholars argue that green transformation involves enterprises adhering to green development principles, focusing on efficient resource utilization and environmental protection, and leveraging innovation as a catalyst to ensure the greening of production processes. This approach aims to achieve dual outcomes of economic efficiency and environmental stewardship, ultimately promoting ecological enhancement and sustainable economic development [7,8].
The driving factors within the market mechanism can be classified into internal and external aspects. The internal impetuses for economic green transformation are mainly demonstrated in four domains: energy, transportation, green development in urban and rural construction, and technological innovation support. Regarding energy, research shows that increasing energy efficiency propels corporate green transformation [9,10,11]. Meanwhile, the synergy of reducing carbon and pollution also has a beneficial impact on green transformation [12,13]. In transportation, the development of transportation modes such as bike sharing [14], high-speed rail [15], and subway [16] as well as the construction of international transportation corridors [17] not only enhance inter-city connectivity but also effectively reduce carbon emissions and promote the transformation of cities to a green development mode. Specifically, bike sharing improves the convenience of short-distance travel, helps the formation of regional innovation network, and enhances regional innovation capability; high-speed rail shortens the temporal and spatial distance between cities, promotes the interaction within regional innovation networks, and enhances regional competitiveness; subway strengthens the connection of functional areas, promotes the flow and concentration of innovation factors, and facilitates the smooth operation of regional innovation network; international transportation channels such as China–Europe shuttle trains cut cross-border transportation costs, connect regional and internal innovation resources, and help the international layout of innovation network, and inject impetus for the high-quality development of regional economy. In the field of urban-rural construction, entering a new development stage, China needs to integrate research findings on population mobility, energy, transportation, and infrastructure development to identify pathways for green urbanization transformation, thereby advancing high-quality urban-rural development [18,19,20]. Regarding scientific and technological innovation, the building of digital infrastructure holds immense importance in facilitating the green transformation of enterprises. It achieves this by improving organizational innovation capacity, enhancing the environmental awareness of senior management, and strengthening the dissemination channels of green finance [21,22]. In addition, the advancement of green technology innovation [23], digitalization [24,25,26], artificial intelligence [27], and environmental policies [28] also positively affect the development of green technology, further contributing to green transformation. From the viewpoint of external factors, constructing a sound policy system, advancing green finance, and optimizing investment mechanisms are pivotal in facilitating green economic transformation. Within the realm of policy, a variety of policies, including green credit [29,30], and financial and fiscal policies [31,32], indirectly promote the green transition by influencing intermediary factors such as carbon emissions and capital costs. By boosting innovation investment and enhancing the industrial structure, the evolution of green finance has significantly advanced the green transformation process [33,34,35]. The optimization of investment mechanisms, such as enhancing corporate financing capacity, reducing debt financing costs, and expanding foreign investment, is also an important driver for achieving green transformation [36,37]. These external factors, combined with internal drivers, jointly promote the green economic transformation.
Academic inquiries concerning the measurement of green transformation indicators are centered on two aspects: text analysis method and comprehensive indicator evaluation. First, the text analysis method utilizes software tools such as Python 3.13.1to obtain the frequency of keywords associated with green transformation from corporate annual reports and uses logarithms to depict the intensity of green transformation of enterprises [38,39,40]. Second, the comprehensive indicator evaluation method is more comprehensive and involves the consideration of multiple dimensions. For example, Liu et al. (2025) adopted the entropy weight—TOPSIS method to gauge the level of corporate green transformation across four aspects: green culture, green management, green governance, and green innovation [41]. In addition, Zhai et al. (2022) formulated a CGT evaluation index framework consisting of five dimensions: economy, technology, energy, society, and environment [42]. The establishment of these research methods and indicator systems provides important tools and perspectives for assessing and understanding the process of green transition.
In addition, the green transition involves not only environmental externalities, but also social externalities, which are mainly reflected in distributional equity issues such as resource allocation, employment restructuring, and regional development. Peng et al. (2024) show that the inter-firm reallocation effect allows firms that are more efficient in reducing emissions in the face of demand shocks to gain a larger share of the market, which promotes a decline in the overall pollution intensity of the export sector [43]. In addition, He et al. (2024) demonstrate that low-carbon city policies have a positive impact on the employment of high-skilled workers (e.g., sales, R&D, and managerial positions), while the impact on low-skilled and production workers is relatively small [44]. Yu et al. (2024) further show that firms’ green productivity increases are more pronounced in areas that are not key environmental control zones, in non-provincial capitals, and in areas where there is greater policy coherence. Enhancement is more significant. Meanwhile, regions with more urban dominance show greater transformation effects in green transformation compared to regions with more county autonomy [45]. These findings suggest that regional differences in policy design and implementation have an important impact on the effectiveness of green transitions.
Existing studies provide a theoretical basis for the article to explore the CGT of the economy and society, but at the same time, there are some limitations. Firstly, in relation to the establishment of the evaluation index system, although the Third Plenary Session of the 20th Party Congress has comprehensively defined CGT, only a handful of studies have built an index system grounded in the four dimensions of comprehensiveness, synergy, innovation, and security specified in this definition. This deficiency hampers a profound understanding and analysis of the CGT process. Second, although existing studies have theoretically explored China’s CGT, this limitation makes it difficult to accurately depict the development of China’s CGT because few studies have analyzed it from the perspective of statistical measurement and empirical evidence. On this basis, this research intends to build an indicator system for evaluating the development level of China’s CGT of economic and social development. It endeavors to quantitatively measure the degree of this transformation by employing the entropy weighting method and further explore regional differences, dynamic trends, and convergence characteristics.
3. Methodology
3.1. Construction of the Indicator System
To comprehensively and objectively assess the progress and effectiveness of China’s CGT, and to show the trend of its sustainability and long-term development, the article extensively reviewed relevant literature and comprehensively considered the core elements of green transformation from multiple perspectives. The research centers on panel data spanning from 2011 to 2022, covering 30 provinces. It is grounded in the definition of CGT put forward in the “Strategies for Speeding Up the CGT in Economic and Social Progress” issued by the Third Plenary Session of the 20th Party Congress, comprehensive transformation, synergistic transformation, innovative transformation, and safe transformation are selected as the first-level indicators and the construction of an assessment system for CGT of the economy and society. It is further subdivided into 11 secondary indicators and 23 tertiary indicators, as shown in Table 1.

Table 1.
CGT evaluation indicator system.
The four primary indicators were broken down in conjunction with the specific requirements of the “Strategies for Speeding Up the CGT in Economic and Social Progress”.
First, comprehensive transformation is principally manifested in three aspects: the optimization of the spatial pattern, the industrial restructuring, and the improvements of production mode. In detail, the optimization of the spatial pattern encompasses the proportion of green coverage in built-up zones and transportation accessibility. For industrial restructuring, sub-indicators such as the advancement, rationalization, and elevation of the industrial structure are utilized [46,47,48]; When it comes to the improvement of the production mode, sub-indicators like energy consumption in relation to GDP and sulfur dioxide emissions are employed.
Second, the dimension of synergistic transformation consists of two major aspects: industrial synergy and regional synergy. Industrial synergy is evaluated by means of resource recycling ratios, the industrial structure, and carbon emission intensity. Regional synergy centers around the difference in living standards and the urban-rural consumption disparity.
Third, the secondary indicators of the innovation transformation dimension are innovation drive, innovation output, and innovation environment, innovation drive and innovation output draw on Wang et al. (2023) who selected R&D intensity, the patent status of green technology, number of R&D personnel and technology transaction activity to set the tertiary indicators [49], and the innovation policy environment is measured by selecting the number of innovation policy documents in the Beida Fabulous.
Finally, the secondary indicators of security transition are environmental security, energy security, and food security. Environmental security is quantified by the investment ratio in pollution control and sewage treatment rates. Energy security is appraised according to the energy structure and the energy consumption elasticity coefficient. Food security is measured by the food output per unit area and the extent of reliance on food foreign trade. The above indicator system covers all aspects of comprehensive transformation, synergistic transformation, innovative transformation, and security transformation. It offers a more all-round portrayal of China’s CGT of economic and social development.
3.2. Description of the Research Methodology and Data
This study aims to construct a comprehensive indicator system to test the regional convergence characteristics and key drivers of the CGT, in order to answer the following key questions: How can an integrated indicator system be devised to precisely mirror the advancement of China’s CGT? Is there a significant spatial convergence feature of CGT among regions? What are the key factors driving regional green transformation? In order to address these questions, this paper adopts the following methodology.
3.2.1. Research Methodology
- (1)
- Entropy Weight Method
Drawing on existing studies [50,51,52], the article comprehensively evaluates China’s CGT of economic and social development. The reasons for choosing this method are: firstly, to avoid the possible interference of the subjective assignment method on the allocation of indicator weights; secondly, it lessens the disparity between the actual situation of China’s CGT and the ideal state, so as to make the measurement results closer to the actual situation. Third, compared with other weighting methods (e.g., principal component analysis), the entropy weighting method can better consider the correlation and interaction between indicators when dealing with multi-attribute decision-making problems, while principal component analysis, although it can reduce the number of dimensions of the evaluation indicators, suffers from the influence of subjective factors, the higher requirement of data variability, and ignoring the correlation of indicators. Therefore, considering the advantages and disadvantages of various methods, the entropy weight method is more fitting for the comprehensive evaluation of this study. The specific calculation process and related steps are as follows:
Step 1: Data normalization.
For positive indicators, use the following formula:
For negative indicators, use the following formula:
Step 2: Find the p-value.
Step 3: Compute the e-entropy.
Step 4: Calculate d.
Step 5: Compute w to obtain the weights of each variable.
Step 6: Calculate the composite score.
Where Xij denotes the original data of the ith sample on the jth indicator, Xij’ denotes the normalized data of the ith sample on the jth indicator, min(Xj) denotes the minimum value of all samples of the jth indicator, max(Xj) denotes the maximum value of the jth indicator among all samples, pij is the proportion of the ith sample for the jth indicator, ej denotes the entropy value of the jth indicator, and wj is the weight assigned to the jth indicator. In the standardization process of the entropy weight method, adding 0.0001 is to avoid calculation problems caused by the existence of 0 values in the original data. Since the calculation of the entropy weight method involves logarithmic operations, ln(0) is mathematically meaningless. By adjusting the standardized values to 0.0001, it ensures that all values are greater than 0, thereby improving the stability and accuracy of the calculation. Moreover, this small adjustment barely affects the overall outcomes.
- (2)
- KDE Method
The KDE technique, which is a non-parametric statistical method, is used for the estimation of a dataset’s probability density function. This method reveals the distributional characteristics of the data through smoothing, including the identification of patterns, trends, and outliers, and at the same time provides an intuitive means of data visualization. The article applies the KDE method [53,54] to analyze the evolving patterns of the CGT index both at the national level and within the four key regions. The specific formulas are as follows:
where xi is the observation value, assuming it is independent and identically distributed; x0 is the sample mean; n indicates the overall quantity of observations; K[·] denotes the kernel function [53,54], and within the framework of this study, the Gaussian kernel function is chosen. Gaussian kernel has smoothness and symmetry, which can effectively reflect the local characteristics of the data. h denotes the bandwidth, and the bandwidth h is a critical argument in KDE, which determines the width of the kernel function, thus affecting the degree of smoothing of the density estimation. The choice of bandwidth is crucial to the results of KDE:If the bandwidth is excessively large, it may result in over-smoothing, concealing the true structure and details of the data. Conversely, if the bandwidth is excessively narrow, it may cause under-smoothing, making the estimation results too fluctuating, and easy to be affected by the noise in the data. Therefore, a reasonable choice of bandwidth is a crucial step in KDE to balance the bias and variance and improve the accuracy and reliability of the estimation.
Note: Gaussian function-related content is based on Zhang and Li (2022) [53], Wang et al. (2024) [54].
- (3)
- Thiel’s Index Method
The Thiel index serves as a crucial metric for assessing development disparities both within and between regions, which can reveal the relative imbalance of factor distribution. The article adopts the Thiel index and its decomposition formula [55,56] to investigate the disparities in the development level of CGT across the entire nation and its four principal regions. The primary aim of the analysis is to ascertain whether the development level of CGT in these areas is balanced or imbalanced. The formulas applied are shown below:
T and Tk are the Thiel indexes of the CGT for the national level and the four key regions, respectively; the smaller the value, the smaller the regional differences; i denotes the corresponding province; n signifies the complete count of areas; nk denotes the number of provinces which each of the four regions; Yi denotes the CGT development index of province i, while Yki is the CGT development index of province i within region k; and denote the mean values of the national and the four major regions’ CGT development indexes, respectively; Tk and Tb are the values of within-regional differences and between-regional differences in the Terrell indexes, respectively. We define Dw = Tw/T and Db = Tb/T, where Dw and Db respectively represent the contribution ratios of within-regional and between-regional disparities to the overall differences.
- (4)
- Convergence Model
On the basis of exploring the regional disparities and the dynamic evolution of China’s CGT, and aiming to more precisely analyze the spatio-temporal evolution trend of CGT in each region, σ-convergence and β-convergence models are established based on the insights from prior studies [57,58,59,60]. σ-convergence model is used to calculate coefficients of variation in different provinces as a way of determining whether the disparities in the CGT among the provinces have narrowed over time. This is the calculation formula:
where Yij signify the development level of CGT in province i within region j, stands for the mean development level of CGT across all provinces in region j, and n signifies the total provinces within the region.
The β-convergence model serves to assess whether provinces with lower CGT development levels are capable of reducing the gap with more developed provinces at a certain convergence rate. The two categories are as follows: absolute and conditional β-convergence. Absolute β-convergence indicates the convergence tendency of CGT among regions when economic variables are not considered. The absolute β-convergence model is presented below:
Conditional β-convergence explores the β-convergence characteristics of full green rate transition both nationally and across the four major regions of the country. After adding economic variables, drawing on existing studies to choose the level of human capital (x1), the degree of external market openness (x2), and the strength of financial support (x3) as the control variables, and conditioned β-convergence modeled as follows:
Given that the spatial convergence characteristics of CGT (in economic and social aspects) may vary across regions, this research adopts Elhorst’s (2014) [61] spatial econometric modeling framework. Firstly, the spatial autocorrelation effect of CGT on the economy and society in the whole country and its four main regions is examined. Then, the optimal spatial econometric model is selected using the LM test, Hausman test, and LR test (The specific model selection process is described in Appendix A). Since conditional β-convergence has more control variables than absolute β-convergence yet has the same testing framework, only the specific model for conditional β-convergence is shown below.
Yi,t+1 stands for the development level of CGT in province i during period t + 1, while Yit represents its level in period t. The coefficient β is the convergence coefficient. If β < 0, it implies that the CGT development levels among provinces tend to converge; conversely, if β ≥ 0, it means there is a divergence trend. Xi,t+1 functions as a control variable, with φ being its coefficient. The parameter λ is the spatial error coefficient, and wij is the spatial weight, which is set by geographic distance in the article, ρ indicates the consequence of the CGT growth rates in neighboring provinces on the province under study. The terms μ, η, and ε denote spatial effects, temporal effects, and random disturbances, respectively.
3.2.2. Data Description
This research utilizes panel data spanning the period from 2011 to 2022, collected across 30 provinces. The data for the article are mainly from the National Bureau of Statistics, provincial statistical yearbooks, China Environmental Statistical Yearbook, Peking University Faber, China Research Data Service Platform (CNRDS), and the Ministry of Agriculture and Rural Development of the People’s Republic of China.
3.3. Analysis of the Development Index for CGT at Both the National Level and Across Four Regional Divisions
Table 2 presents the CGT index of 30 provinces and four key regions in China, covering the period from 2011 to 2022. As can be seen from the table, during the 11-year period, the CGT development index exhibited a mean annual increase rate of 0.028%, with an increase of 0.121 in 2022 compared with 2011, indicating a gradual yet relatively slow upward trend in CGT development. It suggests that the lower growth rate of the CGT, as a key direction for future economic development, may hinder efforts to optimize the economic structure. The share of traditional energy-intensive industries may remain high, while the share of green industries is slow to increase, thereby impeding the economy‘s transition toward high-quality development. In addition, a lower growth rate may imply limited improvement in resource utilization efficiency and difficulty in effectively mitigating environmental pollution, which will increase the environmental cost of economic development and is not conducive to sustainable development. This suggests that the lower growth rate of green industries, as a key direction for future economic development, could potentially constrain the enhancement of economic structure. Within the eastern region, the CGT index ascended from 0.409 in 2011 to 0.539 in 2022, registering a mean annual increase rate of 0.026%. In the central region, it grew from 0.331 in 2011 to 0.461 in 2022, growing an average yearly rise rate of 0.031%. The western region saw its CGT index increase from 0.309 in 2011 to 0.420 in 2022, at an average yearly rise rate of 0.028%. In the northeastern region, the CGT index advanced from 0.322 in 2011 to 0.426 in 2022, registering a mean annual increase rate of 0.026%. In general, the CGT index across China’s regions is arranged in decreasing order: eastern, northeastern, central, and western. But when ranked according to the average annual growth rate, the order becomes central, western, northeastern, and eastern.
Table 2.
CGT index and average annual growth rate.
4. Results and Discussion
4.1. Trend Analysis of the Dynamic Evolution of a CGT
To improve the generalizability of the research conclusions, the article selects four key time points, namely 2013, 2016, 2019, and 2022, to reveal the dynamic evolution of CGT development levels among different regions, as shown in Figure 1 below.
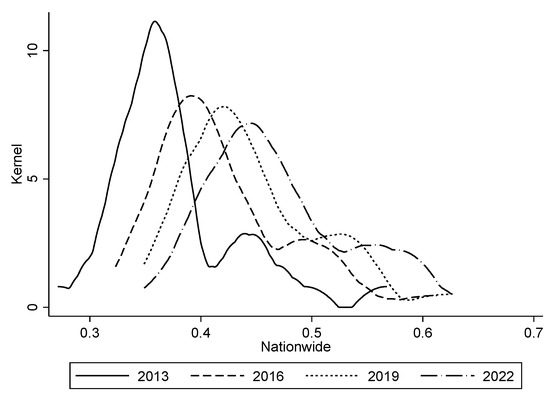
Figure 1.
Kernel density estimation plot of the national CGT development level index across major years.
As indicated in Figure 1, the KDE curve of the national CGT level has a clear rightward shift. This shift indicates a steady increase in the overall national CGT development index. Nevertheless, the index mainly stays within the range of 0.3 to 0.5, signifying an overall relatively low development tendency. For the CGT development level, its KDE curve shows that the main peak has a slight rightward shift and there is a “rightward tailing” phenomenon. Additionally, the width of the curve is expanding, which means that more and more provinces in China have a higher CGT development level.
An examination of Figure 2 reveals several crucial trends. Firstly, the KDE curve has shifted notably to the right within the eastern region. The value of the main peak has grown from approximately 0.42 to 0.58. This change indicates a positive enhancement in the CGT development level within the eastern region. Although the height of the main peak has increased slightly, its width has also broadened. This implies that while the CGT development level in the eastern region is becoming more concentrated at a higher stage, there is also a growing tendency of increasing differences among regions. Secondly, the KDE curve of the central region experiences a rightward shift, with the main peak becoming narrower. This shows that the CGT development index in the central region is becoming more concentrated, along with a decrease in regional disparities. Thirdly, the KDE curve of the western region shifts significantly to the right. The main peak first goes up and then drops slightly. This suggests that the concentration of the CGT development level in the western region initially increases and then decreases, while regional differences remain relatively stable. Fourthly, the KDE curve of the northeast region develops from a flat curve in 2013 to a peak value curve in 2022 and shows an overall shift to the right. This indicates that the concentration of the CGT development level in the northeast region is on the rise, but the differences between different provinces are gradually expanding.
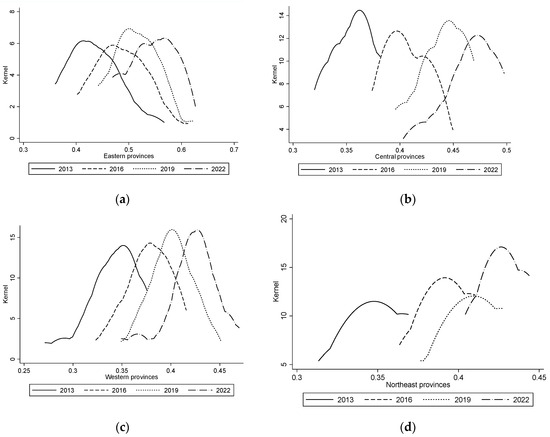
Figure 2.
Kernel density estimation plots of the development level index of CGT across the four major regions at significant time points. (a) for the eastern provinces, (b) for the central provinces, (c) for the western provinces, and (d) for the northeast provinces.
4.2. Analysis of Regional Differences in the CGT
Figure 3 presents the Theil index outcomes and their decomposition results for China’s CGT from 2011 to 2022. The overall difference in China’s CGT shows a decreasing trend during the study period, with only a few years showing an upward trend. The Theil index decreases from 0.0134 in 2011 to 0.0092 in 2022. This descending trend indicates a gradual reduction in the development gaps within the framework of China’s CGT of economic and social development.
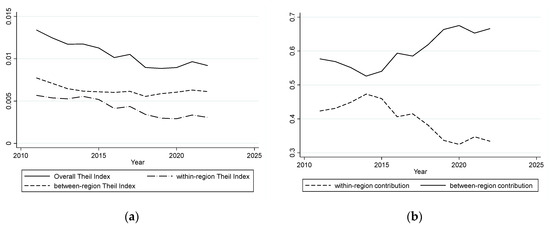
Figure 3.
Overall Thiel index and contributions; (a) denotes Theil index; (b) denotes contribution.
From Figure 3 Theil index, the inter-regional differences in China’s CGT of economic and social development are significantly larger than the intra-regional differences, and they are roughly consistent with the overall change differences, but there are individual years with a small upward trend, overall the inter-regional disparities declined from 0.0077 at the start of the study to 0.0061 at its end, and the intra-regional differences in China’s CGT of economic and social development are decreasing gradually. The within-group Theil index declined from 0.0057 in 2011 to 0.0031 in 2022. A deeper look at the contribution graph reveals that the inter-regional difference has the largest contribution in the whole, with a variation range of 0.5260–0.6752. The intra-regional difference in contribution is smaller, with a variation range of 0.3248–0.4732. Therefore, in developing a CGT, all the relevant departments must place significant emphasis on the imbalance of regional development and reduce the development gap between regions.
According to the results shown in Figure 4 about the development trends in the four key regions, it is evident that the northeast region displays the most prominent internal disparities in the advancement of the CGT. Moreover, both the eastern and northeastern regions demonstrate larger internal fluctuations in the CGT development level. This situation in the eastern region can be explained by its advanced economic standing. It has ample financial, technological, and human resources. Additionally, its industrial structure is optimized, with high-tech industries and service sectors accounting for a substantial proportion. These sectors generally have a relatively small impact on the environment and make CGT more feasible and advantageous. In contrast, the central, western, and northeastern regions are relatively economically backward. Their industrial structures lack diversity, mainly dominated by heavy chemical industries. This scenario creates obstacles to the promotion of the CGT. Moreover, these regions have deficiencies in technological innovation capacity. For example, there are insufficient scientific research institutions and innovation platforms, leading to slower progress, development, and application of green technologies. It is further observed that the Theil index of the eastern region decreased from 0.0085 at the start of the study to 0.0043 at its conclusion, and the Theil index of the northeastern region decreased from 0.0045 at the beginning of the study to 0.0008. The disparities within the central and western are comparatively minor, but they show the same trend of change as the eastern and northeastern regions. To be precise, the Theil index of the central experienced a slight decline, going from 0.0025 at the commencement of the study to 0.0023. Meanwhile, the western region’s index decreased from 0.0045 to 0.0028 over the same period. In general, the internal differences in the eastern and northeastern are substantially greater than those in the central and western. This can be ascribed to the fact that the eastern and northeastern regions have achieved positive results in promoting green transformation and improving economic efficiency through their respective development strategies.
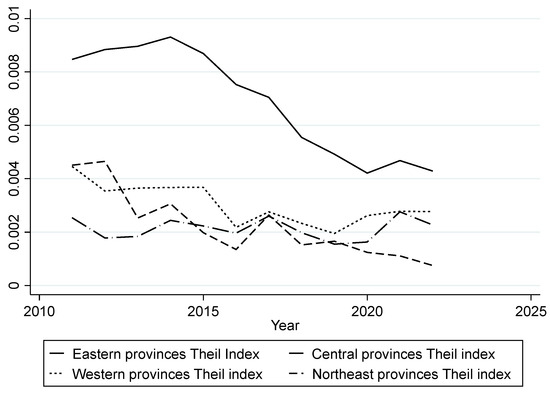
Figure 4.
Four subdivision Theil indexes.
4.3. Spatial Convergence Analysis for a CGT
4.3.1. Conducting a σ-Convergence Test on CGT
Figure 5 depicts the variation trend of the coefficient of variation for CGT nationwide and its four major regions. From the trend of change in the coefficient of variation, China as a whole shows a decreasing process of change. The coefficient of variation in 2022 has decreased by 0.0308 compared with 0.1701 in 2011, with a decrease of about 18.08%. The coefficients of variation for the CGT in the four key regions, namely the eastern, central, western, and northeastern, display different patterns. Among them, there is a clear downward trend in the eastern region as a whole. The coefficient of variation in 2022 declines by 0.0412, or about 29.73%, compared with 0.1386 in 2011. The trend in the central region follows the overall pattern. It witnessed a minor increase and then declined in 2017, and the coefficient of variation in 2022 decreased by 0.0040 compared to 0.0770 in 2011, a decrease of about 5.23%. The overall trend of change in the western region is “falling-rising-falling-rising”, and the coefficient of variation in 2022 is 0.0215 lower than that of 0.0988 in 2011, with a decrease of about 21.80%. The coefficient of variation in the Northeast region is the largest change among the four regions, decreasing from 0.1154 in 2011 to 0.0474 in 2022, a decrease of about 58.92%. In summary, σ-convergence exists in the coefficient of variation in China’s CGT level in economic and social development., both as a whole and in the four major regions. This result aligns with the conclusions reached from the prior analysis of KDE curves.
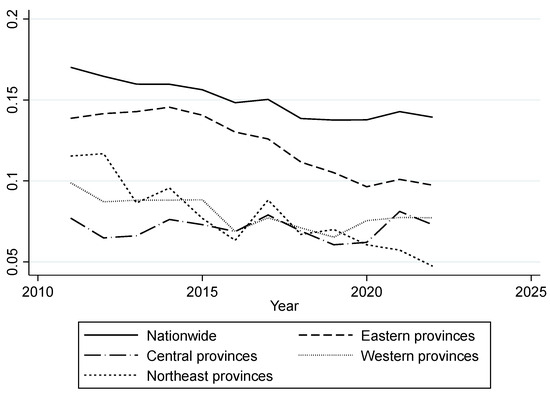
Figure 5.
σ-convergence test for full green transition.
4.3.2. β-Convergence Test for a Full Green Transition
- (1)
- Conducting an Absolute β-Convergence Test for CGT
As presented in Table 3, apart from the central region, all regression coefficients are notably negative. This indicates that the CGT in all regions except the West shows absolute β-convergence. In other words, without the influence of various other factors, the CGT levels in these regions will gradually converge to stable levels over time. Nevertheless, the regression coefficient for the central region is negative but not statistically significant, suggesting the absence of absolute β-convergence. This is in line with the previous Theil index findings for the central region. Even though the overall Theil index of the central region has declined, its value in 2022 is higher than that in 2011. This implies that in recent years, the internal disparities in green transformation development within the region have been on the rise. Following the verification that there are no spatial autocorrelation effects in the CGT of the central, western, and northeastern regions, the OLS model was adopted for regression analysis. Since spatial autocorrelation effects exist in the CGT of the national and eastern regions, the SAR and SDM were, respectively, selected for regression analysis (See Table A1 in Appendix A for the specific model selection process). The findings indicate that the development of national-level CGT is predominantly driven by the development differences among provinces. In the eastern region, the change rate of CGT in each province is affected not only by the local CGT level but also by the negative spatial spillover effect from the change rates of other provinces.
Table 3.
Outcomes of absolute β-convergence evaluations for nationwide and four key regions.
- (2)
- Conducting a conditional β-convergence test for CGT
The results presented in Table 4 suggest that, with multiple variables controlled, the regression coefficients at national and across the four key regions are significantly negative. This outcome demonstrates a convergence trend of China’s CGT of economic and social development, both nationally and regionally, as they move towards their respective equilibrium states. In particular, when control variables are incorporated, the spatial convergence models for nationwide and the western region transform into spatial lag models. This transformation indicates that the CGT is influenced by regional development disparities; the eastern region changes to a double fixed OLS, indicating that there is no spatial autocorrelation effect after the integration of control variables; and the spatial convergence model of the northeastern region does not change, the northeastern region still does not have a spatial autocorrelation effect (See Table A2 in Appendix A for the specific model selection process).
Table 4.
Outcomes of conditional β-convergence evaluations for the nation and four key regions.
Upon examining how control variables affect the spatial convergence of the CGT of the economic development mode, it can be found that the significance of each control variable varies in different regions. For the whole country, external openness has a statistically significant positive effect, facilitating the convergence of the CGT in economic and social sectors towards higher values. By comparison, although the human capital level and the strength of financial support have positive impacts, these effects do not reach statistical significance. In the eastern region, both the human capital level and the strength of financial support display negative impacts; yet, neither is statistically significant. This does not imply that financial support has no bearing on China’s CGT and simply indicates that its effect on the CGT of the economic development mode to a high value is not yet significant. Moreover, external openness exerts a positive but insignificant influence on the variation rate of China’s CGT. In the central region, the human capital level exerts a negative yet insignificant influence, while the external openness shows a positive but non-significant impact. On the contrary, government support strength has a negative and statistically significant effect. This implies that in the central region, the human capital level, external openness, and overall government support have not made notable contributions to China’s CGT. Regarding the western and northeastern regions, human capital levels, external openness, and financial support all exhibit positive but insignificant effects. Such results indicate that national efforts to boost the CGT in these regions are still inadequate.
5. Conclusions and Implications
5.1. Research Conclusions
The article establishes a CGT evaluation index system between 2011 and 2022, the entropy weight method was employed to gauge the development level of China’s CGT, both at the national scale and across four major regions. Subsequently, KDE and the Theil index method are utilized to depict the overall evolution trend and regional differences in CGT levels nationwide and within these four major regions. Ultimately, the key findings are presented below:
Firstly, the national CGT level has increased, with the east leading the way. The CGT development across the nation and its four key regions has shown a clear trend of growth, with obvious regional differences. In detail, CGT development has generally increased in the four key regions. Significantly, the eastern region has outperformed the other three regions in terms of CGT development.
Secondly, the count of provinces with CGT has increased nationwide, but regional differences have increased. When examining the dynamic evolution of the national level and across the four major regions, an upward trend is evident in the number of provinces making progress in CGT development, but the unevenness of this transition has increased. At the same time, the regions also show the characteristics of unevenness in the dynamic evolution process, but there has not yet been a clear bifurcation in the regions.
Thirdly, the CGT has large interregional differences and decreasing national differences. The level of development of CGT shows an expanding trend, which mainly stems from interregional differences. Overall, although the disparities are substantial in scale, a discernible trend of steady reduction is evident. In the analysis of intra-regional differences, four regions display a downward trend. Regarding inter-regional differences, the gaps between the eastern and northeastern regions are the most significant, followed closely by the western region, while the central region experiences relatively smaller disparities. Inter-regional differences constitute the primary source of variations in the CGT development level, with intra-regional differences playing a secondary role.
Fourthly, σ-convergence in CGT is present both nationwide and in the four key regions. β-convergence is more pronounced nationwide and in the eastern. Nationally and within the four key regions, the economic and social CGT shows σ-convergence characteristics. With the exception of the central region, all other regions demonstrate both absolute and conditional β-convergence. In concrete terms, at the 1% significance level, absolute β-convergence is observed in the national and eastern. In the western and northeastern, this convergence is significant at the 5% level. Regarding conditional β-convergence, nationwide and western exhibit significance at the 1% level, while the eastern, central, and northeastern regions show significance at the 5% level.
5.2. Policy Implications
In light of the conclusions mentioned above, the following recommendations are suggested:
Firstly, integrate a comprehensive layout and drive a new process of green transformation. To achieve a CGT, it is essential to incorporate the demands of green transformation into the overall framework of development. First, it is necessary to optimize the pattern of territorial space development and protection, rationally plan the spatial layout of cities and rural areas, industrial zones and ecological zones, etc., to ensure the comprehensive coverage of green transformation. Second, promote the adjustment of industrial structure, vigorously develop green and low-carbon industries, restrict the development of high-pollution and high-energy-consuming industries, and achieve green economic growth. Given this premise, the northeastern region needs to fully explore new green and low-carbon technologies. This exploration aims to drive the transformation and upgrading of the entire traditional industrial chain, thus enhancing industrial energy conservation and efficiency. Concurrently, it is essential to facilitate the profound integration of emerging technologies, including the Internet of Things, artificial intelligence, and green low-carbon industries. Finally, it focuses on upgrading the greening of production methods, propelling CGT and upgrading traditional industries, improving the cooperation between the eastern, central, and western regions, central and local cooperation and the mechanism of industry-industry integration, while strengthening environmental management and monitoring, and promoting the development of circular economy and green supply chain.
Secondly, it optimizes regional synergy and stimulates new vitality for green transformation. Synergistic transformation is an important guarantee for realizing CGT. The development of different regions and industries should be fully considered, and green transformation policies should be formulated according to local conditions. First of all, to strengthen inter-regional green development collaboration, the eastern region can support the western region’s new energy development by providing funds, This support will improve energy efficiency, promote the growth of clean energy, stimulate regional coordination, and accelerate the low-carbon transformation of the energy structure. Meanwhile, it is crucial to guide high-energy-consuming industries to relocate to the western region while increasing the utilization of new energy in the eastern region. This approach will help optimize the energy structures of both regions and establish synergy for green transformation. Moreover, promoting the green and low-carbon upgrading of traditional industries, and creating a positive cycle of CGT are also essential steps. Through these collaborative efforts, we can achieve a win-win situation that balances economic and social development with ecological and environmental protection.
Thirdly, deepen the innovation drive and lead to new momentum for green transformation. First, the innovation drive is the core, the government ought to enhance the investment in green science and technology innovation, the eastern region should continue to increase the investment in renewable energy, energy storage technology and hydrogen energy, and other emerging technologies, to consolidate its leading position in green transformation; the central and western ought to prioritize the application of transitional technologies such as carbon capture and storage, to promote the green transformation of the traditional industries, and gradually narrow the gap with the eastern region; the northeast region should utilize its strengths in carbon capture and storage technology and hydrogen energy industry, and at the same time strengthen the application of energy storage technology to push forward the green transformation across regions. Second, innovation output is the key to encouraging enterprises to perform green technological innovation and strengthen market competitiveness. Finally, innovation policy is the guarantee, that the government should increase policy support for the central, western, and northeastern regions, develop and implement a range of policies aimed at stimulating green technology innovation and application, particularly in the realm of green finance, to offer adequate financial resources to underpin the green transition. Through innovation and transformation, it will promote the formation of new kinetic energy for green development and realize high-quality economic and social development.
Fourthly, adhere to the principle of prioritizing safety as the foundation, and safeguard the foundation of the green transition. Safe transformation is the bottom-line requirement for CGT. During the advancement of CGT, the safe supply of key resources such as energy and food should be ensured. At the same time, the security management of the industrial chain and supply chain should be strengthened to prevent and resolve the risk challenges that may arise during the advancement of CGT. In addition, environmental safety supervision should be strengthened to ensure that green transformation will not cause new damage to the ecological environment. Realizing stable coordination between green transformation and economic and social development through security transformation.
5.3. Research Limitations
This research formulates a framework for measurement and systematically analyzes the dynamic evolution characteristics of China’s CGT. The findings of the study provide important references for policymakers, especially in promoting energy structure optimization, green technology innovation, and regional coordinated development, which have significant application value. However, there are some drawbacks to this study. First, it primarily analyzes the evolutionary characteristics of CGT from the macro level, and future research can further penetrate into the micro level to explore the current situation and influencing factors of CGT of enterprises. Second, the timeliness of the data and the comprehensiveness of the indicator system may limit the thoroughness and scope of the analysis. For future research, efforts can be made to enhance the monitoring of the green transformation process. This can be achieved by refining the indicator system and integrating big data with artificial intelligence. Such an approach will offer more profound theoretical underpinnings and practical solutions for sustainable development. Finally, It should be noted that the present study primarily focused on the evolution of CGT and did not comprehensively account for the influence of potential variables. Future research can explore comprehensive models to deeply analyze the intrinsic influence mechanism of CGT and provide new perspectives for the in-depth study of CGT.
Author Contributions
Conceptualization, Y.W.; methodology, Y.W. and J.W.; software, J.W. and M.J.; validation, Y.W.; formal analysis, Y.W.; investigation, J.W.; data curation, J.W., Y.W. and M.J.; writing—original draft preparation, J.W.; writing—review and editing, Y.W., J.W. and M.J.; funding acquisition, Y.W. All authors have read and agreed to the published version of the manuscript.
Funding
Shanxi Province Philosophy and Social Science Planning Program “Study on the Coordinated Development of Green Logistics and Green Economy in the Yellow River Basin” (2023YJ086).
Institutional Review Board Statement
Not applicable.
Informed Consent Statement
Not applicable.
Data Availability Statement
Data are available under reasonable request.
Conflicts of Interest
The authors declare no conflicts of interest.
Appendix A
Table A1.
Absolute beta convergence model test p-value for the whole country and four regions.
Table A1.
Absolute beta convergence model test p-value for the whole country and four regions.
| Nationwide | Eastern Part | Central Part | Western Part | Northwest | ||
|---|---|---|---|---|---|---|
| p | p | p | p | p | ||
| LM | Spatial error: (Robust) Lagrange multiplier | 0.101 | 0.726 | 0.955 | 0.793 | 0.882 |
| Spatial lag: (Robust) Lagrange multiplier | 0.001 | 0.074 | 0.429 | 0.239 | 0.943 | |
| Hausman | 0.000 | 0.0274 | 0.6370 | 0.0001 | 0.5072 | |
| LR | Likelihood-ratio test (individual) | 0.000 | 0.000 | 0.0887 | ||
| Likelihood-ratio test (time) | 0.000 | 0.0198 | 0.027 | |||
| Model Selection | two-way fixed SAR | two-way fixed SDM | two-way fixed OLS | two-way fixed OLS | random OLS |
Table A2.
Conditional beta convergence model test p-value for the whole country and four regions.
Table A2.
Conditional beta convergence model test p-value for the whole country and four regions.
| Nationwide | Eastern Part | Central Part | Western Part | Northwest | ||
|---|---|---|---|---|---|---|
| p | p | p | p | p | ||
| LM | Spatial error:(Robust) Lagrange multiplier | 0.000 | 0.609 | 0.347 | 0.093 | 0.599 |
| Spatial lag: (Robust) Lagrange multiplier | 0.639 | 0.551 | 0.701 | 0.346 | 0.73 | |
| Hausman | 0.000 | 0.1303 | 0.054 | 0.000 | 0.8207 | |
| LR | Likelihood-ratio test (individual) | 0.000 | 0.0692 | 0.000 | ||
| Likelihood-ratio test (time) | 0.000 | 0.0060 | 0.000 | |||
| Model Selection | two-way fixed SEM | random OLS | two-way fixed OLS | two-way fixed SEM | random OLS |
References
- Research Group of China Economic Growth Frontier; Zhang, P.; Zhang, P.; Zhang, Z.R.; Xue, C.; Liu, X.F. Exploration and Governance Practice of China’s Growth Path under the Green-development Strategy. Econ. Res. J. 2022, 57, 27–45. [Google Scholar]
- Shan, J.J.; Xie, W.W.; Yang, K.Z. Reshaping China’s spatial economic pattern under the goal of green transformation: Problem identification and path selection. China Soft Sci. 2023, 85–95. Available online: https://kns.cnki.net/kcms2/article/abstract?v=RN_8baVbY4fEO0GJH9pWLoU9hwuidU5pvBPjUajfNlcOL3mFZp17VgQ2mZwOg7nBnuW1AGzGNZg2A0otOPaY2vPdi1kfURxMjZk5KQ-ojhEyMiLwbPoxJiYZMZ44HRVcX-JbddKKk1UK6UsJrvSjj8ZKXjEi34V177qpLj3N7zlV3d8UJLOcOQ==&uniplatform=NZKPT&language=CHS (accessed on 10 April 2025).
- Zhou, C.; Qi, S.; Li, Y. Environmental policy uncertainty and green transformation dilemma of Chinese enterprises. J. Environ. Manag. 2024, 370, 122891. [Google Scholar] [CrossRef]
- Devezas, T.; Tick, A.; Sarygulov, A.; Rukina, P. The Slow Pace of Green Transformation: Underlying Factors and Implications. Energies 2024, 17, 4789. [Google Scholar] [CrossRef]
- Hou, B.Z. City Transformation: Cycle, Strategy and Mode. Urban Plan. Forum 2005, 5–15+20. Available online: https://kns.cnki.net/kcms2/article/abstract?v=RN_8baVbY4d5GVx2lGKgXNQ5JnUvXREnQnqpX3yaScBTm0zZTO_Kld09JT1Ejcq0o2e-NYM3ntkkG26OBgFJf52dtzhwCIL0Jfdk3qic87W-dTmt0dAlxsfvH7Za1MLc-lJFZfjKkuKWVrHh_krKzd--apt5VoGtP8PO0BGcIcF-Rner7zikyw==&uniplatform=NZKPT&language=CHS (accessed on 10 April 2025).
- Tong, H.; Wang, Y.; Xu, J. Green transformation in China: Structures of endowment, investment, and employment. Struct. Chang. Econ. Dyn. 2020, 54, 173–185. [Google Scholar] [CrossRef]
- Wan, P.B.; Yang, M.; Chen, L. How Do Environmental Technology Standards Affect the Green Transition of China’s Manufacturing Industry—A Perspective from Technological Transformation. China Ind. Econ. 2021, 9, 118–136. [Google Scholar] [CrossRef]
- Guo, K.S.; Peng, J.Z. The Manufacturing Sector’s Strategic Position and Role in China’s New Stage of Development. Soc. Sci. China 2021, 5, 128–149+207. [Google Scholar]
- Jiang, Z.; Lyu, P.; Ye, L.; Zhou, Y.W. Green innovation transformation, economic sustainability and energy consumption during China’s new normal stage. J. Clean. Prod. 2020, 273, 123044. [Google Scholar] [CrossRef]
- Li, Q.; Zhang, P.; Chen, J. Does energy transformation improve green development efficiency? Evidence from Sichuan Province, China. Energy Rep. 2024, 12, 861–871. [Google Scholar] [CrossRef]
- Hwang, Y.K.; Díez, Á.S. Renewable energy transition and green growth nexus in Latin America. Renew. Sustain. Energy Rev. 2024, 198, 114431. [Google Scholar] [CrossRef]
- Zhao, R.; Hu, C.; Du, C.; Wang, C.; Sun, L. Synergistic effect assessment of pollution and carbon reduction and pathway of green transformation at regional level in China. J. Clean. Prod. 2025, 495, 145013. [Google Scholar] [CrossRef]
- An, B.W.; Xu, P.Y.; Huang, H.; Xiao, Y. Performance Evaluation and Spatial Gap Evolution of China’s Carbon Reduction, Pollution Reduction and Green Growth—Based on the Systemic Conception of the Harmony Between Humanity and Nature. Inq. Econ. Issues 2024, 45, 115–135. [Google Scholar]
- Dai, Y.H.; Wang, X.Y.; Tong, X.C. From the Sharing Economy to the Low Carbon Economy: Evidence from the Entry of Bicycle Sharing Platforms. J. Quant. Technol. Econ. 2024, 41, 111–130. [Google Scholar] [CrossRef]
- Jiang, R.A.; Yang, S.H.; Wen, J. The Opening of High-speed Rail and High-quality Economic Development: Mechanisms and Effects. Nankai Econ. Stud. 2023, 70–89. [Google Scholar] [CrossRef]
- Xu, B.; Lai, F.B. Transportation Structure Optimization and Urban Green Transformation: Evidence from a Metro Expansion. J. Zhejiang Gongshang Univ. 2024, 1, 97–109. [Google Scholar] [CrossRef]
- Wang, K.L.; Zhao, B.; Xu, R.Y. International Transport Channel and Urban Green and Low Carbon Transformation—A Quasi-natural Experiment Based on the Opening of the China Railway Express. Inq. Econ. Issues 2023, 44, 108–124. [Google Scholar]
- Wang, K. Green Transformation and Development of China’s Urbanization. City Plan. Rev. 2021, 45, 9–16+66. [Google Scholar]
- Ma, Q.; Shi, F. New urbanization and high-quality urban and rural development: Based on the interactive coupling analysis of industrial green transformation. Ecol. Indic. 2023, 156, 111044. [Google Scholar] [CrossRef]
- Yue, J.; Zhang, F. Evaluation of industrial green transformation in the process of urbanization: Regional difference analysis in China. Sustainability 2022, 14, 4280. [Google Scholar] [CrossRef]
- Guo, B.; Hu, P.; Lin, J. The effect of digital infrastructure development on enterprise green transformation. Int. Rev. Financ. Anal. 2024, 92, 103085. [Google Scholar] [CrossRef]
- Dong, Y.; Zhang, G. Can Digital Infrastructure Construction Drive Enterprises’ Carbon Reduction and Green Transformation?—Based on the Chain Network System of Production Factors. Econ. Probl. 2023, 50–56. [Google Scholar] [CrossRef]
- Yang, X.; Razzaq, A.; Ran, Q. Assessing the impact mechanism of renewable energy technology innovation on industrial green transformation in China. J. Environ. Plan. Manag. 2023, 1–21. [Google Scholar] [CrossRef]
- Ai, M.; Zhang, W.; Du, S.; Yu, X.; Bu, Y. The impact of digitalization on the green transformation of China’s industrial sectors: The mediating role of green technology innovation and technological transformation. Int. Rev. Econ. Financ. 2024, 96, 103736. [Google Scholar] [CrossRef]
- Wan, L.; Wan, X.; Fang, Y.; Huang, G. From digitalization to green transformation: Empirical evidence from RCEP’s industrial sectors. Humanit. Soc. Sci. Commun. 2025, 12, 1–15. [Google Scholar] [CrossRef]
- Meng, X.; Xu, S.; Hao, M. Can digital-real integration promote industrial green transformation: Fresh evidence from China’s industrial sector. J. Clean. Prod. 2023, 426, 139116. [Google Scholar] [CrossRef]
- Zhang, Z.; Li, P.; Huang, L.; Kang, Y. The impact of artificial intelligence on green transformation of manufacturing enterprises: Evidence from China. Econ. Chang. Restruct. 2024, 57, 146. [Google Scholar] [CrossRef]
- Chen, Z.; Wang, Y.; Wang, Y. Synergy or Counteraction: Can Multiple Environmental Policies Promote High-Quality Green Transformation of Enterprises?—A Comprehensive Assessment Based on Double Machine Learning Algorithms. Systems 2024, 12, 518. [Google Scholar] [CrossRef]
- Zhang, L.; Xu, L.; Gao, M.; Zhou, M. Can Agricultural Credit Promote the Green Transformation of China’s Agriculture? Sustainability 2024, 16, 10944. [Google Scholar] [CrossRef]
- Chan, Y.; Punzi, M.; Zhao, H. Green transition and financial stability: The role of green monetary and macroprudential policies and vouchers. Energy Econ. 2024, 132, 107449. [Google Scholar] [CrossRef]
- Yin, X.; Huang, C.Y. Study on Fiscal and Financial Policies to Promote Green Transformation and Development of the Manufacturing Industry. Sub. Natl. Fisc. Res. 2023, 28–39. Available online: https://kns.cnki.net/kcms2/article/abstract?v=RN_8baVbY4epXPfPoM-_39OPPd6U-jggBCuqBsA4KvbwcwKeRoD95nygvghuF4wmbu7zmySyP8M2BO0KuQ7K837XNnXgo1I_UqTqVuOe7k2FHNext-ekLyAOy3lnNNDwlcZ5oe0KVdvJTB1PH7HuBu1xX901eDTWqFx1ZIHGhOidjaKoXtaUdw==&uniplatform=NZKPT&language=CHS (accessed on 10 April 2025).
- Li, X.; Wu, C. Influence mechanism of government subsidy on the green transformation of coal company in China. Int. J. Min. Sci. Technol. 2024, 34, 1033–1040. [Google Scholar] [CrossRef]
- Cheng, Z.; Wu, Y. Can the issuance of green bonds promote corporate green transformation? J. Clean. Prod. 2024, 443, 141071. [Google Scholar] [CrossRef]
- Xu, Z.; Chen, Y. How does green finance strategy foster the green transition? Based on the perspective of provinces’ green total factor productivity. J. Environ. Plan. Manag. 2023, 68, 1599–1621. [Google Scholar] [CrossRef]
- Wang, C.; Li, X.-W.; Wen, H.-X.; Nie, P.-Y. Order financing for promoting green transition. J. Clean. Prod. 2021, 283, 125415. [Google Scholar] [CrossRef]
- Lu, Y.; Gao, Y.; Zhang, Y.; Wang, J. Can the green finance policy force the green transformation of high-polluting enterprises? A quasi-natural experiment based on “Green Credit Guidelines”. Energy Econ. 2022, 114, 106265. [Google Scholar] [CrossRef]
- Zhang, W.Y.; Sun C, W. How does outward foreign direct investment affect enterprise green transition? Evidence from China. J. Clean. Prod. 2023, 428, 139331. [Google Scholar] [CrossRef]
- Chen, Y.; Ma, X.; Ma, X.; Shen, M.; Chen, J. Does green transformation trigger green premiums? Evidence from Chinese listed manufacturing firms. J. Clean. Prod. 2023, 407, 136858. [Google Scholar] [CrossRef]
- Li, Y. Corporate green transformation and stock returns: Evidence from Chinese listed manufacturing firms. Appl. Econ. 2024, 1–17. [Google Scholar] [CrossRef]
- Deng, W.; Zhang, Z.; Guo, B. Firm-level carbon risk awareness and green transformation: A research on the motivation and consequences from government regulation and regional development perspective. Int. Rev. Financ. Anal. 2024, 91, 103026. [Google Scholar] [CrossRef]
- Liu, L.; Liu, L.; Liu, K.; Jiménez-Zarco, A.I. Climate policy and corporate green transformation: Empirical evidence from carbon emission trading. Res. Int. Bus. Financ. 2025, 74, 102675. [Google Scholar] [CrossRef]
- Zhai, X.; An, Y.; Shi, X.; Liu, X. Measurement of green transition and its driving factors: Evidence from China. J. Clean. Prod. 2022, 335, 130292. [Google Scholar] [CrossRef]
- Peng, S.J.; Fang, Y.; Li, Z.X. External Demand and Green Transformation of the Export Sector: Based on the Perspective of Between-Firm Resource Reallocation. China Ind. Econ. 2024, 10, 81–99. [Google Scholar] [CrossRef]
- He, Z.; Wen, C.; Yang, X. Navigating the Green Transition: The Influence of Low-Carbon City Policies on Employment in China’s Listed Firms. Energies 2024, 17, 1896. [Google Scholar] [CrossRef]
- Yu, X.; Zhou, J.; Ni, K.; Wang, X. Environmental centralization and firm green transition: Evidence from County-to-District reclassification in China. Energy Econ. 2025, 144, 108365. [Google Scholar] [CrossRef]
- Zhang, X.Y.; Xie, L.H.; Xiao, J.H. Government Procurement, Digital Economy Development and Industrial Structure Upgrading. Contemp. Financ. Econ. 2024, 43–55. [Google Scholar] [CrossRef]
- Wang, J.; Yu, S.; Li, M.; Cheng, Y.; Wang, C. Study of the impact of industrial restructuring on the spatial and temporal evolution of carbon emission intensity in Chinese provinces—Analysis of mediating effects based on technological innovation. Int. J. Environ. Res. Public Health 2022, 19, 13401. [Google Scholar] [CrossRef] [PubMed]
- Wang, R.; Xiao, Y.; Huang, H.; Chang, M. Exploring the complex relationship between industrial upgrading and energy eco-efficiency in river basin cities: A case study of the Yellow River Basin in China. Energy 2024, 312, 133498. [Google Scholar] [CrossRef]
- Wang, Q.; Lin, S.F.; Guan, H.S. The Level of Effective Technological Innovation in China: Evaluation, Measurement and the Causes Identification of Regional Disparity. Inq. Econ. Issues 2023, 7, 103–120. [Google Scholar]
- Yang, M.; Wang, J.; Jing, Z.; Liu, B.; Niu, H. Evaluation and regulation of resource-based city resilience: Evidence from Shanxi Province, China. Int. J. Disaster Risk Reduct. 2022, 81, 103256. [Google Scholar] [CrossRef]
- Xiao, Y.; Chai, J.; Wang, R.; Huang, H. Assessment and key factors of urban liveability in underdeveloped regions: A case study of the Loess Plateau, China. Sustain. Cities Soc. 2022, 79, 103674. [Google Scholar] [CrossRef]
- Xu, X.; Zhang, Z.; Long, T.; Sun, S.; Gao, J. Mega-city region sustainability assessment and obstacles identification with GIS–entropy–TOPSIS model: A case in Yangtze River Delta urban agglomeration, China. J. Clean. Prod. 2021, 294, 126147. [Google Scholar] [CrossRef]
- Zhang, M.D.; Li, Y. Research on Spatial-temporal Pattern and Convergence of Urban Economic High-quality Development in the Yangtze River Economic Belt. East China Econ. Manag. 2022, 36, 24–34. [Google Scholar] [CrossRef]
- Wang, F.; Zhuang, L.; Cheng, S.; Zhang, Y.; Cheng, S. Spatiotemporal variation and convergence analysis of China’s regional energy security. Renew. Sustain. Energy Rev. 2024, 189, 113923. [Google Scholar] [CrossRef]
- Shi, C.X.; He, X.R.; Peng, K.J. Spatial and Temporal Evolution of High Quality Development Level in the Yangtze River Economic Belt and Identification of Obstacles. East China Econ. Manag. 2023, 37, 20–31. [Google Scholar] [CrossRef]
- Bianco, V.; Proskuryakova, L.; Starodubtseva, A. Energy inequality in the eurasian economic union. Renew. Sustain. Energy Rev. 2021, 146, 111155. [Google Scholar] [CrossRef]
- Yang, X.; Chen, H. Regional Difference and Convergence of Equalization of Basic Public Services in Urban and Rural Areas in China. J. Quant. Technol. Econ. 2020, 37, 127–145. [Google Scholar] [CrossRef]
- Peng, Z.; Li, M. Carbon Emissions Intensity of the Transportation Sector in China: Spatiotemporal Differentiation, Trends Forecasting and Convergence Characteristics. Sustainability 2025, 17, 815. [Google Scholar] [CrossRef]
- Gao, X.; Huang, L.; Wang, H. Spatiotemporal differentiation and convergence characteristics of green economic efficiency in China: From the perspective of pollution and carbon emission reduction. Environ. Sci. Pollut. Res. 2023, 30, 109525–109545. [Google Scholar] [CrossRef]
- Tomal, M. A review of Phillips-Sul approach-based club convergence tests. J. Econ. Surv. 2024, 38, 899–930. [Google Scholar] [CrossRef]
- Elhorst, J. Matlab software for spatial panels. Int. Reg. Sci. Rev. 2014, 37, 389–405. [Google Scholar] [CrossRef]
Disclaimer/Publisher’s Note: The statements, opinions and data contained in all publications are solely those of the individual author(s) and contributor(s) and not of MDPI and/or the editor(s). MDPI and/or the editor(s) disclaim responsibility for any injury to people or property resulting from any ideas, methods, instructions or products referred to in the content. |
© 2025 by the authors. Licensee MDPI, Basel, Switzerland. This article is an open access article distributed under the terms and conditions of the Creative Commons Attribution (CC BY) license (https://creativecommons.org/licenses/by/4.0/).