
Can Eco-Driving Evaluation Cross Cities? Data Localization and Behavioral Heterogeneity from Beijing to Toronto


Abstract
1. Introduction
2. Materials and Methods
2.1. Data Sources
2.1.1. Vehicle Trajectory Data
2.1.2. Map Data
2.1.3. Fuel Consumption Test Data
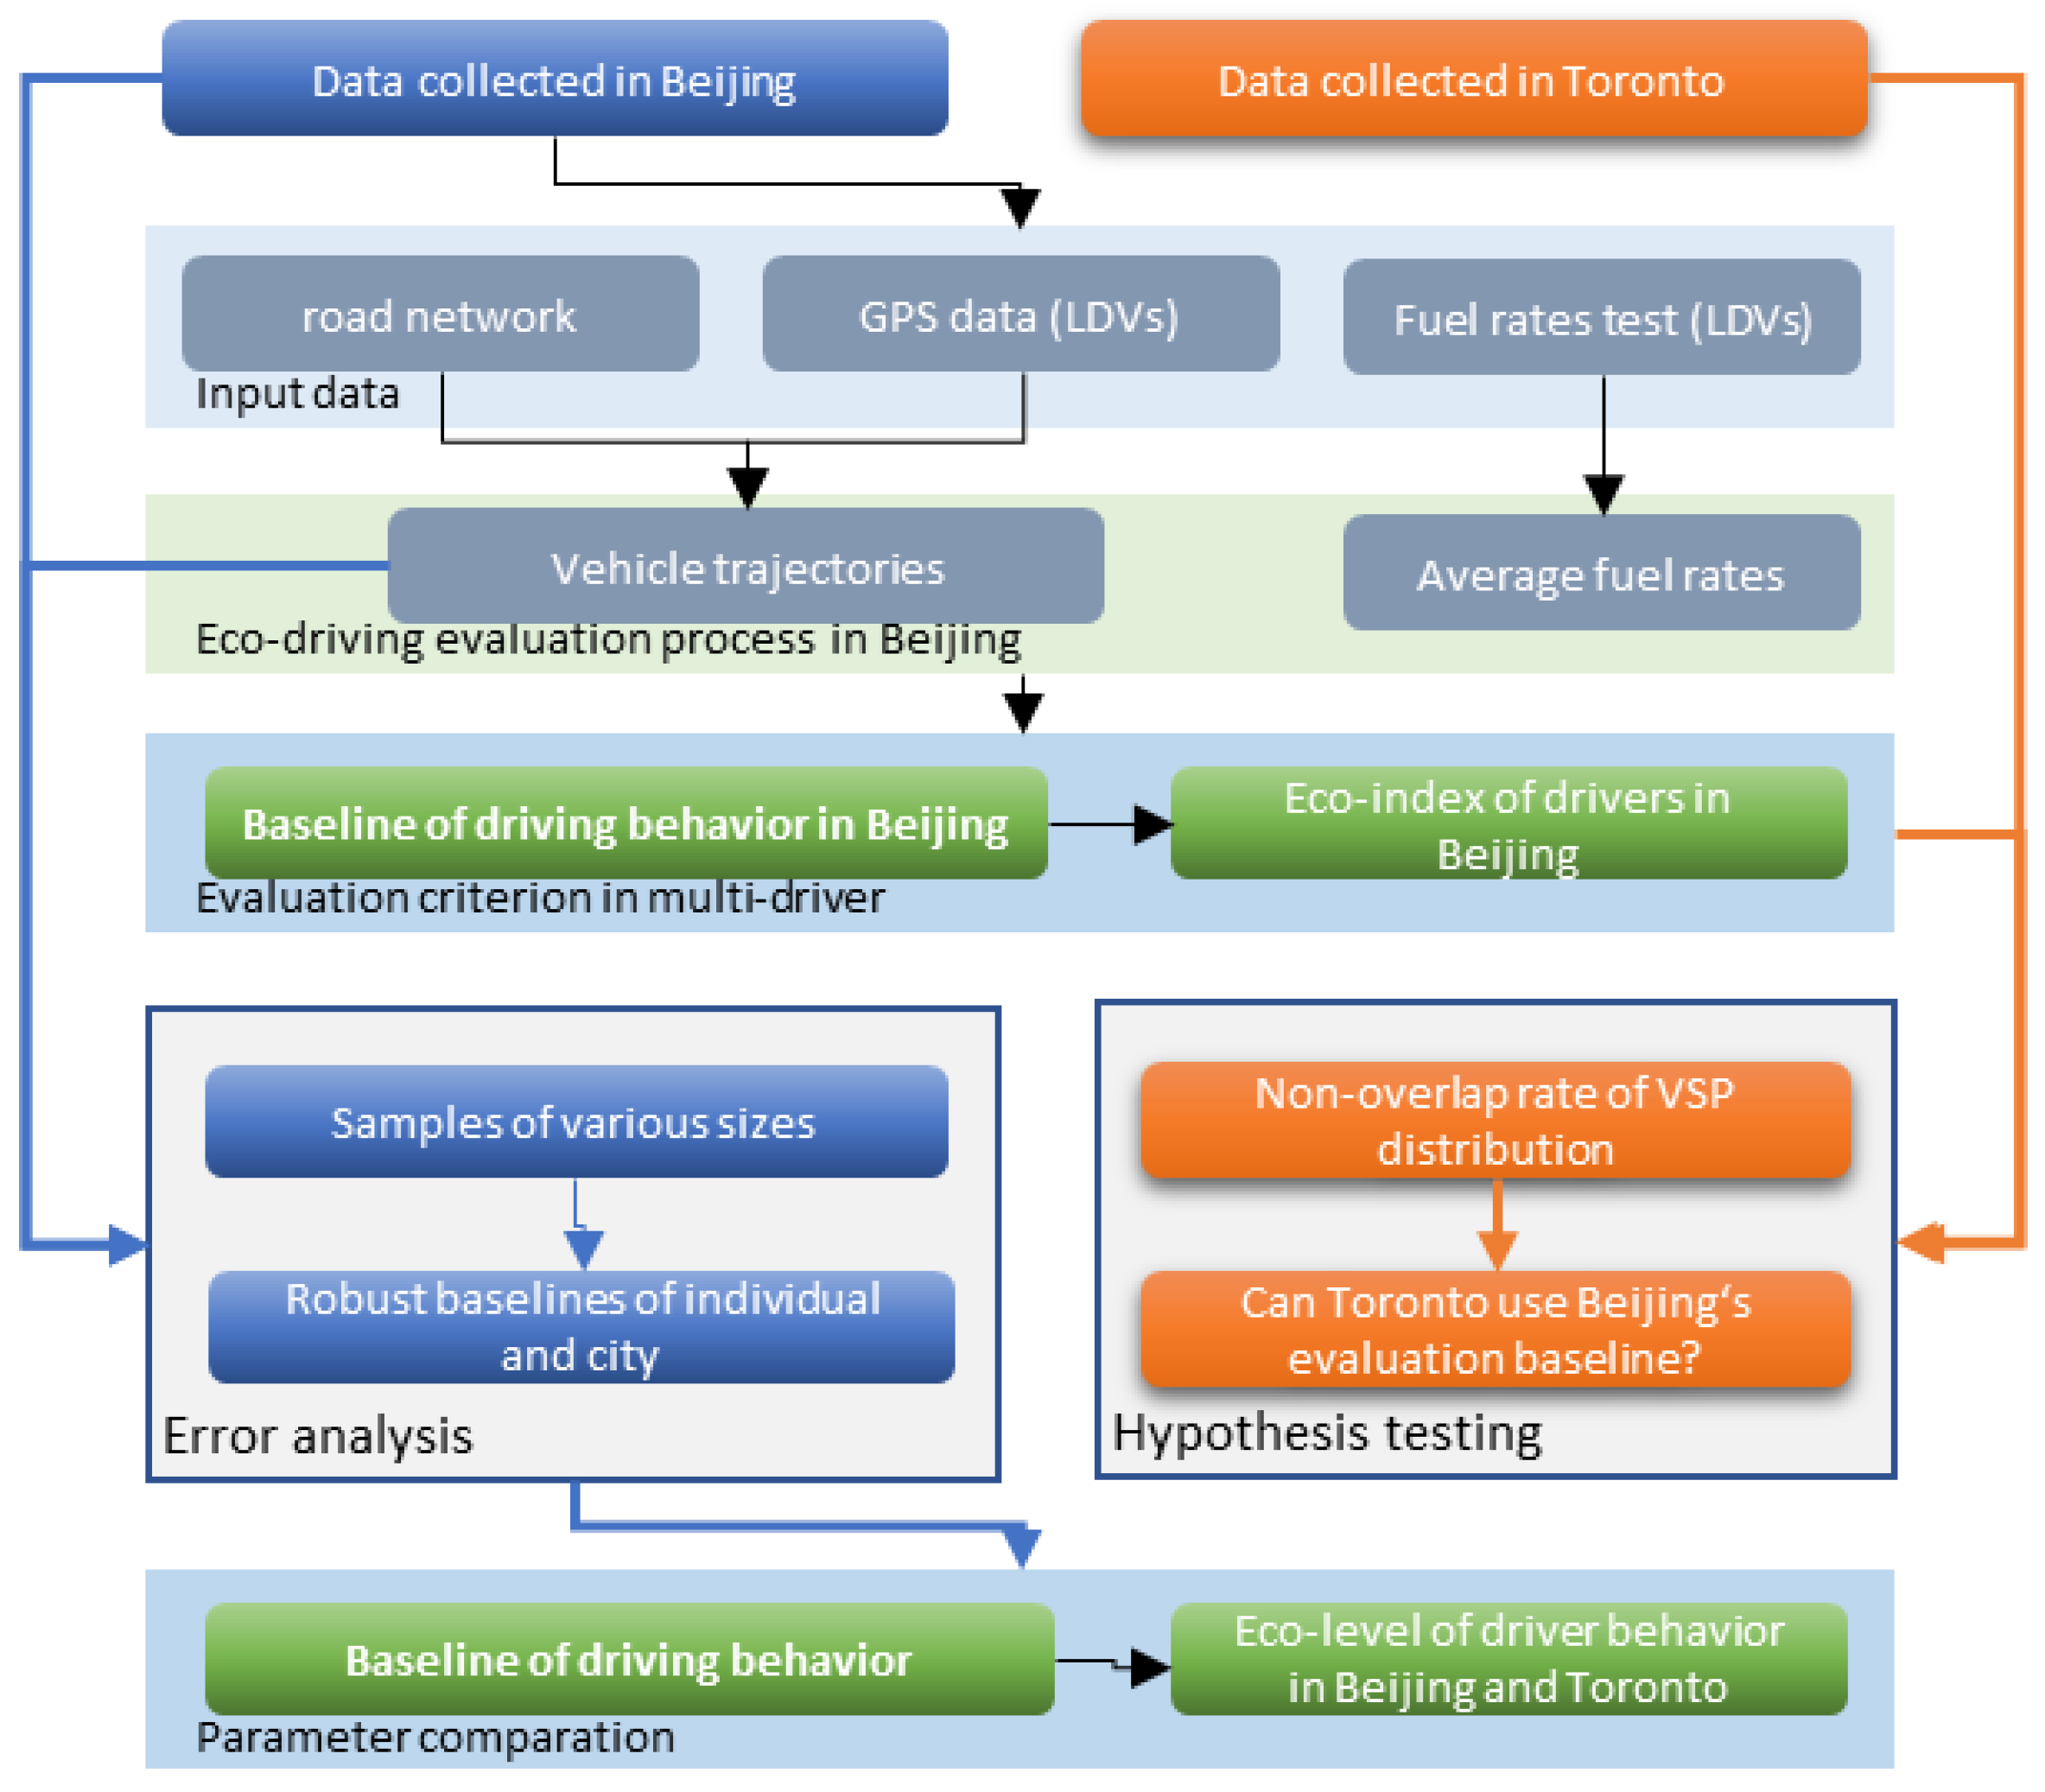
2.2. Development of Eco-Driving Evaluation Baseline
- (1)
- Calculating VSP values from second-by-second vehicle data to quantify instantaneous power demand;
- (2)
- Segmenting short trips by road type (60 s bins for expressways; 180 s bins for non-expressways);
- (3)
- Clustering instantaneous VSP values and average speeds within each trip segment;
- (4)
- Generating facility- and speed-specific VSP distributions via pooling, which are then coupled with average fuel consumption rates of light-duty vehicles to derive city-specific eco-driving baselines.
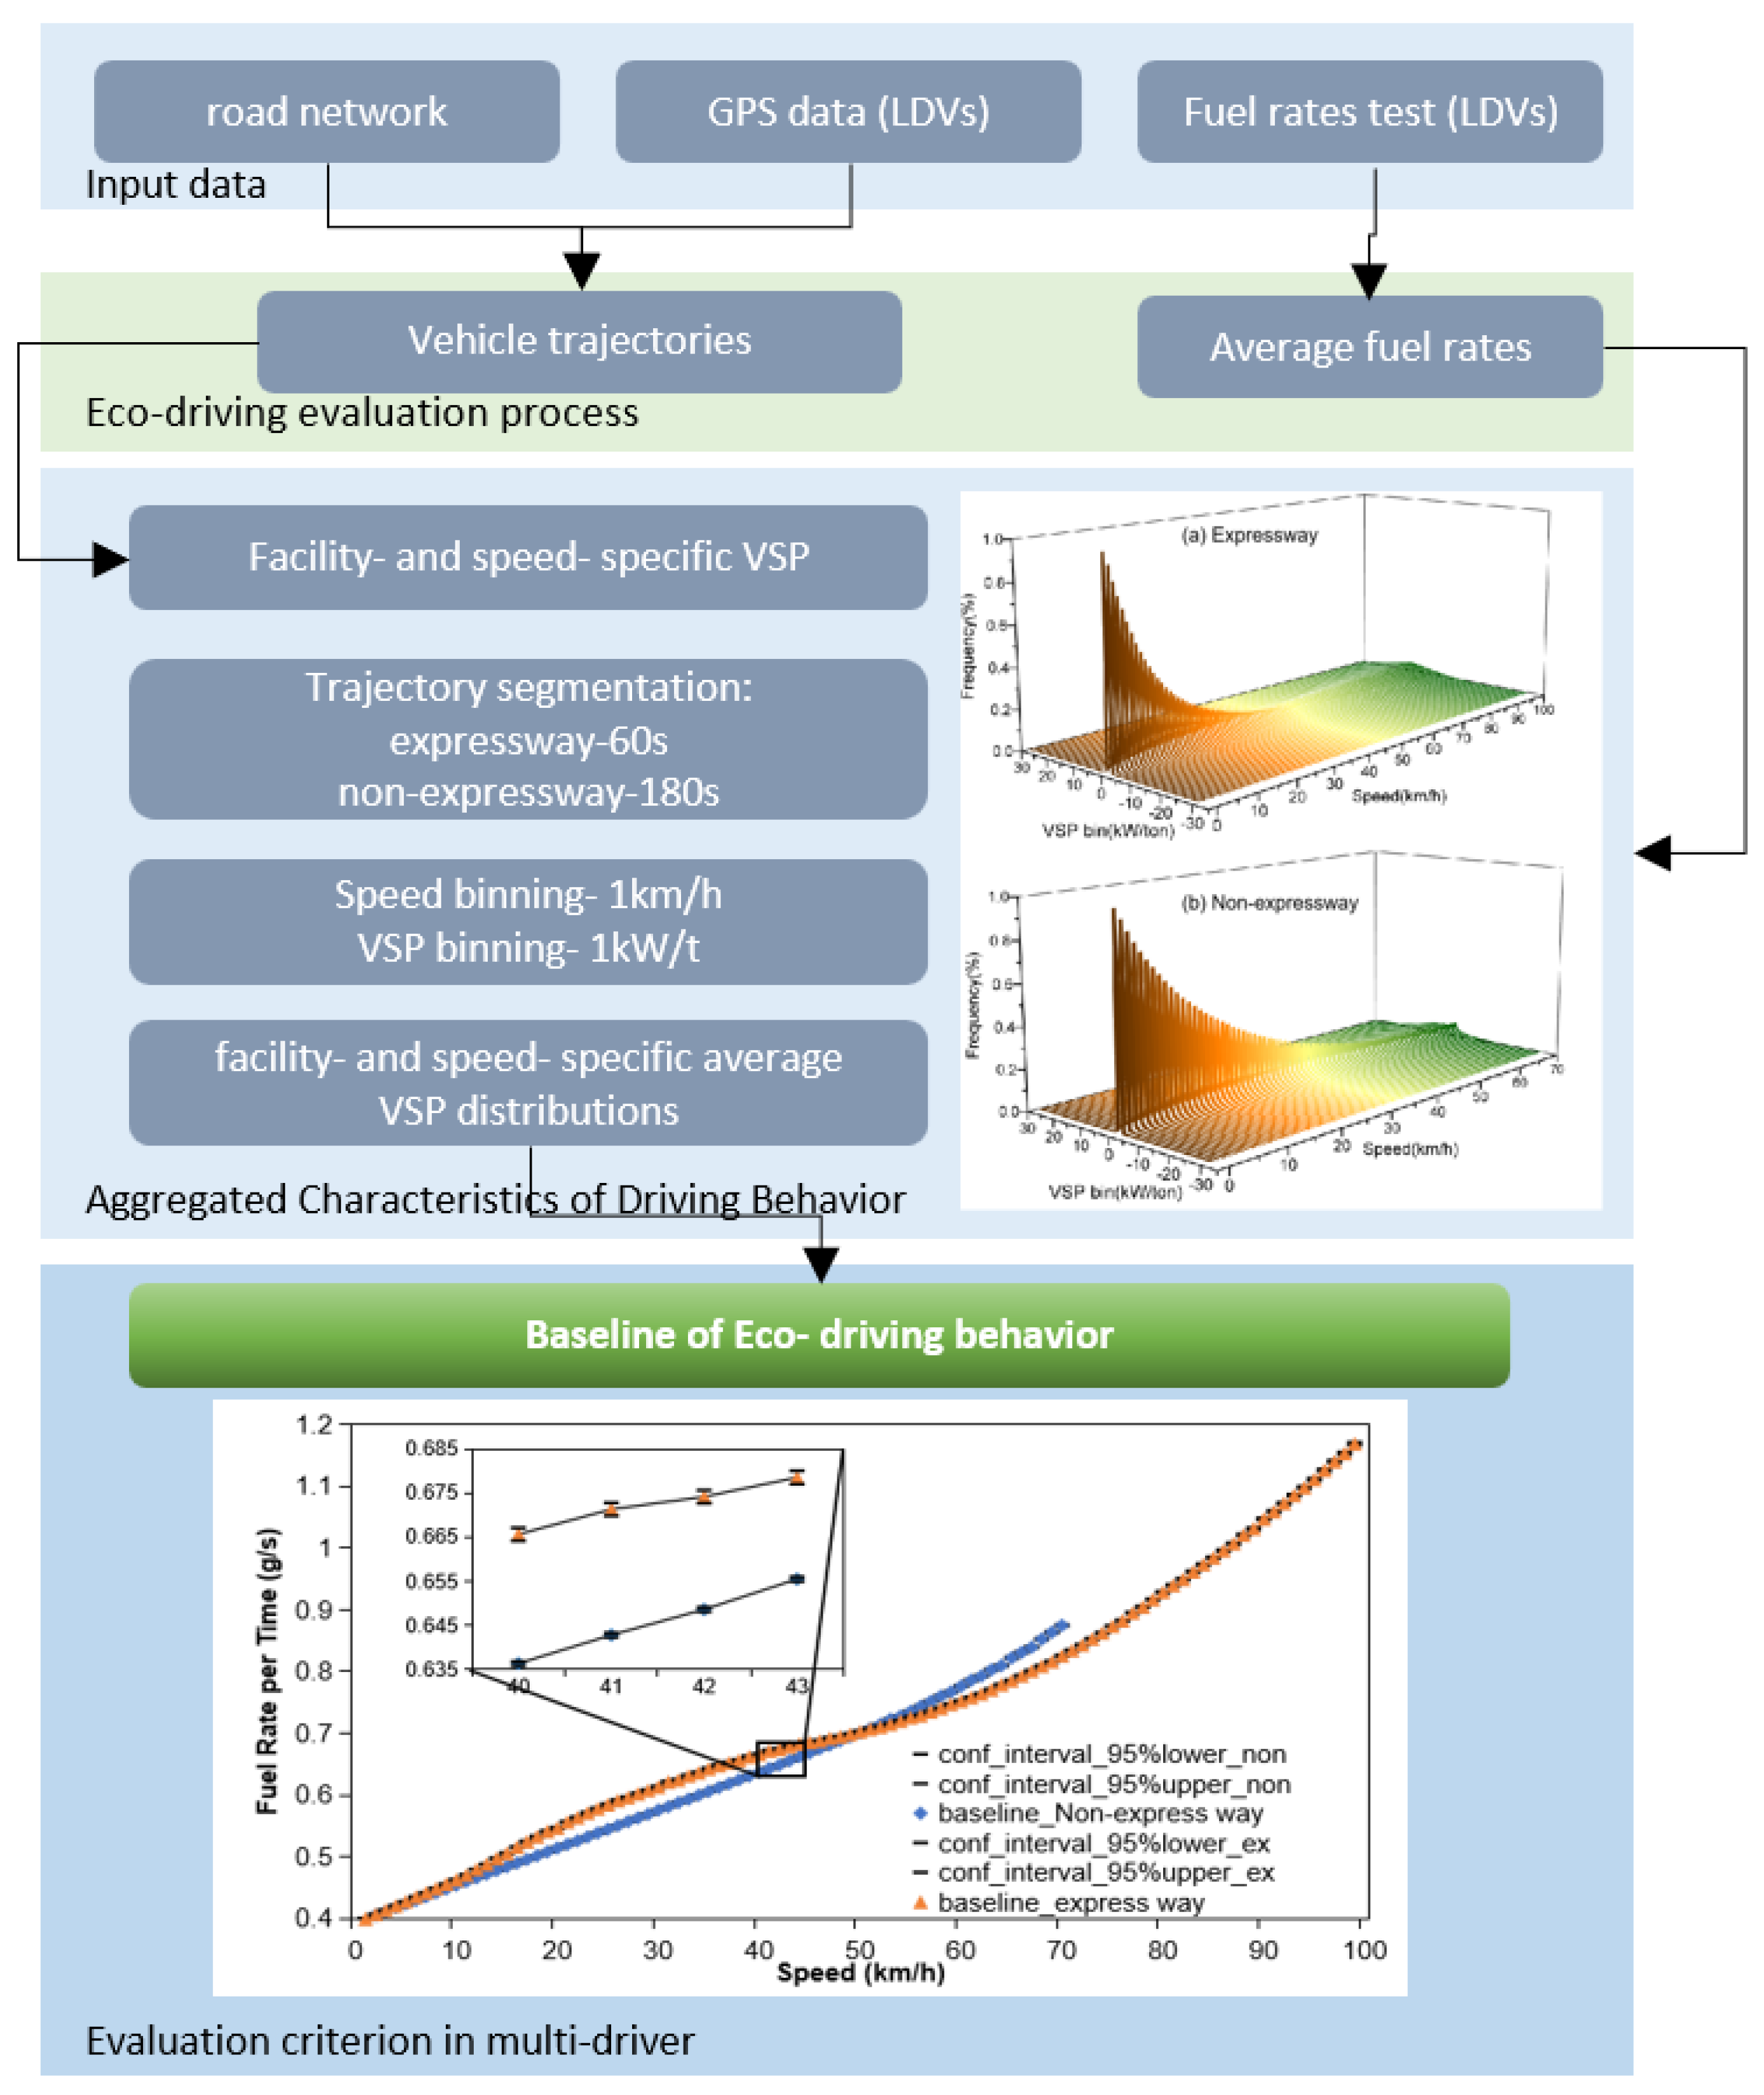
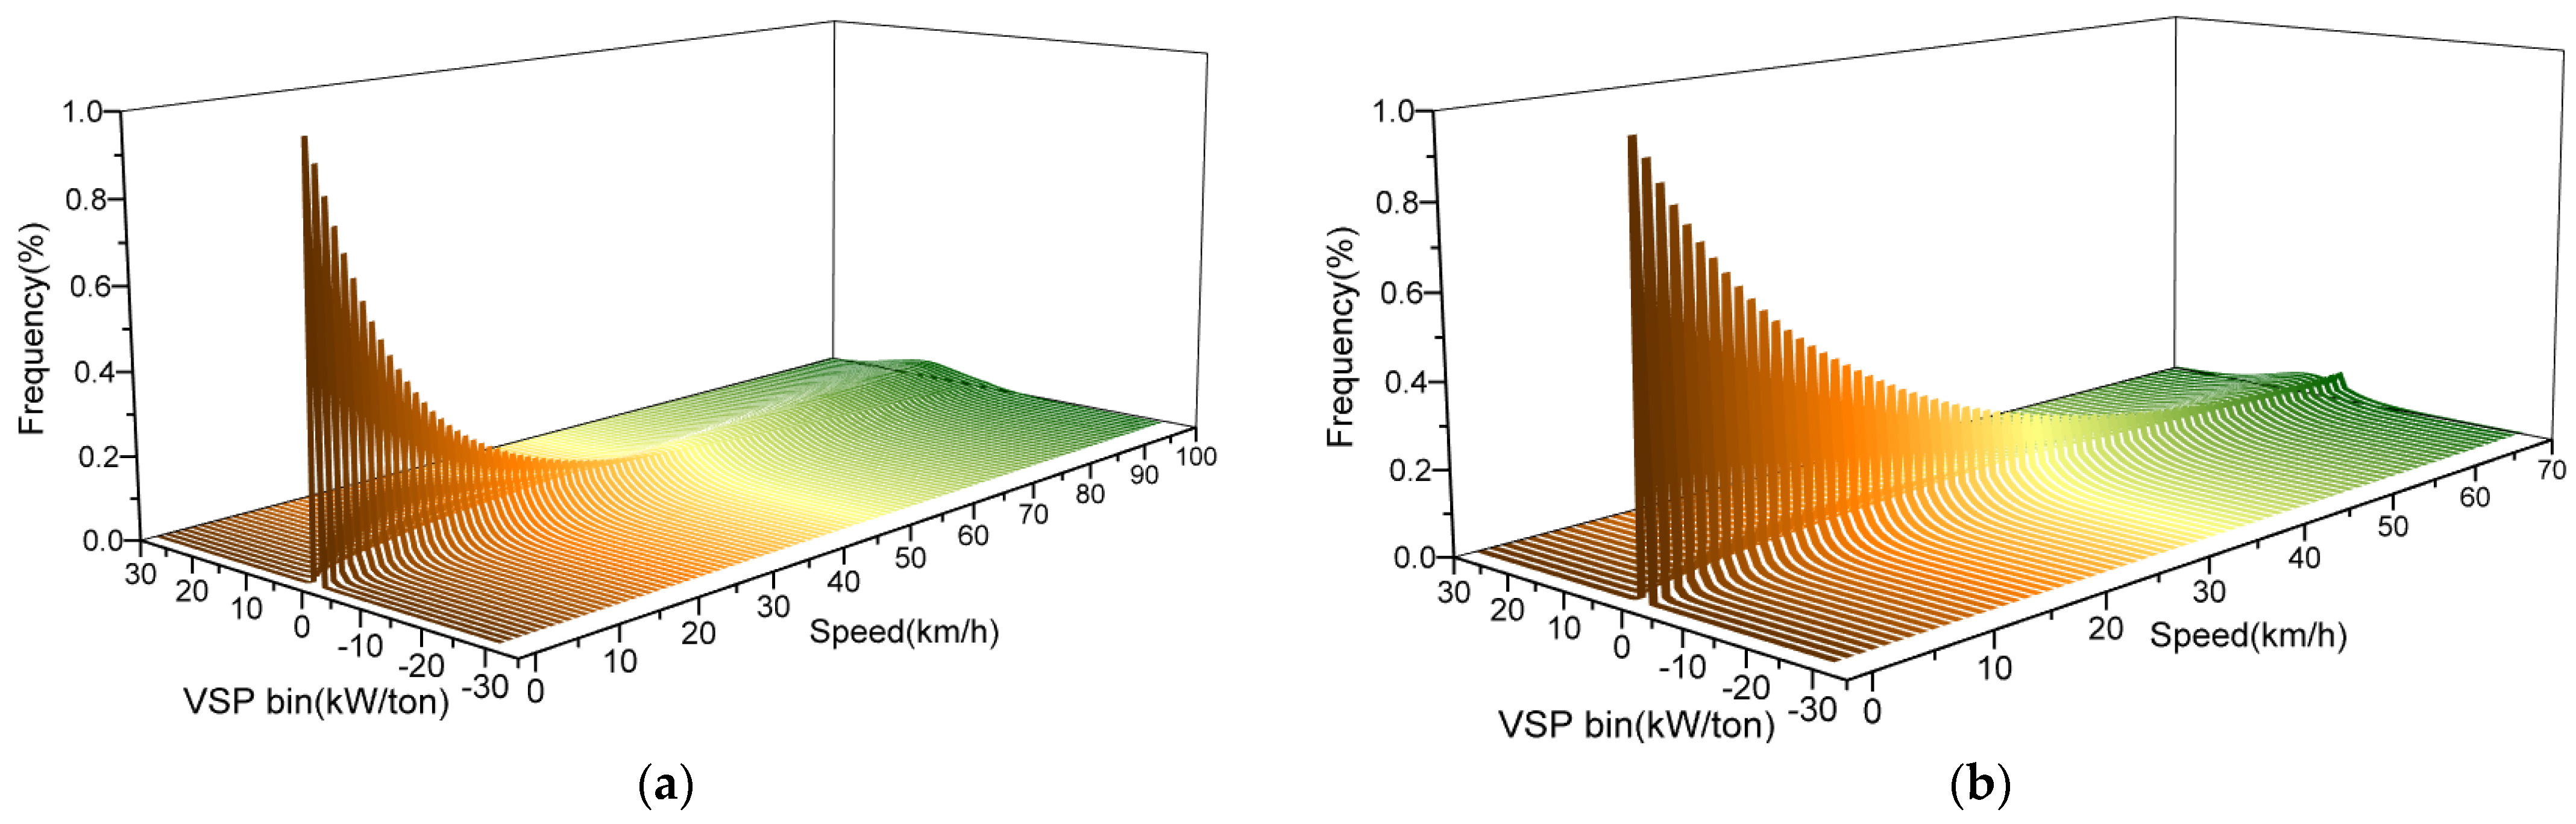
2.2.1. Aggregated Characteristics of Driving Behavior
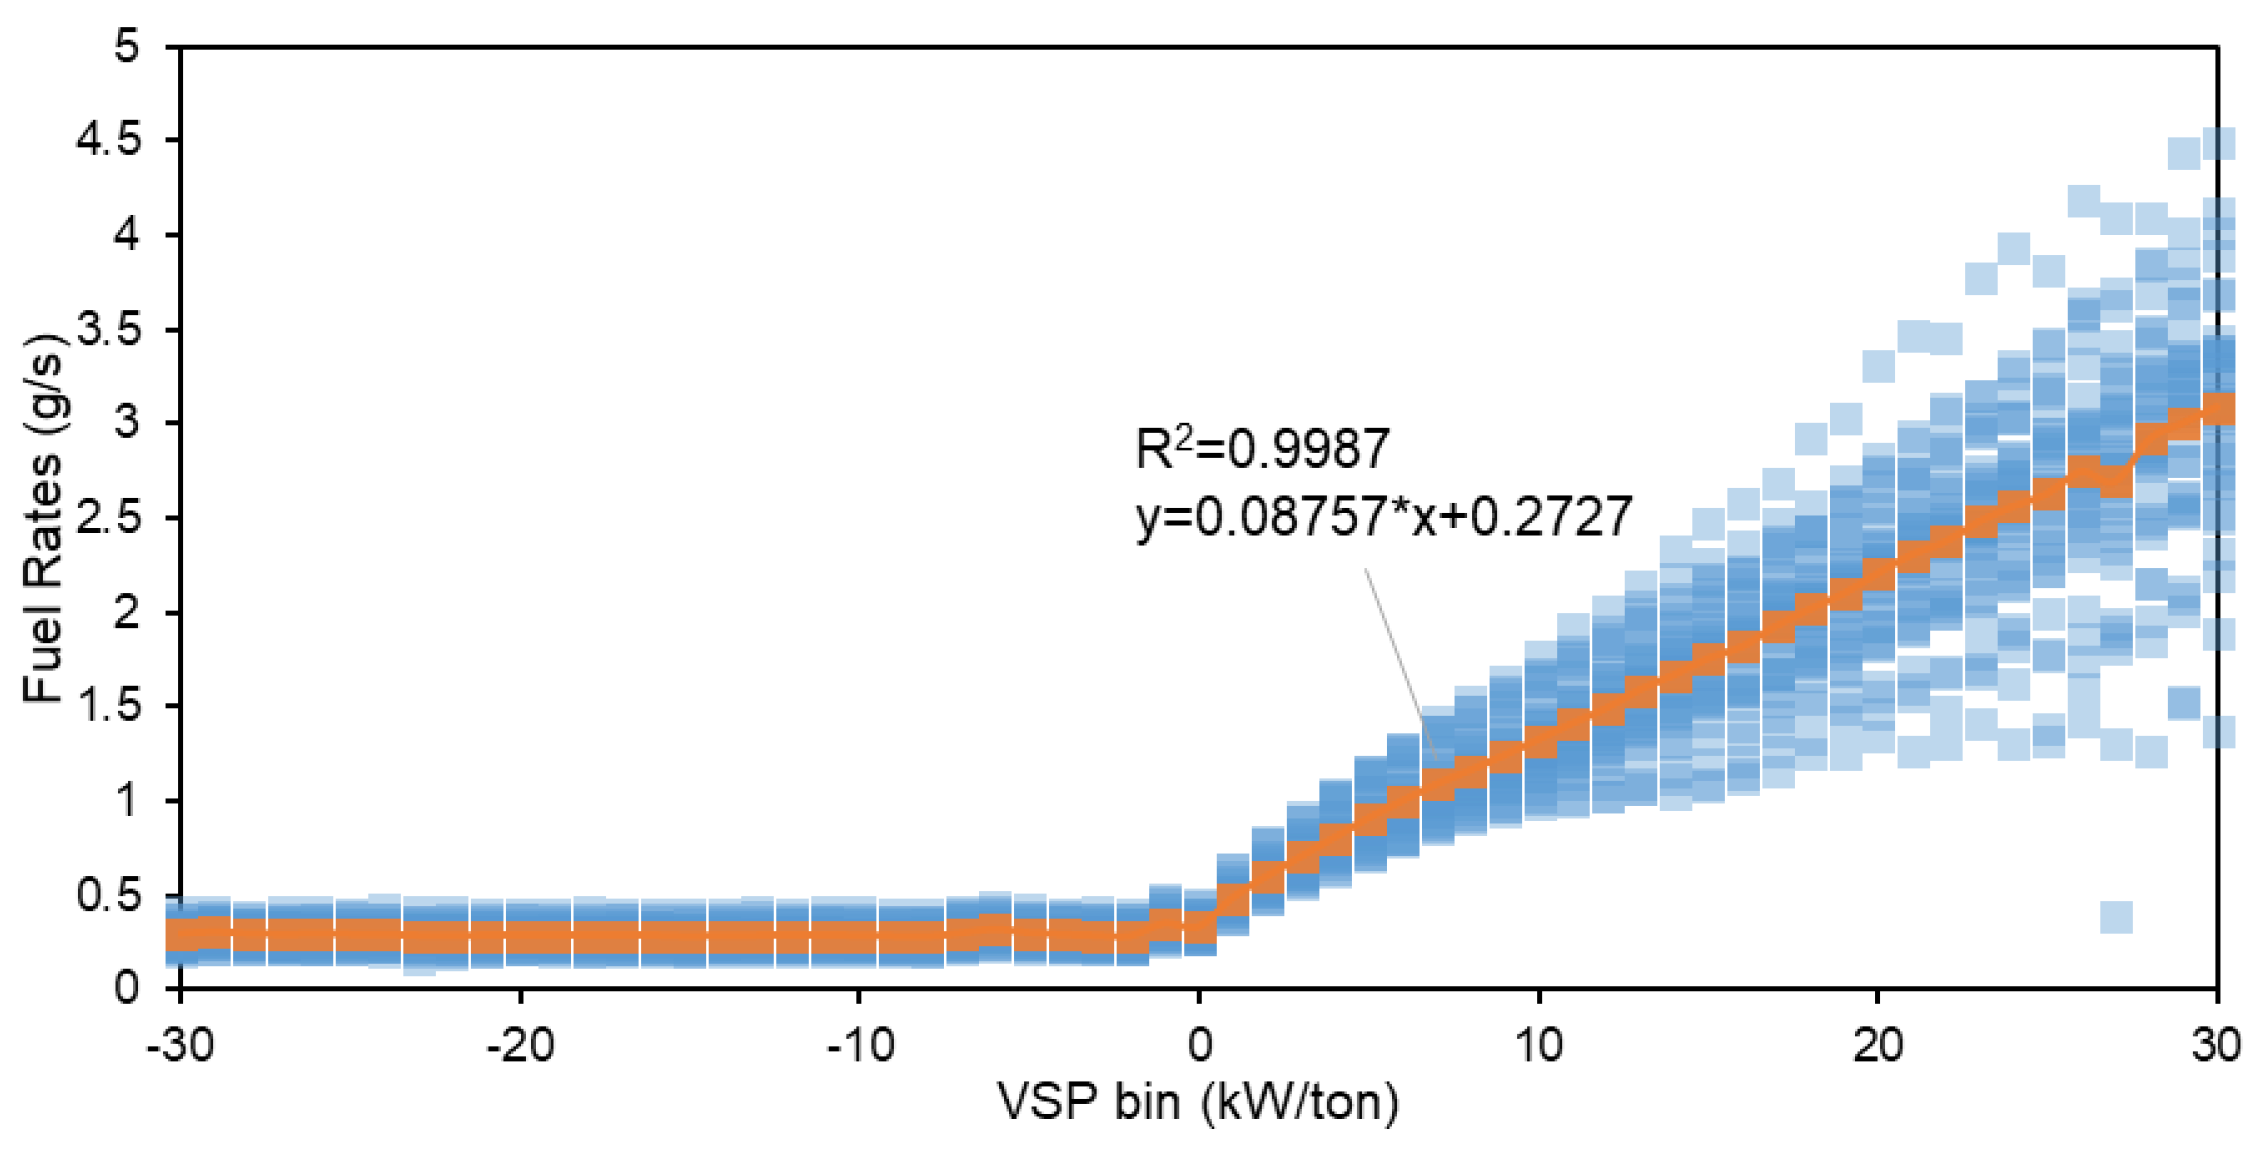
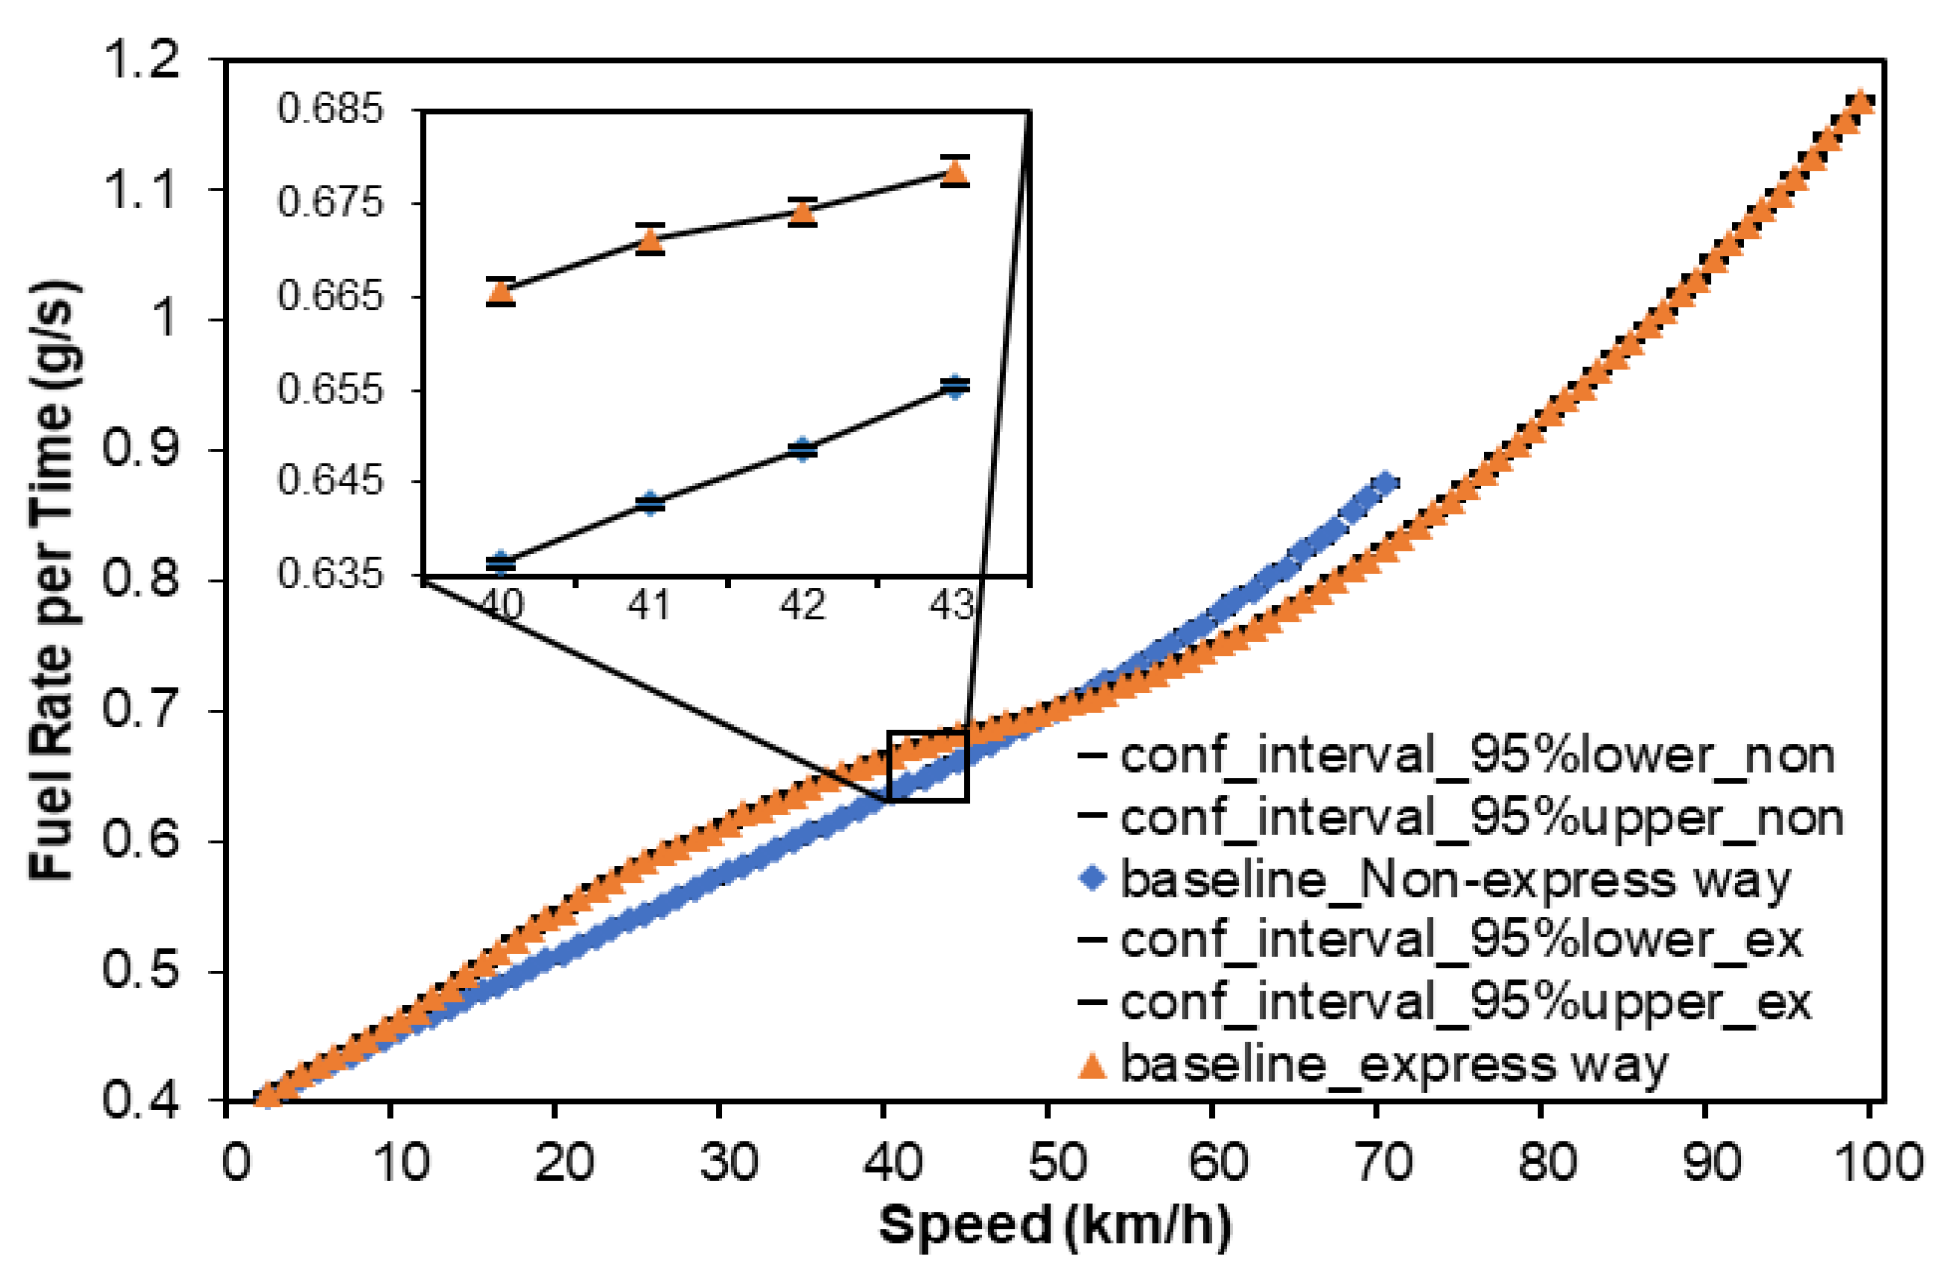
2.2.2. Baseline Fuel Consumption for Different Road Types
2.3. Comparative Analysis of Multi-Driver Behavior and Eco-Driving Levels in Different Cities
2.3.1. Comparison of Multi-Driver Driving Behavior
2.3.2. Comparison of Multi-City Eco-Driving Levels
- (1)
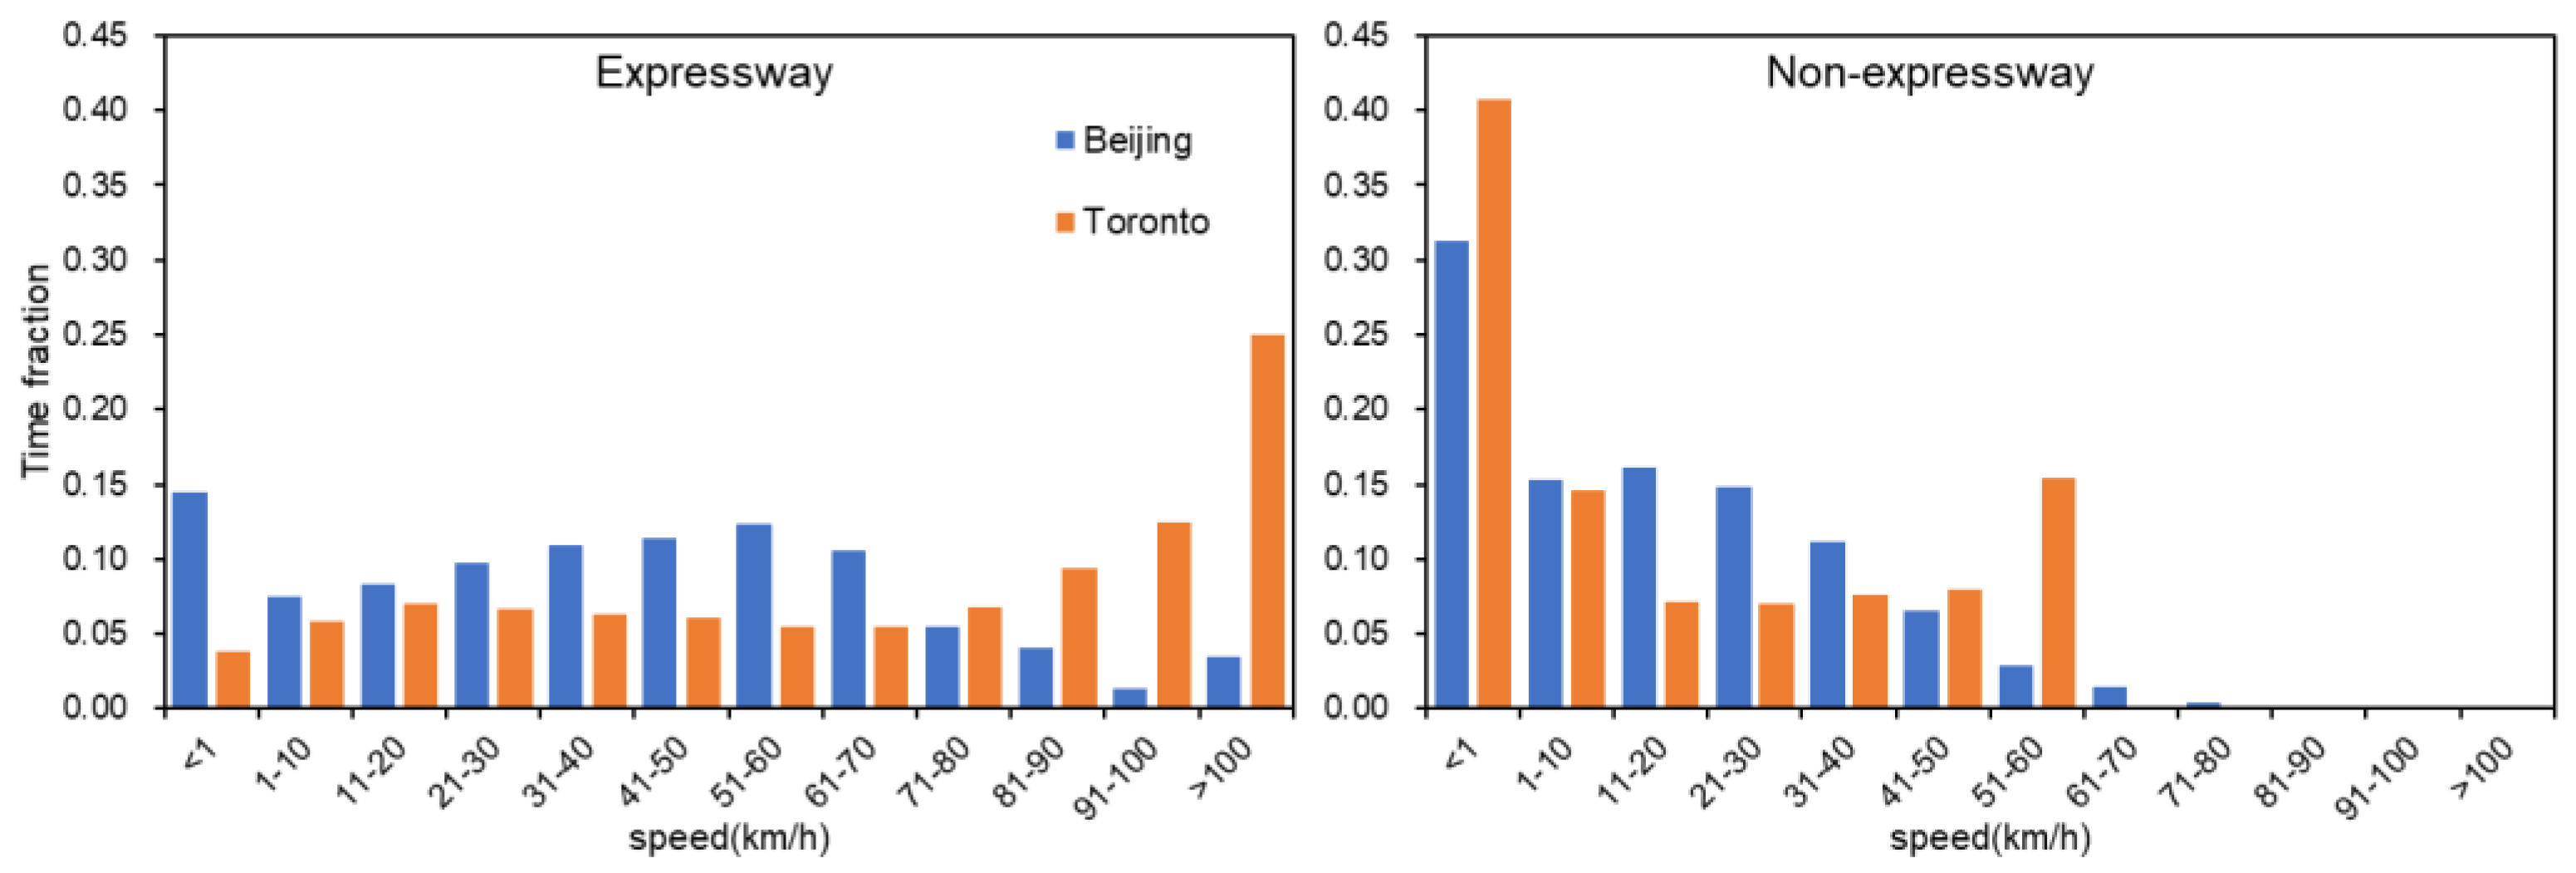
- Inter-city speed distribution analysis across road types:Speed bins were defined by segmenting average speed values into bins of 10 km/h, with a dedicated bin for speeds below 1 km/h. Time proportions within each speed bin were systematically quantified.
- (2)
- Acceleration distribution analysis under specific traffic scenarios:Short trip segments were stratified by 1 km/h average speed bins. Acceleration values were aggregated into 0.1 m/s2 intervals, with temporal proportions calculated for each speed-acceleration matrix cell.
- (3)
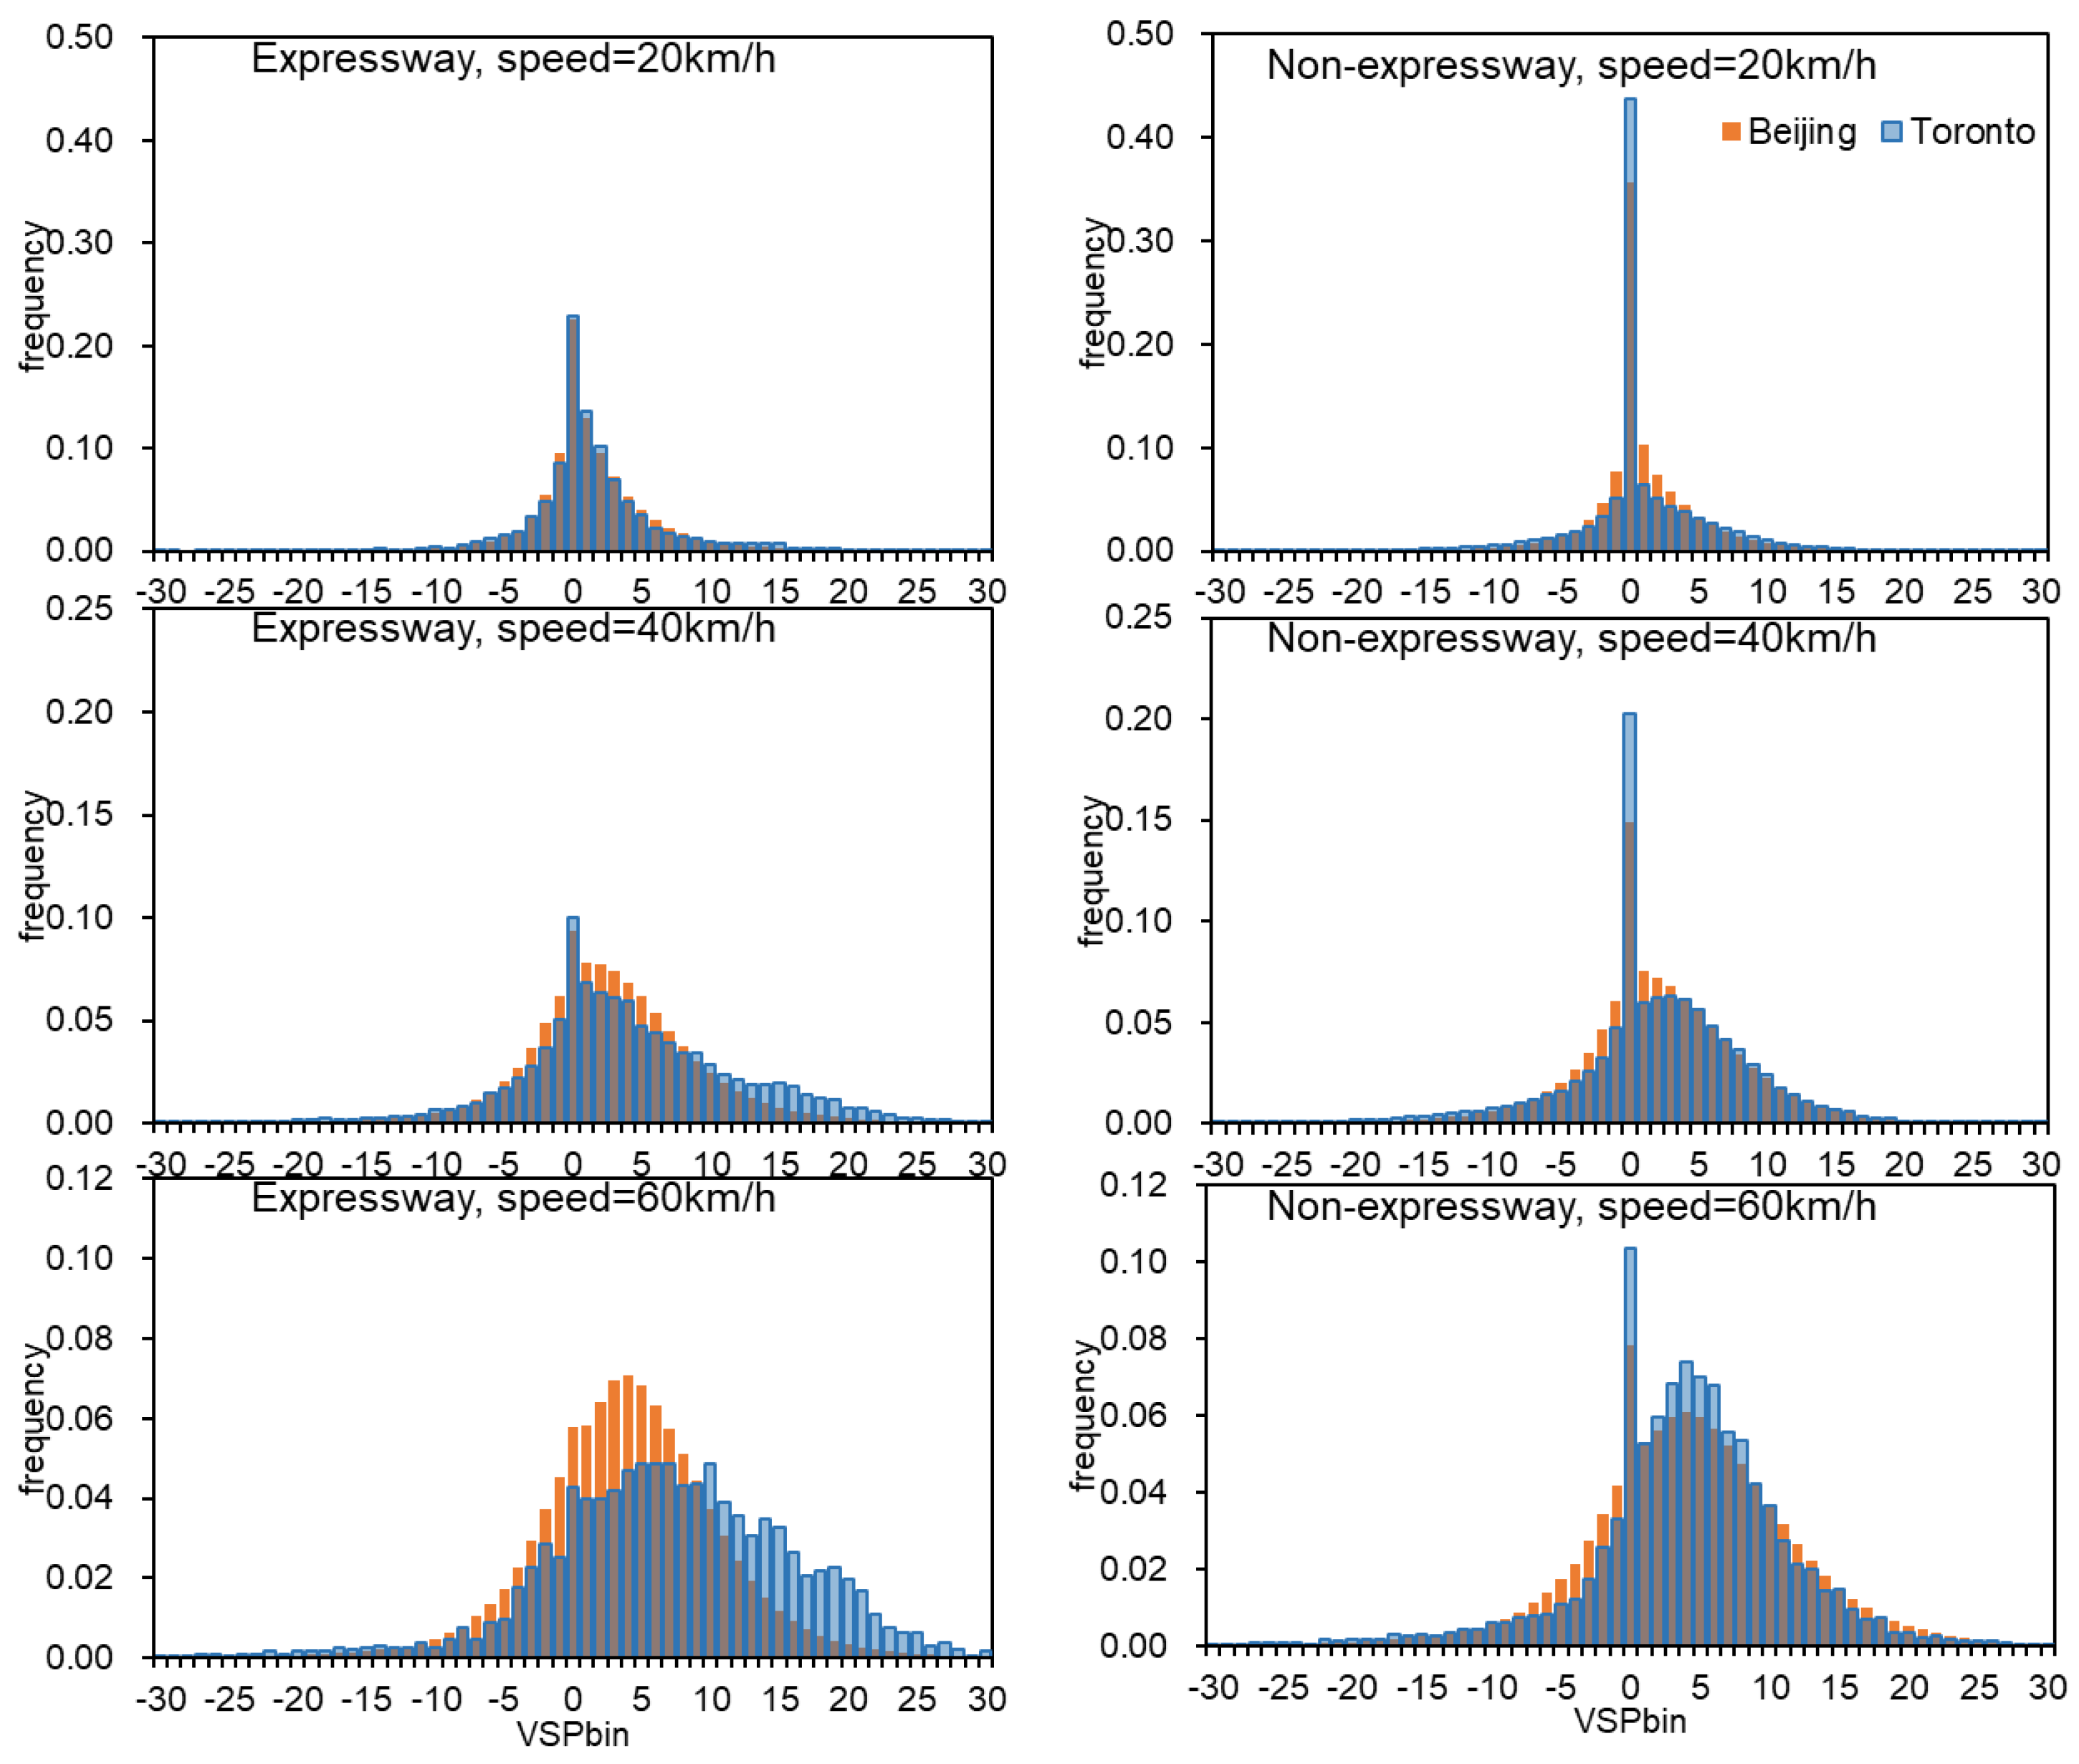
- Scenario-specific VSP distribution analysis:This analysis followed the same methodological framework as described in Point 2, ensuring methodological consistency across the parameters.
- (4)
- Hypothesis testing:In cases where only a limited data sample is available for certain cities, a brief comparison using a hypothesis testing approach becomes a viable option. Hypothesis testing is conducted on a dataset within a specific speed bin and for a specific facility, in comparison to a data-sufficient city dataset (e.g., Beijing). Taking Beijing as an example, the original hypothesis can be formulated as follows:
- ➢
- Z-Test
- ➢
- t-Test
3. Results
3.1. Distribution of VSP and Fuel Consumption Rates
3.2. Eco-Driving Baseline on Expressways and Non-Expressways in Beijing
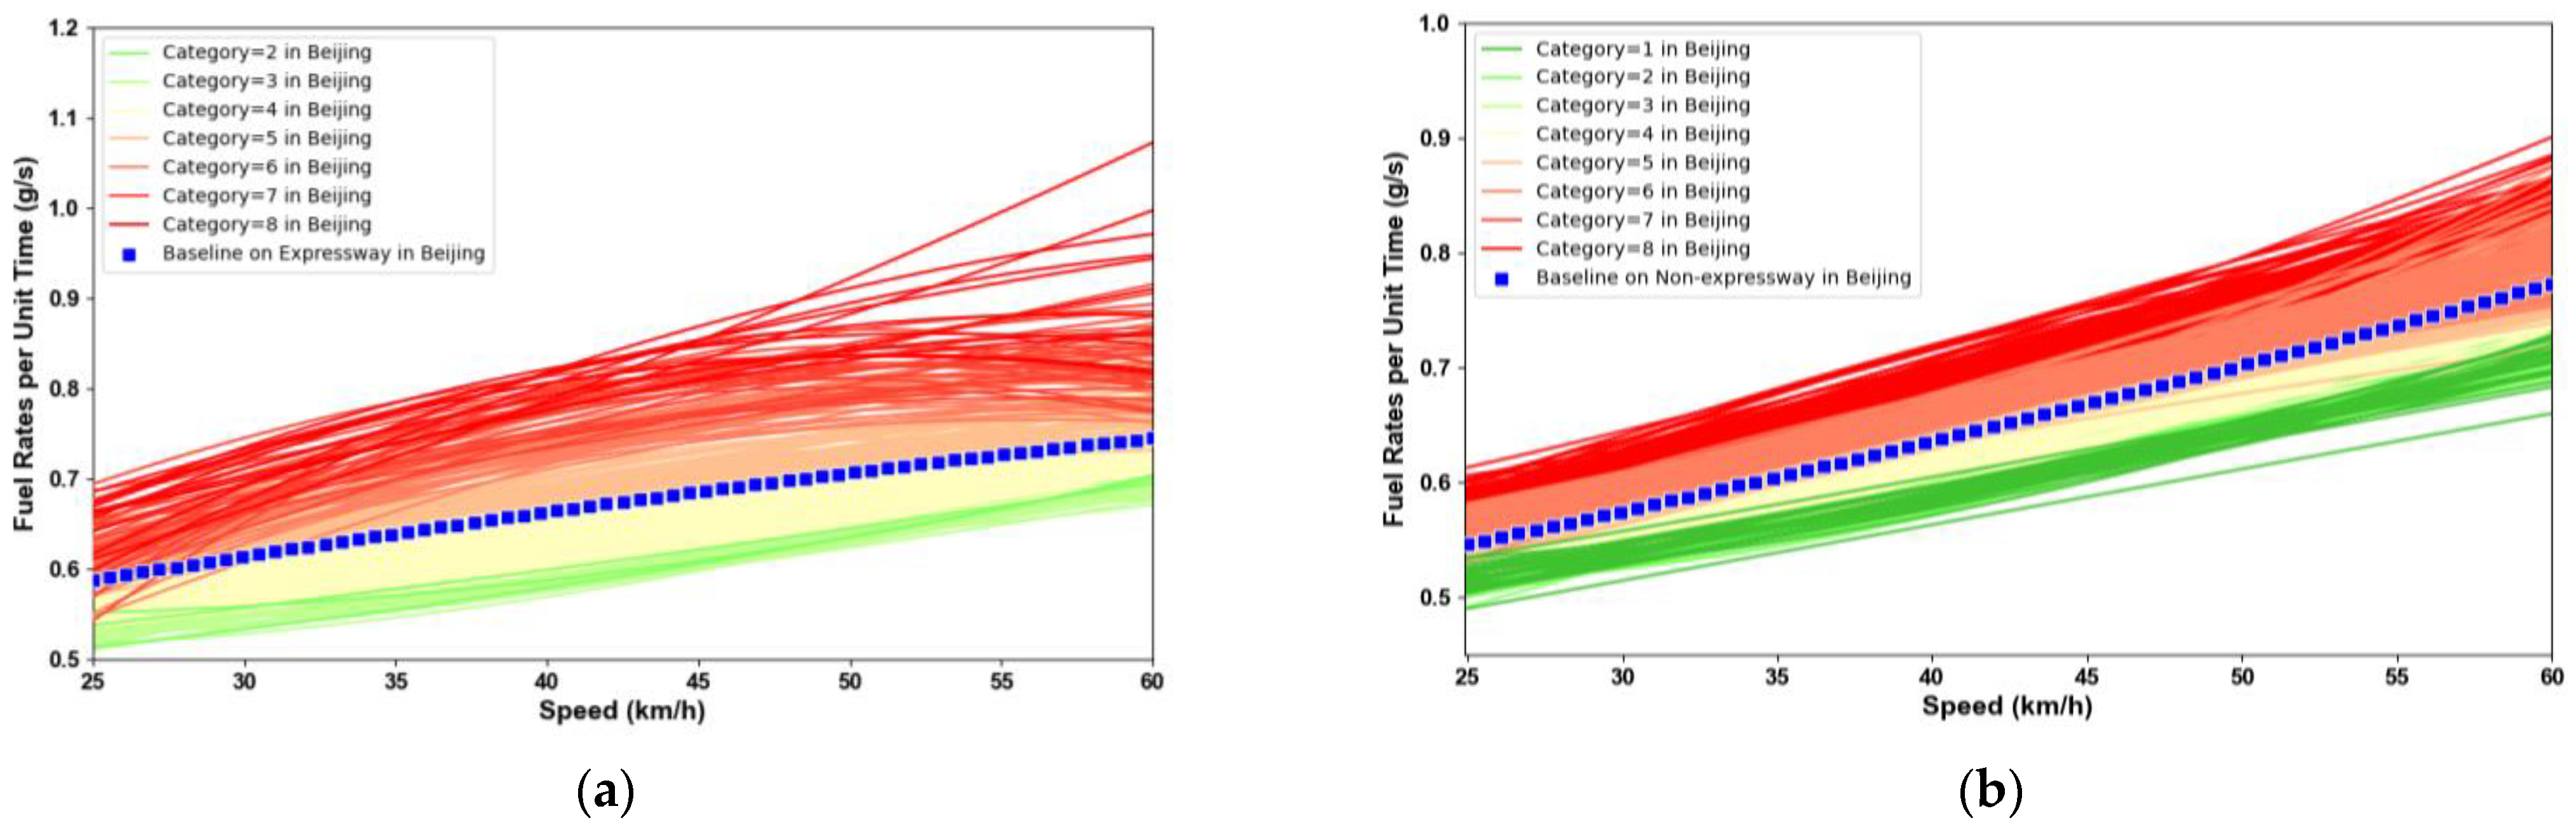
3.3. Applicability of Baseline Among Multi-Driver in Beijing
3.4. Applicability of Beijing’s Evaluation Baseline to Toronto
4. Discussion
4.1. Determining the Required Sample Size for Eco-Driving Evaluation Method
4.2. Comparative Analysis of Eco-Driving Parameters Between Beijing and Toronto
5. Conclusions
- The eco-driving baseline demonstrates stable differences between expressways and non-expressways. Specifically, the road type causes a maximum fluctuation of 6.38% in the eco-driving baseline (at average speed of 25 km/h), particularly evident in the speed range of 20–30 km/h.
- Direct application of the eco-driving evaluation parameters (baseline) from Beijing to Toronto is not appropriate, necessitating localized evaluation systems. The study reveals that Toronto drivers exhibit more aggressive driving behavior in the evaluated sensitive speed bins (25–60 km/h) compared to Beijing drivers. Statistical analysis at a significance level of 95% indicates significant differences in driving behavior between the two cities, with 93% of the speed bins showing discrepancies on expressways and 60% on non-expressways.
- To establish a robust ecological evaluation baseline for a new city, a minimum of 78 randomly collected effective trajectory data from 78 drivers, each contributing more than 45,000 s, is required. This sample size ensures a baseline error of below 5%, providing a reliable foundation for localized light-duty vehicle eco-driving evaluation. These thresholds of establishing a robust baseline were statistically validated through cross-city comparisons, accommodating infrastructure heterogeneity while maintaining robust across cities.
- Although the baseline derived from the expressways exhibits similar trends between Toronto and Beijing, Toronto’s values are significantly higher in the 20–80 km/h speed bins. This difference may be attributed to the competitive driving behavior displayed by Toronto drivers under certain traffic conditions. Conversely, Toronto and Beijing baselines exhibit similar trends and values on non-expressways.
Author Contributions
Funding
Institutional Review Board Statement
Informed Consent Statement
Data Availability Statement
Conflicts of Interest
References
- Tu, R.; Xu, J.; Li, T.; Chen, H. Effective and Acceptable Eco-Driving Guidance for Human-Driving Vehicles: A Review. Int. J. Environ. Res. Public Health 2022, 19, 7310. [Google Scholar] [CrossRef] [PubMed]
- Zang, J.; Song, G.; Wu, Y.; Yu, L. Method for Evaluating Eco-Driving Behaviors Based on Vehicle Specific Power Distributions. Transp. Res. Rec. 2019, 2673, 409–419. [Google Scholar] [CrossRef]
- Chada, S.K.; Görges, D.; Ebert, A.; Teutsch, R.; Subramanya, S.P. Evaluation of the Driving Performance and User Acceptance of a Predictive Eco-Driving Assistance System for Electric Vehicles. Transp. Res. Part C Emerg. Technol. 2023, 153, 104193. [Google Scholar] [CrossRef]
- Liu, C.; Zhao, X.; Yao, Y. Comprehensive Evaluation of Eco-Driving Behavior under Three Road Conditions Based on Driving Simulator. In Proceedings of the CICTP 2019: Transportation in China—Connecting the World, Nanjing, China, 6–9 July 2019; pp. 3914–3926. [Google Scholar]
- Zhang, X.; Zhang, T.; Zou, Y.; Du, G.; Guo, N. Predictive Eco-Driving Application Considering Real-World Traffic Flow. IEEE Access 2020, 8, 82187–82200. [Google Scholar] [CrossRef]
- Zhao, J.; Chang, C.F.; Rajkumar, R.; Gonder, J. Corroborative Evaluation of the Real-World Energy Saving Potentials of InfoRich Eco-Autonomous Driving (iREAD) System. In Proceedings of the WCX SAE World Congress Experience, Detroit, MI, USA, 14–16 April 2020; p. 2020–01–0588. [Google Scholar]
- Pozueco, L.; Tuero, A.G.; Paneda, A.G.; Paneda, X.G.; Melendi, D.; Garcia, R.; Diaz Orueta, G.; Rionda, A. Analytic System to Evaluate Efficient Driving Programs in Professional Fleets. IEEE Trans. Intell. Transport. Syst. 2019, 20, 1099–1111. [Google Scholar] [CrossRef]
- Chen, C.; Zhao, X.; Yao, Y.; Zhang, Y.; Rong, J.; Liu, X. Driver’s Eco-Driving Behavior Evaluation Modeling Based on Driving Events. J. Adv. Transp. 2018, 2018, 9530470. [Google Scholar] [CrossRef]
- Xu, N.; Li, X.; Yue, F.; Jia, Y.; Liu, Q.; Zhao, D. An Eco-Driving Evaluation Method for Battery Electric Bus Drivers Using Low-Frequency Big Data. IEEE Trans. Intell. Transport. Syst. 2023, 24, 1–13. [Google Scholar] [CrossRef]
- Huang, Y.; Ng, E.C.Y.; Zhou, J.L.; Surawski, N.C.; Chan, E.F.C.; Hong, G. Eco-Driving Technology for Sustainable Road Transport: A Review. Renew. Sustain. Energy Rev. 2018, 93, 596–609. [Google Scholar] [CrossRef]
- Xu, J.; Tu, R.; Ahmed, U.; Amirjamshidi, G.; Hatzopoulou, M.; Roorda, M.J. An Eco-Score System Incorporating Driving Behavior, Vehicle Characteristics, and Traffic Conditions. Transp. Res. Part D Transp. Environ. 2021, 95, 102866. [Google Scholar] [CrossRef]
- Saboohi, Y.; Farzaneh, H. Model for Developing an Eco-Driving Strategy of a Passenger Vehicle Based on the Least Fuel Consumption. Appl. Energy 2009, 86, 1925–1932. [Google Scholar] [CrossRef]
- Zheng, J.; Wu, Y. Development of a Practical Method to Estimate the Eco-Level of Driver Performance. J. Adv. Transp. 2020, 2020, 1–11. [Google Scholar] [CrossRef]
- Zhang, L.; Zhu, Z.; Zhang, Z.; Song, G.; Zhai, Z.; Yu, L. An Improved Method for Evaluating Eco-Driving Behavior Based-on Speed-Specific Vehicle-Specific Power Distributions. Transp. Res. Part D Transp. Environ. 2022, 113, 103476. [Google Scholar] [CrossRef]
- Zhai, Z.; Xu, J.; Song, G.; Hatzopoulou, M. Comparative Analysis of Drive-Cycles, Speed Limit Violations, and Emissions in Two Cities: Toronto and Beijing. Sci. Total Environ. 2022, 811, 152323. [Google Scholar] [CrossRef] [PubMed]
- Ersan, Ö.; Üzümcüoğlu, Y.; Azık, D.; Fındık, G.; Kaçan, B.; Solmazer, G.; Özkan, T.; Lajunen, T.; Öz, B.; Pashkevich, A.; et al. Cross-Cultural Differences in Driver Aggression, Aberrant, and Positive Driver Behaviors. Transp. Res. Part F Traffic Psychol. Behav. 2020, 71, 88–97. [Google Scholar] [CrossRef]
- Li, C.; Yu, L.; Song, G. Improved Binning of Operating Modes in EPA Simulator Program for Transit Buses: Case Study in Beijing. Transp. Res. Rec. 2017, 2627, 57–66. [Google Scholar] [CrossRef]
- Li, C.; Yu, L.; He, W.; Cheng, Y.; Song, G. Development of Local Emissions Rate Model for Light-Duty Gasoline Vehicles: Beijing Field Data and Patterns of Emissions Rates in EPA Simulator. Transp. Res. Rec. 2017, 2627, 67–76. [Google Scholar] [CrossRef]
- Zhang, H.; Sun, J.; Tian, Y. The Impact of Socio-Demographic Characteristics and Driving Behaviors on Fuel Efficiency. Transp. Res. Part D Transp. Environ. 2020, 88, 102565. [Google Scholar] [CrossRef]
- Hussain, B.; Sato, H.; Miwa, T.; Morikawa, T. Influence of Personality Traits on Aberrant Driving Behaviors: A Comparison of Japanese, Chinese, and Vietnamese Drivers. J. Saf. Res. 2020, 75, 178–188. [Google Scholar] [CrossRef]
- Zhang, M.; Zhang, P.; Li, H. Characteristics and Evaluation Methods of Economic Transformation Performance of Resource-Based Cities: An Empirical Study of Northeast China. J. Nat. Resour. 2021, 36, 2051. [Google Scholar] [CrossRef]
- Sharif, R.A.; Pokharel, S. Smart City Dimensions and Associated Risks: Review of Literature. Sustain. Cities Soc. 2022, 77, 103542. [Google Scholar] [CrossRef]
- Iungman, T.; Cirach, M.; Marando, F.; Pereira Barboza, E.; Khomenko, S.; Masselot, P.; Quijal-Zamorano, M.; Mueller, N.; Gasparrini, A.; Urquiza, J.; et al. Cooling Cities through Urban Green Infrastructure: A Health Impact Assessment of European Cities. Lancet 2023, 401, 577–589. [Google Scholar] [CrossRef] [PubMed]
- Manzolli, J.A.; Trovão, J.P.; Henggeler Antunes, C. Scenario-Based Multi-Criteria Decision Analysis for Rapid Transit Systems Implementation in an Urban Context. eTransportation 2021, 7, 100101. [Google Scholar] [CrossRef]
- Zhai, Z.; Song, G.; Yu, L. How Much Vehicle Activity Data Is Needed to Develop Robust Vehicle Specific Power Distributions for Emission Estimates? A Case Study in Beijing. Transp. Res. Part D Transp. Environ. 2018, 65, 540–550. [Google Scholar] [CrossRef]
- Zhang, Z.; Song, G.; Zhai, Z.; Li, C.; Wu, Y. How Many Trajectories Are Needed to Develop Facility- and Speed-Specific Vehicle-Specific Power Distributions for Emission Estimation? Case Study in Beijing. Transp. Res. Rec. 2019, 2673, 779–790. [Google Scholar] [CrossRef]
- Faria, M.V. How Do Road Grade, Road Type and Driving Aggressiveness Impact Vehicle Fuel Consumption? Assessing Potential Fuel Savings in Lisbon, Portugal. Transp. Res. Part D Transp. Environ. 2019, 72, 14. [Google Scholar] [CrossRef]
- Fan, P.; Song, G.; Zhu, Z.; Wu, Y.; Zhai, Z.; Yu, L. Road Grade Estimation Based on Large-Scale Fuel Consumption Data of Connected Vehicles. Transp. Res. Part D Transp. Environ. 2022, 106, 103262. [Google Scholar] [CrossRef]
- Jiménez-Palacios, J.L. Understanding and Quantifying Motor Vehicle Emissions with Vehicle Specific Power and TILDAS Remote Sensing; Massachusetts Institute of Technology: Cambridge, MA, USA, 1999; p. 360. [Google Scholar]
- Song, G.; Yu, L.; Zhang, Y. Applicability of Traffic Microsimulation Models in Vehicle Emissions Estimates: Case Study of VISSIM. Transp. Res. Rec. 2012, 2270, 132–141. [Google Scholar] [CrossRef]
- Song, G.; Yu, L.; Wang, Z. Aggregate Fuel Consumption Model of Light-Duty Vehicles for Evaluating Effectiveness of Traffic Management Strategies on Fuels. J. Transp. Eng. 2009, 135, 611–618. [Google Scholar] [CrossRef]
- Piovesana, A.; Senior, G. How Small Is Big: Sample Size and Skewness. Assessment 2018, 25, 793–800. [Google Scholar] [CrossRef]
- Bridges, A.J.; Holler, K.A. How Many Is Enough? Determining Optimal Sample Sizes for Normative Studies in Pediatric Neuropsychology. Child Neuropsychol. 2007, 13, 528–538. [Google Scholar] [CrossRef]
- Kerner, B.S. Breakdown in Traffic Networks: Fundamentals of Transportation Science; Springer: Berlin/Heidelberg, Germany, 2017; ISBN 978-3-662-54471-6. [Google Scholar]


| Beijing | Toronto | |
|---|---|---|
| Time span | June 2018 and June 2019 | March through July 2018 |
| Driver size | 19,779 | 82 |
| Sample size | More than 6 billion records | More than 30 million records |
| Sampling frequency | 1 Hz | 1 Hz |
| Make | Model | Version | Model Year | Displacement |
|---|---|---|---|---|
| Audi | A6L | 230320 | 2014 | 2.0T |
| Honda | CR-V | 0H2021F | 2017 | 1.5T |
| Odyssey | 0H3011H | 2015 | 2.4L | |
| 0H3011U | 2018 | 2.4L | ||
| Accord | 0H3082Y | 2015 | 2.0L | |
| Buick | GL8 | 0B2020W | 2014 | 2.4L |
| 0B2021R | 2015 | 2.4L | ||
| 0B2021Y | 2017 | 2.5L | ||
| Envision | 0B2090S | 2017 | 2.0T | |
| Regal | 0B2030G | 2012 | 2.0L | |
| Lacrosse | 0B2040V | 2013 | 2.4L | |
| Dodge | Caliber | 0U20703 | 2010 | 2.0L |
| Volkswagen | Magotan | 0X3050M | 2012 | 1.8T |
| 0X3050X | 2013 | 1.8T | ||
| Passat | 0X2072R | 2015 | 1.8T | |
| 0X2072S | 2015 | 1.8T | ||
| 0X2072T | 2015 | 1.8T | ||
| 0X20732 | 2016 | 1.8T | ||
| Toyota | RAV4Rongfang | 134010W | 2013 | 2.0L |
| Corolla | 1340406 | 2008 | 1.8L | |
| Camry | 132020E | 2010 | 2.0L | |
| Ford | Kuga | 1210706 | 2013 | 2.0T |
| Mazda | VI | 2O40118 | 2015 | 2.0L |
| Nissan | Liwei | 2X10¹⁰A | 2010 | 1.6L |
| Tiida | 2X10608 | 2011 | 1.6L | |
| Teana | 2X1080Q | 2013 | 2.0L | |
| 2X10829 | 2016 | 2.0L | ||
| Skoda | HaoruiSupeob | 361030H | 2012 | 1.8T |
| Hyundai | Beijingix35 | 3J1020O | 2013 | 2.0L |
| Langdong | 3J10308 | 2013 | 1.6L | |
| 3J10309 | 2013 | 1.6L | ||
| Chevrolet | Captiva | 3K10409 | 2014 | 2.4L |
| Changan | CS75 | 0L1060F | 2015 | 1.8T |
| Category | X | deltaFR | Description | Proportion | Average Fuel Consumption Increase | Range in Category |
|---|---|---|---|---|---|---|
| 1 | (−5.42, −3) | (−0.0486, −0.0339) | Very ecological | 0.14% | −8.96% | 2.29% |
| 2 | (−3, −2) | (−0.0339, −0.0213) | Very ecological | 2.28% | −5.83% | 4.27% |
| 3 | (−2, −1) | (−0.0213, −0.0092) | Ecological | 13.59% | −3.19% | 3.13% |
| 4 | (−1, 0) | (−0.0092, 0.0034) | Ordinary | 34.14% | −0.69% | 2.87% |
| 5 | (0, 1) | (0.0034, 0.0182) | Ordinary | 34.14% | 2.02% | 3.47% |
| 6 | (1, 2) | (0.0182, 0.0358) | Aggressive | 13.59% | 5.20% | 4.39% |
| 7 | (2, 3) | (0.0358, 0.0587) | Very aggressive | 2.28% | 9.00% | 5.44% |
| 8 | (3, max) | (0.0587, +∞) | Very aggressive | 0.14% | 13.95% | 8.07% |
| Total | (−5.42, max) | (−0.0486, +∞) | 100% |
| Average Speed (km/h) | 20 | 30 | 40 | 50 | 60 |
| Non-expressways | 23.65% | 21.82% | 15.62% | 12.71% | 16.42% |
| Expressways | 10.32% | 20.64% | 21.97% | 24.45% | 36.59% |
| Number of Sample Drivers (x=) | 10 | 30 | 50 | 60 | 70 | 75 | 78 | 80 | 100 | 400 |
| (Expressways) | 5% | 57% | 78% | 82% | 88% | 86% | 91% | 93% | 99% | 100% |
| (Non-Expressways) | 37% | 92% | 96% | 99% | 100% | 100% | 100% | 100% | 100% | 100% |
Disclaimer/Publisher’s Note: The statements, opinions and data contained in all publications are solely those of the individual author(s) and contributor(s) and not of MDPI and/or the editor(s). MDPI and/or the editor(s) disclaim responsibility for any injury to people or property resulting from any ideas, methods, instructions or products referred to in the content. |
© 2025 by the authors. Licensee MDPI, Basel, Switzerland. This article is an open access article distributed under the terms and conditions of the Creative Commons Attribution (CC BY) license (https://creativecommons.org/licenses/by/4.0/).
Share and Cite
Zhang, L.; Song, G.; Zhang, Z.; Zhai, Z.; Xu, J.; Fan, P.; Ding, Y. Can Eco-Driving Evaluation Cross Cities? Data Localization and Behavioral Heterogeneity from Beijing to Toronto. Sustainability 2025, 17, 3957. https://doi.org/10.3390/su17093957
Zhang L, Song G, Zhang Z, Zhai Z, Xu J, Fan P, Ding Y. Can Eco-Driving Evaluation Cross Cities? Data Localization and Behavioral Heterogeneity from Beijing to Toronto. Sustainability. 2025; 17(9):3957. https://doi.org/10.3390/su17093957
Chicago/Turabian StyleZhang, Leqi, Guohua Song, Zeyu Zhang, Zhiqiang Zhai, Junshi Xu, Pengfei Fan, and Yan Ding. 2025. "Can Eco-Driving Evaluation Cross Cities? Data Localization and Behavioral Heterogeneity from Beijing to Toronto" Sustainability 17, no. 9: 3957. https://doi.org/10.3390/su17093957
APA StyleZhang, L., Song, G., Zhang, Z., Zhai, Z., Xu, J., Fan, P., & Ding, Y. (2025). Can Eco-Driving Evaluation Cross Cities? Data Localization and Behavioral Heterogeneity from Beijing to Toronto. Sustainability, 17(9), 3957. https://doi.org/10.3390/su17093957