Article

Can Eco-Driving Evaluation Cross Cities? Data Localization and Behavioral Heterogeneity from Beijing to Toronto

by
Leqi Zhang
1,
Guohua Song
2,
Zeyu Zhang
3,
Zhiqiang Zhai
2,
Junshi Xu
4,
Pengfei Fan
2 and
Yan Ding
1,*
1
Vehicle Emission Control Center, Chinese Research Academy of Environmental Sciences, Beijing 100012, China
2
Key Laboratory of Transport Industry of Big Data Application Technologies for Comprehensive Transport, Beijing Jiaotong University, Beijing 100044, China
3
Department of Civil and Environmental Engineering, The Hong Kong Polytechnic University, Hong Kong 310028, China
4
Department of Civil & Mineral Engineering, University of Toronto, Toronto, ON M5S 1A1, Canada
*
Author to whom correspondence should be addressed.
Sustainability 2025, 17(9), 3957; https://doi.org/10.3390/su17093957
Submission received: 22 March 2025 / Revised: 22 April 2025 / Accepted: 24 April 2025 / Published: 28 April 2025
(This article belongs to the Special Issue Control of Traffic-Related Emissions to Improve Air Quality)

Abstract

The framework of eco-driving evaluation relying on vehicle trajectory data is to quantify the disparities of the fuel consumption for individual driving behavior and to develop a baseline under various traffic conditions. The baseline represents the typical driving behavior in a city, and it is a pivotal parameter for eco-driving evaluation. The applicability of the evaluation method in different cities is overlooked, encompassing the suitability of parameters and the minimum data required. This study aims to investigate whether the evaluation baseline developed with sufficient data can be applied to a new city. The results reveal that the baseline developed in Beijing cannot be directly transferred to the eco-driving evaluation in Toronto due to the significantly more aggressive and competitive driving behavior exhibited by Toronto drivers. This study further examines the minimum data sample size necessary to develop a robust evaluation baseline and proposes a localized method to construct the evaluation system for eco-driving evaluation in different cities.

1. Introduction

Eco-driving refers specifically to a set of driving behaviors that optimize fuel efficiency and minimize environmental impact. Unlike general driving behavior, which can include any manner of driving practices, eco-driving is defined by behaviors that are consciously adopted to reduce fuel consumption. This distinction is important because it focuses on environmentally beneficial actions rather than just evaluating driving habits [1]. The prerequisite for enhancing driving behavior lies in the precise evaluation of whether driving behavior is environmentally friendly, as the outcomes significantly impact the subsequent optimization of driving behavior and the reduction of energy consumption [2]. Therefore, researchers have always made efforts to improve the accuracy and expand the applications of eco-driving evaluation.
In terms of data accuracy, researchers using more realistic high-frequency data can reduce uncertainty. Simulation data and driving simulator data have provided controlled environments to study and refine eco-driving behaviors. However, it is important to note that simulation data and driving simulator data could not fully reflect real-world driving conditions due to the lack of variability and unpredictability present in actual driving scenarios [3,4]. Therefore, while these tools are valuable for preliminary assessments and controlled experiments, their findings may be validated with real-world data to ensure accuracy and applicability [5,6]. Benefiting from the advancements in intelligent connected vehicles, the acquisition of high-frequency trajectory data for motor vehicles has become more convenient. Researchers have proposed numerous eco-driving evaluation methods based on per-second trajectory data, including efficient and inefficient behavior pattern detection [7], driving event analysis [8], cumulative energy consumption assessment [9], fuel consumption measurement [2], and carbon emission estimation [10], among others.
The evaluation methodology framework involves comparing the fuel consumption or carbon emissions of a particular driver under different driving behaviors to derive a corresponding eco-score [11]. These algorithms encompass diverse models, including the multiple linear regression model predicated on driving events [8], the multivariate analysis model founded on optimal speed strategy [12], and the neural network-based model for fuel consumption estimation [13]. Additionally, there are models such as the weighted energy consumption cumulative model, which takes into account transportation and environmental conditions [9], among others. While all of these models improved the evaluation of eco-friendliness in driving behavior, they lacked a quantitative baseline for eco-driving evaluation. This limitation may contribute to variations in the evaluation results of eco-driving under complex traffic conditions. For instance, a driver’s behavior may exhibit high energy efficiency in one methodology but be evaluated as needing improvement in another. Zang et al. [2] and Zhang et al. [14] extracted a baseline based on speed-specific VSP (Vehicle-Specific Power) to reflect the average driving behavior during collection aera and to reduce the uncertainty in evaluation. Therefore, establishing clear boundaries and widely applicable baseline parameters is important in the evaluation of driving behavior.
Meanwhile, the evaluation methods face an additional challenge, which is as follows: determining whether the same eco-driving evaluation parameters can be universally applied across different cities. Furthermore, accessing the application of these methods requires careful consideration.
Researchers revealed significant fixed differences in driving behavior among cities, and these differences were also evident in driving characteristics, fuel consumption, and emissions. For example, Zhai et al. [15] identified distinct driving behavior, characteristics, and trip emissions between Beijing and Toronto. Similarly, Ersan et al. [16] explored significant variations in driver aggression and positive driver behavior among individuals from different countries, including Estonia, Greece, Kosovo, Russia, and Turkey. Li et al. [17,18] developed the Beijing local emission rates and operating modes in MOVES (Motor Vehicle Emission Simulator, proposed by EPA), and the emission estimates are closer to emission inventories provided by the government.
Consequently, the challenge of applying eco-driving evaluation methods, such as fuel consumption and energy consumption models, in different cities lies in the need to customize or localize the parameters, even for the same type of vehicle. The most important parameter in previously proposed evaluation methodologies is the average fuel consumption rate (baseline) at specific speeds and specific road types. The replicability of this parameter in other cities determines the applicability of the evaluation method and the comparison of eco-driving levels in different cities.
While various regions may exhibit differences in the road infrastructure or cultural norms, these serve as indirect factors contributing to differences in drivers’ eco-driving behavior. Factors such as road networks [19], driver attributes [20], and cultural distinctions may influence drivers’ speeds or driving states. However, many eco-driving evaluation methods have been successfully implemented within specific regions, yet there is a lack of research on their application across multiple cities or on a national scale. In contrast, other fields, such as economic transformation [21], smart city development [22], urban green infrastructure [23], and urban transit systems [24], have tailored their evaluation methods to different cities, ensuring broader applicability and relevance. This highlights a gap in eco-driving evaluation methods, which often lack the adaptability required for multi-city or national implementation.
In a previous study, Zhang et al. [14] proposed a method for extracting the evaluation baseline as a whole criterion, representing the average and typical driving behavior of the entire pool of drivers. The baseline represents the standard driving behavior reflected on fuel consumption rates, against which everyone can compare their eco-driving performance under similar traffic conditions to identify deviations. Building upon this foundational work, the present study aims to further investigate the applicability of the eco-driving evaluation method across different cities through expanded data collection and comprehensive analysis. This paper’s unbiased data collection of drivers’ driving trajectories in different regions is impartial to any specific attribute, providing a representative sample that is capable of reflecting the collective driving behaviors specific to that area. However, collecting vehicle trajectory data in many cities can be challenging, raising questions about whether the evaluation baseline from Beijing can be directly applicable with limited data. If direct application is unfeasible, the prospect of collecting the minimum amount of data required to establish a robust baseline of eco-driving evaluation in a new city becomes a crucial consideration for the applicability of this method.
Studies focusing on fuel consumption and emission estimation have highlighted in their future directions the necessity for collecting additional data to attain highly accurate results [2,17,25]. The question of how to gather the minimum amount of data required to decrease errors in fuel consumption estimation has been a matter of concern. Zhang et al. [26] examined the necessary quantity of trajectory data crucial for constructing facility-specific and speed-specific VSP distributions designed for an emissions estimation. However, the establishment of robust evaluation baselines that integrate cross-city traffic conditions; infrastructure heterogeneity and driver behavior variability, which remain unaddressed; and the determination of the minimum amount of data required for establishing a stable baseline in eco-driving evaluation for a new city, which consists of a new road network and drivers, has been ignored. This serves as a critical factor in evaluating the method’s feasibility for widespread application in new urban settings.
Hence, it is necessary to establish a robust baseline to be effectively applied in diverse urban settings, and it is imperative to investigate the possibility of localizing eco-driving evaluation parameters based on multi-city data. Additionally, exploring the minimum amount of data needed for evaluation, using the sufficient data available in Beijing, can streamline the process of eco-driving evaluation in other cities and alleviate the burdensome workload of data collection. Such efforts are instrumental in facilitating horizontal comparisons of eco-driving levels among multiple cities and promoting eco-driving, and ultimately contributing to the reduction of energy consumption. This study contributes to the advancement of eco-driving initiatives across multiple cities by reducing data collection costs and fostering energy conservation and emission reduction. By focusing on behavior monitoring and change within urban communities, it aims to enhance sustainable transportation practices and promote greater urban resilience.

2. Materials and Methods

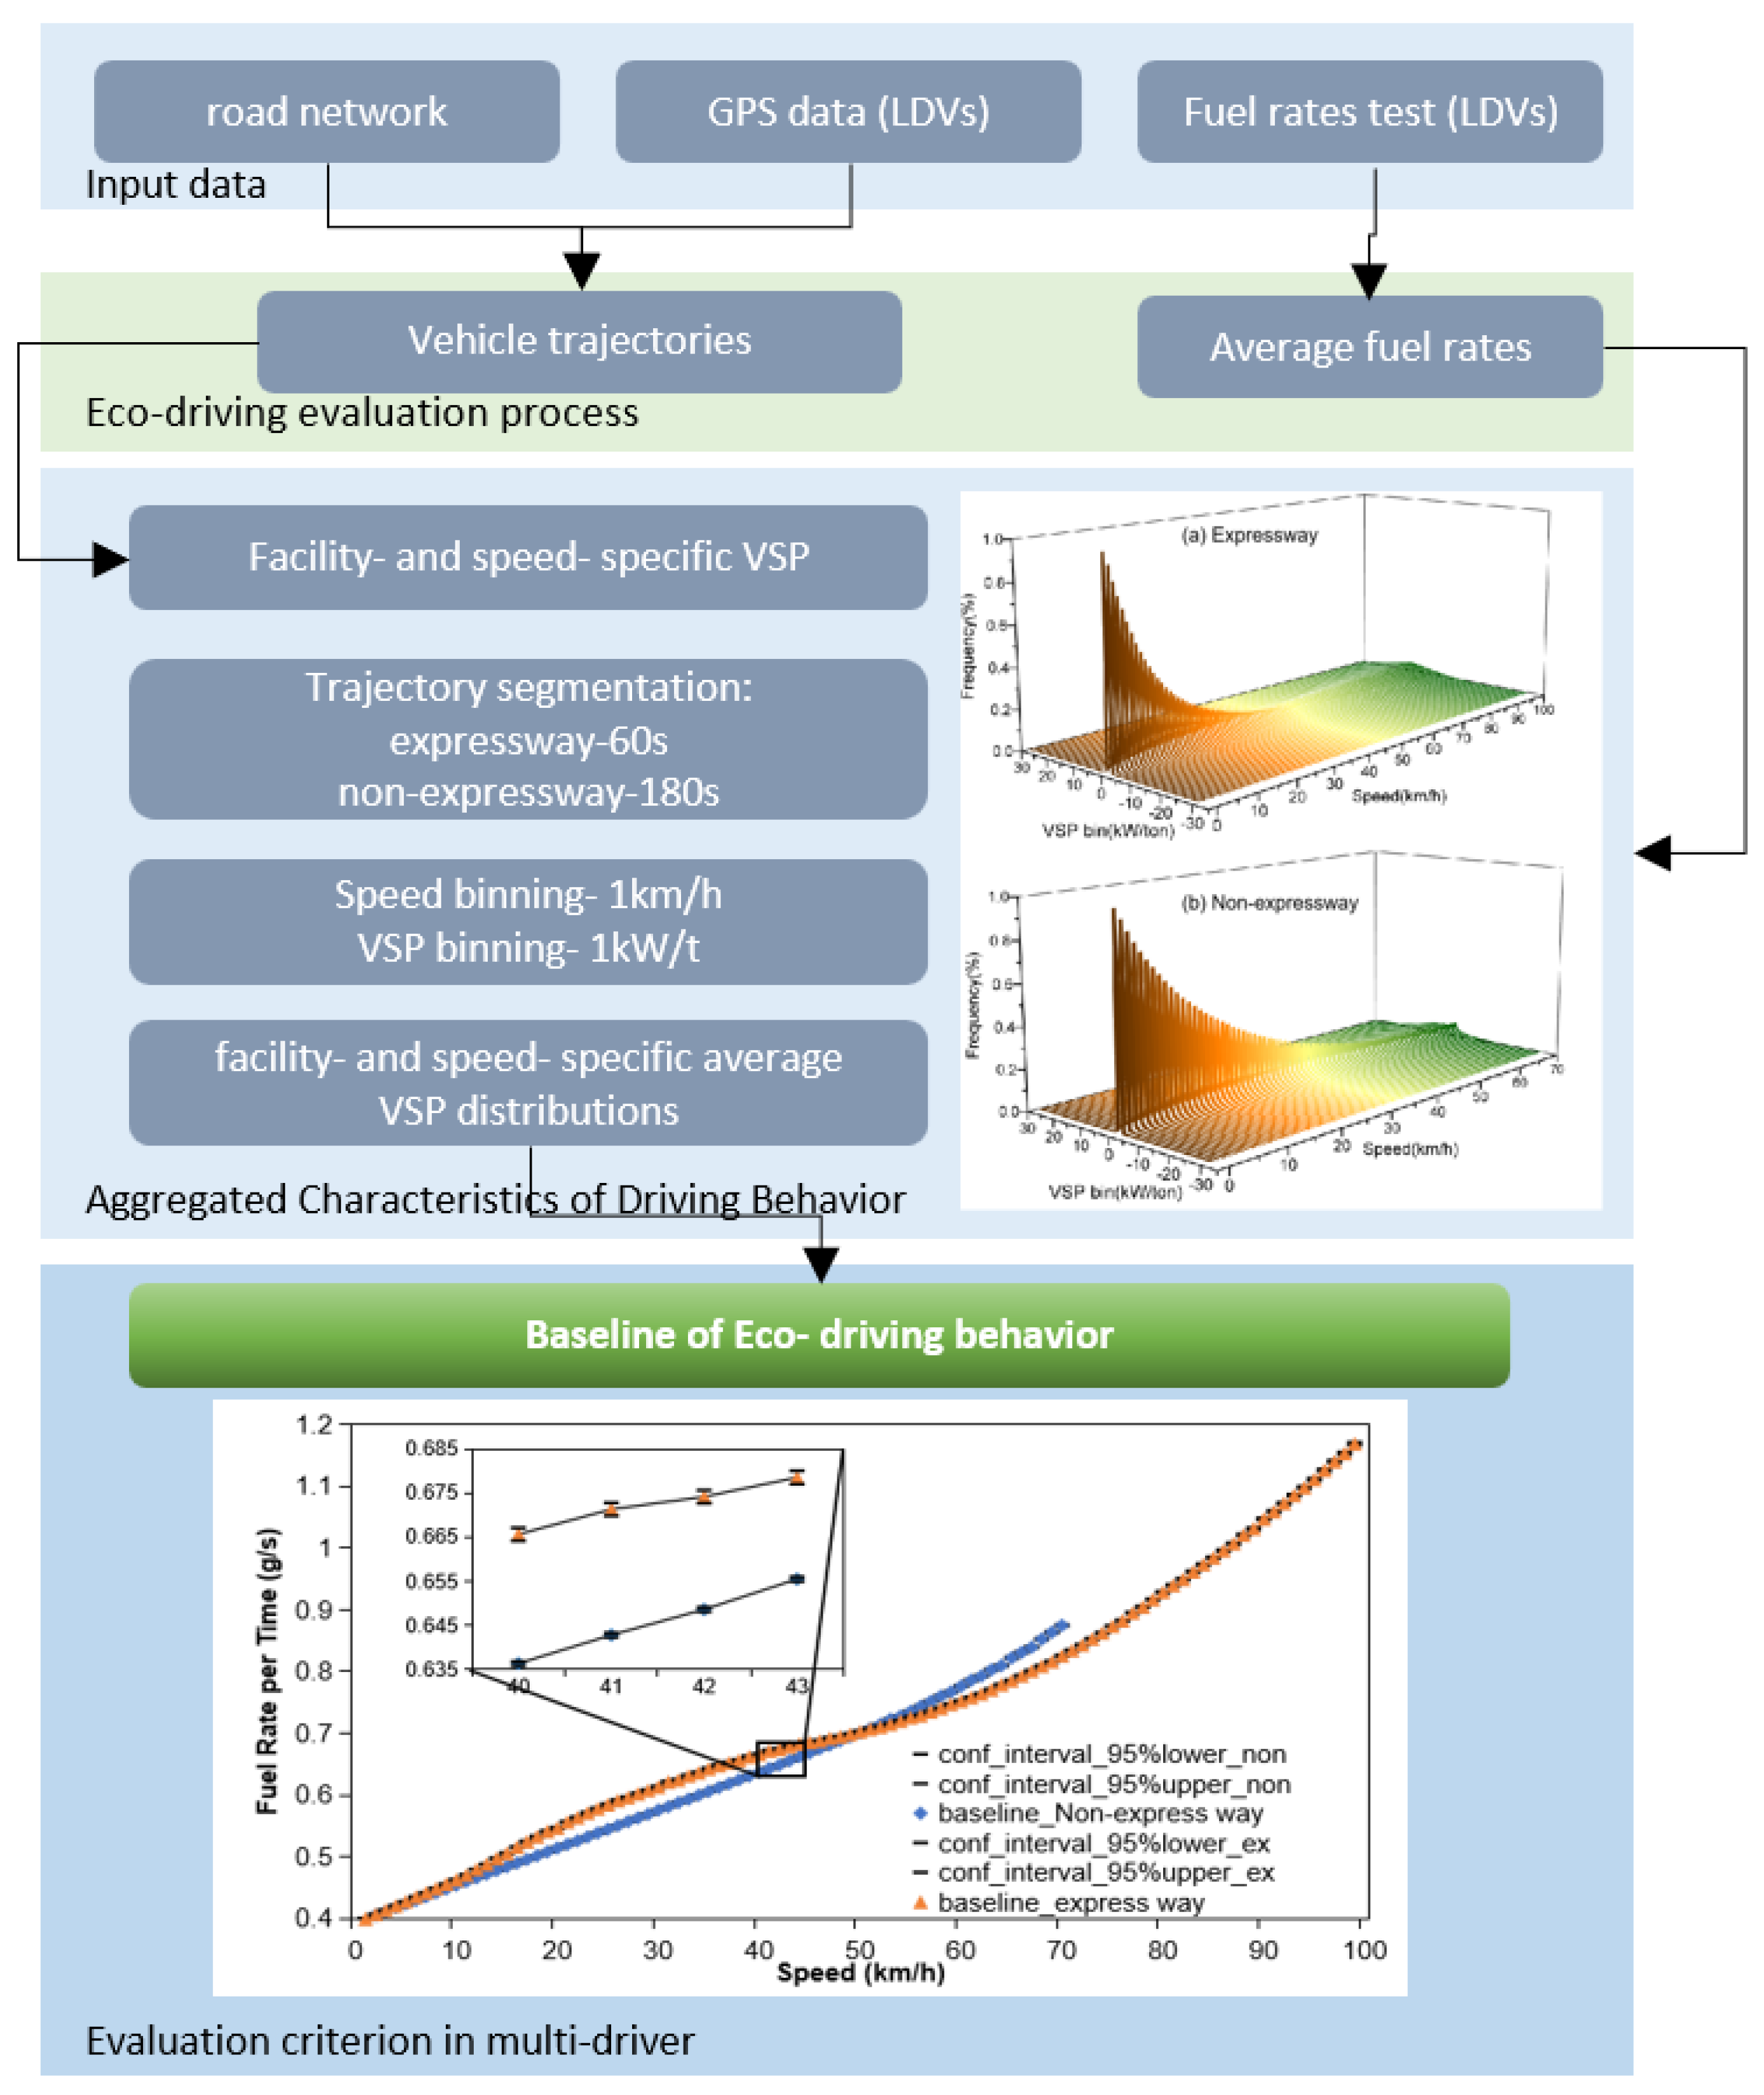
This section describes the data collection and steps to establish the evaluation methods. The study collects vehicle trajectory data, road network data, and fuel rate test data in Beijing and Toronto. The eco-driving evaluation baseline based on specific traffic conditions is proposed according to trajectory data in Beijing. The same baseline has been validated as not applicable to Toronto, based on hypothesis testing and driving behavior analysis. Finally, an error analysis using repeated Monte Carlo sampling is conducted to answer the question of at least how much data is needed to establish a robust baseline in a new city. The framework is shown in Figure 1.

2.1. Data Sources

2.1.1. Vehicle Trajectory Data

The evaluation method employed in this study is based on operational data collected from 19,779 light-duty vehicles on a per-second basis in June 2018 and June 2019 in Beijing. Originating from the vehicle energy consumption and emission monitoring platform, this data was developed by the Chinese government. Prior to data collection, informed consent was obtained from each driver, and the data collected did not contain any privacy information. The vehicle trajectories cover more than 99% of the roads in Beijing, as the number of records and drivers collected is sufficient.
Furthermore, the study also utilized data from 82 Toronto drivers (from March through July 2018), which were collected by Zhai et al. [15]. The Toronto GPS data were acquired by soliciting drivers through advertisements, utilizing channels such as a public mailing list. Volunteers were selected with a predetermined quota to ensure sufficient representation based on home location and driver experience.
Figure 2a shows the trajectory information of three randomly selected drivers in Beijing and Figure 2b shows the data in Toronto. Table 1 shows the trajectory data details in Beijing and Toronto.
Trajectory data may be unavailable on obscured roads (e.g., location deviation or abnormal speed of location points, etc.), and we conduct rigorous quality assurance on the collected trajectory data to guarantee the precision of subsequent driving behavior analysis. The data filtering steps include data cleaning, continuity check, map matching, gap interpolation, and a validity check, described as follows:
Step 1 No trips less than 100 m are collected in the dataset.
Step 2 Check the necessary fields contained in each data point.
Step 3 Remove long stop data points (with no speed and no position change for more than 10 min).
Step 4 Match GPS data with map data to obtain information about the road where the record is located.
Step 5 Ensure that vehicle speed, acceleration, and VSP are within normal limits. Smooth outlier points using Kalman filtering.
After data quality control, 19,779 vehicles, in 5,229,511 trips and 6,306,514,276 s-by-second records in Beijing are used for subsequent analysis of driving behavior, and 82 vehicles, 1142 trips, and a total of 3,695,338 data points are used in Toronto. Each record includes trip information (vehicle ID, trip ID), driving characteristics information (speed, acceleration, VSP), and geographic position information (longitude, latitude, road type, record time (unit in seconds)).

2.1.2. Map Data

Based on the GIS maps of the Beijing and Toronto road networks, the vehicle trajectory data is matched with the corresponding road type (expressway or non-expressway). The road type of each link is available in the map database. Figure 2 illustrates examples of the matched samples.
Take Beijing as an example, wherein the length of expressways constitutes 4.78% of the entire road network, but 5,229,511 of the driver trips, while the trip time on expressways accounts for 16.71% of the total trip time. Notably, Faria et al. [27] observed substantial variations in driving characteristics between expressways and non-expressways. Moreover, drivers exhibit distinct preferences for road types when choosing their routes.

2.1.3. Fuel Consumption Test Data

Second-by-second fuel consumption test data for real light-duty vehicles are essential. This study utilizes the fuel consumption database of light-duty vehicles collected by Fan et al. [28]. The dataset consists of 130 million records for 33 different light-duty vehicle types, collected via in-vehicle On-Board Diagnostics from June 2018 and June 2019. Vehicle makes, models, ages, and displacements can be found in the Table 2.

2.2. Development of Eco-Driving Evaluation Baseline

Based on the second-by-second trajectory data of the city, the following four steps are used to generate the baseline (Figure 3):
(1)
Calculating VSP values from second-by-second vehicle data to quantify instantaneous power demand;
(2)
Segmenting short trips by road type (60 s bins for expressways; 180 s bins for non-expressways);
(3)
Clustering instantaneous VSP values and average speeds within each trip segment;
(4)
Generating facility- and speed-specific VSP distributions via pooling, which are then coupled with average fuel consumption rates of light-duty vehicles to derive city-specific eco-driving baselines.

2.2.1. Aggregated Characteristics of Driving Behavior

VSP is defined as the instantaneous power output provided by the vehicle power system per unit mass of the vehicle. VSP is calculated following matching road information to the second-by-second trajectory data [29]. Equation (1) demonstrates the parameters required to calculate the instantaneous VSP.
V S P = A v + B v 2 + C v 3 1 m + ( a + g sin θ ) v
where v is the speed in m/s, a is the acceleration in m/s2, θ is the road grade, m is the vehicle total weight (curb weight and payload), g is the local gravitational acceleration, and A, B, and C are the calibration parameters of 0.156461, 0.0020002, 0.000493, respectively [30]. With the purpose of better reflecting the driver’s driving behavior at specific average speeds, we label the discrete VSP values in a fine-aggregated set into the VSP bins (interval granularity of 1 kw/ton). Each consecutive record (for expressway it is 60 s, for non-expressway it is 180 s) is delineated as a small trip, and labeled with different tags according to the average speed (e.g., 10 km/h, etc.), road type (e.g., expressway or non-expressway), and driver ID (e.g., driver #1, driver #2, etc.). The VSP distribution refers to the proportion of time spent in various VSP bins under specific traffic conditions. The VSP distribution can be sensitive to differences in driving behavior and is an important independent parameter for evaluating eco-driving behavior.

2.2.2. Baseline Fuel Consumption for Different Road Types

This study proposes a weighted fuel consumption factor where the final fuel consumption of the individual vehicle can be obtained by calculating the vehicle time traveled (VTT) at specific average speeds and the weighted fuel consumption factor (in g/s) cumulatively. This weighted fuel consumption factor has a lower variation at each speed bin compared to the original fuel consumption factor (in g/km), allowing for a clearer representation of the difference between the individual driver vs. the average fuel consumption baseline. The fine-aggregated fuel consumption baseline (“baseline” in the following) is derived from the average driving behavior of all drivers under specific average speeds and traffic conditions, and reflects the average eco-driving level of all light-duty vehicle drivers in the area where the data were collected. The baseline for a road type of r with a speed of v is shown in Equation (2).
B a s e l i n e v , r = i = 30 30 f V S P b i n v , i F R i T v D v v = i = 30 30 f V S P b i n v , i F R i
where f V S P b i n v , i is the frequency when the average speed is v and the VSP bin is i; F R i is the average fuel rates when the VSP bin is i; T v is the total time during which the average speed is v; D v is the total distance covered at an average speed of v.

2.3. Comparative Analysis of Multi-Driver Behavior and Eco-Driving Levels in Different Cities

2.3.1. Comparison of Multi-Driver Driving Behavior

A multi-driver driving behavior comparison was conducted by comparing the individual and baseline differences under each traffic condition using the method proposed by Zhang et al. [14] for the development of the eco-index deltaFR, as shown in Equation (3). In this study, only trajectory segments with average speeds within 25–60 km/h are considered because the eco-driving behavior in other segments (average speed less than 25 km/h and greater than 60 km/h) is not sensitive to eco-driving evaluation. The classification of eco-driving behavior is divided by Equations (4–6). The application of the Johnson transformation to the deltaFR data results in a new set of sample data, denoted as X, which conforms to a standard normal distribution (SND). The precision of fitting the deltaFR to the distribution described in Equation (4) determines the conformity of X with the SND. The higher the fitting accuracy of the deltaFR sample to the Johnson’s Su distribution, the higher the compliance of the new sample X to the standard normal distribution. In accordance with the 3σ (three standard deviations) principle, the driving behavior is performed based on the transformed data X. This means that driving behavior will be categorized into different eco-levels based on the standard deviation from the mean of the standard normal distribution, allowing for a standardized and objective evaluation of eco-driving behavior. Unlike the standard norm distribution, due to the existence of the theoretical boundary, the minimum value of driving behavior optimization exists and is calculated from the line, which is −5.42. The detailed categories of division and proportion are shown in Table 3. The classification system accounts for the theoretical boundary condition of driving behavior optimization, where the minimum deltaFR value (−5.42) defines the lower limit of Category 1. This ensures that all observed behaviors are mapped within the physically achievable optimization range.
d e l t a F R = v = 25 60 F v × ( F R I n d i v i d u a l , v F R B a s e , v )
f = e 1 2 ( γ + δ Arcsinh [ d e l t a F R μ σ ] 2 δ 2 π ( d e l t a F R μ ) 2 + σ 2 γ = - 1.5995 , δ = 3.1965 , μ = 0.0164 , σ = 0.0381
X = γ + δ f ( d e l t a F R μ σ )
C a t e g o r y = 1 , 5.42 < X < 3 2 , 3 < = X < 2 3 , 2 < = X < 1 4 , 1 < = X < 0 5 , 0 < = X < 1 6 , 1 < = X < 2 7 , 2 < = X < 3 8 , 3 < = X
where deltaFR is an eco-index specifically designed to measure the magnitude of differences from the baseline; Fv is the proportion of the spend time within the speed bin j; FRIndividual,v and FRBase,v represent the fuel rates, as speed is v for both the participants and baseline; f is the mathematical model of probability density function presented by deltaFR; μ, σ, γ, and δ are the four degrees of freedom parameters that form this distribution function,; and X is the dataset of the SND obtained from the del dataset by Johnson transformation.
Coupling the VSP distribution and fuel consumption rates at specific speeds while considering different road types and driver preferences for road types at different speed bins results in a final individual eco-driving evaluation.

2.3.2. Comparison of Multi-City Eco-Driving Levels

The eco-driving evaluation baseline generated using the above method for a specific city represents the average driving behavior of the city’s drivers under different road types. If sufficient data are available to replicate the implementation of the method for each city, the eco-driving evaluation baselines for multiple cities can be compared to obtain the comparative results for city driving behavior.
(1)
Inter-city speed distribution analysis across road types:
Speed bins were defined by segmenting average speed values into bins of 10 km/h, with a dedicated bin for speeds below 1 km/h. Time proportions within each speed bin were systematically quantified.
(2)
Acceleration distribution analysis under specific traffic scenarios:
Short trip segments were stratified by 1 km/h average speed bins. Acceleration values were aggregated into 0.1 m/s2 intervals, with temporal proportions calculated for each speed-acceleration matrix cell.
(3)
Scenario-specific VSP distribution analysis:
This analysis followed the same methodological framework as described in Point 2, ensuring methodological consistency across the parameters.
(4)
Hypothesis testing:
In cases where only a limited data sample is available for certain cities, a brief comparison using a hypothesis testing approach becomes a viable option. Hypothesis testing is conducted on a dataset within a specific speed bin and for a specific facility, in comparison to a data-sufficient city dataset (e.g., Beijing). Taking Beijing as an example, the original hypothesis can be formulated as follows:
H0: 
The eco-driving level under the facility-specific speed interval in that city is equivalent to Beijing.
H1: 
The eco-driving level under the facility-specific speed interval in that city is different from Beijing.
Set α = 0.05, calculate the p-value and compare it to alpha. If p > α, we consider the original hypothesis to not be true.
The term “the eco-driving level under the facility-specific speed interval” refers to Toronto’s trajectory data preprocessed through the evaluation framework outlined in Section 2.2. This process generates Toronto-specific driver behavior profiles, which are then compared to Beijing’s behavioral datasets under identical traffic conditions. For instance, hypothesis testing was conducted for the expressway in a 40 km/h average speed bin to verify behavioral equivalence between Toronto and Beijing drivers, with corresponding p-values generated.
In scenarios where Beijing’s baseline eco-driving level (mean μ B e i j i n g ) and variance ( σ B e i j i n g 2 ) under specific speed bins are established, the objective of hypothesis testing is to determine whether Toronto’s observed data under identical traffic conditions exhibit statistically significant deviations from this reference. To achieve this, hypothesis tests are prioritized based on sample characteristics and assumptions about population parameters.
Z-Test
When Toronto’s sample data satisfy the normality assumption or the sample size is sufficiently large (n ≥ 30) enough to invoke the Central Limit Theorem, and the population variance ( σ B e i j i n g 2 ) is known, the Z-test is the optimal method. The Z-statistic quantifies the standardized difference between Toronto’s sample mean ( X ¯ T o r o n t o ) and Beijing’s population mean, as follows:
Z = X ¯ T o r o n t o μ B e i j i n g σ B e i j i n g n
Here, σ B e i j i n g represents Beijing’s population standard deviation, and n is Toronto’s sample size. The resulting Z-value is compared against critical values from the standard normal distribution to determine statistical significance. For instance, if (|Z| > 1.96), the null hypothesis H0 is rejected, indicating a significant divergence in eco-driving behavior.
t-Test
If Toronto’s population variance is unknown and the sample size is small (n < 30), the t-test replaces the Z-test to account for additional uncertainty in the variance estimation. The t-statistic is calculated as follows:
t = X ¯ T o r o n t o μ B e i j i n g s T o r o n t o n
where s T o r o n t o is Toronto’s sample standard deviation. The critical t-value is derived from the Student’s t distribution with n − 1 degrees of freedom. For example, a t-value exceeding ± 2.045 (for α = 0.05 and df = 29) would lead to rejecting H0. This test is robust to moderate deviations from normality but requires approximate symmetry in small samples.

3. Results

3.1. Distribution of VSP and Fuel Consumption Rates

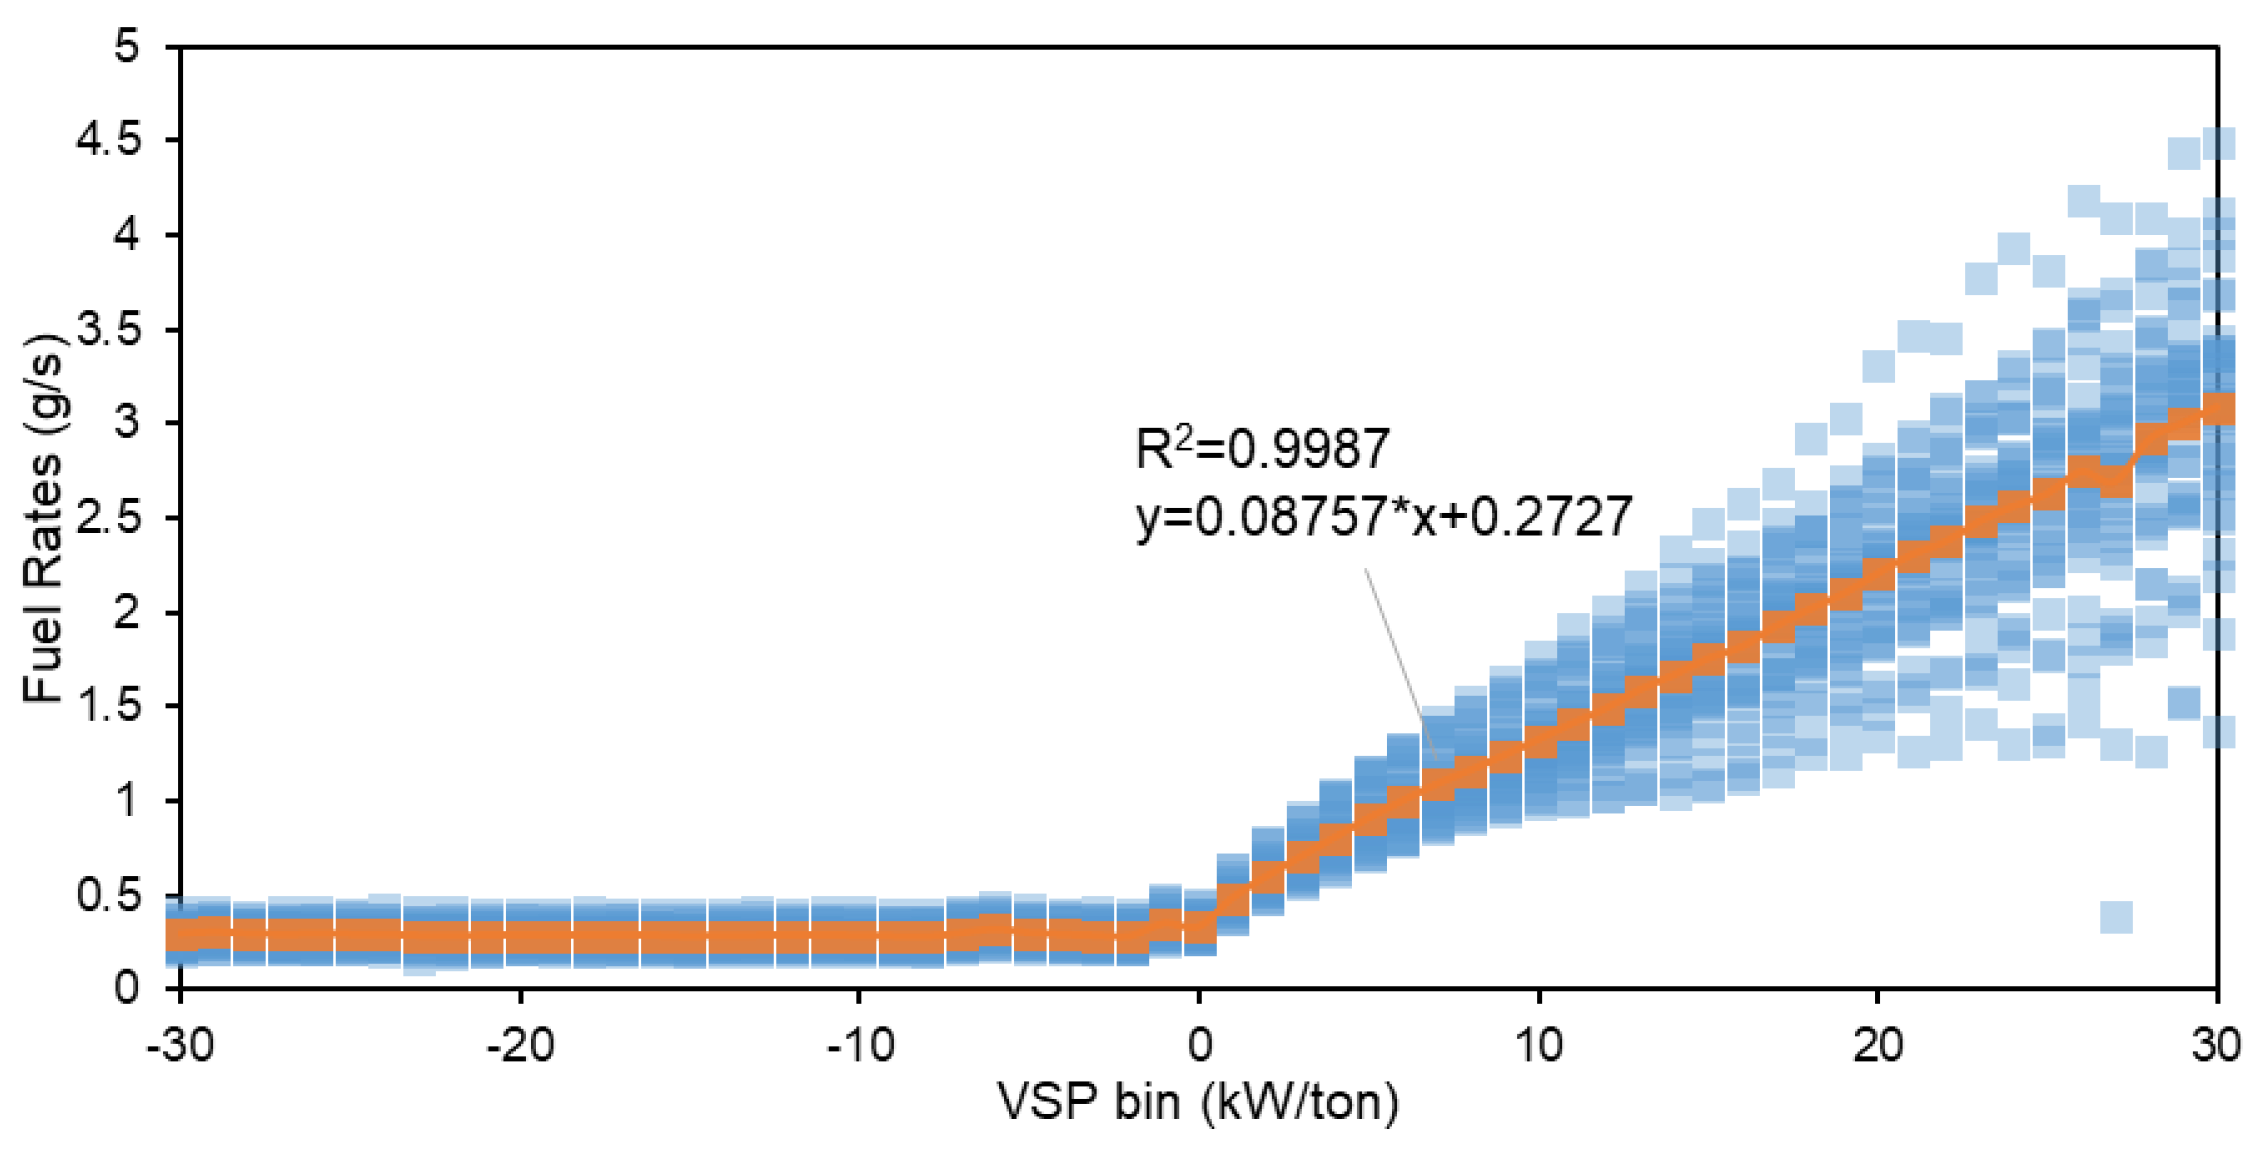
VSP is a strongly correlated independent parameter connecting vehicle driving characteristics and fuel consumption patterns. The physical relationship between VSP and fuel consumption can be comprehensively explained [31]. We categorized VSP into bins at 1 kW/ton intervals (as depicted in Figure 4) and calculated the average fuel rates for each VSP bin.
The fuel consumption rate is obtained by averaging all of the fuel consumption data in a VSP bin, with data introduced in Section 2.1, applying the model of Li et al. [18]. The fuel consumption rates for 33 different vehicle types are illustrated in Figure 5. When the VSP values are below 0, fuel consumption rates remain at a low level (0.2–0.5 g/s), without significant fluctuations across VSP bins. This phenomenon may correspond to two operational modes governed by engine control strategies, which are as follows: (1) during closed-throttle deceleration and (2) during idling states with fuel supply reduced to a thermodynamically constrained minimum, collectively causing the observed fuel rates in negative VSP regimes.
For VSP values above 0, fuel consumption increases linearly with VSP bins. The aggregated data show a strong linear correlation (R2 = 0.9987), with a slope of 0.0876 g/(s·kW/ton). The fuel rates of 33 different vehicle-type analyses reveal slope distributions of 0.03–0.13 and R2 ranges of 0.69–0.99 at VSP > 0. The average slope (0.0876) indicates an 8.76% fuel increase per 1 kW/ton VSP increment. This linear relationship stems from the direct proportionality between the engine power output and tractive force demand when overcoming driving resistance at VSP > 0.

3.2. Eco-Driving Baseline on Expressways and Non-Expressways in Beijing

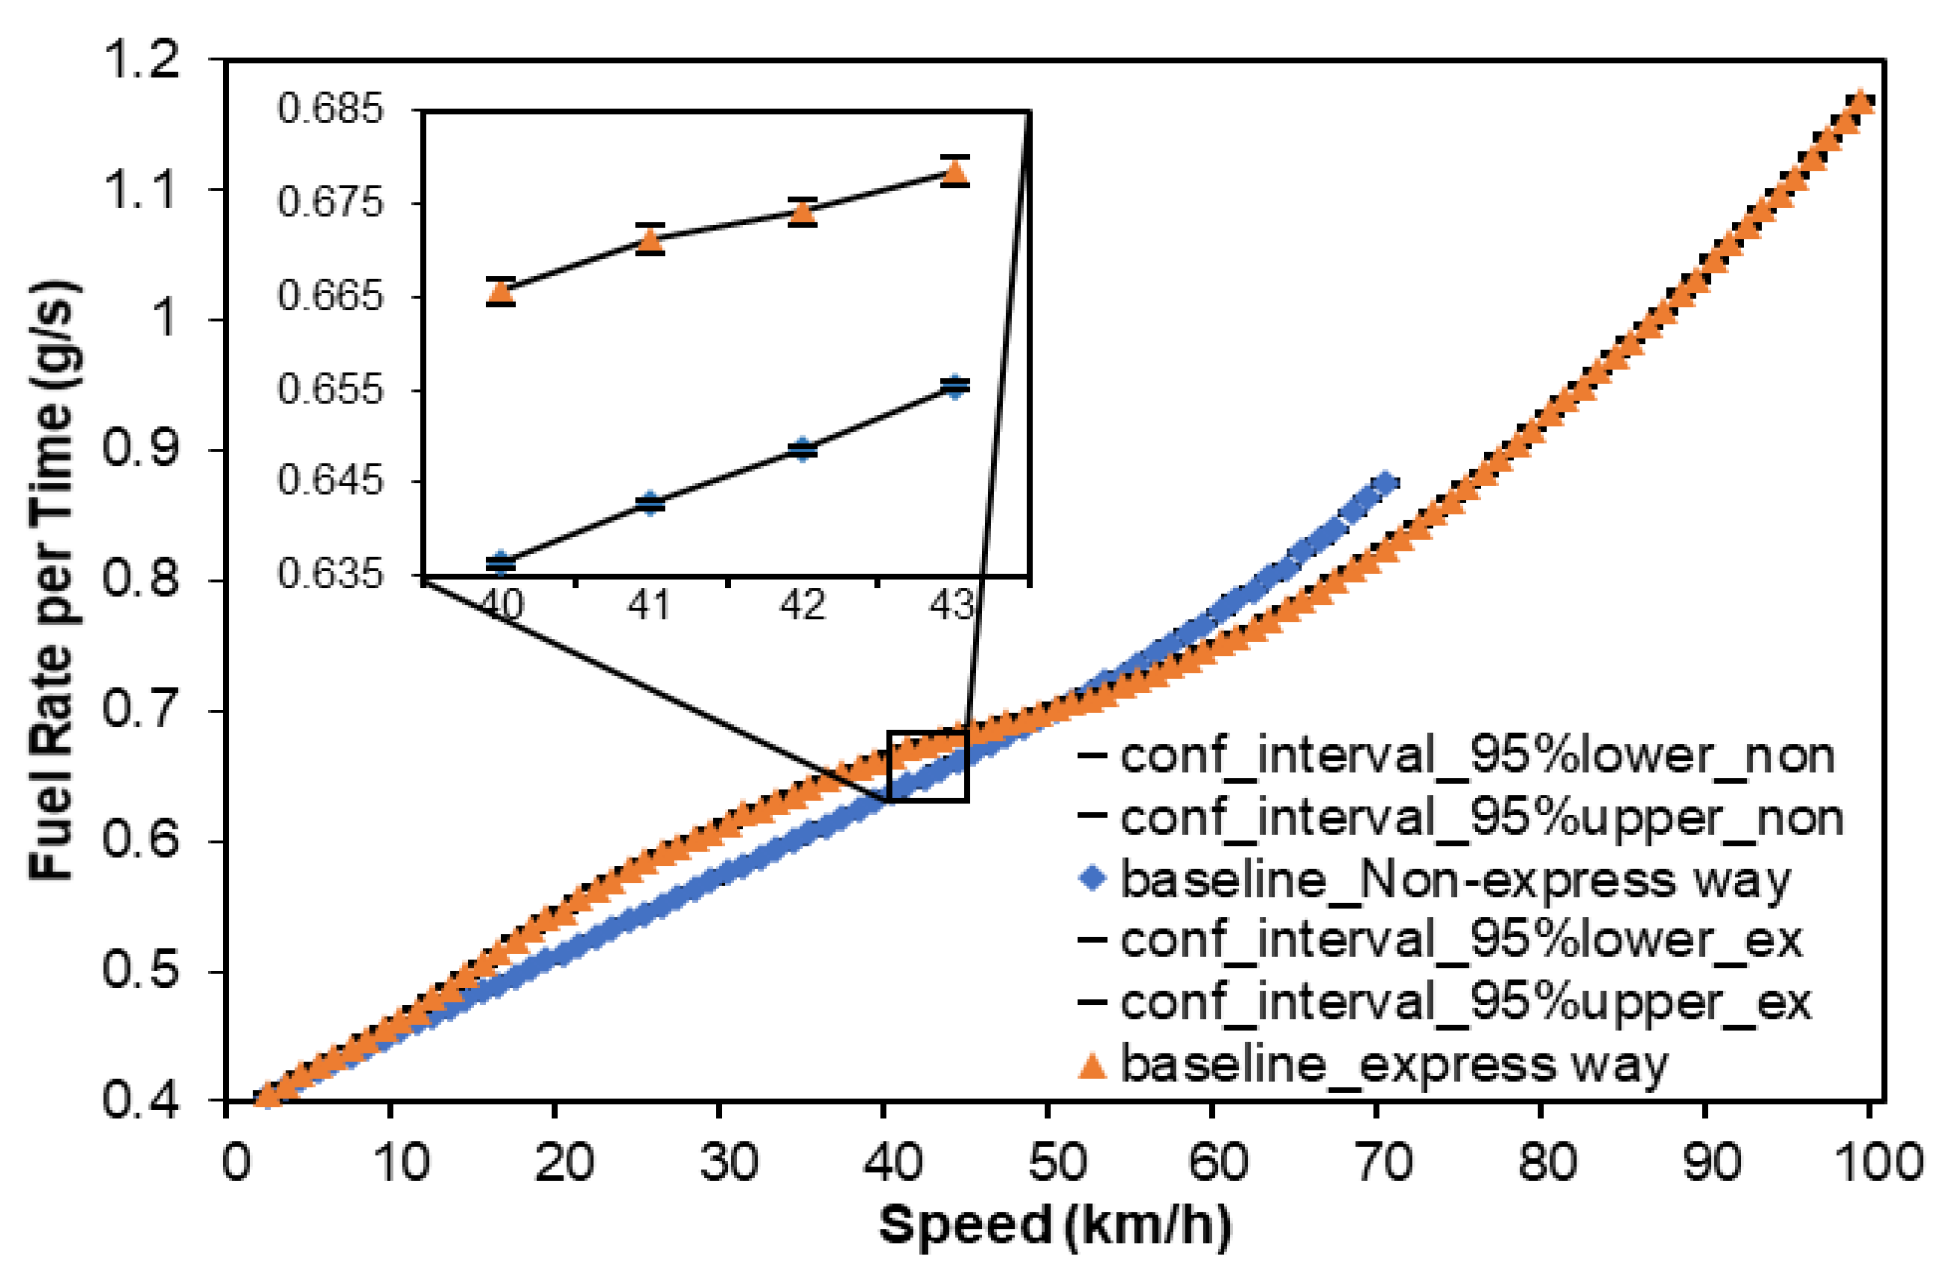
The baseline of eco-driving is an important parameter in the evaluation, as a criterion for fuel consumption at a specific average speed, and is used to compare and evaluate the ecological characteristics of the driving behavior of each driver in each traffic situation (e.g., specific average speeds, specific road types). The heterogeneity in driving behavior exhibited by different drivers is ultimately reflected in fuel consumption. Figure 6 illustrates the fuel consumption within the 95% confidence interval, demonstrating that the baseline is robust for the specific road type and speeds.
The road type causes a fluctuation of up to 6.38% in the eco-driving baseline (at an average speed of 24–26 km/h), as indicated by the speed within the range of 20–30 km/h. When the average speed is less than 50 km/h, the eco-driving evaluation baseline is higher on expressways than on non-expressways (with a difference exceeding 5% within 16–38 km/h and a maximum difference of 7.30% at the speed of 26 km/h). When vehicles are travelling at a speed of less than 50 km/h on expressways, the distribution of speed is more dispersed compared to non-expressways under the same conditions (high-speed and low-speed intervals account for more), and acceleration and deceleration are frequent, resulting in a higher fuel consumption than non-expressways under the same average speed. As the average speed is greater than 50 km/h, the baseline of the non-express road is higher than that of the express road, indicating that the expressways are more ecological than the non-expressways during the high-speed bins.

3.3. Applicability of Baseline Among Multi-Driver in Beijing

Based on the above methodology for developing an eco-driving evaluation baseline, we evaluated the driving behavior of drivers in Beijing on both expressways and non-expressways. Drivers were grouped into eight categories, and each category was distinguished by color and a baseline comparison on the corresponding road type, as shown in Figure 7.
Figure 7 shows that drivers exhibit different eco-driving behaviors on expressways and non-expressways. Drivers show homogeneity on non-expressways. As the average speed increases, the variability also increases. There was consistency in the results of the multi-driver evaluation of eco-driving behavior, using baselines on the specific road types and speeds. In comparison to the baseline, drivers falling within categories 1–4 demonstrated behavior that leaned towards ecological practices, whereas drivers falling within categories 5–8 exhibited more aggressive behavior. In terms of consistency within the same driver, over three-fifths of drivers (considering all valid data drivers) showed consistency in their grouping at each speed and their overall grouping over the speed range of 25–60 km/h (1 km/h per segment).

3.4. Applicability of Beijing’s Evaluation Baseline to Toronto

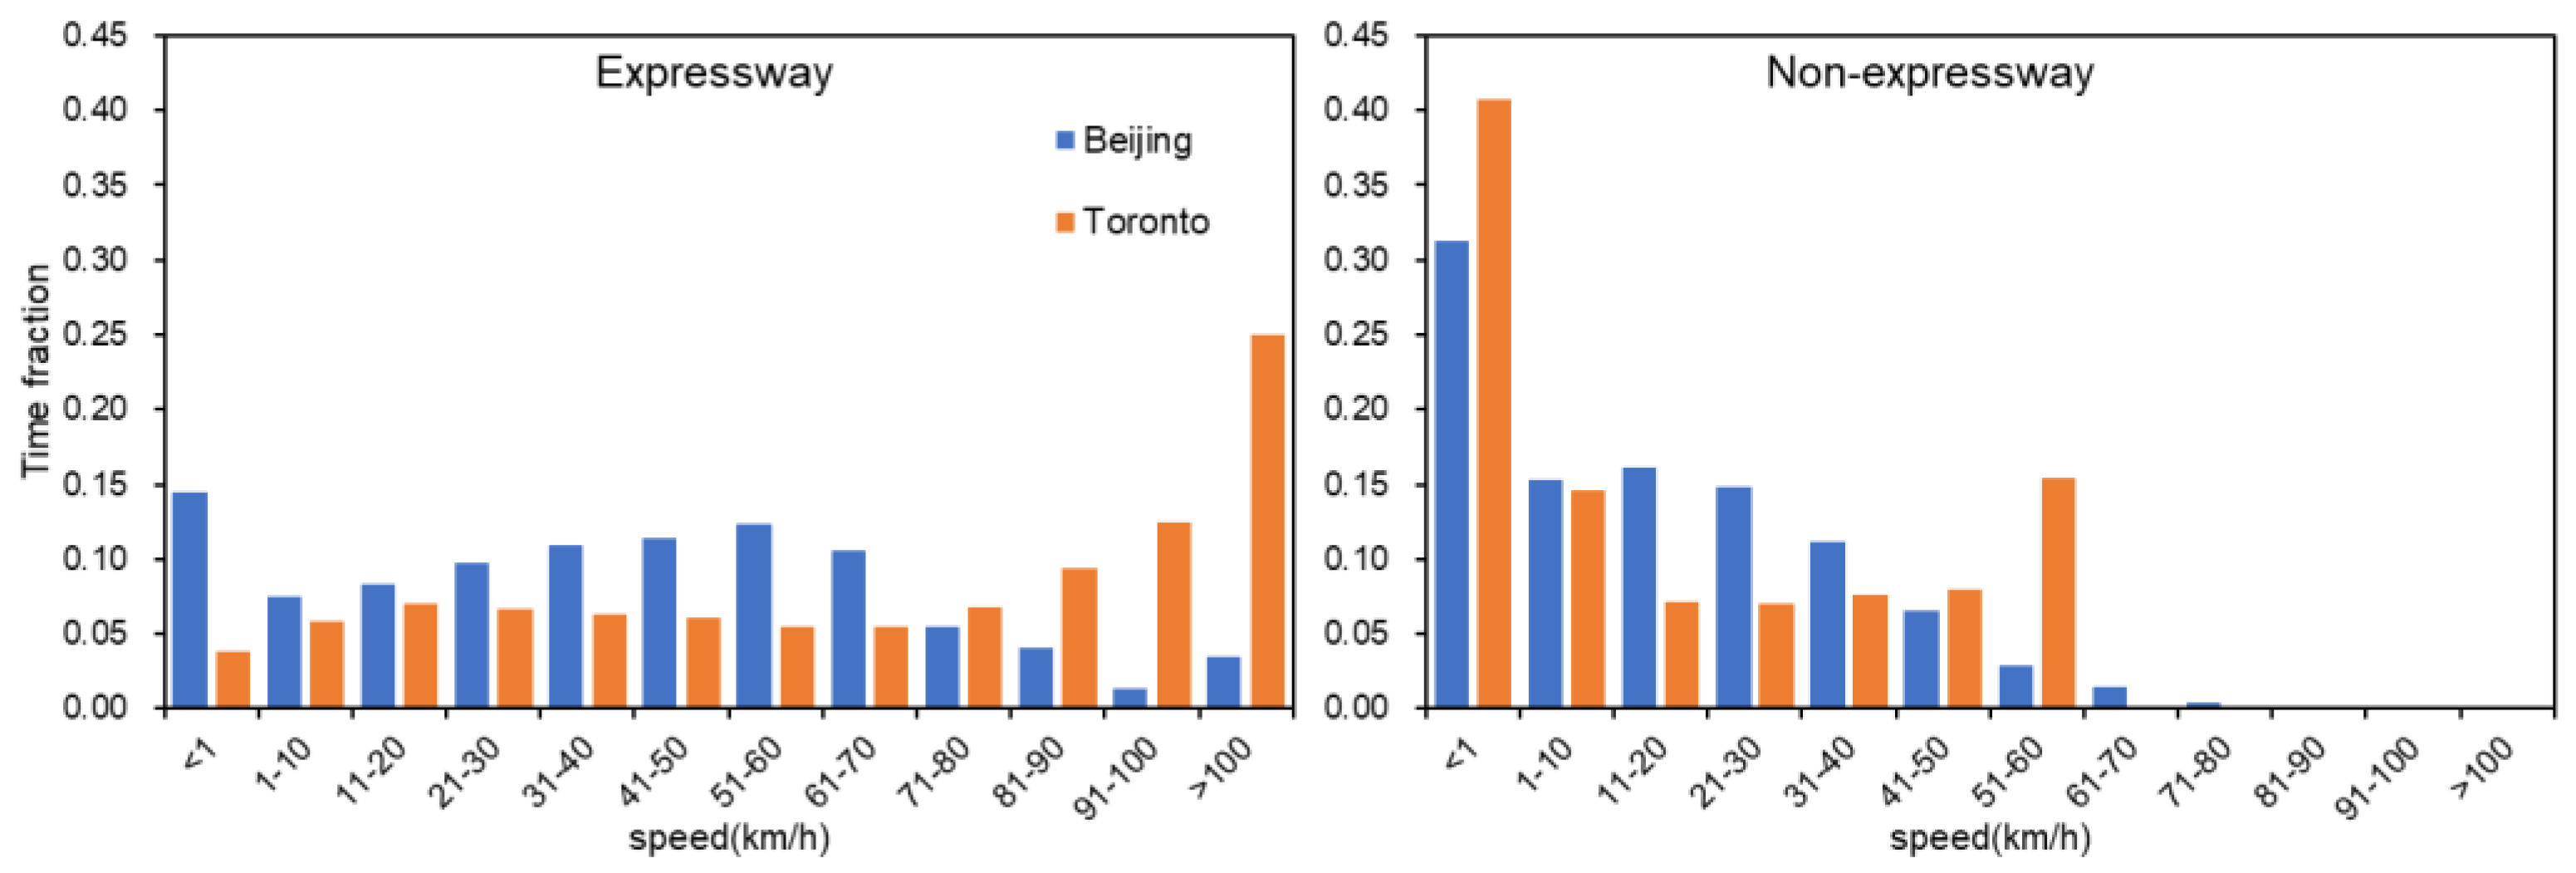
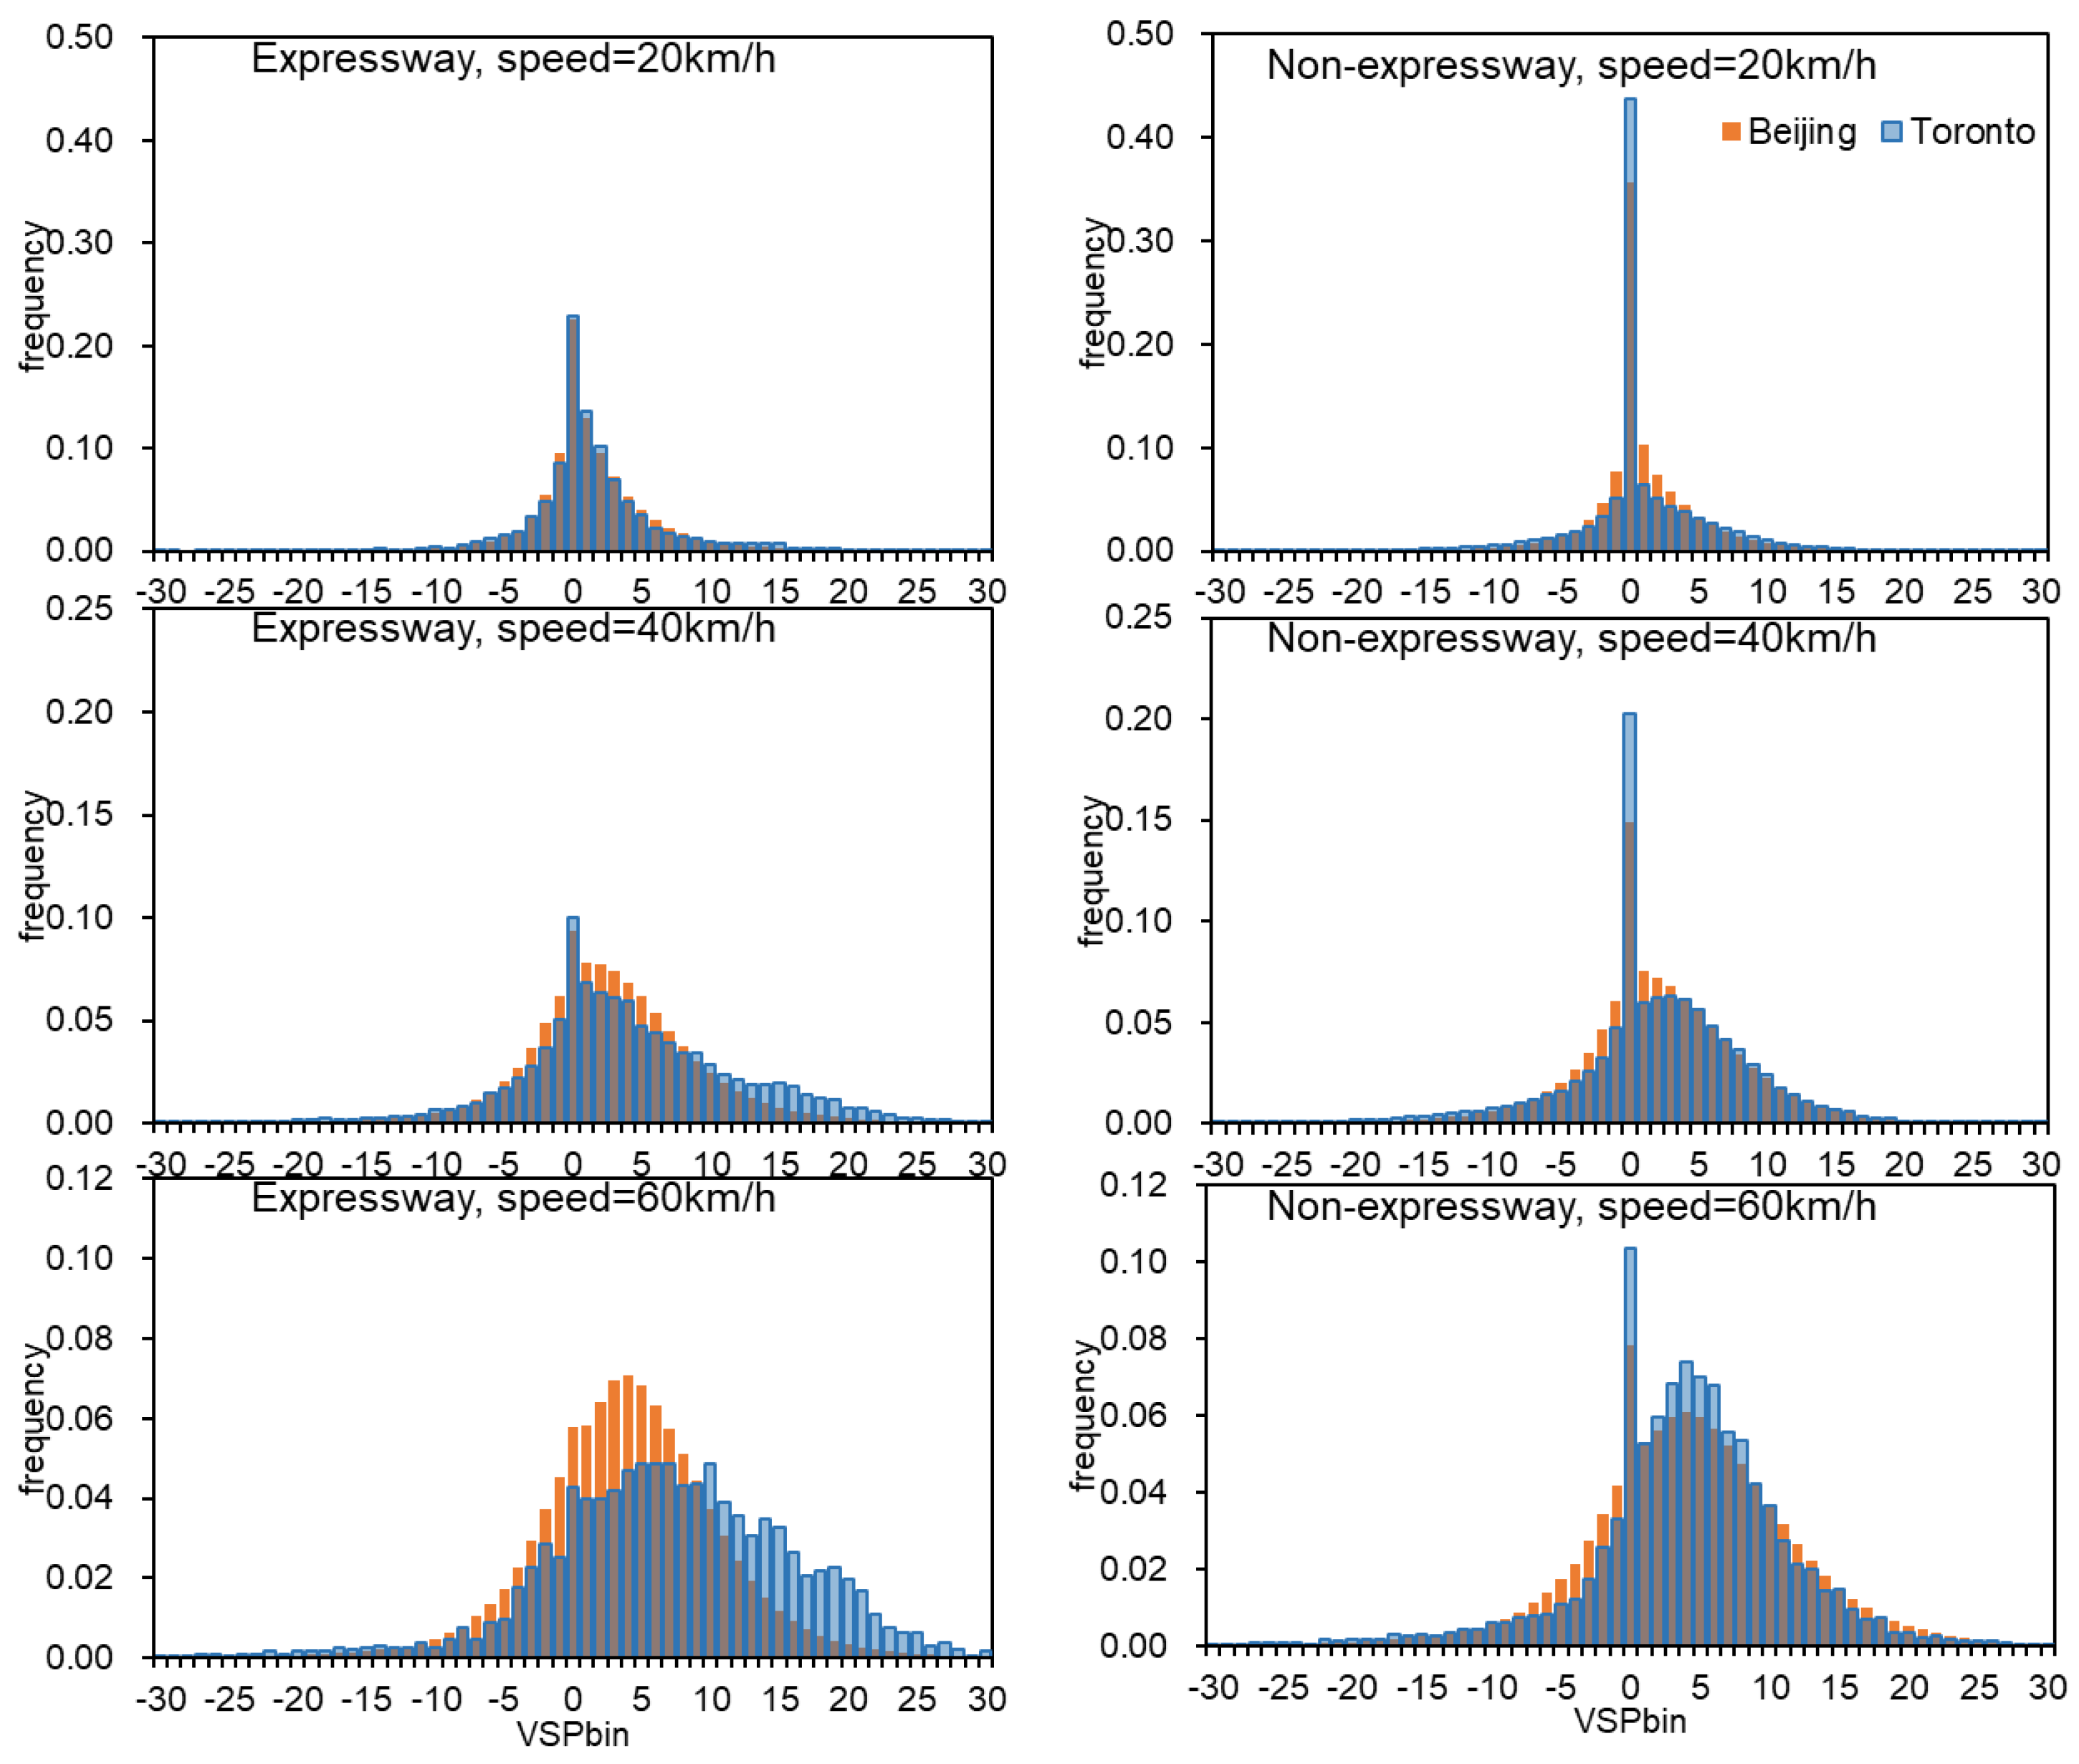
Considerable differences exist in the speed distributions of drivers on different road types in Beijing and Toronto, as depicted in Figure 8. The fraction of idle time (speed < 1 km/h) on non-expressways is higher for Toronto driving behavior (41%) than for Beijing driving behavior (31%). On high-speed bins with different road types (speed > 70 km/h for expressways and >50 km/h for non-expressways), Toronto driving behavior has a higher fraction of time than Beijing drivers. This means that Toronto drivers are faster for the same driving time. For the same average speed, we compared the VSP distributions of drivers in both cities. The VSP distribution of Toronto drivers is more dispersed than that of Beijing drivers, and more significant at higher speeds. This suggests that Toronto drivers will have more frequent and sharp acceleration and deceleration behavior, i.e., there is more aggressive driving behavior (non-eco-driving). At the same average fuel consumption rate (using the same experimentally collected average fuel consumption rate, excluding fuel consumption rate errors due to engine interference), Toronto exhibits higher second-by-second fuel consumption and more aggressive driving behavior. Figure 9 shows a comparison of the VSP distribution at average speeds of 20, 40, and 60 km/h. The average driving behavior of Toronto and Beijing shows differences in robust VSP distributions at specific speeds. Figure 10 shows the distribution of the acceleration of drivers in Beijing and Toronto in different speed intervals. Toronto drivers have a longer proportion of driving time in the acceleration greater than 1 m/s2, which also illustrates the aggressive and competitive driving behavior of Toronto drivers. Higher non-overlap rates of VSP distributions indicate larger differences in driving behavior between the two cities, as shown in Table 4. The non-overlap rate of the VSP distribution between Beijing and Toronto reaches 36.59% at an average speed of 60 km/h on the expressways. Furthermore, Toronto accounts for twice as much as Beijing in the range of VSP bin > 10 kW/ton (expressway, and speed = 30, 40, 50, and 60 km/h), and the fuel consumption becomes correspondingly higher at that average speed (referring to the average fuel consumption rate in relation to VSP (Figure 5), a high VSP bin corresponds to a large fuel consumption rate).
Finally, we assume that the baseline (developed in Beijing) is available for Toronto eco-driving evaluation and proceed as follows.
We used an ecological driving evaluation baseline obtained based on vehicle trajectory data collected in Beijing and applied it to an evaluation of light-duty vehicle driving behavior in Toronto.
It is clear that there is a mismatch between the baseline eco-driving evaluation in Beijing and the driving behavior of Toronto drivers (as shown in Figure 11a,b). We used hypothesis testing to determine this issue. The original hypothesis was H0, which is as follows: we hypothesize that there exists a considerable difference in driving behaviors within Toronto and Beijing, and set the significance level at 95% (alpha = 0.05).
Figure 11c shows the results of the hypothesis test for the driving behavior of Beijing and Toronto drivers on the corresponding road types (corresponding speed bins), resulting in a p-value > 0.05 for 93% of the speed bins on expressways and 60% of the speed bins on non-expressways; i.e., the original hypothesis of H0 is rejected.
Therefore, we confirmed the existence of considerable differences in driving behavior within Toronto and Beijing, meaning that Toronto cannot use the eco-driving evaluation baseline of Beijing, and needs to re-collect data for eco-driving evaluation baseline development.

4. Discussion

4.1. Determining the Required Sample Size for Eco-Driving Evaluation Method

Furthermore, we ask a new question, which is as follows: what is the minimum amount of data needed to use this evaluation method robustly in a new city? This section will give the answer to the minimum amount of data needed to establish a stable baseline for eco-driving evaluation in a new city (new road network and a completely new group of drivers).
Determining the appropriate amount of data required for a dependable driver eco-driving evaluation is our primary objective. Zhang et al. [26] conducted a study, revealing that a minimum of nine trajectories (each lasting 540 s) is necessary to establish VSP distributions with a confidence level of 90% and errors below 5%. Consequently, we assume a uniform speed distribution for each vehicle, dividing the average speed into 2 km/h bins. To ensure the stability of VSP distributions on both non-expressways and expressways, a minimum of 43,200 data points is needed. For this study, we selected vehicles with a collected data volume exceeding 45,000 drivers who exhibit consistent and stable driving behavior. These drivers will be the basis of data for generating inter-city eco-driving evaluation parameters (the new baseline).
The subsequent question pertains to the required number of drivers with consistent driving behavior to establish an average baseline for a new city. While the conventional view is that a sample size of 50 in each class is sufficient to produce stable data for the parameters, this observation seems to stem from a misunderstanding of a limited set of statistical studies [32]. According to Bridges and Holler [33], a sample size exceeding 75 (including 75) in a normally distributed sample does not significantly alter the mean or standard deviation estimates. They also acknowledged that this threshold (75) may be different in a skewed distribution.
In this study, we assess the validity of this assertion by investigating the minimum sample size necessary for evaluating parameters using the method proposed in this paper. Stable drivers (more than 45,000 data records) were selected by repeating the Monte Carlo sampling 100 times to determine how many drivers are needed for the eco-driving evaluation to be a reliable reflection of the driving behavior habits of drivers in the city.
The criterion we used is the percentage of mean and full sample baseline errors within ±2.5% of each other in the medium speed range (25–60 km/h). When more than 90% of the sample and baseline differ within 5%, this is considered an acceptable error and falls within the minimum amount of data required for the urban eco-driving evaluation parameters.
When the sampled number x is determined, x drivers are selected from the total sample in Beijing using the Monte Carlo method, and the average fuel consumption rate is developed. The maximum error value relative to the baseline at 36 speed bins is defined as the b a s e l i n e _ e r r o r i , x of this sample. The percentage of b a s e l i n e _ e r r o r i , x within ±2.5% is obtained after 100 repetitions of sampling the baseline reliability generated by x stable drivers, and the above steps can be expressed as shown in Equations (9)–(11), which are as follows:
F R P T i , x , v = 1 x x V S P b i n f r e V S P b i n F R V S P b i n i = 1 , 2 , 3 , , 100 ; v = 25 , 26 , , 60
b a s e l i n e _ e r r o r i , x = max { F R P T i , x , 25 b a s e l i n e 25 b a s e l i n e 25 , , F R P T i , x , 60 b a s e l i n e 60 b a s e l i n e 60 }
R x = ( i = 1 100 [ | b a s e l i n e _ e r r o r i , x | < 2.5 % ] ) / 100 100 %
The results show that a generic one-size-fits-all approach using a sample size of 50 is questionable because different types of road characteristics have different degrees of homogeneity. For example, urban non-expressways are more likely to have more homogeneity and may require smaller sample sizes to achieve the same level of accuracy, while expressways are more likely to have more diverse driving behavior characteristics. When 78 drivers were sampled, the probability of all road types being within 5% of the baseline error was more than 90%, which is the minimum amount of data required for the urban eco-driving evaluation parameters (Table 5).

4.2. Comparative Analysis of Eco-Driving Parameters Between Beijing and Toronto

We use the non-overlapping rate of the VSP distribution to reflect the differences in driving behavior between Beijing and Toronto drivers for different road types and average speeds. Based on the Toronto driving trajectory data, we derived a speed-specific and facility-specific baseline for eco-driving evaluation in Toronto and compared it to the Beijing baseline in Figure 12. The baseline in Figure 12 relies on the robust VSP distribution for the specific speed.
The baseline derived from the expressways shows similar trends in the two cities’ baselines, but Toronto driving behavior is significantly higher than Beijing in the 20–80 km/h speed bins, with the largest difference of 25.22% at a 57 km/h of speed. This is the reason why the Toronto eco-driving evaluation cannot use the Beijing baseline. Comparing baselines derived from non-expressways, the Toronto and Beijing baselines have similar trends and values, with a maximum error of 4.54% in the medium speed bins. The difference in the baselines suggests that Toronto has a higher average fuel consumption on expressways due to aggressiveness in driving behavior.
The difference between the baselines on the Beijing and Toronto expressways is probably due to the more competitive driving behavior exhibited by Toronto drivers on the expressways in the 20–80 km/h speed bins (a phenomenon represented in Figure 11). In the speed bins, there is an instability in the traffic flow (synchronous flow gradually changing to free flow instability), and the speed increase is accompanied by over-acceleration and speeding (i.e., competitive driving behavior) [34]. Figure 11c illustrates the fuel consumption factors for Beijing and Toronto on expressways and non-expressways, showing that Toronto drivers exhibit higher levels of fuel consumption in the 20–80 km/h speed bins. This phenomenon leads to increased fuel consumption and emissions on expressways, corroborating with the findings of Zhai et al. [15]. Aggressive driving behavior observed across cities may originate from heterogeneous sociocultural contexts (e.g., public compliance with traffic laws), divergent policy frameworks (e.g., enforcement strictness), and road design priorities (e.g., expressway accessibility). Future studies should quantify the relative contributions of these possible reasons, particularly in cross-city comparisons.

5. Conclusions

This study presents a comprehensive evaluation of eco-driving behavior in different cities, using data collected from Beijing, China, and Toronto, Canada. A multi-city eco-driving evaluation baseline is established based on facility-specific and speed-specific VSP distributions, aiming to explore the portability of this methodology worldwide. The results show the importance of establishing localized evaluation systems and the minimum data requirements for developing robust eco-driving baselines in different cities.
The discoveries of this study can be summarized as follows:
  • The eco-driving baseline demonstrates stable differences between expressways and non-expressways. Specifically, the road type causes a maximum fluctuation of 6.38% in the eco-driving baseline (at average speed of 25 km/h), particularly evident in the speed range of 20–30 km/h.
  • Direct application of the eco-driving evaluation parameters (baseline) from Beijing to Toronto is not appropriate, necessitating localized evaluation systems. The study reveals that Toronto drivers exhibit more aggressive driving behavior in the evaluated sensitive speed bins (25–60 km/h) compared to Beijing drivers. Statistical analysis at a significance level of 95% indicates significant differences in driving behavior between the two cities, with 93% of the speed bins showing discrepancies on expressways and 60% on non-expressways.
  • To establish a robust ecological evaluation baseline for a new city, a minimum of 78 randomly collected effective trajectory data from 78 drivers, each contributing more than 45,000 s, is required. This sample size ensures a baseline error of below 5%, providing a reliable foundation for localized light-duty vehicle eco-driving evaluation. These thresholds of establishing a robust baseline were statistically validated through cross-city comparisons, accommodating infrastructure heterogeneity while maintaining robust across cities.
  • Although the baseline derived from the expressways exhibits similar trends between Toronto and Beijing, Toronto’s values are significantly higher in the 20–80 km/h speed bins. This difference may be attributed to the competitive driving behavior displayed by Toronto drivers under certain traffic conditions. Conversely, Toronto and Beijing baselines exhibit similar trends and values on non-expressways.
This paper investigates the transferability of the eco-driving evaluation method across different cities. With the results provided by this study, a small sample of data can be collected to confirm whether the constructed evaluation parameters can be directly used for localized light-duty vehicle eco-driving evaluation. Moreover, the potential for multi-city comparisons of driver eco-driving levels becomes feasible with the accumulation of sufficient trajectory data from additional cities. The method proposed is initially developed based on data from light-duty gasoline vehicles; however, with the increasing share of electric vehicles, this method remains applicable for the evaluation of driving behavior of electric vehicles.
Further studies will be carried out by exploring the applicability of the evaluation method for electric vehicles, investigating the impact of traffic conditions on driving behavior, and expanding the study to include data from additional cities for multi-city comparisons. This will be completed in the following ways: (1) adapting evaluation frameworks for electric vehicles by re-calibrating VSP models to incorporate battery-specific power nonlinearities; (2) developing datasets covering diverse traffic conditions (e.g., commuter corridors) and vehicle types (e.g., heavy-duty trucks) to quantify behavior–energy coupling; and (3) collecting trajectory data from multiple cities to establish multi-city evaluation baselines and to enable global comparisons of eco-driving performance.

Author Contributions

Conceptualization, L.Z. and G.S.; methodology, L.Z.; software, L.Z. and P.F.; validation, L.Z. and Z.Z. (Zeyu Zhang); formal analysis, L.Z.; data curation, L.Z. and J.X.; writing—original draft preparation, L.Z.; writing—review and editing, G.S., Z.Z. (Zhiqiang Zhai), and Y.D.; supervision, G.S.; funding acquisition, L.Z. and G.S. All authors have read and agreed to the published version of the manuscript.

Funding

This work was supported by Open Research Fund of Key Laboratory for Vehicle Emission Control and Simulation of the Ministry of Ecology and Environment, Chinese Research Academy of Environmental Sciences (VECS2024K09), and the Fundamental Research Funds for the Central Public-interest Scientific Institution (2024YSKY-03), and the National Key R&D Program of China, grant number (2018YFB1600701).

Institutional Review Board Statement

Not applicable.

Informed Consent Statement

Not applicable.

Data Availability Statement

The dataset is available on request from the authors.

Conflicts of Interest

The authors declare no conflicts of interest.

References

  1. Tu, R.; Xu, J.; Li, T.; Chen, H. Effective and Acceptable Eco-Driving Guidance for Human-Driving Vehicles: A Review. Int. J. Environ. Res. Public Health 2022, 19, 7310. [Google Scholar] [CrossRef] [PubMed]
  2. Zang, J.; Song, G.; Wu, Y.; Yu, L. Method for Evaluating Eco-Driving Behaviors Based on Vehicle Specific Power Distributions. Transp. Res. Rec. 2019, 2673, 409–419. [Google Scholar] [CrossRef]
  3. Chada, S.K.; Görges, D.; Ebert, A.; Teutsch, R.; Subramanya, S.P. Evaluation of the Driving Performance and User Acceptance of a Predictive Eco-Driving Assistance System for Electric Vehicles. Transp. Res. Part C Emerg. Technol. 2023, 153, 104193. [Google Scholar] [CrossRef]
  4. Liu, C.; Zhao, X.; Yao, Y. Comprehensive Evaluation of Eco-Driving Behavior under Three Road Conditions Based on Driving Simulator. In Proceedings of the CICTP 2019: Transportation in China—Connecting the World, Nanjing, China, 6–9 July 2019; pp. 3914–3926. [Google Scholar]
  5. Zhang, X.; Zhang, T.; Zou, Y.; Du, G.; Guo, N. Predictive Eco-Driving Application Considering Real-World Traffic Flow. IEEE Access 2020, 8, 82187–82200. [Google Scholar] [CrossRef]
  6. Zhao, J.; Chang, C.F.; Rajkumar, R.; Gonder, J. Corroborative Evaluation of the Real-World Energy Saving Potentials of InfoRich Eco-Autonomous Driving (iREAD) System. In Proceedings of the WCX SAE World Congress Experience, Detroit, MI, USA, 14–16 April 2020; p. 2020–01–0588. [Google Scholar]
  7. Pozueco, L.; Tuero, A.G.; Paneda, A.G.; Paneda, X.G.; Melendi, D.; Garcia, R.; Diaz Orueta, G.; Rionda, A. Analytic System to Evaluate Efficient Driving Programs in Professional Fleets. IEEE Trans. Intell. Transport. Syst. 2019, 20, 1099–1111. [Google Scholar] [CrossRef]
  8. Chen, C.; Zhao, X.; Yao, Y.; Zhang, Y.; Rong, J.; Liu, X. Driver’s Eco-Driving Behavior Evaluation Modeling Based on Driving Events. J. Adv. Transp. 2018, 2018, 9530470. [Google Scholar] [CrossRef]
  9. Xu, N.; Li, X.; Yue, F.; Jia, Y.; Liu, Q.; Zhao, D. An Eco-Driving Evaluation Method for Battery Electric Bus Drivers Using Low-Frequency Big Data. IEEE Trans. Intell. Transport. Syst. 2023, 24, 1–13. [Google Scholar] [CrossRef]
  10. Huang, Y.; Ng, E.C.Y.; Zhou, J.L.; Surawski, N.C.; Chan, E.F.C.; Hong, G. Eco-Driving Technology for Sustainable Road Transport: A Review. Renew. Sustain. Energy Rev. 2018, 93, 596–609. [Google Scholar] [CrossRef]
  11. Xu, J.; Tu, R.; Ahmed, U.; Amirjamshidi, G.; Hatzopoulou, M.; Roorda, M.J. An Eco-Score System Incorporating Driving Behavior, Vehicle Characteristics, and Traffic Conditions. Transp. Res. Part D Transp. Environ. 2021, 95, 102866. [Google Scholar] [CrossRef]
  12. Saboohi, Y.; Farzaneh, H. Model for Developing an Eco-Driving Strategy of a Passenger Vehicle Based on the Least Fuel Consumption. Appl. Energy 2009, 86, 1925–1932. [Google Scholar] [CrossRef]
  13. Zheng, J.; Wu, Y. Development of a Practical Method to Estimate the Eco-Level of Driver Performance. J. Adv. Transp. 2020, 2020, 1–11. [Google Scholar] [CrossRef]
  14. Zhang, L.; Zhu, Z.; Zhang, Z.; Song, G.; Zhai, Z.; Yu, L. An Improved Method for Evaluating Eco-Driving Behavior Based-on Speed-Specific Vehicle-Specific Power Distributions. Transp. Res. Part D Transp. Environ. 2022, 113, 103476. [Google Scholar] [CrossRef]
  15. Zhai, Z.; Xu, J.; Song, G.; Hatzopoulou, M. Comparative Analysis of Drive-Cycles, Speed Limit Violations, and Emissions in Two Cities: Toronto and Beijing. Sci. Total Environ. 2022, 811, 152323. [Google Scholar] [CrossRef] [PubMed]
  16. Ersan, Ö.; Üzümcüoğlu, Y.; Azık, D.; Fındık, G.; Kaçan, B.; Solmazer, G.; Özkan, T.; Lajunen, T.; Öz, B.; Pashkevich, A.; et al. Cross-Cultural Differences in Driver Aggression, Aberrant, and Positive Driver Behaviors. Transp. Res. Part F Traffic Psychol. Behav. 2020, 71, 88–97. [Google Scholar] [CrossRef]
  17. Li, C.; Yu, L.; Song, G. Improved Binning of Operating Modes in EPA Simulator Program for Transit Buses: Case Study in Beijing. Transp. Res. Rec. 2017, 2627, 57–66. [Google Scholar] [CrossRef]
  18. Li, C.; Yu, L.; He, W.; Cheng, Y.; Song, G. Development of Local Emissions Rate Model for Light-Duty Gasoline Vehicles: Beijing Field Data and Patterns of Emissions Rates in EPA Simulator. Transp. Res. Rec. 2017, 2627, 67–76. [Google Scholar] [CrossRef]
  19. Zhang, H.; Sun, J.; Tian, Y. The Impact of Socio-Demographic Characteristics and Driving Behaviors on Fuel Efficiency. Transp. Res. Part D Transp. Environ. 2020, 88, 102565. [Google Scholar] [CrossRef]
  20. Hussain, B.; Sato, H.; Miwa, T.; Morikawa, T. Influence of Personality Traits on Aberrant Driving Behaviors: A Comparison of Japanese, Chinese, and Vietnamese Drivers. J. Saf. Res. 2020, 75, 178–188. [Google Scholar] [CrossRef]
  21. Zhang, M.; Zhang, P.; Li, H. Characteristics and Evaluation Methods of Economic Transformation Performance of Resource-Based Cities: An Empirical Study of Northeast China. J. Nat. Resour. 2021, 36, 2051. [Google Scholar] [CrossRef]
  22. Sharif, R.A.; Pokharel, S. Smart City Dimensions and Associated Risks: Review of Literature. Sustain. Cities Soc. 2022, 77, 103542. [Google Scholar] [CrossRef]
  23. Iungman, T.; Cirach, M.; Marando, F.; Pereira Barboza, E.; Khomenko, S.; Masselot, P.; Quijal-Zamorano, M.; Mueller, N.; Gasparrini, A.; Urquiza, J.; et al. Cooling Cities through Urban Green Infrastructure: A Health Impact Assessment of European Cities. Lancet 2023, 401, 577–589. [Google Scholar] [CrossRef] [PubMed]
  24. Manzolli, J.A.; Trovão, J.P.; Henggeler Antunes, C. Scenario-Based Multi-Criteria Decision Analysis for Rapid Transit Systems Implementation in an Urban Context. eTransportation 2021, 7, 100101. [Google Scholar] [CrossRef]
  25. Zhai, Z.; Song, G.; Yu, L. How Much Vehicle Activity Data Is Needed to Develop Robust Vehicle Specific Power Distributions for Emission Estimates? A Case Study in Beijing. Transp. Res. Part D Transp. Environ. 2018, 65, 540–550. [Google Scholar] [CrossRef]
  26. Zhang, Z.; Song, G.; Zhai, Z.; Li, C.; Wu, Y. How Many Trajectories Are Needed to Develop Facility- and Speed-Specific Vehicle-Specific Power Distributions for Emission Estimation? Case Study in Beijing. Transp. Res. Rec. 2019, 2673, 779–790. [Google Scholar] [CrossRef]
  27. Faria, M.V. How Do Road Grade, Road Type and Driving Aggressiveness Impact Vehicle Fuel Consumption? Assessing Potential Fuel Savings in Lisbon, Portugal. Transp. Res. Part D Transp. Environ. 2019, 72, 14. [Google Scholar] [CrossRef]
  28. Fan, P.; Song, G.; Zhu, Z.; Wu, Y.; Zhai, Z.; Yu, L. Road Grade Estimation Based on Large-Scale Fuel Consumption Data of Connected Vehicles. Transp. Res. Part D Transp. Environ. 2022, 106, 103262. [Google Scholar] [CrossRef]
  29. Jiménez-Palacios, J.L. Understanding and Quantifying Motor Vehicle Emissions with Vehicle Specific Power and TILDAS Remote Sensing; Massachusetts Institute of Technology: Cambridge, MA, USA, 1999; p. 360. [Google Scholar]
  30. Song, G.; Yu, L.; Zhang, Y. Applicability of Traffic Microsimulation Models in Vehicle Emissions Estimates: Case Study of VISSIM. Transp. Res. Rec. 2012, 2270, 132–141. [Google Scholar] [CrossRef]
  31. Song, G.; Yu, L.; Wang, Z. Aggregate Fuel Consumption Model of Light-Duty Vehicles for Evaluating Effectiveness of Traffic Management Strategies on Fuels. J. Transp. Eng. 2009, 135, 611–618. [Google Scholar] [CrossRef]
  32. Piovesana, A.; Senior, G. How Small Is Big: Sample Size and Skewness. Assessment 2018, 25, 793–800. [Google Scholar] [CrossRef]
  33. Bridges, A.J.; Holler, K.A. How Many Is Enough? Determining Optimal Sample Sizes for Normative Studies in Pediatric Neuropsychology. Child Neuropsychol. 2007, 13, 528–538. [Google Scholar] [CrossRef]
  34. Kerner, B.S. Breakdown in Traffic Networks: Fundamentals of Transportation Science; Springer: Berlin/Heidelberg, Germany, 2017; ISBN 978-3-662-54471-6. [Google Scholar]
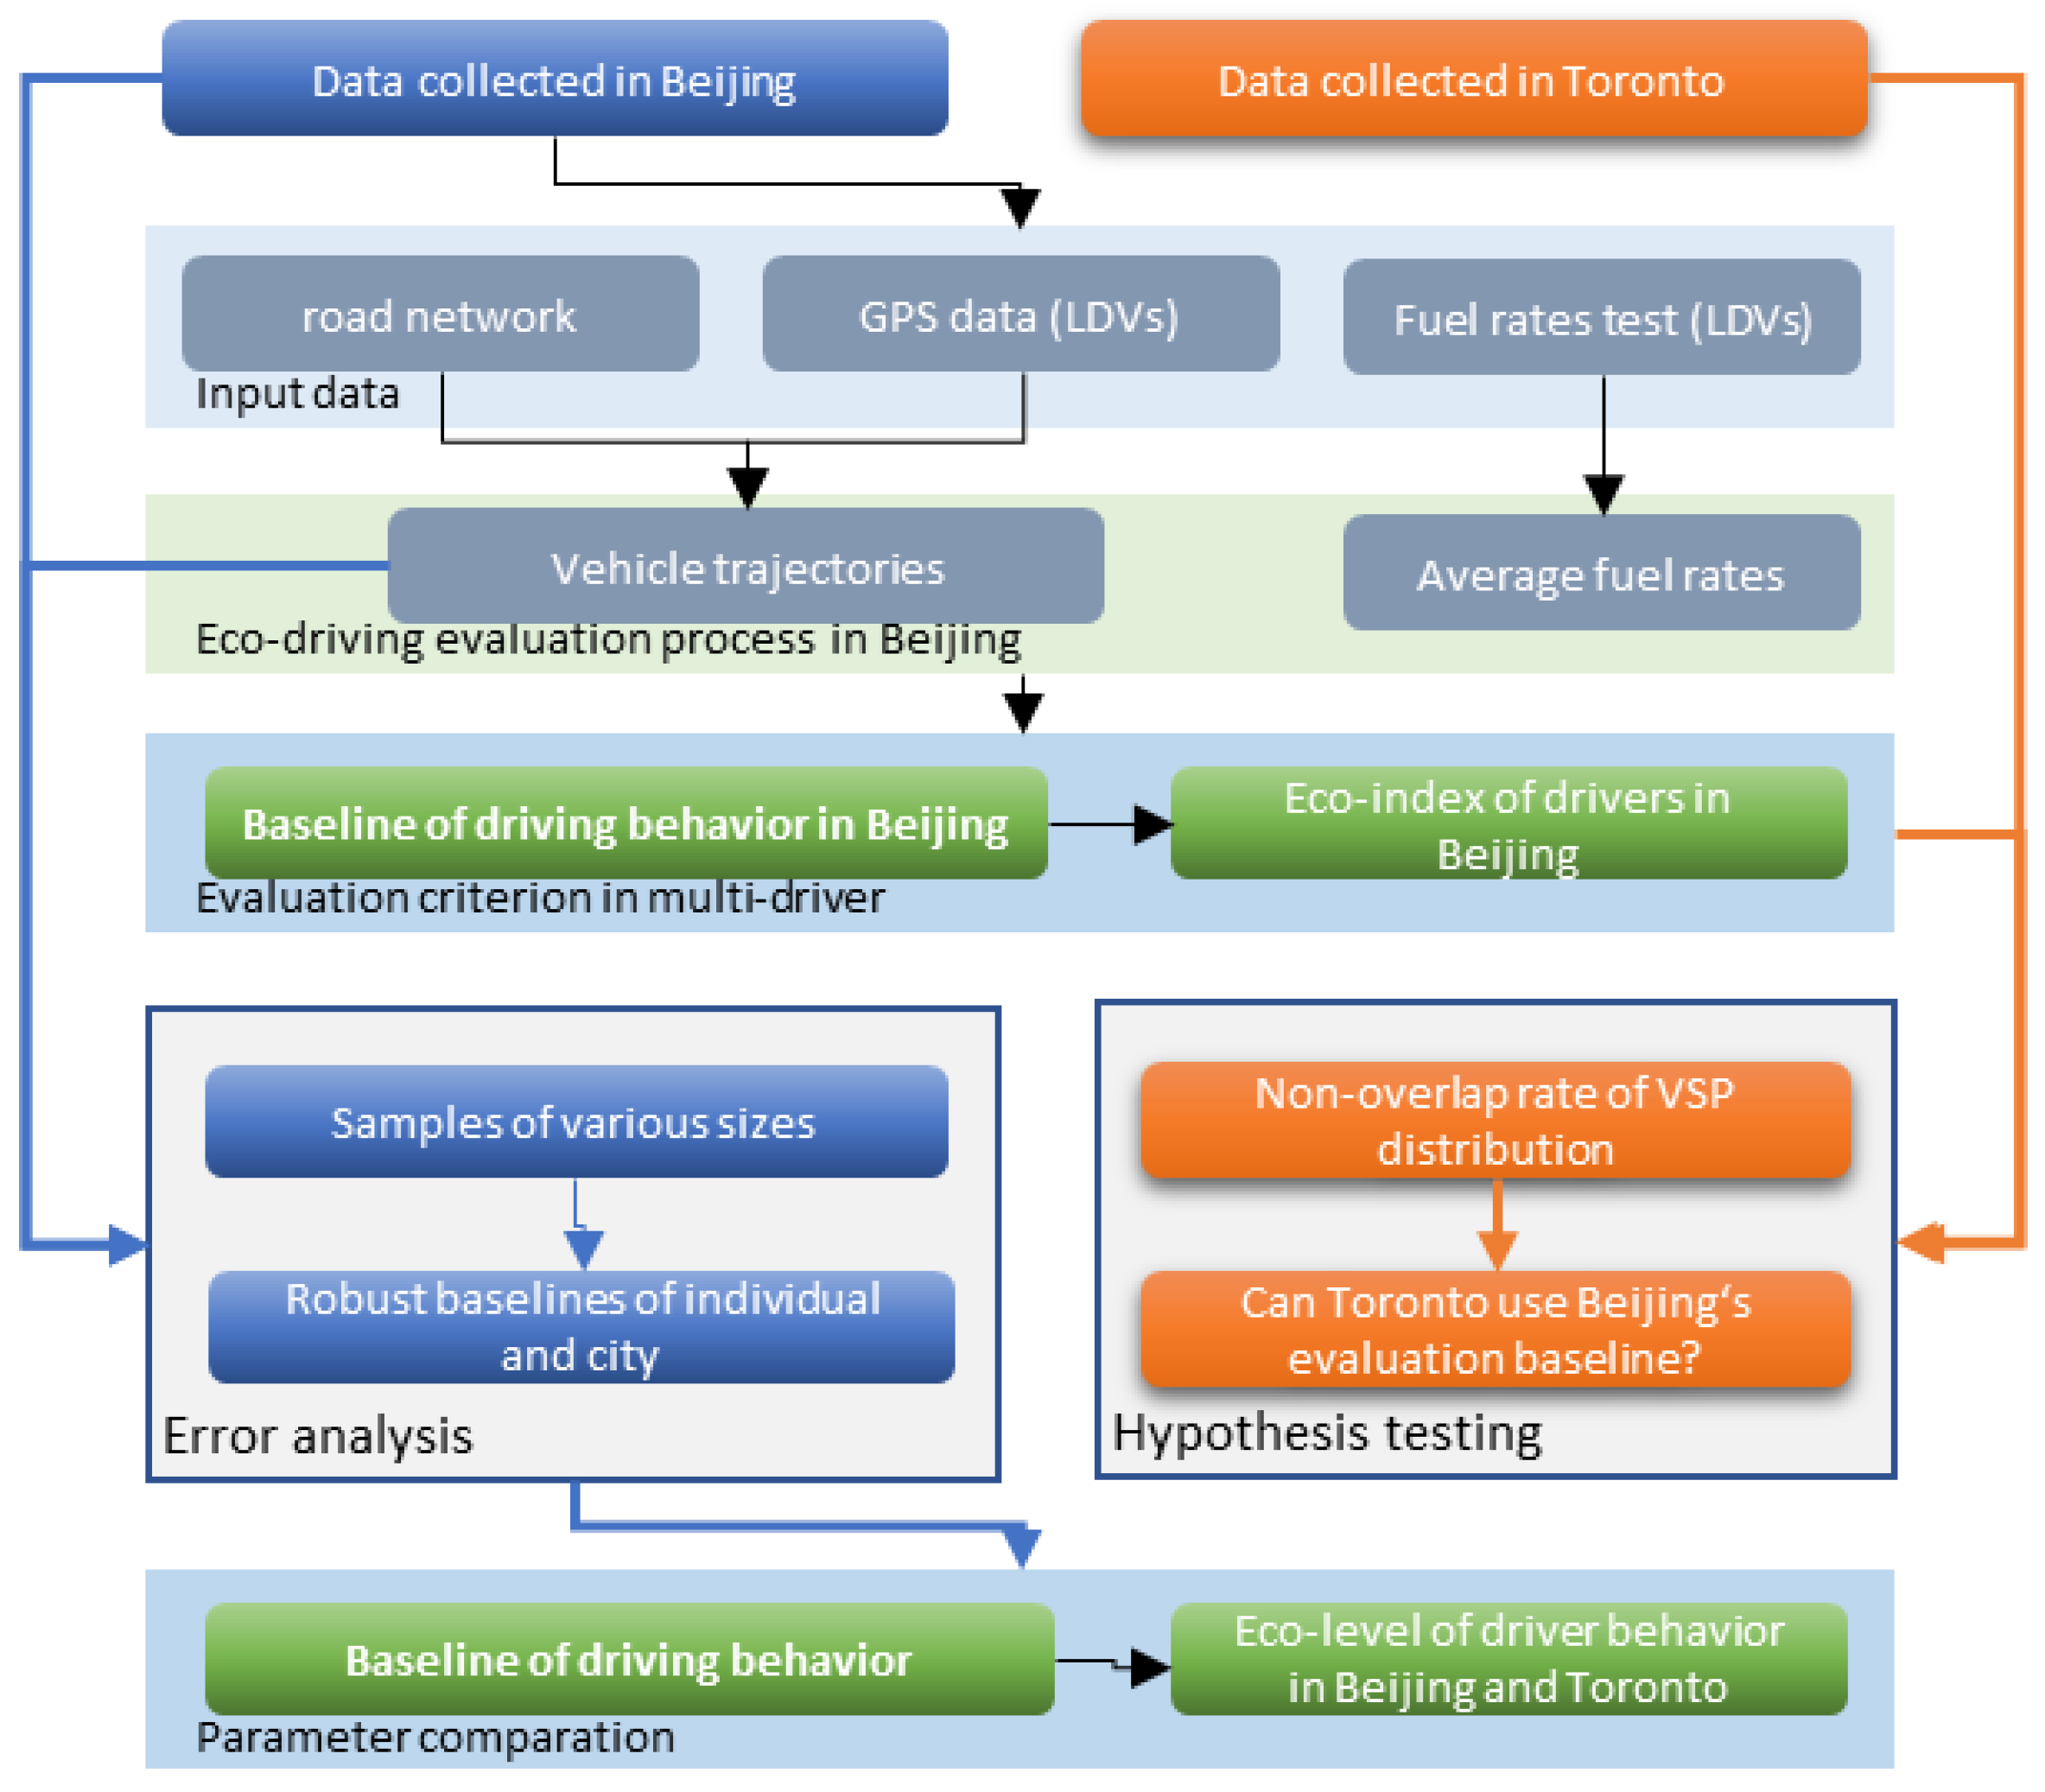
Figure 1. Study Framework.
Sustainability 17 03957 g001
Figure 2. Vehicle Trajectory Data in Beijing and Toronto Road Networks. (a) Beijing Road Network; (b) Toronto Road Network.
Sustainability 17 03957 g002
Figure 3. Framework of Developing the Baseline of Eco-Driving Evaluation Behavior.
Sustainability 17 03957 g003
Figure 4. The VSP Distributions on (a) Expressway (average speed from 0–100 km/h) and (b) Non-Expressway (average speed from 0–70 km/h).
Sustainability 17 03957 g004
Figure 5. Fuel Consumption Rates in −30 to 30 kW/ton VSP bins (33 different vehicle types with blue points and the average fuel rates with orange points).
Sustainability 17 03957 g005
Figure 6. Speed- and Facility-Specific Baseline of Fuel Rate per Time in Beijing (with 95% Confidence Interval).
Sustainability 17 03957 g006
Figure 7. (a) Comparison of Individual vs. Eco-Driving Baseline in Beijing on Expressways; (b) Comparison of Individual vs. Eco-Driving Baseline in Beijing on Non-Expressways.
Sustainability 17 03957 g007
Figure 8. Distributions of Speed on Expressways (speed from 0–100 km/h) and Non-Expressways (speed from 0–70 km/h) in Toronto and Beijing.
Sustainability 17 03957 g008
Figure 9. The Overlap of VSP Distributions in Different Speeds between Toronto and Beijing (Average Speed = 20, 40, 60 km/h).
Sustainability 17 03957 g009
Figure 10. Acceleration Distributions in Different Speeds between Toronto and Beijing (Average Speed = 20, 40, 60 km/h).
Sustainability 17 03957 g010
Figure 11. Comparison of Individual in Toronto vs. Eco-Driving Baseline in Beijing: (a) Expressways; (b) Non-expressways; (c) p-value of Expressways and Non-Expressways in Hypothesis Testing.
Sustainability 17 03957 g011
Figure 12. Comparison of Baseline between Beijing and Toronto: (a) Expressway; (b) Non-Expressway. (c) Comparison of FCR on Expressway and Non-Expressway between Beijing and Toronto.
Sustainability 17 03957 g012
Table 1. Trajectory Data Details in Beijing and Toronto.
BeijingToronto
Time spanJune 2018 and June 2019March through July 2018
Driver size19,77982
Sample sizeMore than 6 billion recordsMore than 30 million records
Sampling frequency1 Hz1 Hz
Table 2. 33 Vehicle Types for Collecting Fuel Consumption Test Data.
MakeModelVersionModel YearDisplacement
AudiA6L23032020142.0T
HondaCR-V0H2021F20171.5T
Odyssey0H3011H20152.4L
0H3011U20182.4L
Accord0H3082Y20152.0L
BuickGL80B2020W20142.4L
0B2021R20152.4L
0B2021Y20172.5L
Envision0B2090S20172.0T
Regal0B2030G20122.0L
Lacrosse0B2040V20132.4L
DodgeCaliber0U2070320102.0L
VolkswagenMagotan0X3050M20121.8T
0X3050X20131.8T
Passat0X2072R20151.8T
0X2072S20151.8T
0X2072T20151.8T
0X2073220161.8T
ToyotaRAV4Rongfang134010W20132.0L
Corolla134040620081.8L
Camry132020E20102.0L
FordKuga121070620132.0T
MazdaVI2O4011820152.0L
NissanLiwei2X1010A20101.6L
Tiida2X1060820111.6L
Teana2X1080Q20132.0L
2X1082920162.0L
SkodaHaoruiSupeob361030H20121.8T
HyundaiBeijingix353J1020O20132.0L
Langdong3J1030820131.6L
3J1030920131.6L
ChevroletCaptiva3K1040920142.4L
ChanganCS750L1060F20151.8T
Table 3. Division and Attributes in Different Driving Behavior Categories.
CategoryXdeltaFRDescriptionProportionAverage Fuel Consumption IncreaseRange in Category
1(−5.42, −3)(−0.0486, −0.0339)Very ecological0.14%−8.96%2.29%
2(−3, −2)(−0.0339, −0.0213)Very ecological2.28%−5.83%4.27%
3(−2, −1)(−0.0213, −0.0092)Ecological13.59%−3.19%3.13%
4(−1, 0)(−0.0092, 0.0034)Ordinary34.14%−0.69%2.87%
5(0, 1)(0.0034, 0.0182)Ordinary34.14%2.02%3.47%
6(1, 2)(0.0182, 0.0358)Aggressive13.59%5.20%4.39%
7(2, 3)(0.0358, 0.0587)Very aggressive2.28%9.00%5.44%
8(3, max)(0.0587, +∞)Very aggressive0.14%13.95%8.07%
Total(−5.42, max)(−0.0486, +∞) 100%
Table 4. Non-Overlap Rate of VSP Distribution in Toronto and Beijing.
Average Speed (km/h)2030405060
Non-expressways23.65%21.82%15.62%12.71%16.42%
Expressways10.32%20.64%21.97%24.45%36.59%
Table 5. Percentage of Fuel Consumption Rates of Sampled Drivers in 25–60 km/h with Baseline Error < 2.5% for Different Road Types.
Number of Sample Drivers (x=)1030506070757880100400
R x (Expressways)5%57%78%82%88%86%91%93%99%100%
R x (Non-Expressways)37%92%96%99%100%100%100%100%100%100%
Disclaimer/Publisher’s Note: The statements, opinions and data contained in all publications are solely those of the individual author(s) and contributor(s) and not of MDPI and/or the editor(s). MDPI and/or the editor(s) disclaim responsibility for any injury to people or property resulting from any ideas, methods, instructions or products referred to in the content.