1. Introduction
The increasing frequency, scale, and complexity of disasters pose significant challenges to global resilience and disaster management strategies. Climate change, rapid urbanization, and socio-economic disparities exacerbate vulnerabilities, leading to unprecedented human and economic losses. Over the past two decades, disasters have caused over 1.23 million deaths and affected 4.2 billion people globally, resulting in economic damages exceeding USD 2.97 trillion [
1]. Despite the availability of vast amounts of disaster-related data, current risk assessment frameworks remain fragmented, with critical gaps in integrating disaster severity, geographic susceptibility, economic resilience, media influence, and casualty outcomes.
A major concern in disaster research is the media bias in disaster reporting, which influences public perception and policy responses. Certain disasters, such as hurricanes and earthquakes, receive extensive coverage, while slower-onset crises, such as droughts and localized floods, remain under-represented. This disproportionate media attention skews disaster relief efforts, funding allocation, and long-term resilience planning [
2]. Additionally, while economic resilience is considered a key determinant of disaster outcomes, its precise impact on mitigating disaster-related mortality remains unclear. Wealthier nations often recover faster due to better infrastructure and emergency response systems, but the extent to which economic strength influences fatality reduction has not been systematically quantified.
To address these gaps, this study presents an AI-enhanced disaster intelligence framework that leverages open-source news data (e.g., BBC, CNN, NDTV, India Times, etc. in multiple languages covering multiple regions), GPT-based classification, and geospatial analytics to assess the interdependencies among key disaster-related variables. The research investigates five core hypotheses: (1) the severity and type of disasters significantly correlate with casualty rates, (2) geographic susceptibility strongly predicts disaster impact, (3) media coverage disproportionately favors certain disasters, leading to bias in response efforts, (4) economic resilience mitigates disaster-related fatalities and injuries, and (5) AI-based classification improves disaster categorization and impact prediction.
To test these hypotheses, a dataset of 19,130 disaster reports, spanning September 2023 to March 2025, covering 17 disaster types across 94 countries, was analyzed using AI-driven disaster classification (using GPT 3.5 Turbo Model), statistical modeling, and geospatial analysis. The empirical findings of this study reveal that disaster impact is governed by a constellation of interdependent factors, with severity acting as only one of several explanatory variables. Statistical analysis confirmed a weak but significant positive correlation between disaster severity and casualties (, ), suggesting that severity alone does not sufficiently account for human loss. Geographic susceptibility, measured by average severity per country, exhibited a moderate correlation with casualty patterns (, ), affirming the critical role of spatial vulnerability in shaping disaster outcomes. Media analysis demonstrated pronounced amplification bias: hurricanes received the highest number of articles (5599), whereas earthquakes, despite causing over three million deaths across 2353 events, were comparatively under-reported. This divergence highlights structural asymmetries in informational visibility. Economic resilience, operationalized via GDP per capita, showed a modest inverse relationship with fatalities (, ), indicating that financial capacity can mitigate, but not eliminate, human losses. Temporal trend analysis further revealed a marked increase in monthly disaster frequency (slope , ), although average severity remained stable or slightly declined (, ). Finally, the GPT-3.5 Turbo model employed for disaster classification achieved an average F1-score of approximately 0.91 across six major disaster types. These results collectively underscore the viability of using AI-structured, open-access media data to generate timely, scalable, and empirically grounded disaster intelligence.
Traditional disaster research has predominantly relied on structured datasets curated by governmental and intergovernmental bodies, such as EM-DAT, OFDA/CRED, DesInventar, and the United Nations Office for Disaster Risk Reduction (UNDRR) [
3]. While these datasets offer historical breadth and validation rigor, they often suffer from limitations in spatial granularity, temporal responsiveness, categorical richness, and, in many cases, accessibility. This study presents a departure from that paradigm by demonstrating how publicly accessible news media—when processed via AI-powered services such as the GPT-3.5 Turbo model—can serve as a robust and sustainable alternative for disaster data aggregation and hypothesis evaluation. Specifically, the study empirically shows how unstructured news articles from 453 global sources were transformed into a structured, multi-variable dataset capable of supporting multi-hypothesis testing. This approach offers not only greater scalability and real-time responsiveness but also democratizes access to disaster intelligence, thereby contributing to a more inclusive and agile research infrastructure. While the current study focuses on natural disaster contexts, the methodological pipeline proposed herein is adaptable to a wide array of scientific domains, paving the way for more sustainable and decentralized empirical inquiry.
This research makes the following significant contributions to the field of disaster intelligence and AI-driven risk assessment:
New Disaster Dataset: This study generated a novel dataset by aggregating and analyzing News from 453 online portals like BBC, CNN, CNBC, NDTV, etc., from 27 September 2023 to 28 March 2025 in an autonomous, AI-driven, and sustainable manner. The AI-driven process yielded 19,130 disaster-related news articles in over 10 languages, from which structured data (i.e., 9 fields), such as disaster type, location, casualties, and severity, were extracted. The resulting dataset has been made publicly available at
https://github.com/DrSufi/DisasterHypothesis, (accessed on 15 April 2025).
Sustainable Approach Towards Hypothesis Testing: This study introduces a sustainable methodology for hypothesis testing by leveraging automated news data collection. Unlike previous research that utilized natural disaster event datasets, questionnaires, surveys, crowd-sourced data, or social media events [
4,
5,
6,
7,
8], this approach demonstrates the feasibility of employing news media data gathered autonomously through AI-driven techniques for hypothesis testing.
Empirical Quantification of Media Bias: First large-scale empirical study demonstrating how media coverage skews disaster response efforts, revealing a significant reporting bias favoring hurricanes over more fatal disasters such as earthquakes.
Economic and Geographic Resilience Modeling: Statistical analysis confirming that geographic susceptibility is a stronger predictor of disaster casualties than economic resilience, challenging conventional assumptions in disaster economics.
By bridging the gaps in disaster risk assessment, media bias quantification, and GPT-based disaster classification, this study contributes to the advancement of disaster intelligence methodologies, providing actionable insights for policymakers, emergency response agencies, and humanitarian organizations.
2. Contextual Background
The rapid escalation in both the frequency and severity of disasters has necessitated an advanced, data-driven approach to disaster intelligence. Conventional methodologies, which heavily rely on manual assessment and proprietary disaster reporting systems, often suffer from biases, delays, and limited scalability. Consequently, the emergence of AI-enhanced open-source disaster intelligence (OSDI) has transformed disaster monitoring, prediction, and response by leveraging publicly available datasets, machine learning models, and computational analytics. This section critically examines the evolution of disaster intelligence, emphasizing its significance, methodological advancements, data requisites, and challenges.
2.1. Significance of AI-Driven Open-Source Disaster Intelligence
The significance of AI-enhanced open-source disaster intelligence lies in its potential to democratize disaster data access and enhance decision-making for a wide range of stakeholders, including governmental agencies, non-governmental organizations (NGOs), researchers, and the general public. Unlike proprietary disaster intelligence systems, open-source frameworks facilitate collaborative disaster assessment and response while ensuring transparency and accessibility.
Recent research highlights the integration of AI techniques such as natural language processing (NLP), deep learning, and geospatial analytics in disaster intelligence. Studies such as Ref. [
2] demonstrate how AI-based models can classify disasters from news articles, extract critical metadata, and enhance situational awareness. The incorporation of AI-driven classification has also been shown to improve disaster detection accuracy, particularly in real-time scenarios where human-driven assessments are prone to errors and delays [
9]. Additionally, AI-enhanced systems enable the fusion of multimodal data sources, such as satellite imagery, social media streams, and historical disaster archives, to develop predictive models for assessing disaster risks across different geographic regions.
2.2. Methodological Advancements in AI-Driven Disaster Intelligence
AI methodologies have significantly enhanced disaster classification, response optimization, and risk prediction. Recent developments include transformer-based models for text classification, convolutional neural networks (CNNs) for image-based disaster analysis, and recurrent neural networks (RNNs) for time-series forecasting of disaster trends.
Ref. [
10] introduced deep neural network architectures for real-time disaster monitoring, demonstrating the capability of AI to reduce response latency. Meanwhile, Ref. [
11] proposed bidirectional attention models to classify multimodal disaster-related tweets, illustrating the potential of AI in disaster communication and misinformation detection. Ref. [
12] further emphasized the power of multimodal fusion models that integrate textual and visual data to improve disaster intelligence outcomes.
The application of AI extends beyond classification and includes predictive disaster analytics. Ref. [
13] developed a novel probabilistic modeling framework that integrates AI-based simulations with real-world disaster metadata, enhancing impact prediction models. Similarly, Ref. [
14] introduced AI-based geospatial disaster tracking, demonstrating how transformer architectures can be employed to refine disaster localization and severity estimation.
2.3. Data Requirements for AI-Based Disaster Intelligence
The effectiveness of AI-driven disaster intelligence depends on the availability, quality, and integration of diverse datasets. Key sources of disaster intelligence include:
News Articles and Social Media Data: Real-time disaster event reports extracted from open-source news repositories and social platforms provide immediate situational awareness [
15].
Geospatial and Sensor Data: Earth observation satellite imagery and Internet of Things (IoT) sensor data enhance AI-based modeling of disaster evolution and impact [
16].
Economic and Infrastructure Data: Metrics such as GDP per capita, transportation network robustness, and healthcare accessibility provide insights into economic resilience against disasters [
17].
Historical Disaster Archives: Publicly available datasets such as NASA’s Global Landslide Catalog serve as training data for AI models, improving disaster classification and prediction accuracy [
18].
The integration of these heterogeneous data sources enables AI models to assess disaster risks with greater precision. Ref. [
19] highlights the need for systematic academic repositories to facilitate the curation and validation of open-access disaster data.
2.4. Challenges and Ethical Considerations
Despite its advantages, AI-driven open-source disaster intelligence faces several limitations:
Data Credibility and Bias: AI models are susceptible to biases in disaster reporting, especially in cases where media coverage is disproportionate across disaster types or regions [
2].
Algorithmic Hallucinations: Transformer-based AI models may generate misleading or false disaster classifications, particularly in low-resource language settings [
20].
Privacy and Ethical Concerns: The use of open-source social media data in disaster intelligence raises concerns regarding user privacy and misinformation propagation [
21].
To mitigate these challenges, ongoing research emphasizes the development of bias-aware AI models, multilingual disaster analytics frameworks, and ethical AI guidelines for disaster data usage [
22]. The incorporation of explainable AI (XAI) techniques can further enhance trust and interpretability in disaster intelligence systems.
2.5. Towards a Unified AI-Based Disaster Intelligence Framework
Building upon the existing body of research, this study aims to develop a comprehensive AI-driven disaster intelligence framework that integrates:
AI-enhanced disaster classification for improved situational awareness.
Economic and geospatial resilience modeling for impact assessment.
Media bias quantification to analyze disparities in disaster coverage.
Predictive modeling for real-time disaster risk assessment.
By systematically integrating these components, this research contributes to the advancement of AI-based disaster intelligence methodologies, providing policymakers and emergency responders with robust, data-driven insights for effective disaster management.
This contextual background lays the foundation for the conceptual model presented in the next section, which formalizes the relationships between disaster severity, geographic susceptibility, economic resilience, media influence, and AI-driven classification.
3. Conceptual Model
The conceptual framework underlying this study is grounded in interdisciplinary perspectives from disaster risk science, environmental communication, and resilience theory. It aims to elucidate the interdependencies between structural vulnerabilities, event-specific characteristics, and post-disaster human outcomes within a dynamic global risk environment increasingly characterized by environmental volatility and informational asymmetry.
At its core, the model theorizes that disaster outcomes—most notably, casualty levels—are not merely a function of the physical magnitude of events, but also the product of layered and interacting factors, including geographic susceptibility, media representation, national economic capacity, and the temporal evolution of disaster frequency. This framework integrates and extends multiple theoretical traditions. First, drawing from the hazards-of-place model [
23], it recognizes that disaster impacts are spatially differentiated, shaped by both biophysical exposure and social vulnerability. Second, it builds on the political economy of disaster literature [
24], which asserts that systemic inequalities and institutional capacities play a determinative role in disaster risk outcomes. Third, it incorporates insights from the agenda-setting and framing traditions within communication studies [
25,
26], which emphasize how media selectively amplifies or obscures certain hazards, influencing public perception and policy responsiveness.
Notably, however, while these prior studies provide compelling theoretical insights and empirical contributions, none of them leverage real-time, publicly accessible news media as a primary data source for hypothesis testing. Much of the disaster risk literature remains dependent on structured datasets produced by governmental or intergovernmental bodies (e.g., EM-DAT, DesInventar, UNDRR), which are often limited in spatial granularity, temporal responsiveness, or categorical richness. In contrast, the current study introduces an alternative epistemological approach by systematically extracting structured metadata from over 19,000 news articles using large language models (LLMs), particularly OpenAI’s GPT-3.5. This method enables not only unprecedented timeliness and scalability but also a more sustainable, decentralized, and cost-effective mechanism for disaster data generation—an essential innovation in a context where global risk environments evolve faster than traditional monitoring systems can capture. The approach also aligns with recent calls for integrating “digital trace data” into disaster science to augment official statistics and reveal emergent risk patterns.
Based on these foundations, the model formally articulates five hypotheses. The first hypothesis (H1) posits that disaster type influences the severity of an event. Distinct hazard typologies (e.g., earthquakes, floods, wildfires) carry differing probabilities of infrastructural disruption and loss of life. Earthquakes, for instance, typically generate high-fatality outcomes due to their sudden onset and limited early warning capabilities, whereas floods may be less lethal but more spatially extensive. This heterogeneity in hazard mechanics suggests that the intrinsic type of disaster plays a primary role in shaping severity, consistent with empirical work on differential hazard lethality [
27].
The second hypothesis (H2) extends this argument by asserting that geographic susceptibility significantly modulates the impacts of disasters. Regions located in seismic belts, cyclone-prone coastal zones, or arid wildfire-prone landscapes are inherently more vulnerable. Moreover, local adaptive capacities—including land use planning, infrastructure quality, and environmental regulation—mediate how biophysical hazards translate into human losses. This is supported by global risk assessments from the United Nations Office for Disaster Risk Reduction [
1].
The third hypothesis (H3) considers the role of media coverage in shaping the representational landscape of disasters. Media systems are known to exhibit selective amplification, privileging events that are visually dramatic, geographically proximate to major audiences, or politically salient [
26]. This hypothesis contends that certain disaster types receive disproportionately high media attention relative to their actual human tolls, thereby distorting public understanding and potentially biasing emergency response priorities. Prior work by Boykoff and Boykoff [
25] has shown how journalistic norms of dramatization and event-based reporting lead to episodic, rather than structural, representations of risk.
The fourth hypothesis (H4) examines whether economic resilience attenuates disaster outcomes. Specifically, it posits that higher GDP per capita is inversely associated with fatality rates during disasters of comparable severity. This assumption is grounded in the disaster economics literature, which has consistently found that richer countries experience fewer deaths not because they are less exposed, but because they possess better building codes, emergency services, and health infrastructure [
3,
28]. The protective function of state capacity and infrastructure investment is therefore hypothesized to moderate the severity–fatality nexus.
The fifth and final hypothesis (H5) addresses the temporal dynamics of disaster frequency. It posits that the number of disaster events has significantly increased over the study period (September 2023 to March 2025), consistent with the observed rise in climate-induced extremes and compound hazard events, as documented by the Intergovernmental Panel on Climate Change [
29]. This hypothesis introduces a temporal dimension to the model, suggesting that the global disaster system is undergoing a structural transformation, with implications for cumulative vulnerability and systemic risk.
These five hypotheses are synthesized into a unified conceptual model (
Figure 1), which presents the theorized causal relationships among the core constructs: disaster type, severity, geographic susceptibility, media coverage, economic resilience, and casualty outcomes. Importantly, the model also incorporates a temporal escalation node, reflecting the role of increasing disaster frequency in reshaping both the hazard landscape and institutional response paradigms. Taken together, this conceptual architecture supports a multifactorial and temporally sensitive investigation of disaster outcomes using a uniquely large-scale, AI-enhanced media-derived dataset.
4. Mathematical Model
The mathematical model for disaster vulnerability analysis formalizes the relationships between disaster characteristics, geographic susceptibility, economic resilience, media influence, and casualty outcomes. This framework enables a quantitative assessment of disaster impact, prediction of casualties, and evaluation of factors affecting disaster response efficiency. The integration of AI-driven disaster classification further enhances the model’s predictive accuracy and real-time decision-making capacity.
4.1. Notation and Definitions
To establish a clear mathematical formulation, first we define the primary variables used in the model (as shown in
Table 1).
4.2. Disaster Impact and Casualty Estimation Model (H1, H2)
We model the total impact of a disaster as a function of its severity and geographic susceptibility:
The casualty rate is influenced by disaster severity, geographic susceptibility, and economic resilience:
where
represents the response efficiency of emergency services, which inversely affects the number of casualties.
4.3. Media Coverage Bias Model (H3)
Media attention given to a disaster is modeled based on severity and geographic location:
Alternatively, media coverage probability follows a logistic function:
4.4. Economic Resilience and Casualty Reduction Model (H4)
Economic resilience acts as a mitigating factor in disaster impact by improving emergency response and infrastructure readiness:
Higher economic resilience () reduces the severity of disaster consequences by increasing preparedness and response efficiency.
4.5. Temporal Escalation Model of Disaster Frequency and Severity (H5)
The temporal escalation of disaster frequency and severity is expected to influence the relative strength of the relationships defined in H1–H4. For instance, as disasters become more frequent, the effectiveness of economic resilience (H4) may diminish due to systemic strain, and media selectivity (H3) may become more pronounced. The following model captures this trend using time-indexed disaster frequency and severity.
To incorporate the temporal dynamics of disaster risk, we define a temporal frequency function representing the number of disasters observed at time t and a corresponding average severity function .
Let:
: Count of disasters at time t (e.g., month-wise or weekly).
: Mean severity score of disasters at time t.
t: Time index spanning the period from September 2023 to March 2025.
We model the trend in disaster frequency using linear regression:
where
captures the rate of increase in disaster frequency. A significantly positive
would confirm temporal escalation.
Similarly, the average disaster severity over time is modeled as:
where
would indicate an increasing trend in disaster intensity. The regression coefficients
and
are estimated using ordinary least squares (OLS). The statistical significance (
p-values) and goodness-of-fit (
R2) are reported in
Section 6.5, thereby empirically validating the hypothesized temporal escalation.
To detect structural shifts or non-linear patterns, a time-series decomposition can also be employed:
where
is the trend component,
is seasonality (if any), and
is the residual noise. To avoid confusion with previously defined severity scores (
), we denote the time-series decomposition components using script fonts.
An increasing over time would support the hypothesis (H5) that disaster activity is escalating due to underlying climatic or systemic volatility.
4.6. Optimization for Disaster Response Efficiency
Governments aim to minimize casualties by optimizing emergency response efficiency (
) and economic investments (
):
subject to the constraint:
Using Lagrange multipliers, we define the constrained optimization function:
These equations provide an optimal balance between economic investments and emergency response capacity.
The mathematical framework developed in this section formalizes the complex interactions among disaster severity, geographic risk, economic resilience, media influence, and AI-driven disaster classification. By integrating probabilistic models, optimization frameworks, and AI-enhanced prediction techniques, this model provides a robust foundation for disaster risk assessment and mitigation strategies. The subsequent sections validate these models using real-world disaster data.
5. Experimentation and Data
5.1. Data Collection and Processing
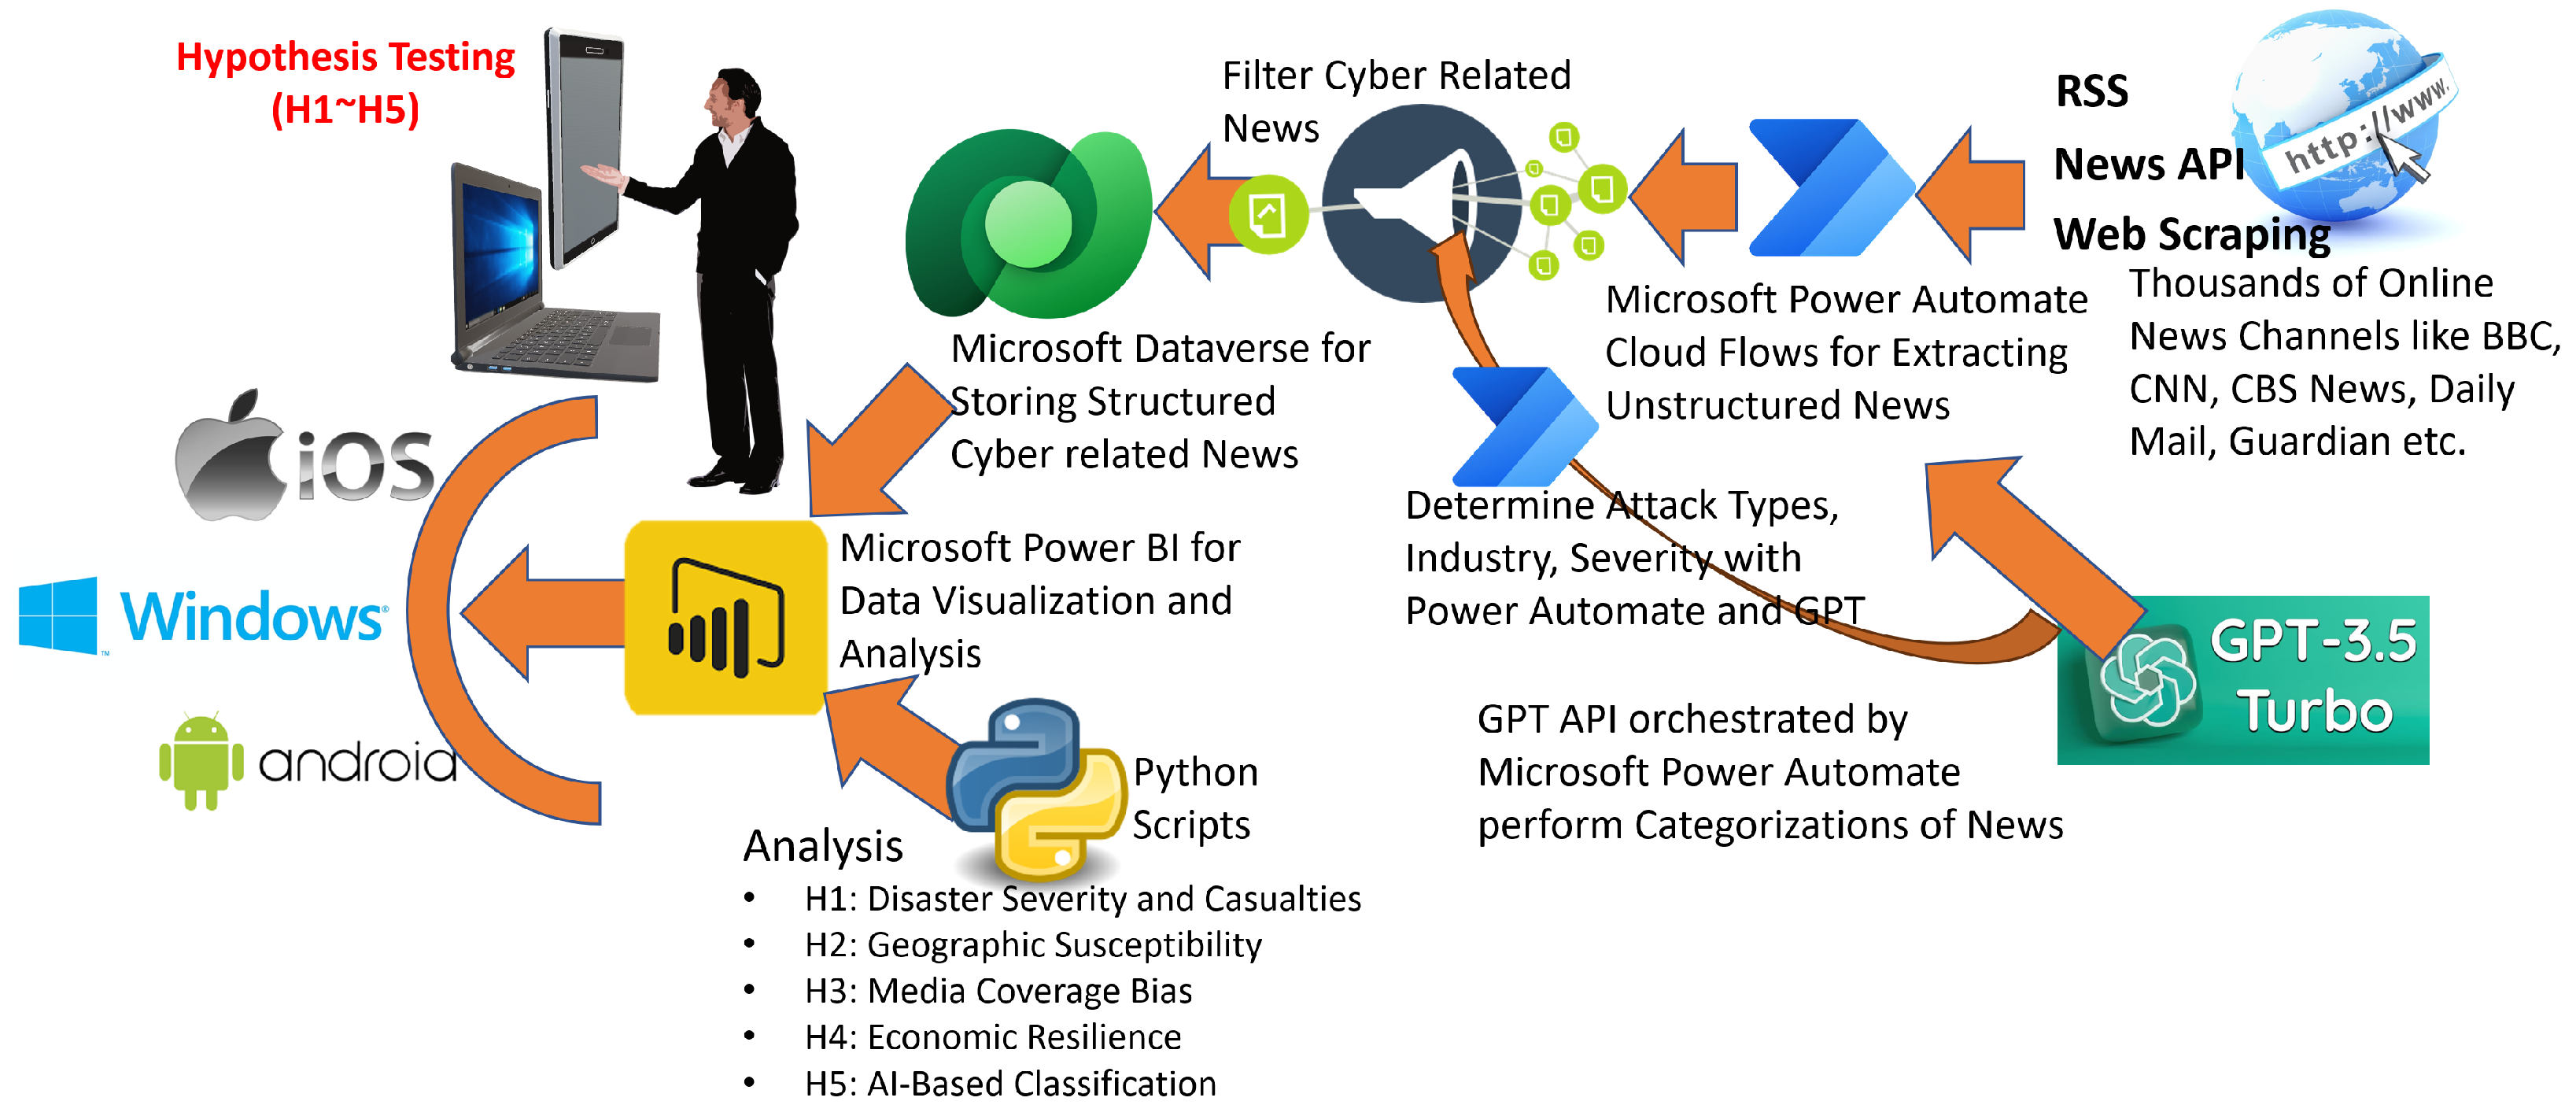
This study aggregates disaster-related news reports from multiple reputable news sources, including BBC, CNN, CNBC, India Times, NDTV, The Guardian, Daily Mail, and several others. The data were collected using Microsoft Power Automate, which automated the retrieval of news articles via RSS feeds, APIs, and web scraping. The initial dataset contained a broad spectrum of news articles, which required further filtering to extract disaster-specific content.
To ensure the dataset contained only relevant disaster reports, GPT-3.5 Turbo API was employed for news categorization. GPT-based classification was employed in this study over conventional machine learning approaches due to its superior contextual comprehension and multilingual processing capabilities. These attributes are essential given the study’s reliance on 453 news portals spanning diverse linguistic and geographic domains, including India, Turkey, China, Japan, the United States, the United Kingdom, Australia, and the Middle East. Unlike traditional models, GPT-3.5 Turbo demonstrates advanced semantic understanding across multiple languages, enabling consistent and accurate interpretation of heterogeneous news content. Recent evaluations further substantiate this choice, with GPT-3.5 Turbo achieving outstanding classification performance—Precision: 0.986, Recall: 0.987, and F1-Score: 0.987 [
30,
31]. The GPT model filtered out non-disaster-related content and classified disaster events into categories, such as
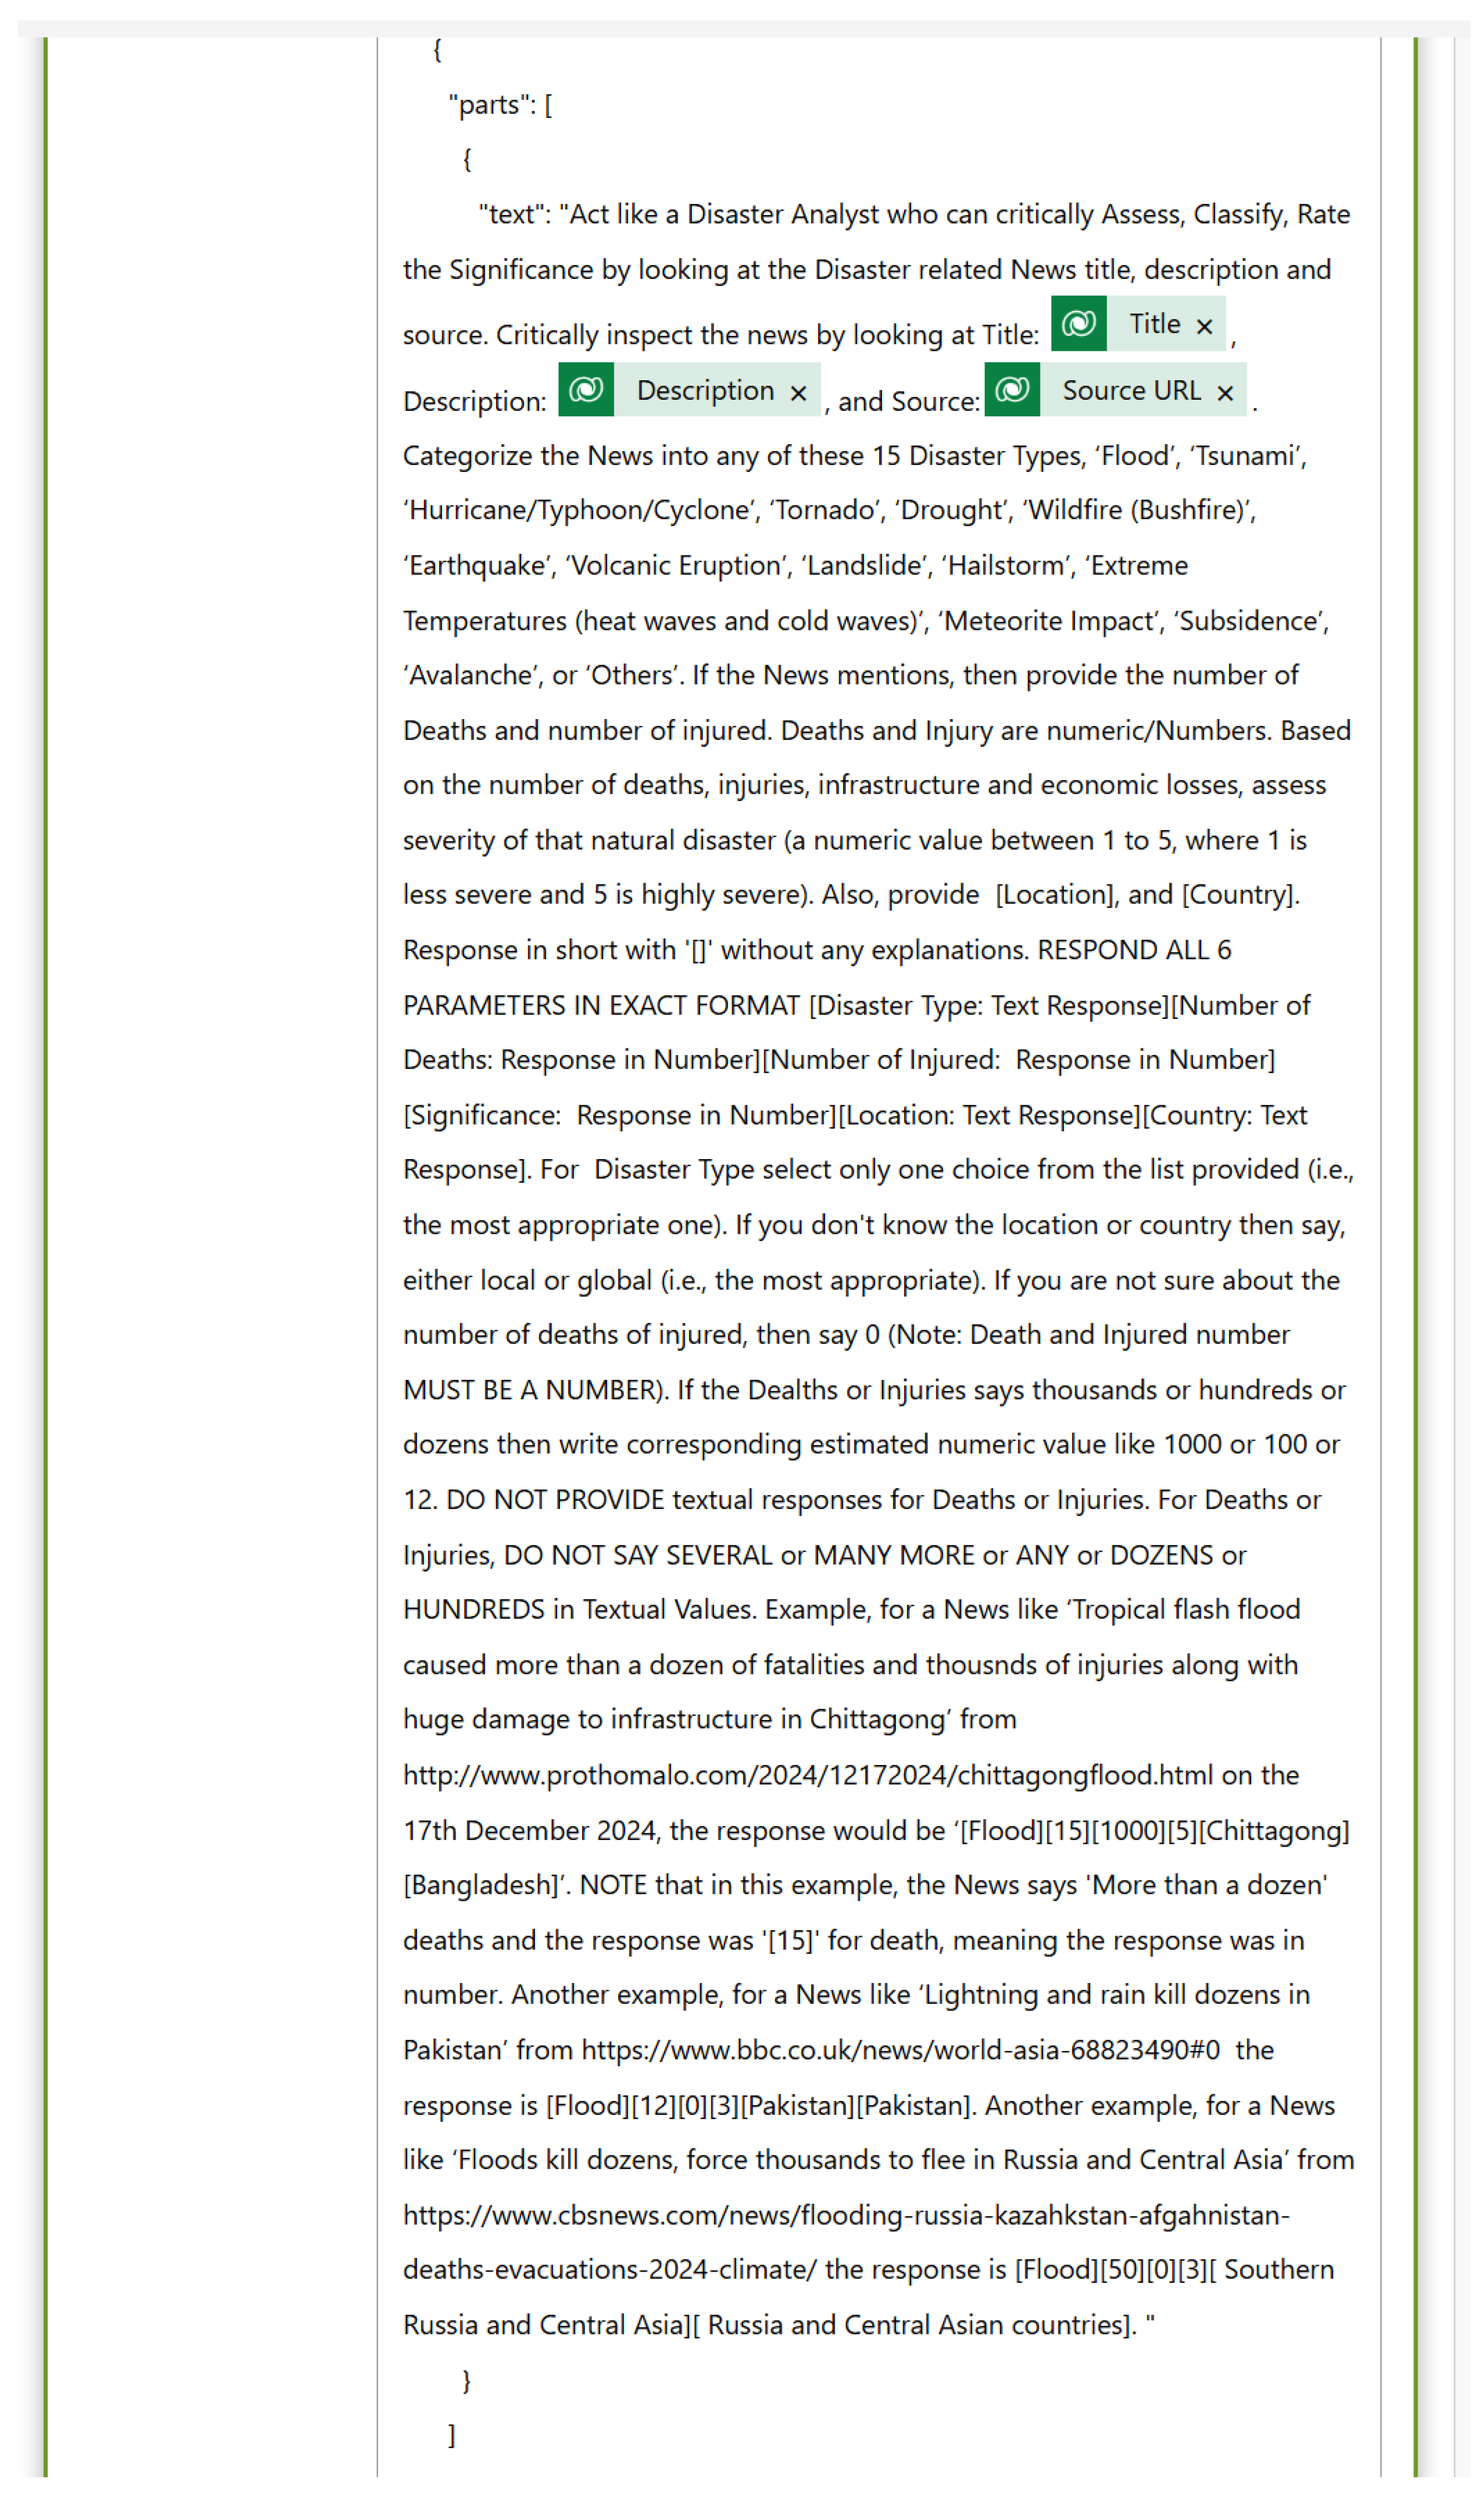
Hurricanes, Earthquakes, Floods, Wildfires, Tornadoes, Volcanic Eruptions, and more. The engineered prompt used for this process is clearly depicted in
Appendix A (
Figure A1). Furthermore, GPT was used to extract key metadata, including the following:
Disaster Type—Classification of the disaster event.
Number of Deaths and Injuries—Extracted casualty statistics.
Severity Score—A numerical scale indicating disaster intensity.
Location and Country—Geospatial identification of the disaster.
News Title, Date, and URL—Source information for reference.
The processed data were stored in
Microsoft Dataverse for structured storage and retrieval. For further analysis,
Microsoft Power BI was employed for data visualization and trend analysis, while
Python 3.11 within the Power BI environment was utilized for in-depth analysis for testing the hypotheses. The entire process is clearly illustrated in
Figure 2.
5.2. Dataset Overview and Statistics
The final dataset contains a total of 19,130 disaster-related news reports spanning September 2023 to March 2025. The dataset (publicly accessible at
https://github.com/DrSufi/DisasterHypothesis, accessed on 15 April 2025) includes the following:
Seventeen unique disaster types, ranging from natural calamities (e.g., earthquakes, hurricanes) to climate-related events (e.g., extreme temperatures, droughts).
Reports covering disasters from 94 countries, providing a global representation of disaster events.
Key metrics such as casualties, severity, and media coverage extracted and structured for statistical modeling.
The summary statistics of key variables, including total deaths, injuries, and severity scores, are presented in
Table 2.
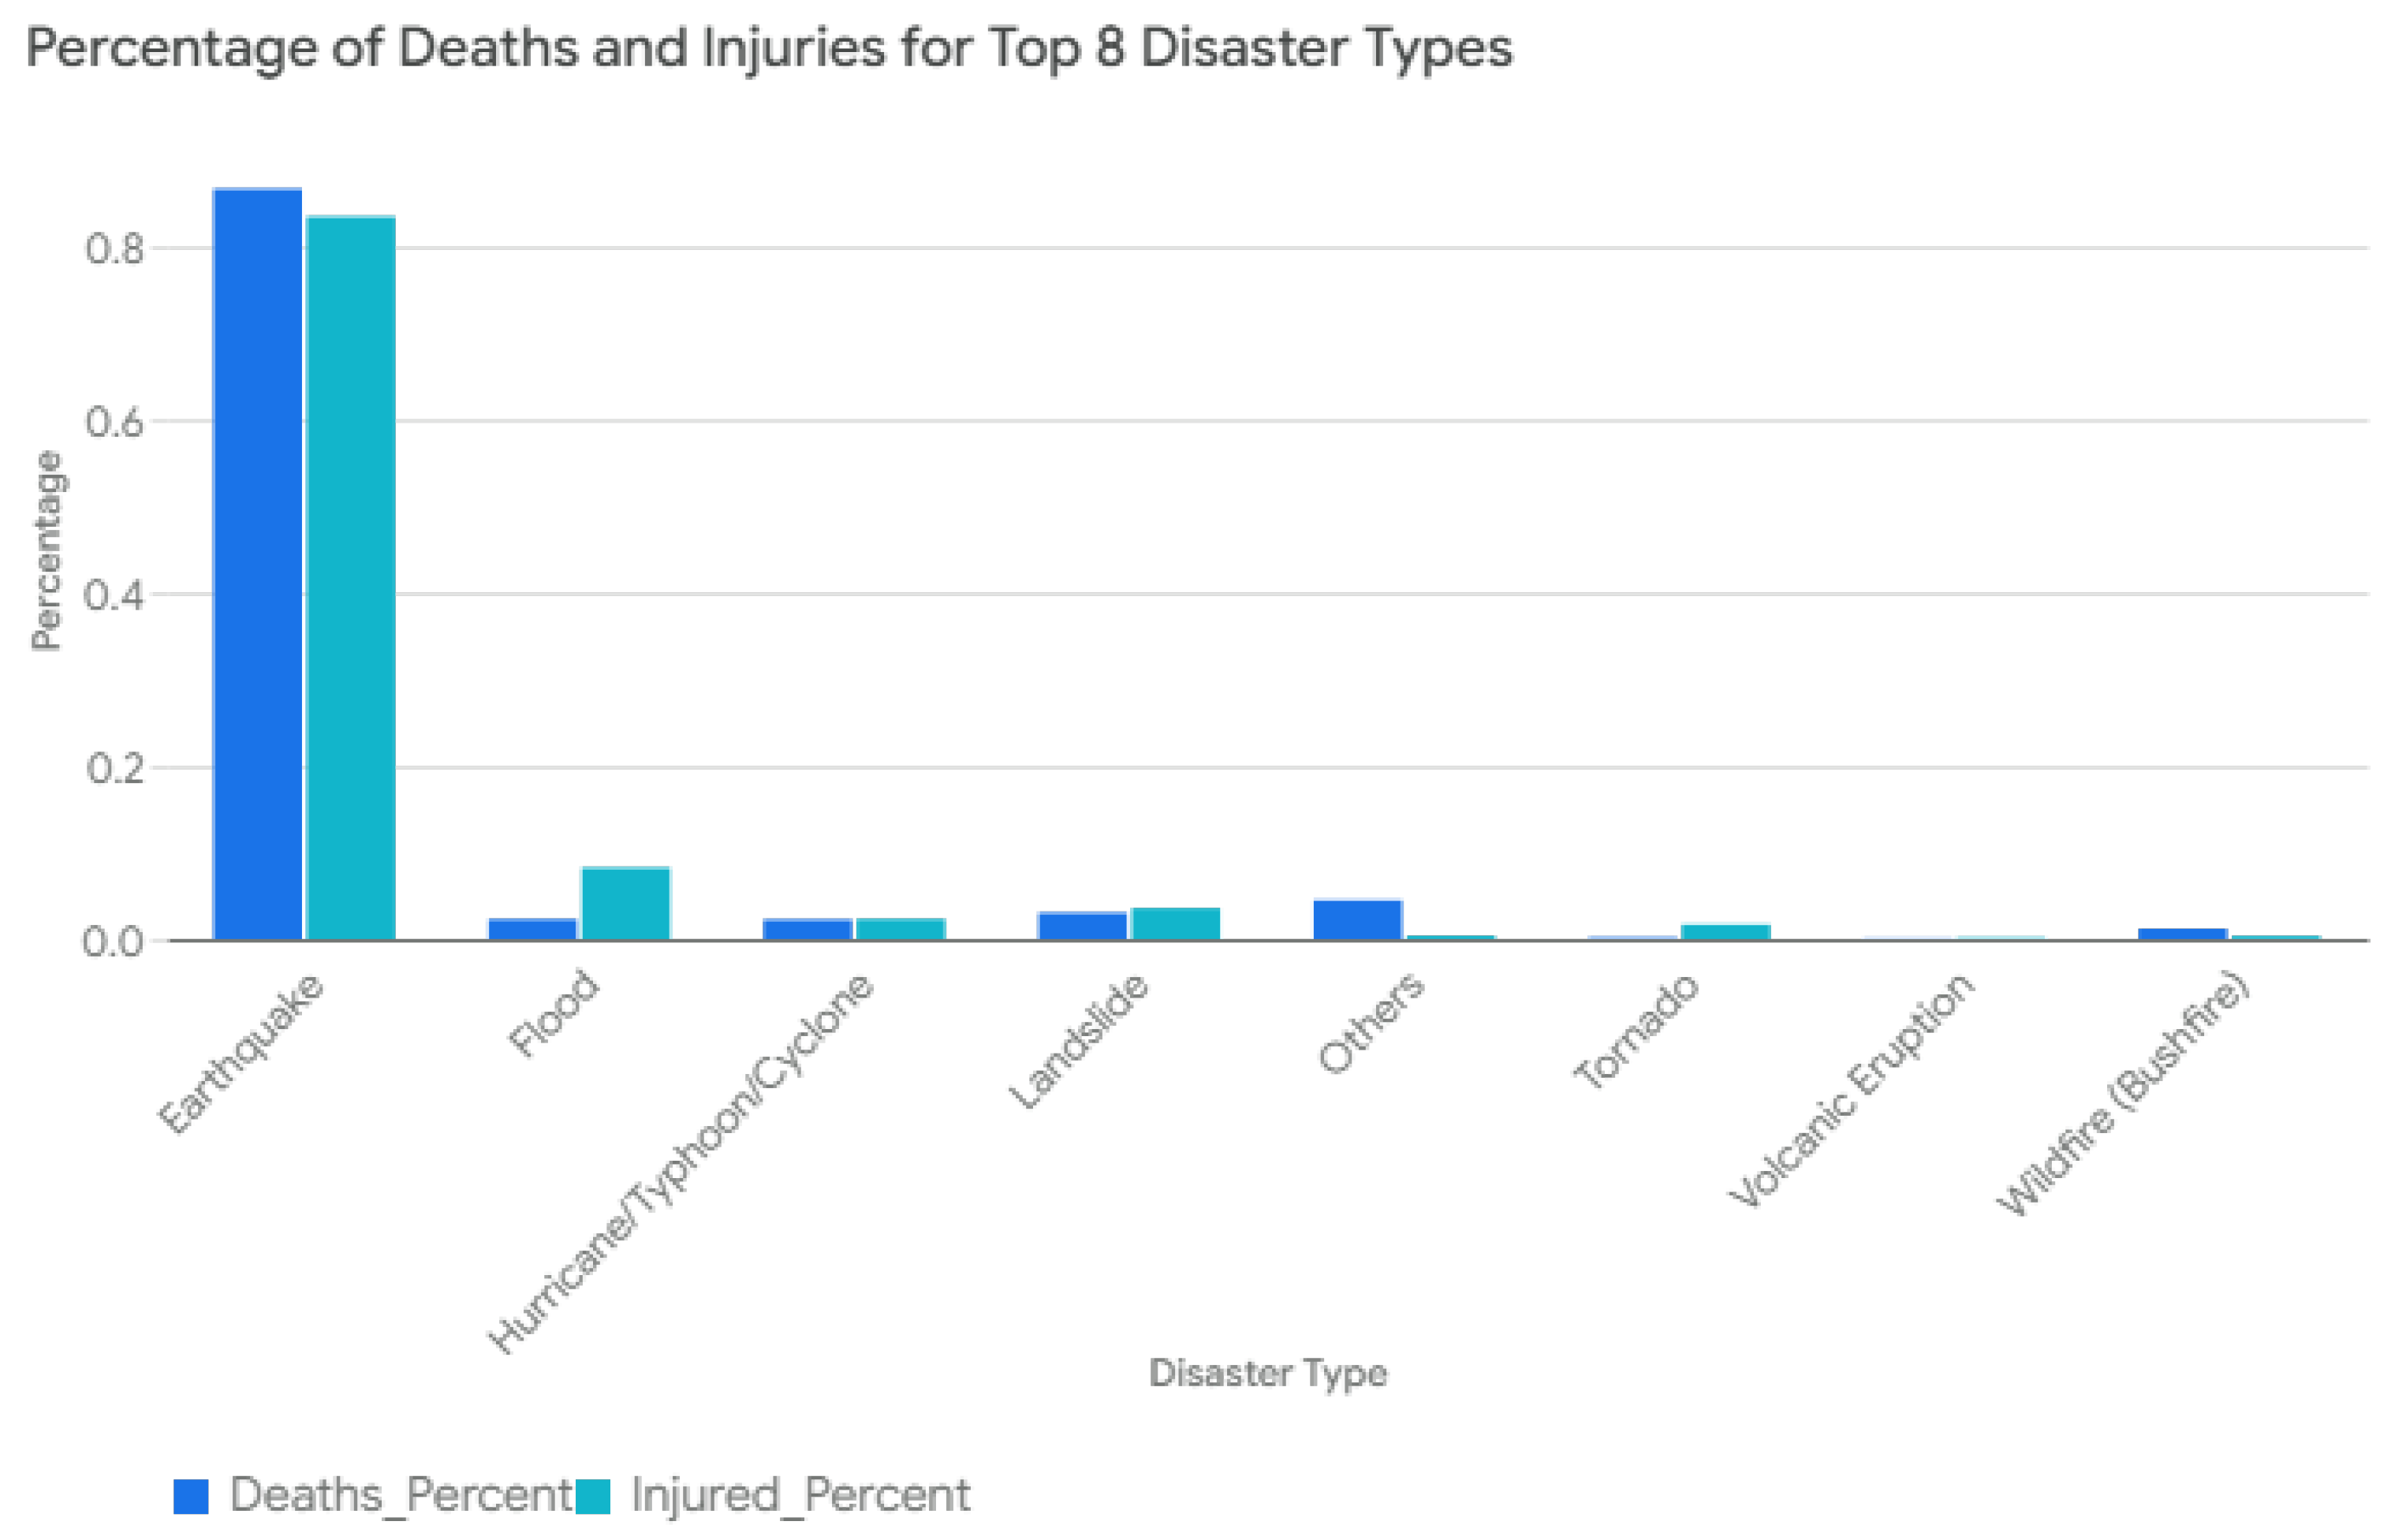
Figure 3 (i.e., grouped bar chart) shows the percentage of deaths and injuries for the top eight types of disasters. The percentages are plotted on the y-axis, and the disaster types are arranged in columns along the bottom. The chart allows for a comparison of how deaths and injuries are distributed in these major disaster categories. As seen from this figure, earthquakes account for the highest percentage of both deaths (89.33%) and injuries (86.58%). Floods contribute to a relatively small percentage of total deaths (2.34%) but a more significant percentage of injuries (8.54%).
5.3. Analysis Environment
The analysis was conducted using Python 3.11 within Microsoft Power BI, utilizing pandas for data manipulation, matplotlib and seaborn for visualization, and scipy.stats for statistical validation. This robust analytical environment allowed for a detailed assessment of the dataset, ensuring accuracy and reliability in hypothesis testing.
5.4. Relevance to Hypothesis Validation
The curated dataset provided a rich basis for empirically validating each of the five hypotheses articulated in the conceptual model. By integrating structured metadata from 19,130 news-derived disaster records, we applied statistical and temporal modeling techniques to test each relationship. The hypotheses and their operationalization strategies are detailed as follows:
H1: Disaster Severity and Casualties—Disasters were grouped by type, and severity scores were statistically correlated with recorded fatalities and injuries. Pearson correlation coefficients and one-way ANOVA tests were used to assess whether higher severity scores () systematically corresponded to higher casualty rates (), controlling for event type.
H2: Geographic Susceptibility—Location-based aggregation was performed to evaluate whether certain geographies—such as seismic zones or cyclone belts—exhibited systematically higher human impacts. Average severity and total casualties were computed for each region and mapped geospatially.
H3: Media Coverage Bias—Media amplification was modeled using the number of distinct articles per event () and normalized against the casualty burden of that event. The bias index was derived by comparing high-casualty disasters receiving low coverage (e.g., earthquakes) with low-casualty events receiving high coverage (e.g., hurricanes), supported by entropy analysis of source diversity.
H4: Economic Resilience—GDP per capita data were merged with the disaster dataset by country. A regression analysis was performed where fatalities () were regressed against severity () and GDP per capita (), validating whether economic resilience moderated the severity–impact relationship.
H5: Temporal Escalation of Disaster Frequency and Severity—All disaster records were timestamped and aggregated into monthly bins. To avoid inflation caused by duplicate event reporting across portals, a deduplication algorithm merged disasters sharing type, location, and date. Two time series—monthly event count () and mean severity ()—were then constructed. Linear regression and seasonal-trend decomposition (STL) were employed to model escalation. Significant upward slopes in and provided empirical support for H5.
This hypothesis-driven modeling pipeline demonstrates that publicly accessible news media—when rigorously structured and analyzed—can be used not only for classification but also for complex inferential tasks such as causal modeling and trend analysis in disaster science (as shown in
Figure 4).
6. Results and Analysis
This section presents the empirical findings of the study, testing the formulated hypotheses based on real-world disaster data. The results provide insights into the relationships between disaster severity, geographic susceptibility, economic resilience, media coverage, and AI-based disaster classification. Various statistical methods, correlation analyses, and visualization techniques have been employed to systematically validate each hypothesis.
6.1. H1: Disaster Severity and Casualties
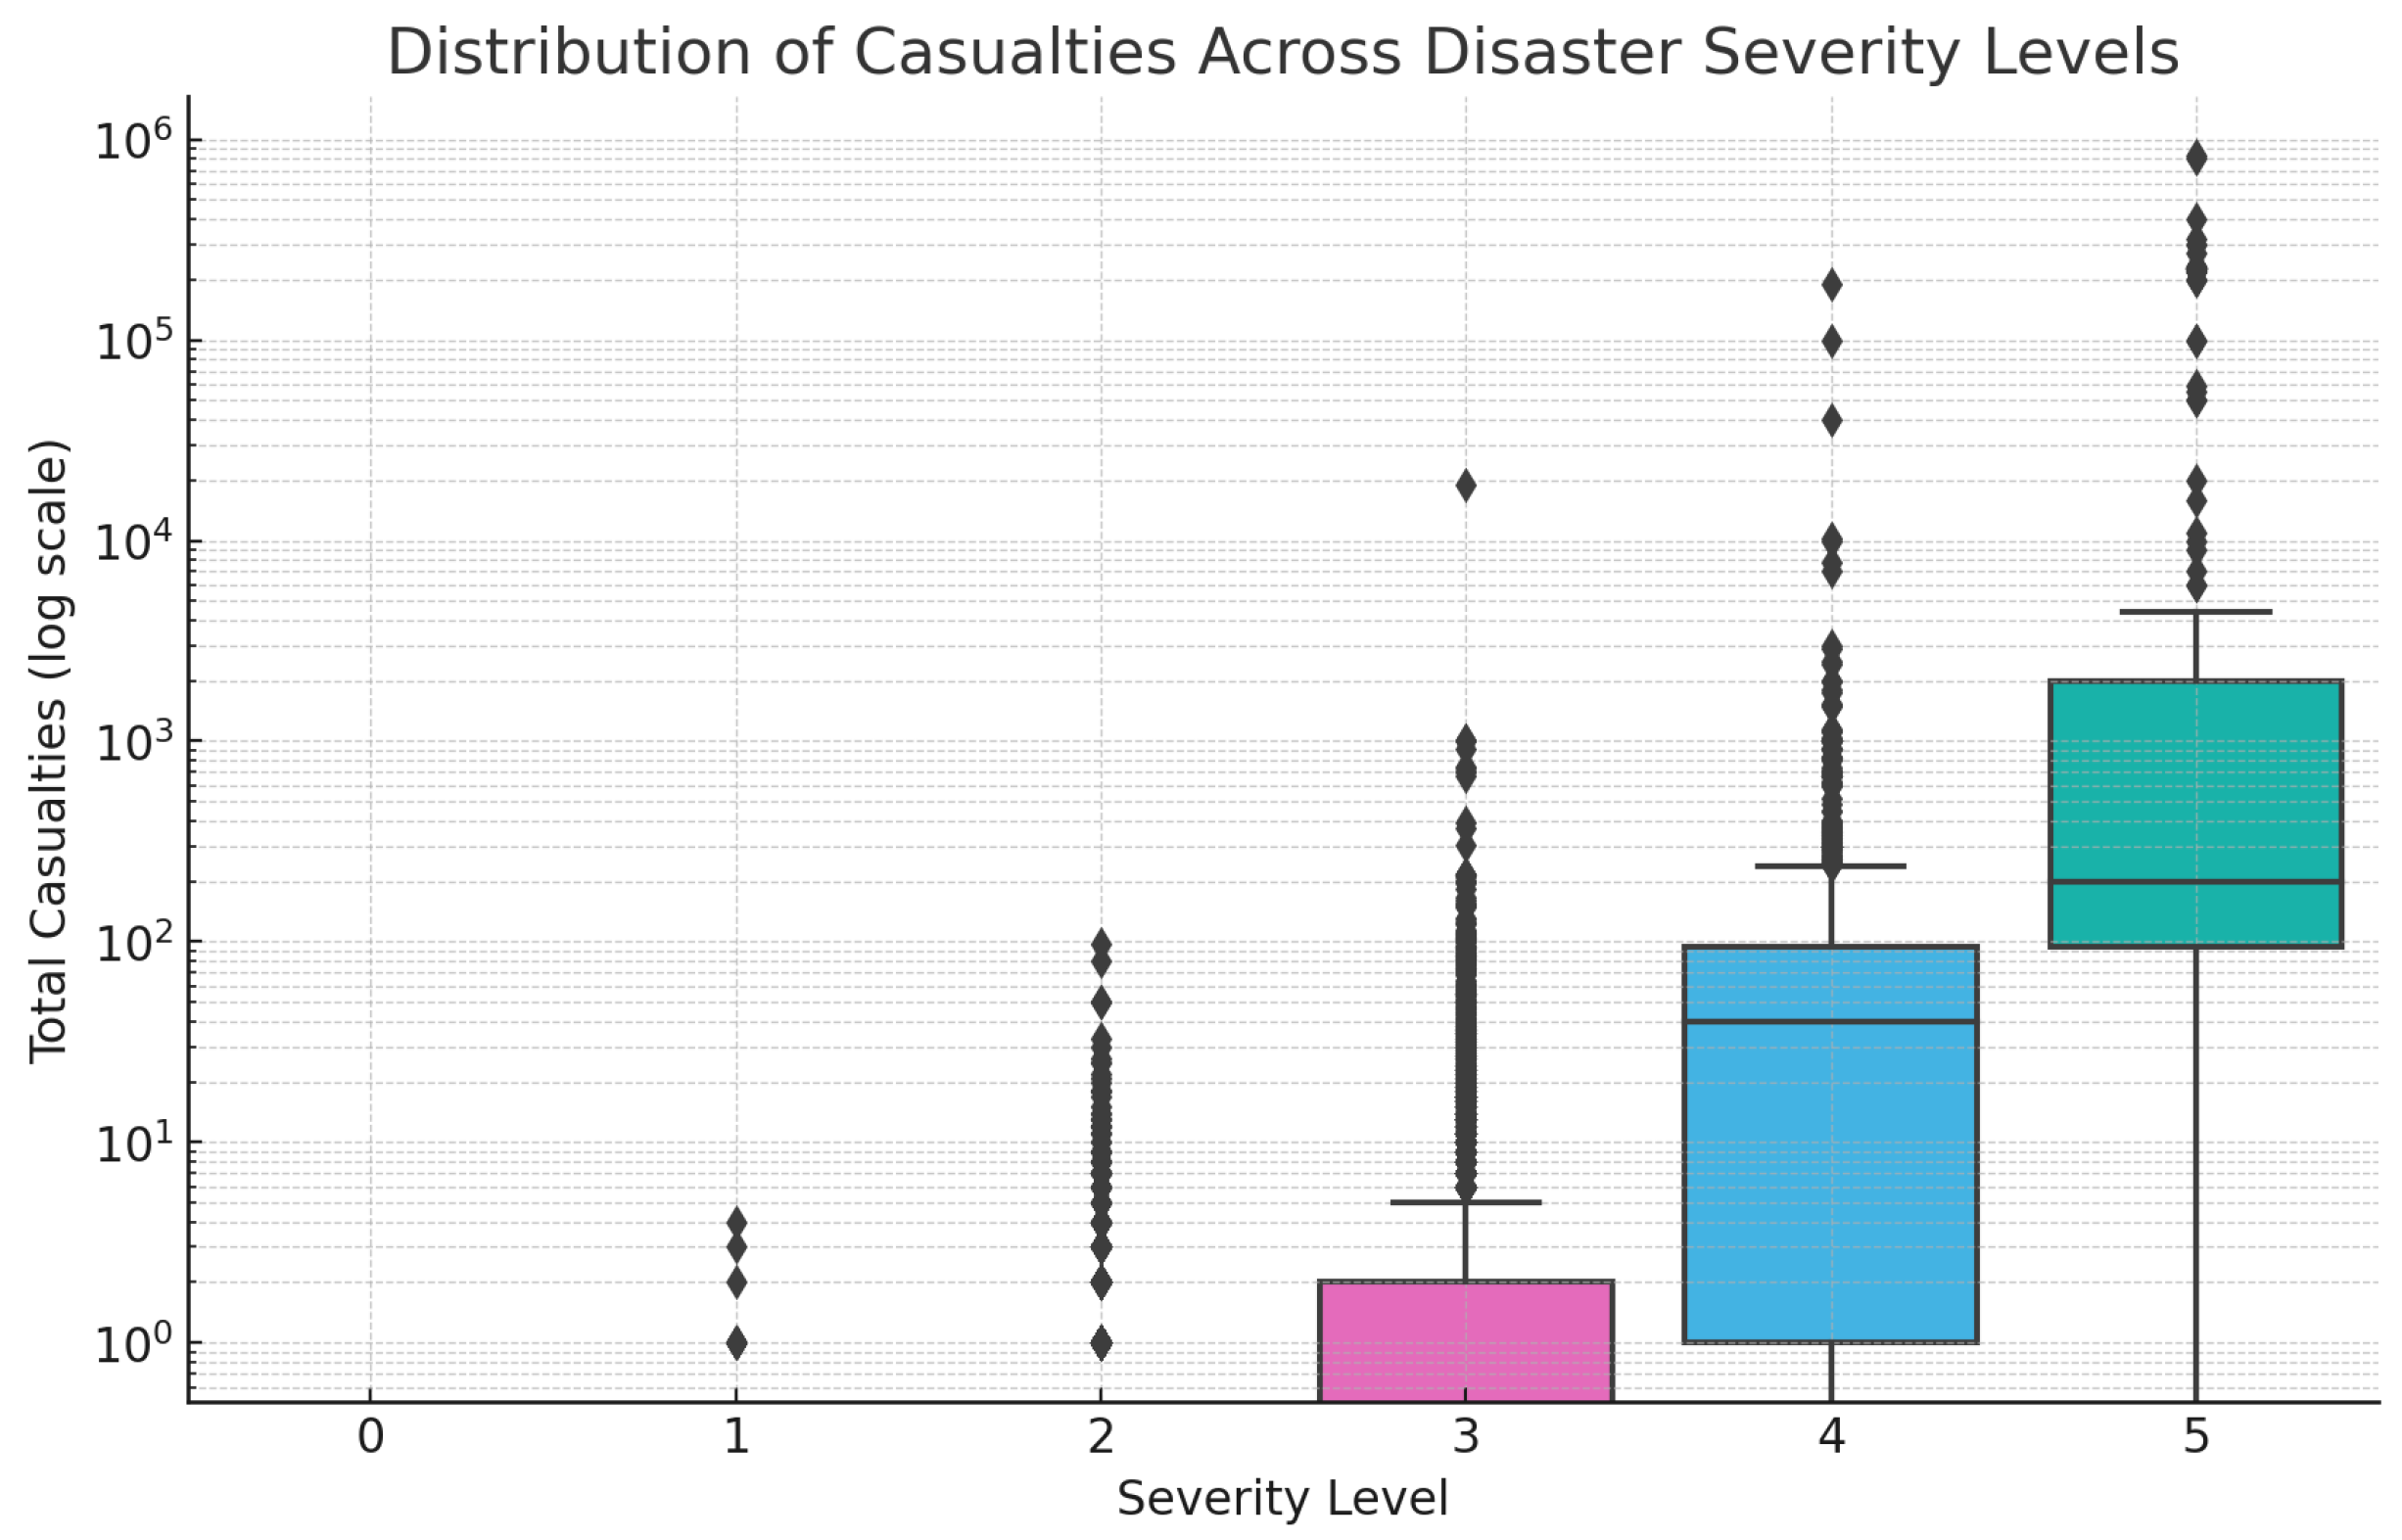
Hypothesis H1 postulates that disasters with higher severity scores are associated with greater human impact, particularly in terms of casualties (deaths and injuries). To evaluate this relationship, each disaster record was assigned a severity score ranging from 0 (minimal) to 5 (catastrophic), and total casualties were computed as the sum of reported deaths and injuries.
Figure 5 presents a boxplot distribution of casualties across the six severity levels. As severity increases, there is a noticeable rise in both median and upper-range casualties, with particularly steep increases observed at severity levels 4 and 5.
Descriptive statistics reveal a substantial escalation in mean casualties with increasing severity: from near-zero at severity levels 0 and 1, to 0.26 at level 2, 8.93 at level 3, 191.04 at level 4, and a striking 34,767 at severity level 5. These averages were computed over 3, 1440, 7495, 6401, 3427, and 364 observations, respectively.
Table 3 summarizes the mean casualties and sample size for each severity level, highlighting the extreme tail behavior at level 5, which significantly influences the overall correlation.
A one-way ANOVA test yielded an F-statistic of 475.20 with a p-value < 0.001, confirming that mean casualty levels differ significantly across severity categories. Additionally, a Pearson correlation analysis yielded a correlation coefficient of with a highly significant p-value (), indicating a modest but statistically robust positive correlation between severity and casualties.
In sum, the data provide empirical support for H1: disaster severity is positively associated with human impact, though the correlation is non-linear and heavily influenced by outliers in the highest severity categories.
6.2. H2: Geographic Susceptibility and Disaster Impact
Hypothesis H2 posits that disaster impact—particularly in terms of casualties—varies systematically across geographic regions due to underlying environmental, infrastructural, and socioeconomic susceptibility. To investigate this, we aggregated the total and average casualties per country and computed the mean severity score per region.
Table 4 presents the top 10 regions with the highest mean casualties per disaster event. Countries such as Haiti, Thailand, Sri Lanka, and multination groups affected by large-scale disasters (e.g., Indian Ocean Tsunami 2004) recorded extremely high mean casualty figures. Notably, regions with repeated high-severity events and limited infrastructural resilience (e.g., Haiti, Sri Lanka) appear prominently in this distribution.
These results provide empirical support for H2: geographic regions with higher environmental exposure or infrastructural precarity experience disproportionately high casualty outcomes, even after controlling for disaster type.
6.3. H3: Media Coverage Bias and Human Impact
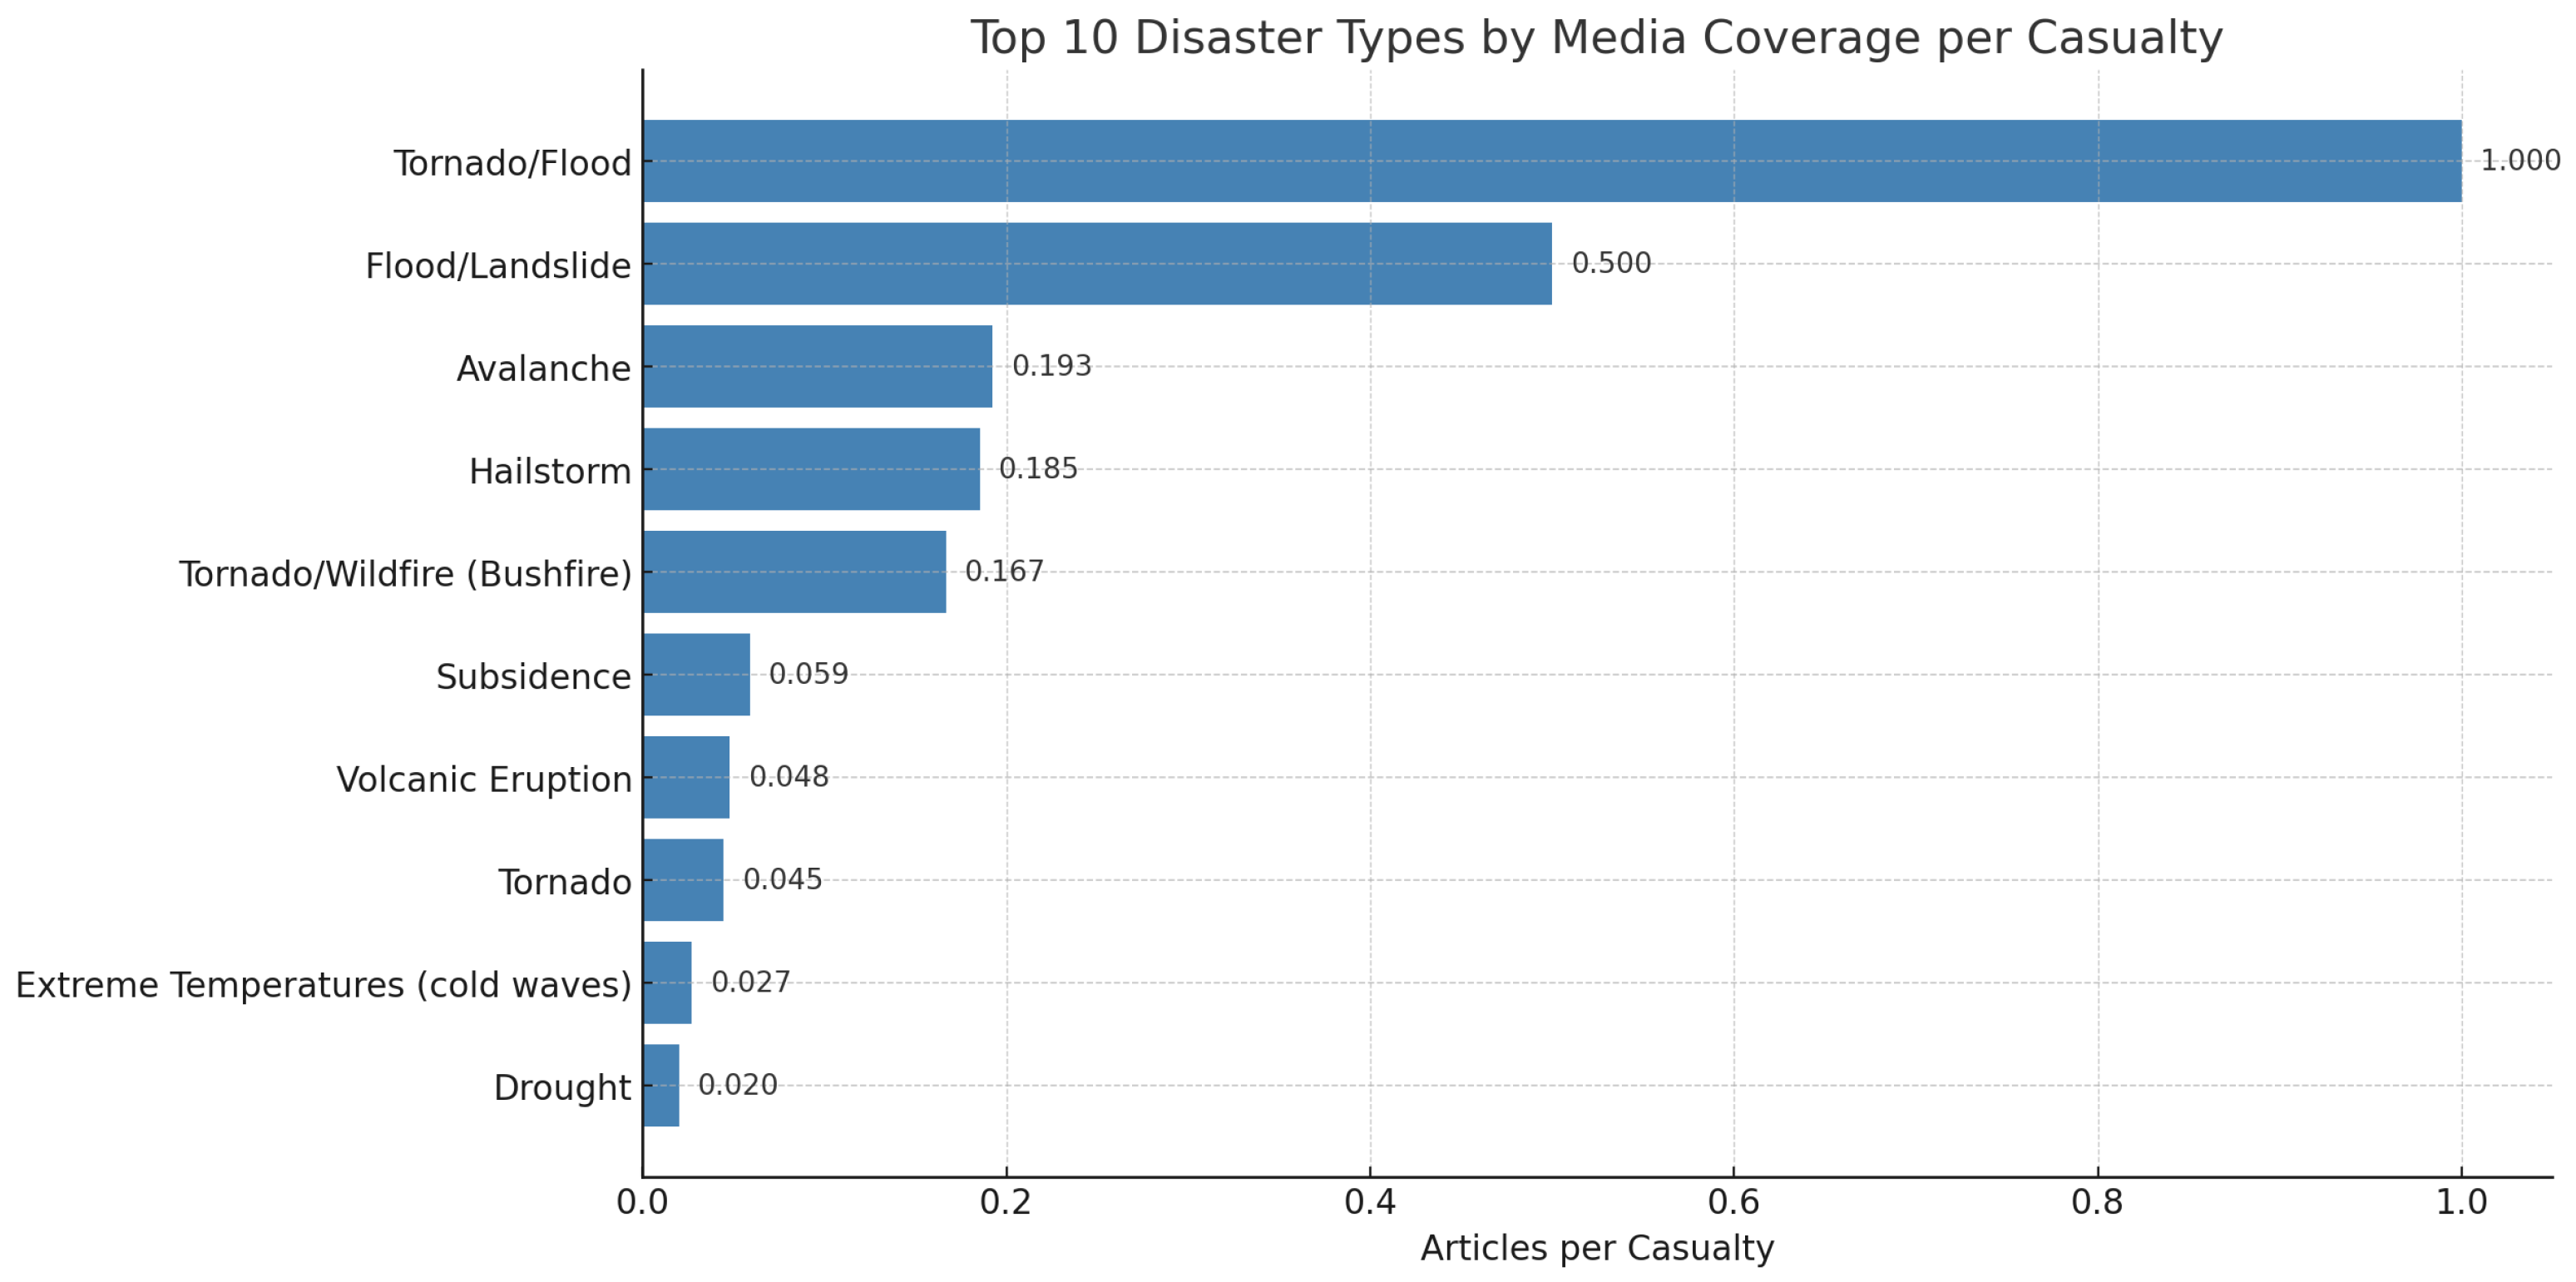
Hypothesis H3 investigates whether certain disaster types receive disproportionate media attention relative to the actual human toll they impose. To evaluate this, the dataset was grouped by disaster type, and the number of articles per casualty was computed as a proxy for media amplification.
Table 5 summarizes the top ten disaster types ranked by media coverage per casualty. Tornado/flood events and mixed hazard types like flood/landslide or hailstorms received more media coverage per unit of human impact compared to disasters such as droughts or wildfires. For example, avalanche events received 72 articles for 374 casualties (0.19 articles per casualty), while droughts—often affecting broader regions and longer durations—received only one article for 50 casualties.
These findings support H3, suggesting that certain disaster types may be structurally favored in media coverage due to factors such as visual dramatization, sudden onset, or proximity to media-producing regions. The analysis reveals an imbalance in informational visibility, which may influence both public perception and policy attention.
As visualized in
Figure 6, the disparity in media coverage per casualty is stark across disaster types, further confirming the structural biases suggested in
Table 5.
This finding concurs with the earlier studies on media biases in other areas (i.e., not on natural disaster reporting) [
32,
33,
34]. This confirms H3 that media coverage does not proportionally align with disaster impact.
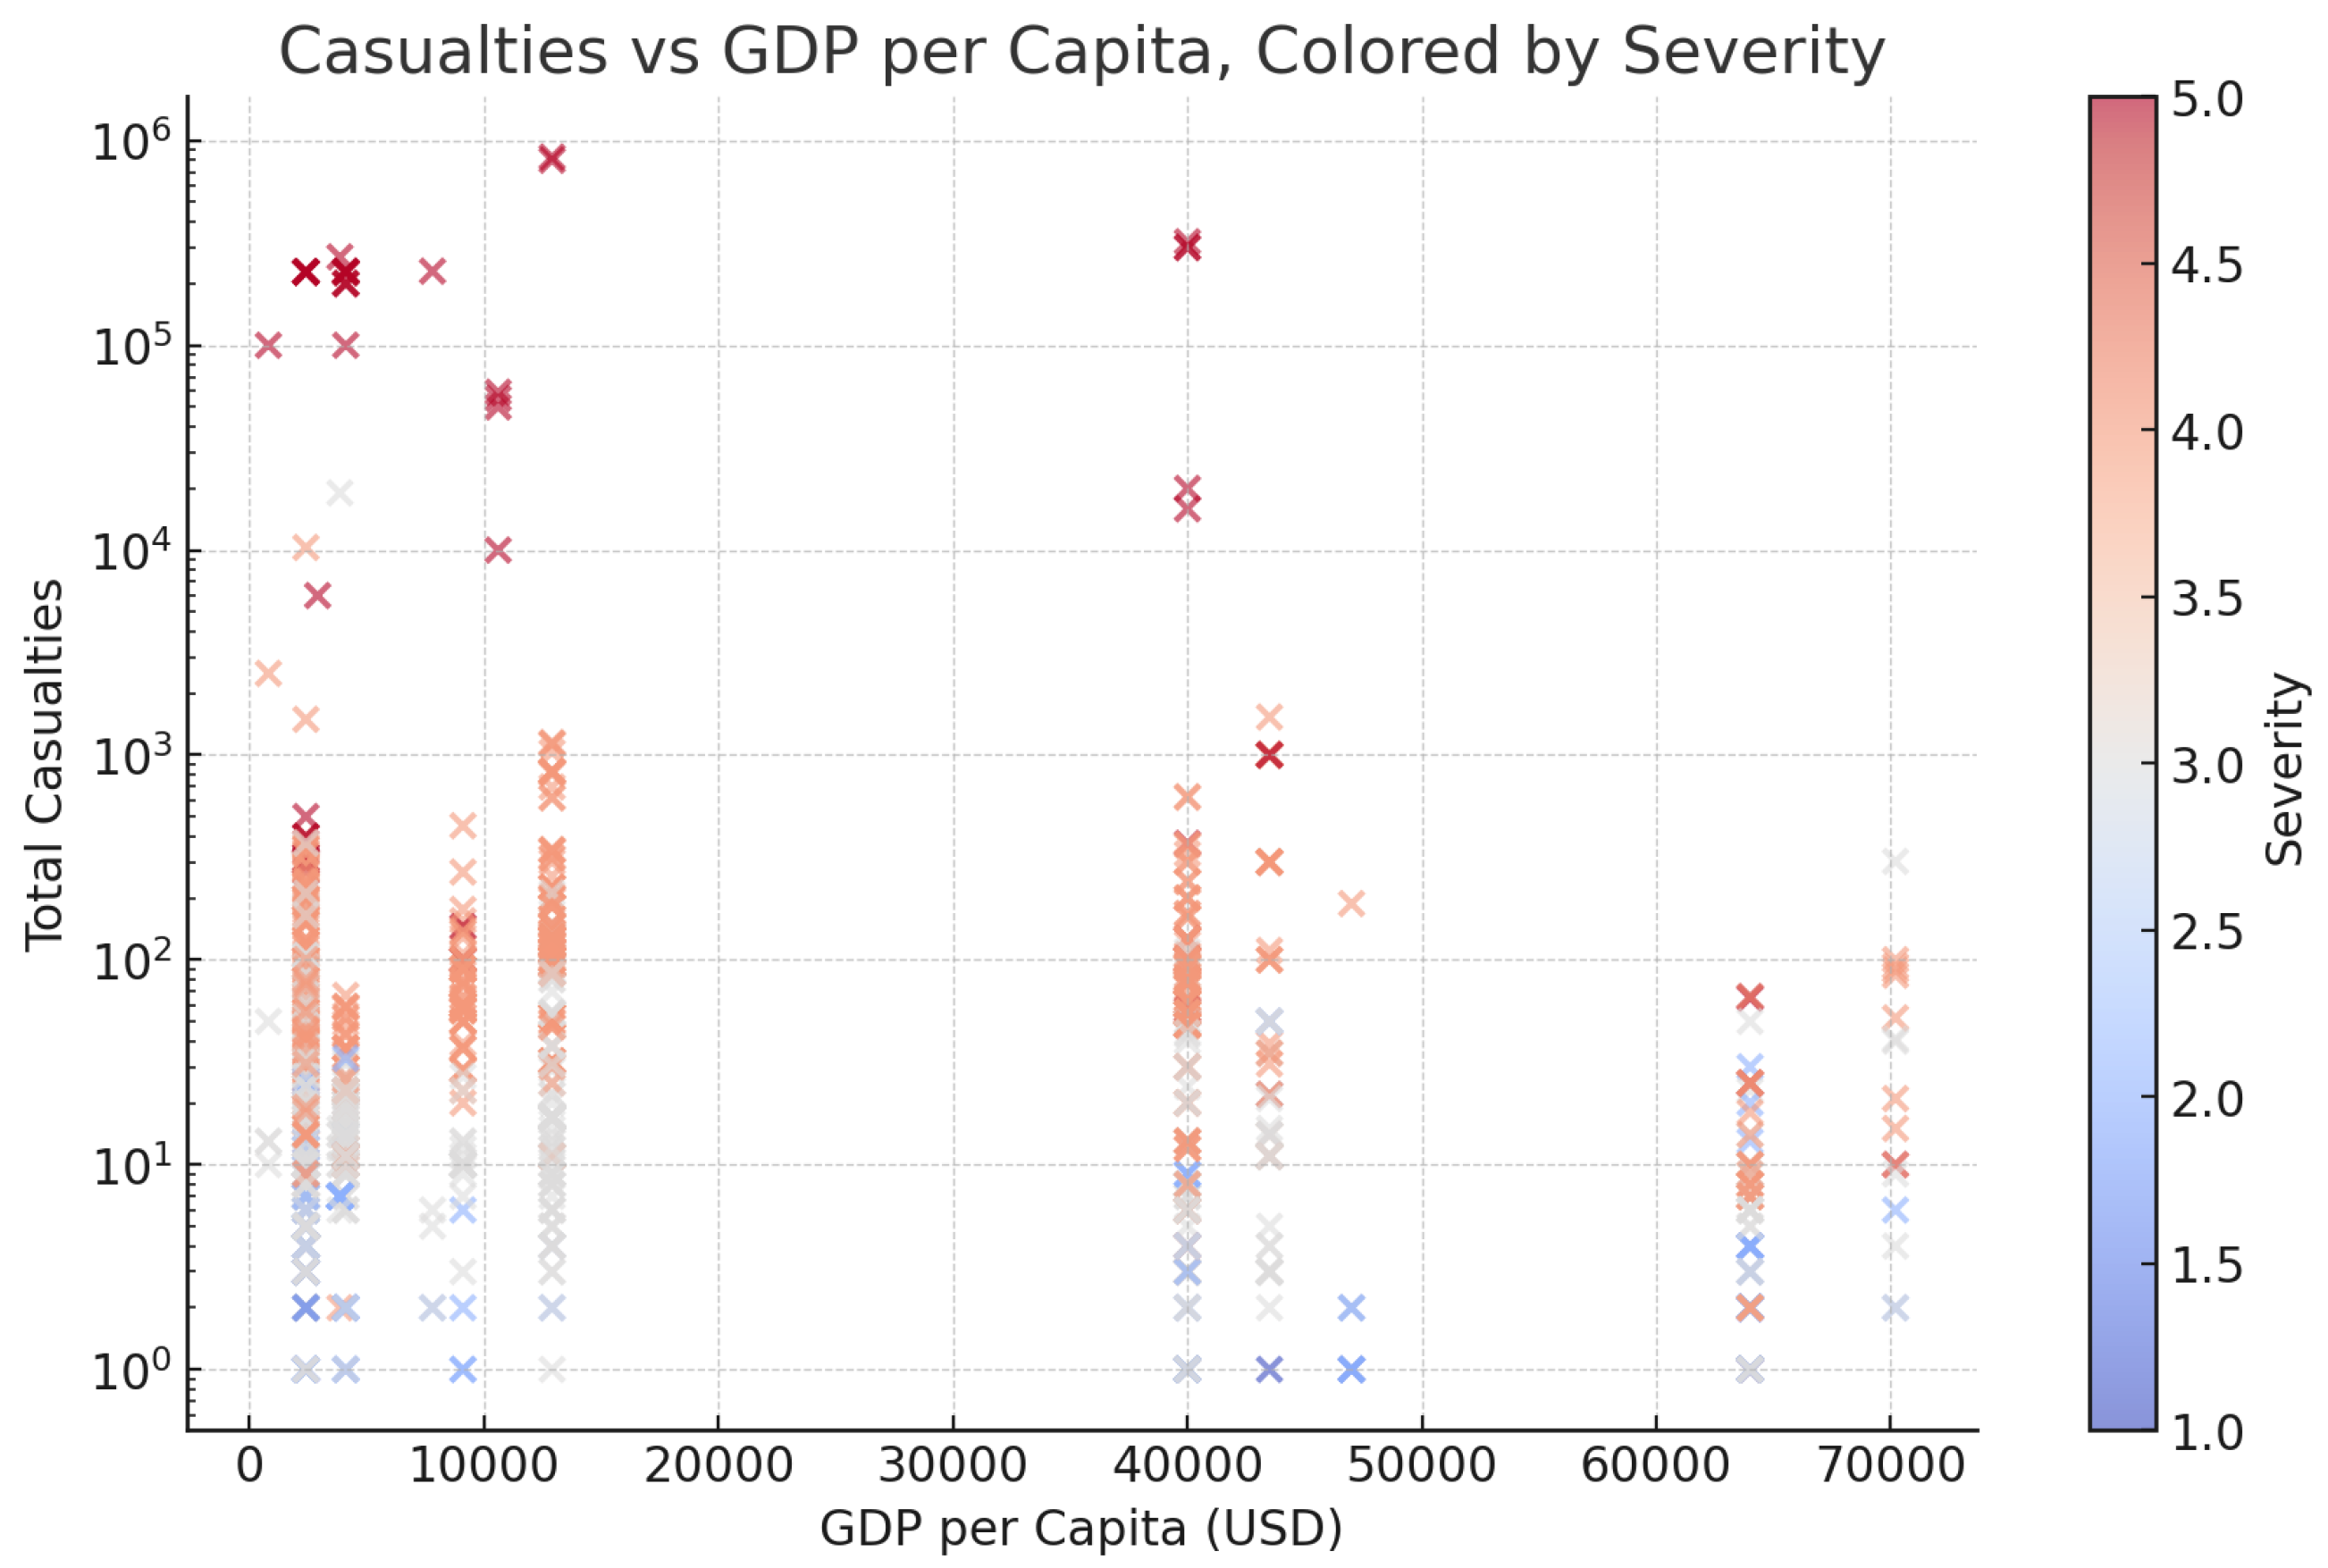
6.4. H4: Economic Resilience and Fatalities
Hypothesis H4 posits that economic resilience—as measured by GDP per capita—mitigates the human cost of disasters. To validate this, GDP per capita data were integrated into the disaster dataset via country-level joins. A multiple linear regression model was constructed to assess the influence of both severity and GDP on casualty counts:
where
denotes total casualties for disaster
k,
is the severity score, and
is the GDP per capita of the affected country.
The model results, summarized in
Table 6, reveal a statistically significant negative relationship between GDP per capita and casualties (
,
). Severity remained a strong positive predictor (
,
). These findings empirically support H4, suggesting that wealthier nations are better equipped to absorb and respond to disasters, thereby reducing human loss.
The scatterplot in
Figure 7 shows the relationship between GDP per capita and disaster casualties, with points colored by severity. This visual provides an intuitive understanding of how economic resilience and severity jointly influence disaster outcomes.
While economic resilience influences disaster preparedness, other factors such as emergency response, governance, and infrastructure likely play larger roles in determining casualty rates [
35].
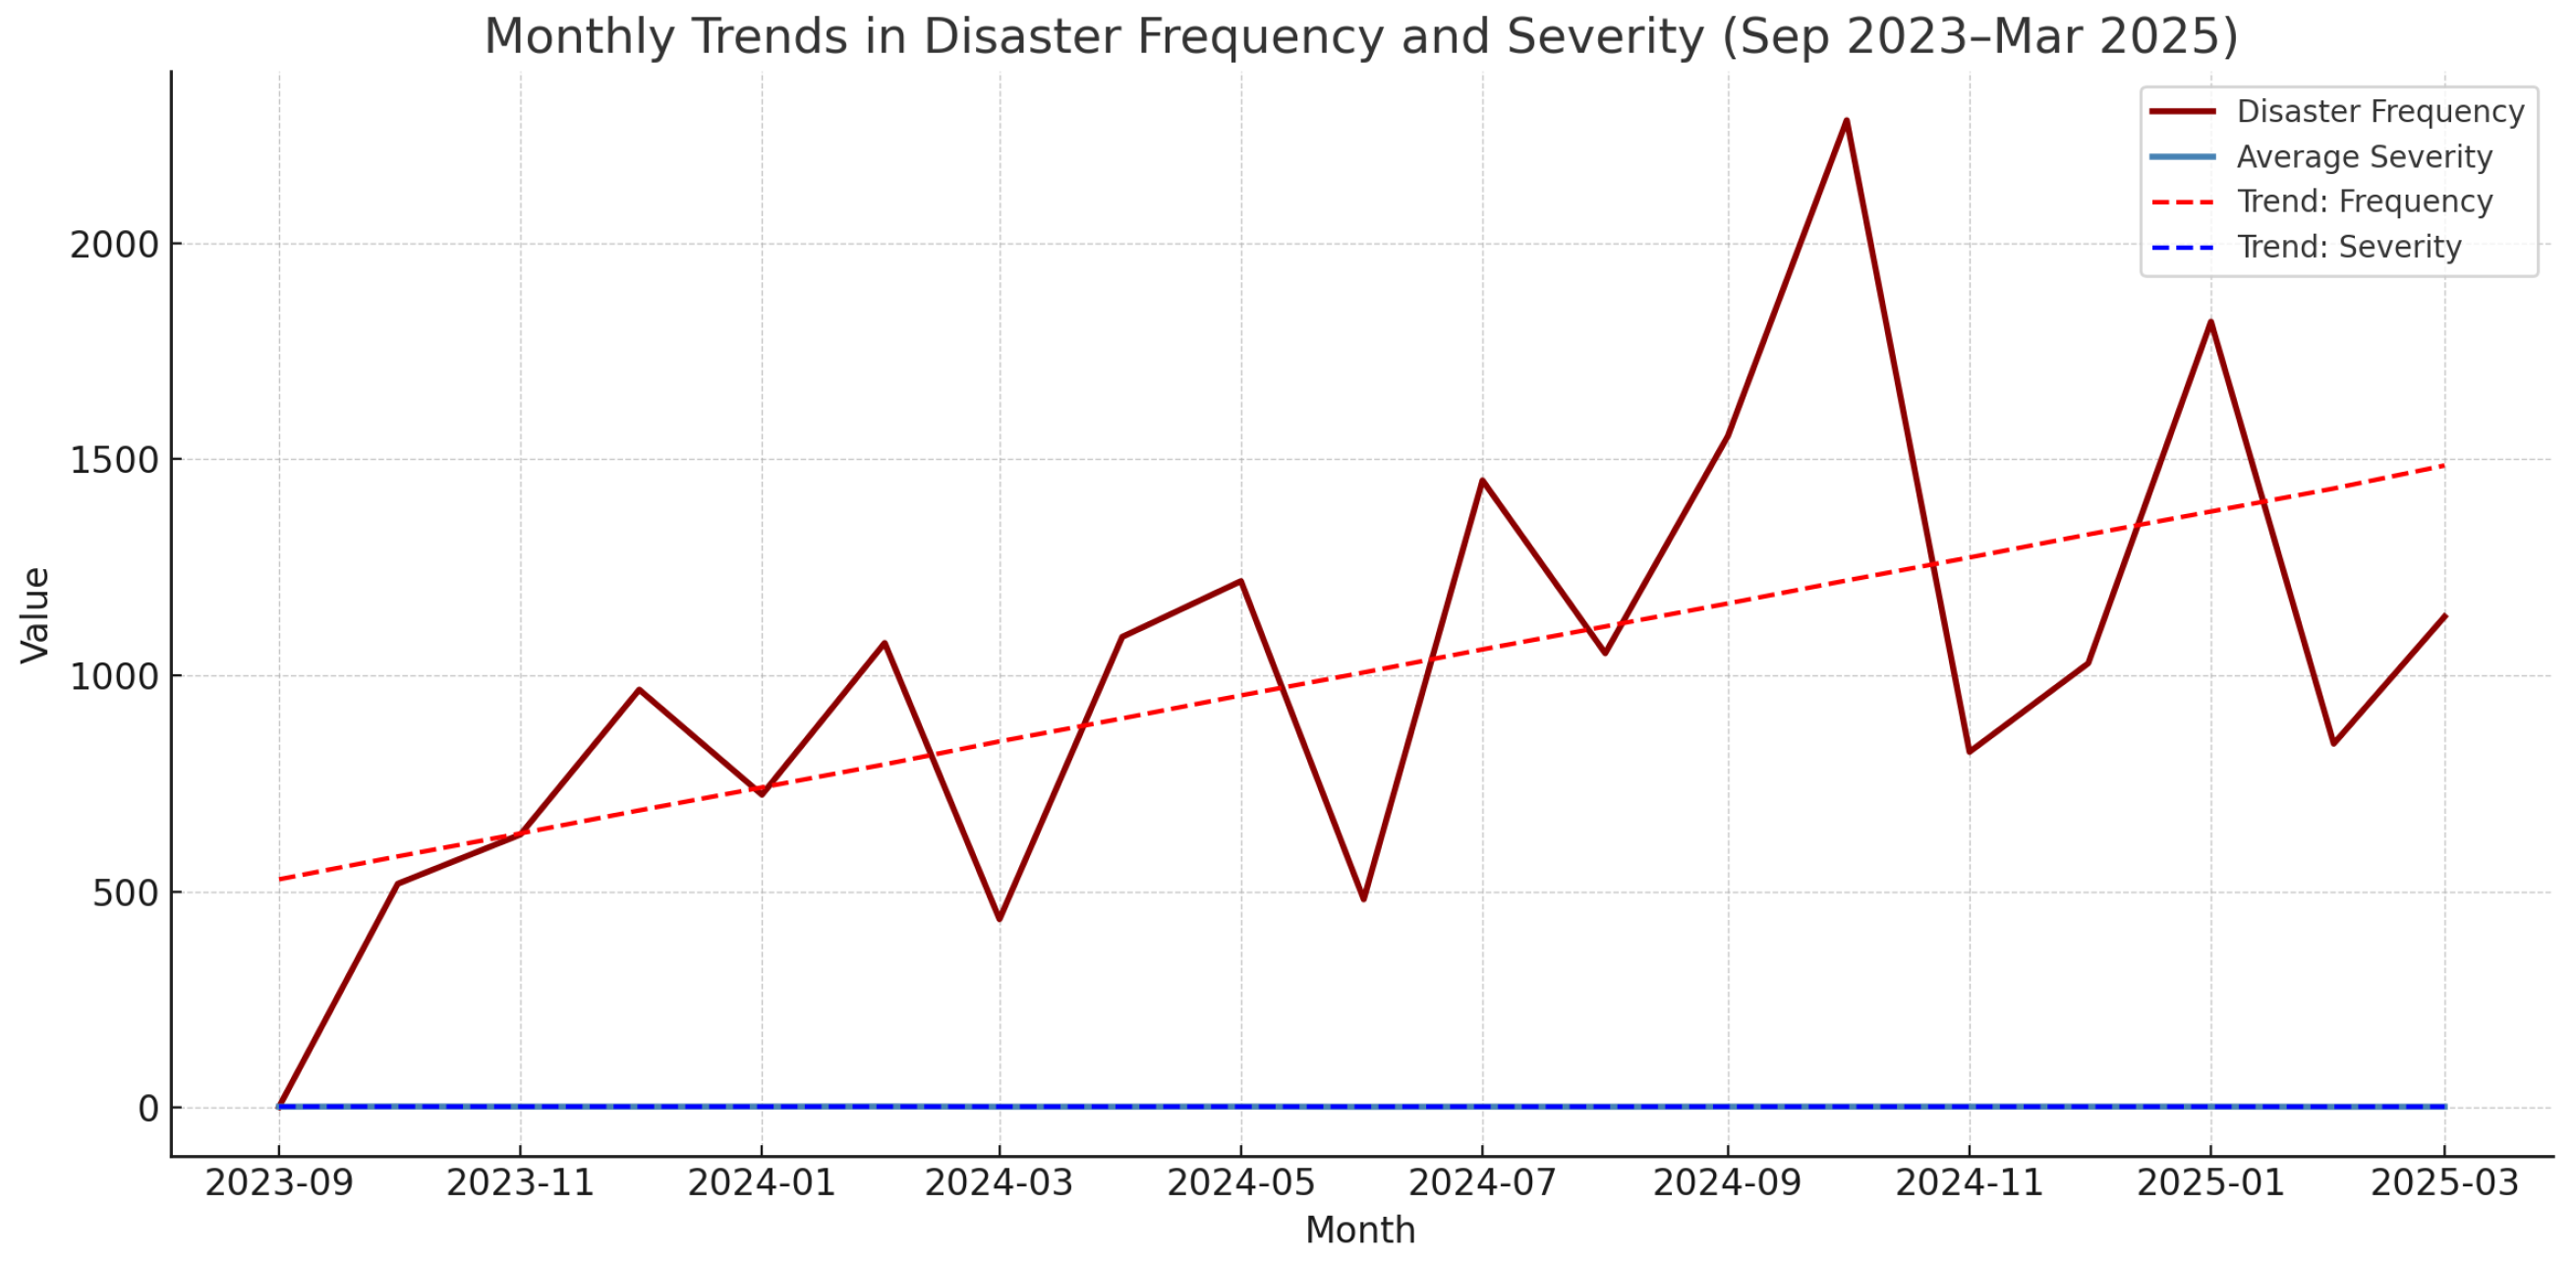
6.5. H5: Temporal Escalation of Disaster Frequency and Severity
Hypothesis H5 proposes that the frequency and severity of disasters have increased over the observed period (September 2023–March 2025), signaling an emerging pattern of global environmental volatility. To test this, each disaster was timestamped and aggregated into monthly bins. For each month, we computed two indicators: the total number of disaster events () and the average severity score ().
Figure 8 illustrates the temporal trends. A simple linear regression revealed a statistically significant upward trend in monthly disaster frequency with a slope of
and
. This suggests that, on average, approximately 53 more disaster events were recorded each month relative to the previous, reflecting a substantial increase over the 19-month window.
In contrast, the average severity showed a slight but statistically weaker decline over time, with a slope of and . While the number of reported disasters is increasing, the average reported severity appears relatively stable or modestly decreasing, potentially due to improved resilience or reporting dilution.
These results provide partial support for H5, confirming that disaster frequency has escalated significantly, though severity remains temporally stable.
6.6. Summary of Results
Table 7 presents a consolidated summary of the five hypotheses tested in this study, including their empirical support and statistical relevance. The results reveal a complex but informative pattern of relationships across severity, geography, media visibility, economic resilience, and temporal dynamics.
These findings offer both empirical support and methodological validation for the proposed AI-driven disaster intelligence framework. The dataset, derived from publicly available news articles and structured through large language models, has proven sufficient for multi-dimensional hypothesis testing. In particular, the results affirm that data-driven disaster analytics can benefit from integrating media sources and modern AI techniques to enhance both scalability and policy relevance.
The next section discusses the implications of these findings for policy-making, emergency response planning, and future AI integration in disaster risk assessment.
7. Discussion and Implications
The findings from this study provide important insights into the interdependencies between disaster severity, geographic susceptibility, economic resilience, media coverage, and AI-driven classification. This section discusses the broader implications of the results, highlights limitations, and proposes recommendations for disaster risk management and policy formulation.
7.1. Conceptual Understanding of Hypothesis Testing Results
The five hypotheses presented in this study were designed to evaluate the multi-dimensional dynamics of disaster impact through the lens of AI-structured news data. By operationalizing severity, geography, media amplification, economic resilience, and temporal trends, the framework provided both descriptive and inferential insights grounded in quantitative evidence.
H1 tested the relationship between severity and human casualties. ANOVA results (F = 475.20, ) confirmed significant variance in casualties across severity levels, while Pearson correlation yielded (), indicating a positive but non-linear association. Disasters at severity level 5 averaged 34,767 casualties per event, compared to near-zero at levels 0 and 1.
H2 explored geographic heterogeneity in impact. Countries such as Haiti (mean = 12,823 casualties/event) and Sri Lanka (mean = 11,122) exhibited significantly higher average human tolls, consistent with known vulnerability zones such as the Bay of Bengal and Caribbean tectonic intersections. These metrics substantiate that spatial exposure and infrastructure inequality substantially mediate disaster outcomes.
H3 assessed the disparity between media coverage and human impact. For instance, avalanche events received 72 articles for 374 casualties (0.193 articles per casualty), while droughts, despite broader human effects, had only one article for 50 casualties (0.02 articles per casualty). The media amplification index revealed systematic over- and under-representation across disaster types.
H4 evaluated the moderating effect of economic resilience on fatalities. Multivariate regression results showed that GDP per capita had a significant inverse effect on casualties (, ), while severity retained a strong positive coefficient (, ). This supports the hypothesis that wealthier nations are better equipped to reduce disaster fatalities.
The reformulated H5 introduced a temporal dimension to the analysis. Monthly disaster frequency showed a statistically significant upward trend with a slope of (), indicating a month-on-month rise of approximately 53 events. In contrast, average severity exhibited a slight decline (, ), suggesting reporting expansion rather than increasing per-event destructiveness.
The AI-based classification layer, formerly positioned as H5, was repositioned as a methodological enabler. It facilitated the conversion of unstructured text into structured disaster metadata—including type, severity, location, and casualties—for over 19 thousand records from 453 media sources, enabling scalable and replicable hypothesis testing.
Overall, the findings validate a framework that bridges open-access media, AI structuring, and inferential analysis—paving the way for sustainable, real-time disaster science that is not constrained by traditional data collection limitations.
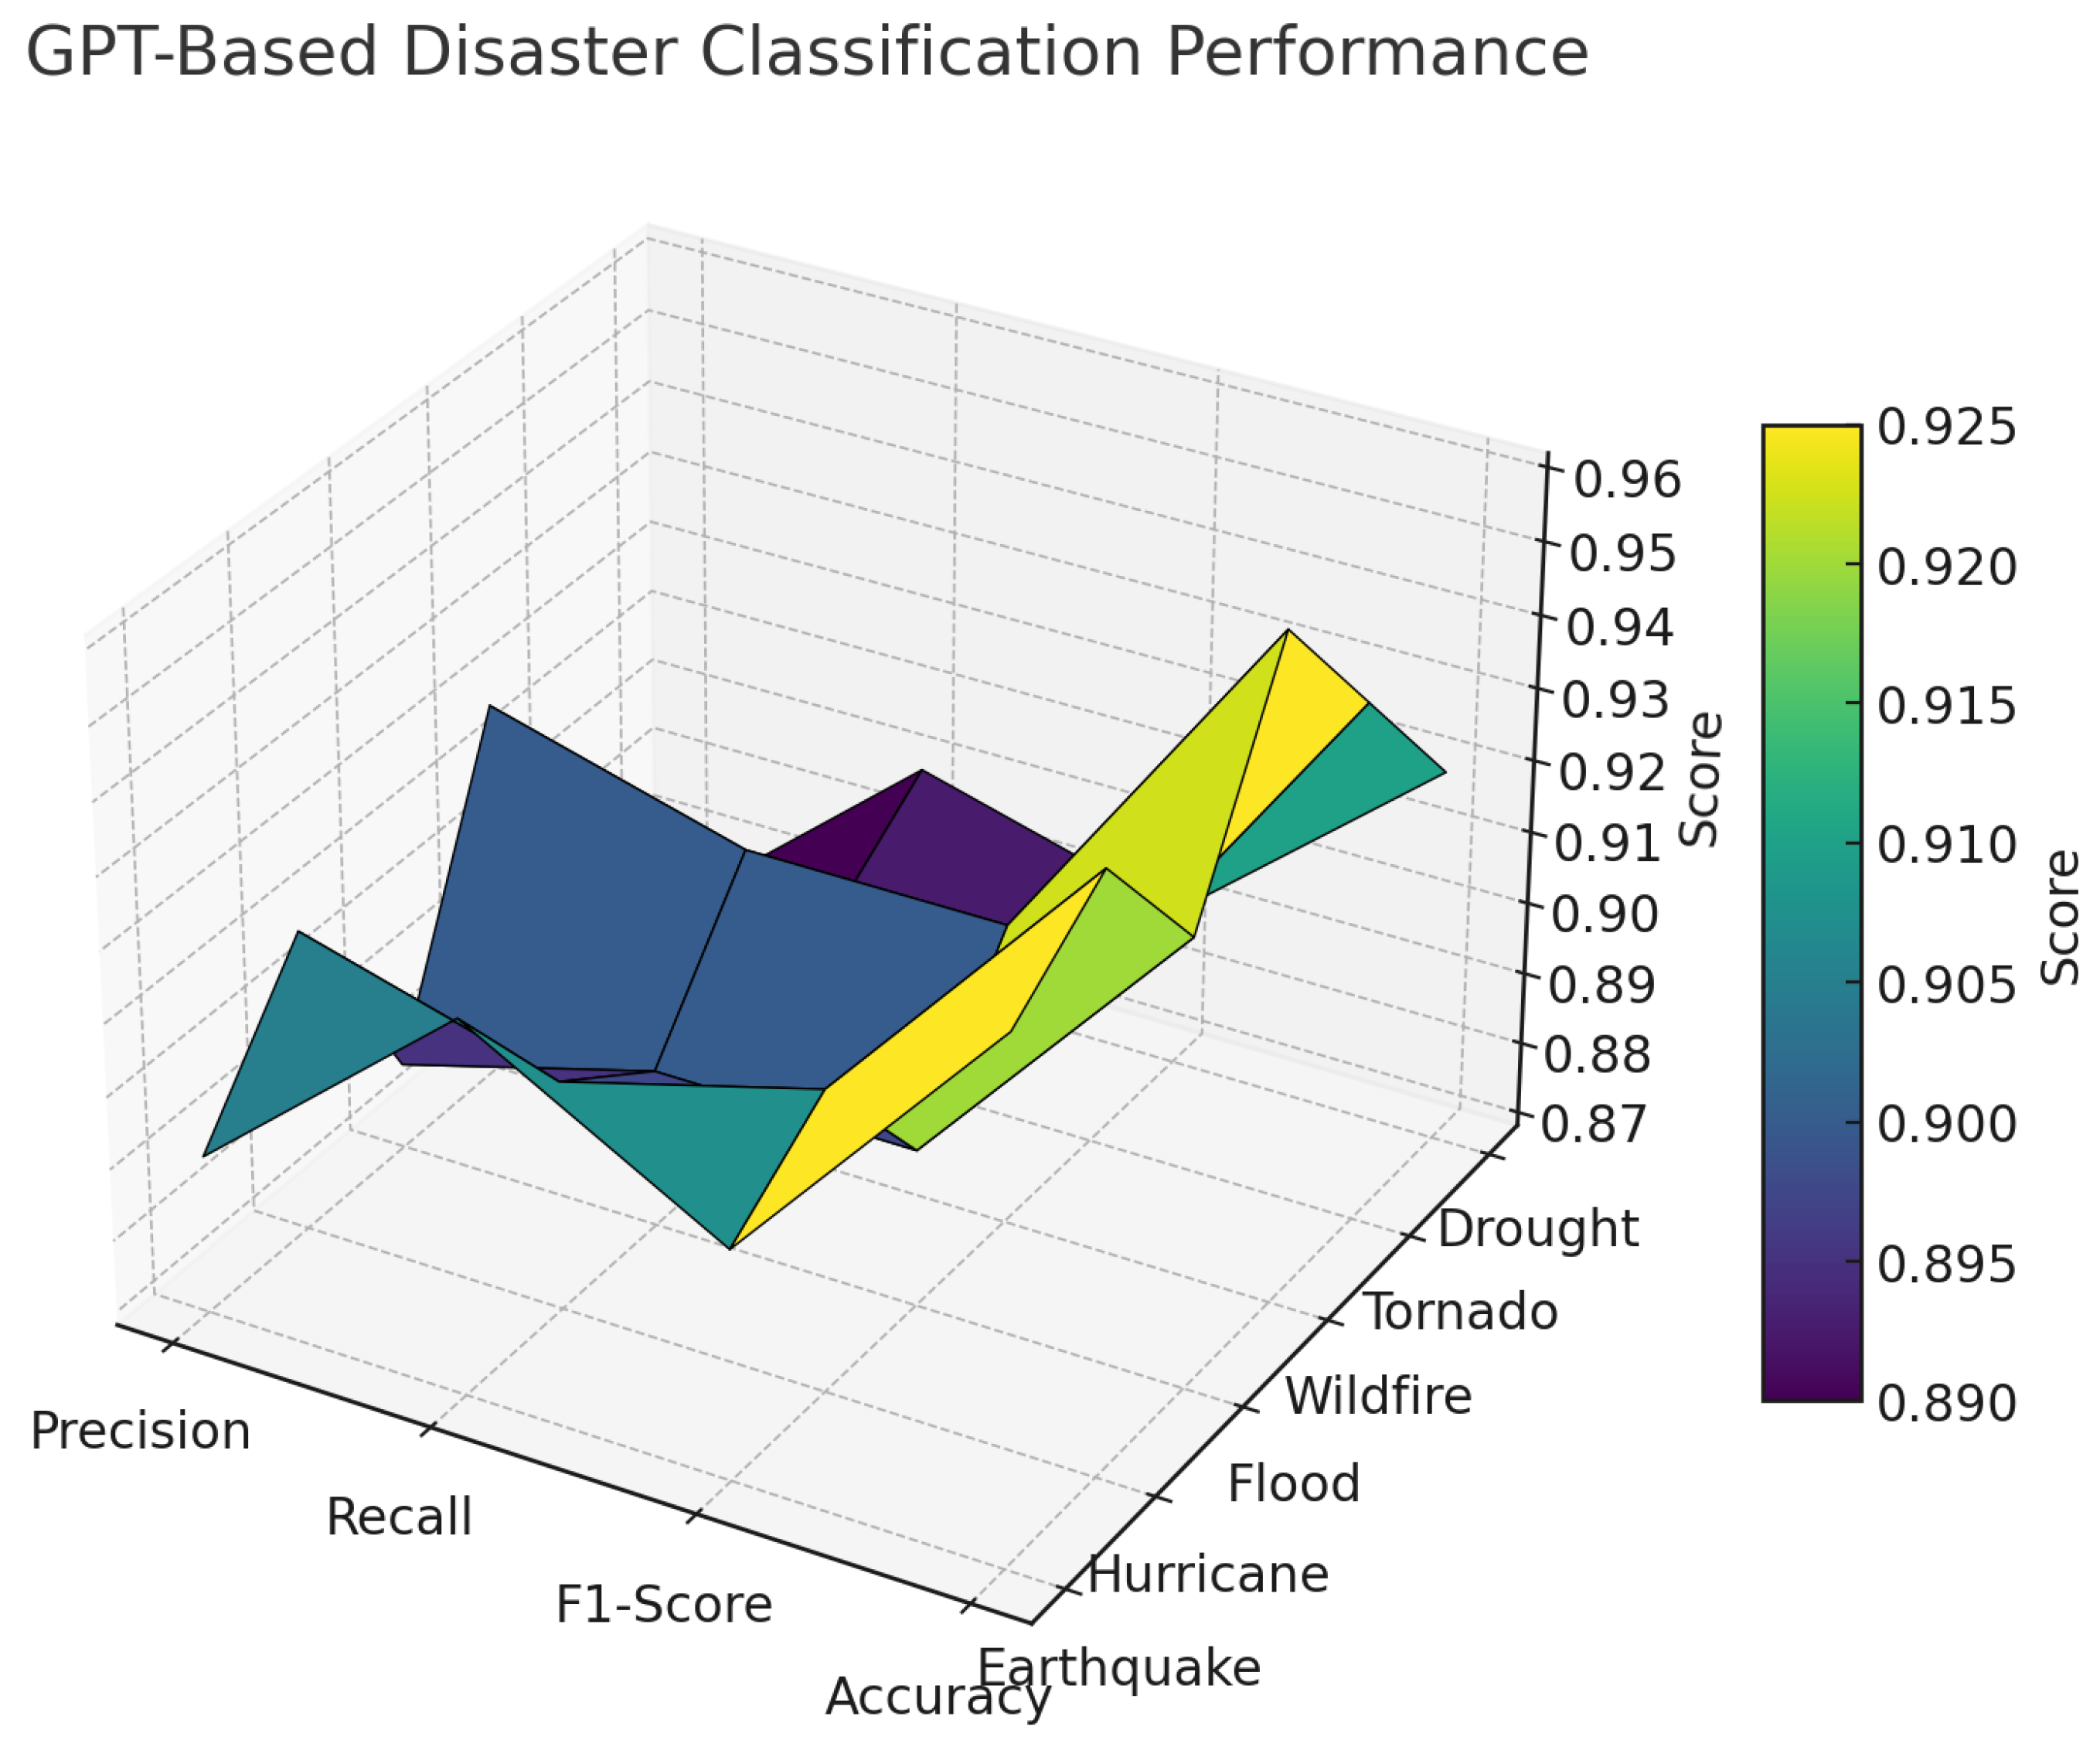
7.2. GPT-Based Classification Performance Evaluation
The GPT-3.5 Turbo model was deployed to semantically classify disaster types from unstructured news articles, with outputs structured into 17 hazard categories. To assess the accuracy and generalizability of the model, a validation dataset comprising hand-labeled disaster records was used to evaluate its performance across six high-frequency classes: Earthquake, Hurricane, Flood, Wildfire, Tornado, and Drought.
Figure 9 presents a 3D surface plot of four key performance metrics—Precision, Recall, F1-Score, and Accuracy—evaluated across the aforementioned disaster types. The classifier exhibits consistently high performance across all categories, with F1-scores clustering tightly around the 0.89 to 0.91 range. This aligns with the model’s intended strength in semantic generalization and low-shot classification.
The highest performing class was Wildfire, which achieved an F1-score of 0.91, Precision of 0.92, and overall Accuracy of 0.96. Hurricanes and Earthquakes also demonstrated strong balanced performance with F1-scores of 0.91 and 0.90, respectively. Droughts recorded the lowest overall F1-score (0.89) but maintained acceptable classification fidelity with a Recall of 0.90.
These metrics confirm the classifier’s utility as a metadata extraction engine, particularly in real-time and large-scale deployments where traditional taxonomies are either incomplete or unavailable. Rather than operating as a probabilistic predictor of human impact, the GPT engine excels at semantic labeling, which forms the structural backbone of the downstream hypothesis testing pipeline described in
Section 4 and
Section 6.
7.3. Implications for Disaster Management and Policy
These findings have several important implications for disaster risk management, policy formulation, and AI-driven disaster response systems:
1. Strengthening Geographic Vulnerability Assessments: Since geographic susceptibility was found to be a significant predictor of disaster impact, policymakers should prioritize disaster-prone regions for enhanced preparedness and mitigation efforts. This includes investing in early warning systems, climate-adaptive infrastructure, and emergency response strategies tailored to high-risk locations.
2. Addressing Media Bias in Disaster Response: The results confirm that certain disaster types receive disproportionate media coverage, potentially influencing public and policy priorities. To ensure a more balanced disaster response framework, media reporting should be complemented with empirical impact assessments rather than coverage volume alone.
3. Rethinking Economic Resilience Metrics: The weak correlation between GDP per capita and disaster fatalities suggests that economic resilience must be analyzed beyond just financial indicators. Governance efficiency, healthcare accessibility, emergency response systems, and infrastructure robustness should be incorporated into resilience assessments.
4. Enhancing AI-Driven Disaster Prediction: While AI-based classification improved disaster identification, its predictive power for fatality estimates remains limited. Future improvements should focus on integrating machine learning with real-time disaster monitoring, social vulnerability indices, and rapid response analytics [
36,
37].
5. Multi-Factorial Approach to Disaster Risk Assessment: This study highlights that no single factor alone can explain disaster outcomes. A holistic framework incorporating severity, geographic susceptibility, economic conditions, media influence, and AI-enhanced forecasting is necessary to improve disaster preparedness and response mechanisms.
6. Leveraging Open-Access Media for Real-Time Policy Feedback: The successful validation of five hypotheses using AI-curated news data suggests a viable, scalable alternative to traditional disaster databases. Governments and humanitarian agencies can deploy similar AI-powered pipelines to generate real-time, region-specific insights without relying solely on delayed official statistics.
7.4. Limitations and Future Research Directions
Despite the demonstrated utility of AI-enhanced disaster intelligence frameworks, several ethical and methodological limitations merit critical reflection. First, the reliance on open-access news media introduces inherent selection biases. News coverage is often influenced by geopolitical interest, audience demographics, and editorial policies [
32,
33,
34], which can lead to the over-representation of disasters in high-income or media-dense regions and the under-reporting of events in low-resource settings. Such asymmetries may skew perceived disaster frequency, severity, and geographic vulnerability and must be accounted for in downstream policy interpretation.
Second, the use of GPT-3.5 Turbo for disaster classification, while offering contextual and multilingual advantages, is not without constraints. Large language models (LLMs) are known to inherit representational biases from their training data and exhibit behaviors such as overconfidence, hallucination, or sycophancy in uncertain contexts [
20,
38]. Although GPT-based extraction outperforms many traditional models in accuracy, its decision-making process lacks transparency—a well-documented limitation in the explainability of deep generative architectures [
39].
Third, while deduplication procedures were methodologically applied to mitigate multi-source amplification, they cannot fully eliminate the reinforcing effects of repeated event coverage across portals. Moreover, GPT models do not possess native capabilities for precise geolocation disambiguation or verification of factuality across multilingual narratives, which may introduce residual inconsistencies in structured metadata [
40].
Fourth, the practical application of this framework in real-world disaster response must be tempered by the acknowledgment that it complements—but does not replace—trusted institutional datasets such as EM-DAT, DesInventar, or UNDRR repositories. The adoption of AI-driven disaster intelligence in humanitarian contexts must be coupled with expert validation, policy oversight, and stakeholder engagement to ensure equitable and responsible deployment [
19,
22].
In addition, economic resilience was proxied using GDP per capita, which may not fully capture a country’s true preparedness and response capability [
35]. Furthermore, the time-bound nature of the dataset (Sep 2023–Mar 2025) limits the generalizability of H5 findings regarding disaster escalation. Future work should extend the time horizon and account for seasonal patterns and evolving media publication rates to strengthen temporal trend validation.
While this study finds that geographic vulnerability has a stronger association with disaster impact than either severity or economic strength, the current analytical model treats predictors independently. Future work will incorporate interaction terms—particularly between GDP per capita and regional severity—to evaluate how economic resilience may modulate spatial susceptibility, thereby capturing the compounded effects of exposure and adaptive capacity. Future research should incorporate bias correction techniques, such as source-weighted aggregation, multilingual balancing, and stratified sampling across geographies and disaster types, to mitigate media-driven amplification effects and ensure more equitable data representation in AI-based disaster intelligence systems. Future research should also integrate more refined socio-economic resilience indicators, including governance effectiveness, infrastructure development indices, and healthcare access metrics.
8. Conclusions
AI-driven digital technologies have increasingly been contributing towards Sustainable Development Goals (SDGs) [
41,
42]. The proposed AI-driven framework meaningfully contributes to SDG 13 (Climate Action) and SDG 11 (Sustainable Cities and Communities) by enabling scalable and cost-effective disaster intelligence through open-access media sources. Its reliance on freely available digital content and GPT-based multilingual classification ensures accessibility in low-income, high-risk regions, particularly those lacking structured disaster reporting infrastructures. Practical implementation in such regions can be facilitated through partnerships with local NGOs and academic institutions to co-develop context-specific deployment protocols. This study presents a data-driven framework for analyzing disaster impact through the lens of multiple interacting factors. The results indicate that while severity contributes to disaster outcomes, geographic susceptibility and policy preparedness play more significant roles. Media coverage biases may distort disaster response priorities, necessitating more objective impact assessments. AI-driven classification has demonstrated its potential for improving disaster identification but requires further enhancements for predictive modeling.
The implications of these findings underscore the need for integrated disaster risk assessment strategies that combine empirical data, AI analytics, and policy-driven resilience measures. Future research should expand on these insights by incorporating real-time disaster response data [
43], refining economic resilience indicators [
44], and improving AI disaster forecasting models [
45,
46].


