Abstract
Many developed countries face an increasing crisis of waste management, especially regarding inadequate disposal capacities and insufficient systems for waste sorting and recovery. These insufficiencies harmfully affect environmental quality, human health, and overall urban life. Waste management is largely linked with disposal, collection, and recycling. Instead of being a critical public utility, solid waste management often goes unnoticed—until it fails. The complete system failure can escalate into a global crisis. Italy presents a critical case to evaluate waste management’s role in achieving Sustainable Development Goals, given the diversity of the country and its adherence to strict EU regulations. The country has taken important steps to adopt the principles of the circular economy, mainly through recycling and waste-to-energy initiatives. The Sustainable Development Goals are also linked to waste management, and there are specific goals with targets and indicators that focus on waste management outcomes. This paper has assessed the national achievement of Italy in waste management concerning the SDGs. SDGs 6, 7, 11, and 12, with a specific focus on the targets impacted by integrated waste management in Italy, are the focus of this paper, and the achievement of waste indicators under SDGs 6, 7, 11, and 12 is analyzed. The paper also assesses the relationship between social, economic, and geographical variables in the achievement of the mentioned SDGs, and also the impacts of the social, economic, and geographical contexts of inhabitants on the achievements of the SDGs. The paper has utilized the national dataset on SDGs and available data on socio-economic and geographic variables. The paper applied descriptive statistics, Pearson’s Correlation, Partial Least Square Regression (PLSR), and Elastic Net Regression, emphasizing the relationship between the waste indicators of SDGs and social, economic, and geographical factors. The paper resulted in a significant association between the outcomes of waste management indicators of SDGs and demographic variables.
1. Introduction
The statistical data from Europe show an overall reduction in the production of waste, with a similar kind of trend in Italy, which has seen a reduction in waste towards a higher level of separate waste collection. Irrespectively, the amount of waste that is produced in Italy is higher than in other countries [1]. It is forecasted that there is still a long way to go toward achieving a smarter, sustainable, and inclusive economy in Europe [2].
Solid waste management is the key utility service that mainly goes unnoticed, though in cases where it does not work well, solid waste management draws political, public, and media attention to the country [3]. If solid waste management fully stops functioning, this situation leads to a crisis and reaches headlines around the world. One such recent case is that of Campania, Italy, which filled the media worldwide with distressing pictures of the streets clogged with piles of uncollected waste, the drainage channels along the country roads that had become ad hoc dumping grounds, and the lorries standing still in long queues, unable to unload waste anywhere [4].
Waste system crises are experienced by many developed countries, which can be categorized by hot spots that lack capacities for disposal and shortages within the separated collection of waste and its recovery, resulting in damaging effects on the health of humans, the quality of the environment, and overall quality of life of humans in urban units. Bad waste management and poor waste performance are mostly linked to the high usage of landfills and the lower amount of separated collection for recycling. The latter is one of the key drivers to improving both disposals, including incineration and landfilling, and recovery, including composting and material recovery; it is also strongly connected to energy recovery. Policies of waste management are behind waste systems’ success, which is otherwise mainly driven by market forces and social capital. These are possibly sufficient or not sufficient operationally in determining the successful management of waste, like compliance with targets, which are determined by issues of sanitary and cost–benefit economic considerations, which comprise external accounting [5].
Different studies have explored waste management in different directions. Studies have mainly focused on waste management’s technical aspects and key areas and aspects. Some studies have studied the Sustainable Development Goals and their impacts in various contexts; for example, a study on construction and demolition waste management focused on the overall situation, achievements, and challenges [6]. Waste disposal and landfill are also explored by different studies, like one exploratory study, which focused on waste disposal and landfills in Italy [7]. Another study on solid waste composition and the efficiency of separate collection at the municipal level in Italy has been conducted to characterize the composition of municipal solid waste [8]. Some influencing factors concerning waste management, like per capita production, separate collection, and costs of municipal solid waste, have been studied in one paper at a regional level in Italy [9]. In some previous studies, the relationships between waste management, the circular economy, sustainability, and SDGs have also been studied, and the regional and international approaches concerning waste management have also been explored. Similarly, one study assessed the association between the goals of the circular economy and waste management policies [10]. The circular economy business models are studied and discussed in one of the articles, concerning the achievement of Sustainable Development Goals in the waste management sector [11]. In regard to waste management and SDGs, studies like that by [12] assessed the regional performance of SDGs in Italy; another study by [13] highlighted the implementation of SDGs at the local level and a study by [14] studied the adaptation of SDGs and achievements. In terms of waste management, sustainability, and SDGs, there are studies like a study by [15] on SDG 3, a study by [16] on SDGs 12 and 14, a study by [17] on SDGs 11, 12, and 13, and a study by [18] on SDGs 7, 12, and 13 and the intersections with the circular economy. However, this study has assessed the relationship between waste management and sustainable development goals differently by focusing on the achievements of different waste indicators that concern waste management in Goal 6, “Ensure availability and sustainable management of water and sanitation for all”, Goal 7, “Ensure access to affordable, reliable, sustainable and modern energy for all”, Goal 11, “Make cities and human settlements inclusive, safe, resilient and sustainable”, and Goal 12, “Ensure sustainable consumption and production patterns”. Specific indicators under SDGs 6, 7, 11, and 12 are focused on in this study. The study has entirely focused on waste management in the national context in Italy and analyzed the impact of waste management on the achievement of waste indicators in the Sustainable Development Goals. The integrated solid waste management concept has been taken as an important concept, concerning the achievement of SDG indicators.
2. Objectives
This research study has focused specifically on SDGs 6, 7, 11, and 12, with a specific focus on the targets impacted by integrated waste management in Italy. The study has analyzed the achievement of waste indicators under the SDGs 6, 7, 11, and 12. The study has assessed the relationship between social, economic, and geographical variables with the achievement of the mentioned SDGs and also the impacts of the social, economic, and geographical context of inhabitants on the achievements of the SDGs.
3. Context of Waste Management and SDGs
The efforts towards global sustainability and waste management are strongly interconnected because waste management has an important role in global sustainability, mainly in the context of the UN Agenda 2030. Addressing issues like resource recovery, pollution, waste reduction, and waste management has a direct influence on different goals of the UN agenda for 2030, like SDG 6 “Clean Water and Sanitation”, SDG 7 “Affordable and Clean Energy”, SDG 11 “Sustainable cities and communities”, and SDG 12 “Responsible consumption and production”. The transition from linear to circular economy models globally has emerged as a critical strategy to decouple the growth of the economy from environmental degradation [19]. Despite advancements in waste management systems, global waste is expected to increase, which poses significant challenges to efforts to achieve SDG targets [20]. There are various challenges to waste management; in developing countries, infrastructure and governance challenges are key hurdles that result in inefficiency in waste management. On the other hand, developed countries, including European countries, have shown the potential of waste management frameworks for advancing the achievements of SDGs, mainly by bringing about innovations in composting, recycling, and the recovery of energy [21]. But there is still a gap in aligning these practices with the larger socio-economic and environmental outcomes highlighted by SDGs [22].
Italy presents a critical case to evaluate waste management’s role in achieving Sustainable Development Goals, given the diversity of the country and adherence to strict EU regulations. The country has taken important steps to adopt the principles of the circular economy, mainly by recycling and initiatives of water to energy, which align with SDG 12, “responsible consumption and production”. The rate of recycling in Italy has exceeded the EU average, with some regions like Emilia-Romagna serving as benchmarks in terms of effective waste management [23]. However, there are disparities in the country across the regions, with the southern part often lagging in infrastructure, governance, and participation of the public compared to the central or northern regions [24]. Regarding SDG 6, “clean water and sanitation”, in some parts of the country, improper disposal of waste has led to the contamination of water bodies, which poses challenges to achieving SDG 6 targets. Efforts to mitigate these issues have included investments in facilities for wastewater treatment and the enforcement of waste disposal regulations [25]. The waste management practices in Italy have influenced SDG 7, “Affordable and clean energy”, mainly through the expansion of plants from waste to energy. The facilities contribute to the targets of renewable energy and reduce dependence on landfills. However, such distribution remains uneven, with some of the regions highly dependent on incineration while others make efforts to develop the same kind of capabilities [24]. The urban regions of Italy have applied innovative waste management solutions, like smart waste collection systems and community recycling initiatives, concerning the achievement of SDG 11, “sustainable cities and communities”. However, the rural and faraway areas still lack the infrastructure and resources needed to replicate this success. These disparities highlight the importance of localized strategies that focus on considering geographic and socio-economic variables [26]. The waste management efforts of Italy show progress toward achieving SDGs. The experiences emphasize the need for an integrated approach that can bridge regional disparities, improve infrastructure, and align the national policies to the local context to ensure equal progress. These insights present the critical foundation for understanding the role of integrated solid waste management in achieving SDGs in diverse geographical and socio-economic settings.
The advances in SDG targets concerning waste management are strongly linked to geographical and socioeconomic factors. Urbanization, population density, and socioeconomic status significantly affect the outcomes of waste management. For example, the wealthier municipalities often show a higher rate of recycling because of better access to infrastructure and campaigns for public awareness [26]. On the contrary, the socio-economic disparities can intensify inefficiencies in the system of waste management, mainly in the achievement of SDG 6 and SDG 11. The rural areas experience logistical challenges in the collection and treatment of waste, which lead to inadequate advancements in water, sanitation, and urban sustainability. In addition, the structures of tariffs and the role of public and private operators also play an important role in shaping economic sustainability in the national context [27].
The existing research highlight the importance of integrated solid waste management to achieve SDGs; however, a specific focus on the SDG targets and indicators that concern waste is important to explore, mainly in the Italian context. Studies have focused on isolated contexts, like energy recovery or relying, without integrating social, environmental, or economic dimensions. Furthermore, the associations between geographical disparities and the achievements of the SDGs remained unexplored. These gaps highlight the need for context-focused analysis that examines the holistic impacts of the practices of waste management on the outcomes of SDGs concerning waste management.
4. Theoretical Framework
Integrated solid waste management is applied to refer to the management of chains of procedures from the storage/discharge and the context to the collection, treatment, and final disposal of all the materials of waste [28]. The important concept of integrated solid waste management has been established from experiences addressing specific common issues with the management of municipal waste. International agencies realized that it was not possible to achieve improvements in waste management with the disconnected approach. Therefore, the integrated waste management approach was needed to reduce the increased amount of waste that needs proper collection, treatment, and disposal [29]. The integrated approach helps to take into account every dimension that can possibly affect the process of solid waste management, additionally taking into account every actor or influencer in the process of solid waste management.
Integrated solid waste management can also be understood as the strategic approach to the sustainable management of solid waste that covers all sources and aspects, including waste generation, separation, transfer, sorting, creation, recovery, and disposal in an integrated manner; it also emphasizes maximizing resource-use efficiency [30]. The Integrated Solid Waste Management (ISWM) concept serves as a theoretical framework for this research study. It helps in providing a comprehensive, systematic, and interdisciplinary approach to understanding and improving the outcomes of environmental sustainability. Integrating ISWM principles into this research offers valuable insights into how effective waste management practices can help contribute to the achievement of Sustainable Development Goals. Figure 1 further helps to understand the conceptual understanding.
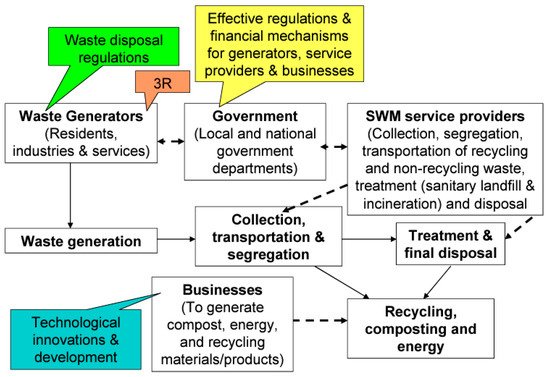
Figure 1.
Integrated solid waste management—management perspective (Source: [29]).
5. Data and Method
This study has used the dataset from available national databases on waste management from different sources, including ISPRA, ISTAT, and Eurostat data sources. The study has focused on four different Sustainable Development Goals with specific targets and focused on key indicators specifically under each target. This study has applied different types of analysis, including descriptive analysis on the achievement of specific indicators under each SDG, correlation to find out the relationship between social, economic, and geographical variables with the achievement of SDGs, and also the measured impacts of these social, economic and geographical variables with the achievement of SDGs by applying Partial Least Squares Regression (PLSR) and Elastic Net Regression. The data have been used from the years 2015 to 2020.
5.1. Descriptive Analysis
This study has applied descriptive analysis on the performance of specific SDGs, including Goals 6, 7, 11, and 12, and different targets and indicators of these specific goals have been analyzed. The percentage mean values of the performance of waste indicators under these goals and targets are analyzed and presented in the graphs. This study has taken specific indicators under each SDG as below.
- SDG 6: 6.3.1 “Proportion of domestic and industrial wastewater flows safely treated”
- SDG 7: 7.1 “ensure universal access to affordable, reliable and modern energy services” and 7.2 “increase substantially the share of renewable energy in the global energy mix”.
- SDG 11: 11.6.1 Proportion of municipal solid waste collected and managed in controlled facilities out of total municipal waste generated by cities.
- SDG 12: 12.4.2 (a) Hazardous waste generated per capita; and (b) proportion of hazardous waste treated, by type of treatment, and 12.5.1, national recycling rate, tons of material recycled.
5.2. Correlation Analysis
Pearson’s Correlation analysis was applied to identify the strength and direction of association between different demographic, economic, and environmental variables. The Pearson’s Correlation coefficient (r) was used to measure the linear relationship between the variables.
5.3. Partial Least Squares Regression (PLSR)
Partial Least Squares Regression (PLSR) has been applied in this study because of its unique strengths in dealing with complex datasets with various interrelated dependent and independent variables. PLSR is especially suitable for analyzing the relationships between social and economic variables and indicators of SDGs because it can efficiently manage multicollinearity between predictors and is strong with small sample sizes.
Partial Least Squares Regression (PLSR) has been extensively used in research studies to explore the complex associations between social, economic, and environmental features and their impact on sustainable development. For example, ref. [31] applied it to analyze the factors of sustainable development in the framework of corporate social responsibility and environmental performance. Their study established how this could efficiently deal with multiple dependent variables and the collinear predictors to provide an understanding of the drivers of sustainable development. There is another similar example [32] that applied PLSR to assess the impact of different economic and social indicators in achieving the Sustainable Development Goals. In addition, ref. [33] used this approach to investigate the influence of governance and institutional quality on sustainable economic growth by emphasizing the capability of the method to model multifaceted relationships in sustainability research. These studies highlight the importance and relevance of PLSR in analyzing the complex connections between social and economic variables and outcomes of sustainable development.
Applying the PLSR, the complex relationships among demographic variables, economic indicators, and composite SDG indicators could be modeled. This approach provides clear insights into how different factors contribute to outcomes of sustainable development to make it a perfect choice for analysis. In this research study, Partial Least Squares Regression (PLSR) was applied to investigate the relationships between different social and economic variables and the achievement of specific Sustainable Development Goals (SDGs).
The dataset used in the analysis spans from the year 2015 to 2020, which includes independent variables like “Population aged 0–14”, “Population aged 15–64”, “Population aged 65 and over”, “Average annual wage”, “Average number of people per household”, “Unemployment Rate”, “Employment Rate”, “Male Population”, and “Female Population”. Dependent variables were taken by creating the composite indicators on achievements of different indicators under each SDG including “Composite Indicators for SDGs of SDG 6, SDG 7, SDG 11 and SDG 12”. The data were first uploaded and inspected for variations. Different independent and dependent variables were separated, and any missing values were attributed to mean values.
PLSR was conducted employing the PLS package in R. The PLSR model was used for predicting the composite SDG indicators based on social and economic variables. The model was applied with the following formula:
where
Y = β0 + β1X1 + β2X2 + … + βpXp + ϵ
- Y presents the matrix of dependent variables, “Composite Indicators for SDGs”;
- X presents the matrix of independent variables, “social and economic variables”;
- βi are the coefficients of regression;
- ϵ is the error term.
The coefficients are taken to determine the direction and scale of the impact of each independent variable on composite indicators. Positive coefficients show a positive relationship, while negative coefficients show a negative relationship.
5.4. Elastic Net Regression
The Elastic Net is a sophisticated regularization technique in regression analysis, which helps to mitigate the limitations of the ridge and lasso regression by combining their strengths. It is especially effective in situations when there are multiple correlated features. The lasso might select one feature randomly among the correlated ones, and the ridge may include all but does not differentiate the importance. By shrinking some coefficients and setting the others to zero, Elastic Net can overcome this, selecting performing variables and regularizing complexity. This kind of duality allows it to perform well even in conditions of higher dimensionality and multicollinearity among the variables. The incorporation of both penalties ensures that the model remains sparse and yet stable. It is especially useful when dealing with a dataset that shows both features with higher dimensionality and features at a large scale. This is also efficient computationally and is proven to outperform the constituent methods, particularly in the time of dealing with data that has various features that may influence the response variables [34]. The Elastic Net has been applied by other studies in similar areas to this study, like [35] applied the Elastic Net approach of comparative analysis to the methods of machine learning for predicting the recovery of energy from waste, and [36] assessed the ground-improved alternative of multiple solid-waste dump sites by testing the plate load tests. There is another related study by [37], which applied Elastic Net to find out the impact of the capacity and performance of selected indicators of tourism on unemployment. This research study is also finding out the relationship between socioeconomic variables and the achievement of specific SDGs.
In this research study, Elastic Net Regression is applied to model relationships between various socio-economic indicators like migration rates, unemployment, average annual wages, and population demographics, and the composite indicators for Sustainable Development Goals (SDGs), which shows the achievements of different waste indicators of SDGs. The Elastic Net method combines the strengths of both Lasso (L1 regularization) and Ridge (L2 regularization) regression to make it especially well-suited for the dataset used in this study, which includes potentially correlated predictors, like employment and wage data or population age distributions. By employing a regularization penalty, Elastic Net efficiently handles multicollinearity, selecting only the most impactful predictors while shrinking the coefficients of less relevant variables towards zero. This is crucial to ensure that the model remains interpretable and avoids overfitting, mainly in cases where the number of predictors may exceed or be comparable to the number of observations.
The Elastic Net approach effectively uses a trade-off between bias and variance through the regularization parameters λ and α, where λ controls the overall penalty strength and α adjusts the mix between Lasso and Ridge penalties. The approach is mentioned as
where
- yi are the observed outcomes (SDG composite indicators),
- Xij are the predictor variables (socio-economic indicators),
- βj are the regression coefficients,
- α ∈ [0, 1] balances Lasso (α = 1) and Ridge (α = 0),
- λ is the regularization strength.
This formulation allowed accounting for both the sparsity of the coefficients (via Lasso) and the shrinkage of highly correlated predictors (via Ridge), to make Elastic Net ideal for the high-dimensional dataset. Cross-validation was used to select the optimal value of λ, balancing model complexity with predictive accuracy. This method provides a vigorous framework for interpreting complex, multi-dimensional data and offers strong predictive power, making it a justified and valuable choice for this research.
6. Results
The results have been divided into three parts: The first part contains the descriptive results, the second part has results of the correlation, and the third part presents the results of Partial Least Squares Regression (PLSR).
6.1. Descriptive Results
Below are the descriptive results under each SDG; the results are presented in graphs that contain the achievements of each specific indicator under each SDG.
SDG 6. Ensure availability and sustainable management of water and sanitation for all: Target 6.3 of SDG 6 measures the performance. Figure 2 presents the results of SDG indicator 6.3.1.
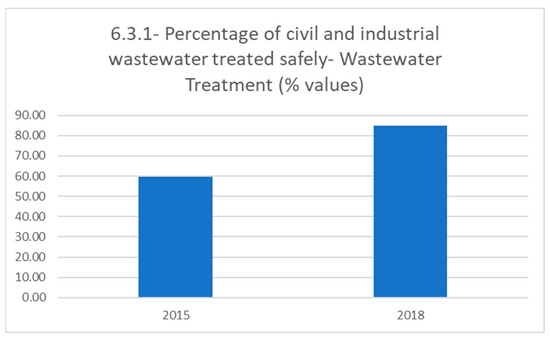
Figure 2.
Achievement of SDG 6.3.1.
The above Figure 2 mentions the achievements of waste indicators of SDG 6 by assessing the performance of waste management concerning indicator 6.3.1, “percentage of civil and industrial wastewater treated safely”. Based on the availability of data on public data sources, the study has analyzed data limited to 2015 and 2018 for SDG 6. It can be seen in the one graph on SDG indicator 6.3.1 that in 2015, the percentage of urban wastewater that was treated with secondary or advanced treatment was remarkably higher, attaining about 60%, while this trend increased to 84% in the year 2018. This high level specifies the strong importance of treating wastewater to a higher standard, confirming that it is safe for release into the environment or for reuse.
SDG 7. Ensure access to affordable, reliable, sustainable, and modern energy for all: The waste indicators of SDG 7 are measured under target 7.1, including indicator 7.1.1, and under target 7.2, including target 7.2.1. Figure 3 and Figure 4 mention the achievement of SDG 7.1.1 and 7.2.1, respectively.
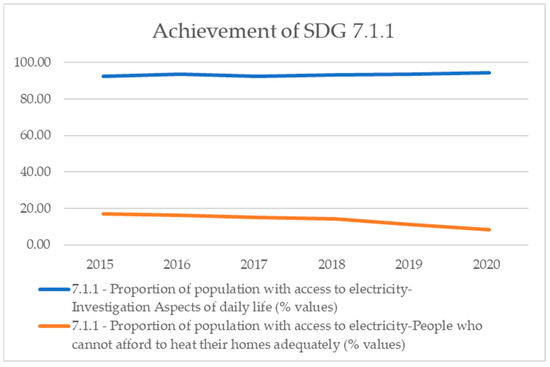
Figure 3.
Achievement of SDG 7.1.1.
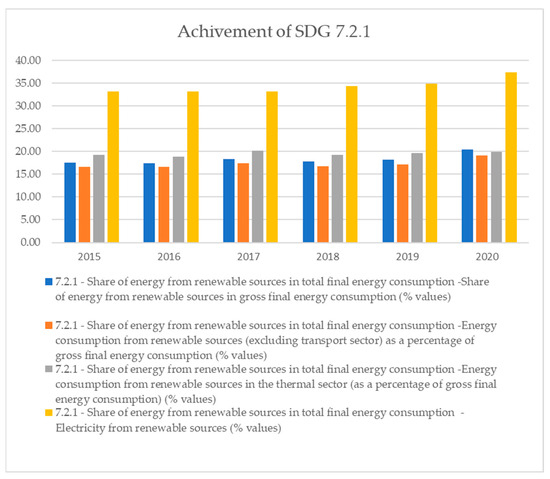
Figure 4.
Achievement of SDG 7.2.1.
Figure 3 shows the achievements of target 7.1 under two indicators from 2015 to 2020: the proportion of the population with access to electricity and the proportion of the population who do not have the means to heat their homes effectively. The blue line, presenting the percentage of the population with access to electricity, mentions a reliably high percentage, starting at around 95% in the year 2015 and progressively increasing to closer to 98% by the year 2020. This shows an important and constant determination to increase and maintain access to electricity, showing the successful development of infrastructure and policy measures that ensure a larger majority of the population is connected to the power grid, which is important for daily life and economic activities. In contrast, the orange line, showing the number of people who cannot afford to heat their homes sufficiently, shows a stable decline over the same period. Beginning at about 18% in the year 2015, this amount decreased steadily each year, reaching around 10% by the year 2020. This descending trend suggests important improvements in the economic conditions, the efficiency of energy, and the success of support mechanisms focusing on reducing energy poverty. Features contributing to this positive tendency could include improved household incomes, improvements in home insulation and heating systems, and aids or financial support programs intended to help vulnerable populations.
Figure 4 above highlights the progress towards achieving SDG 7 by assessing various indicators related to the share of energy from renewable sources in the total final energy consumption from the years 2015 to 2020. The graph contains four key indicators, including “the overall share of renewable energy”, “the share excluding the transport sector”, “the share in the thermal sector”, and “the share in electricity generation”. Over the years, energy share from renewable sources in the total final energy consumption (represented by blue bars in the graph) has remained relatively constant, shifting at around 17% to 18%, demonstrating consistent incorporation of renewable energy into the overall energy mix. When the transport sector (represented by orange bars) is assessed, the share presents a somewhat lower but stable tendency, ranging from around 15% to 16%, suggesting that the sources of renewable energy penetrate the transport sector. The thermal sector (represented by the gray bars) highlights a somewhat higher share of renewable energy, shifting between 19% and 20%, representing a comparatively higher consumption of renewable sources for heating and cooling as compared to the overall consumption of energy. Particularly, the share of electricity produced from renewable sources (represented by yellow bars) is meaningfully higher than other indicators, stably at around 30% to 35%, indicating a stronger emphasis and success in integrating renewable sources into electricity production. This trend suggests effective policies and investments in the power sector, contributing towards a more progressive transition in electricity compared to other sectors of energy.
SDG 11. Make cities and human settlements inclusive, safe, resilient, and sustainable: The waste indicator of SDG 11 is measured under indicator 11.6.1. Figure 5 shows the outcomes in different years below.
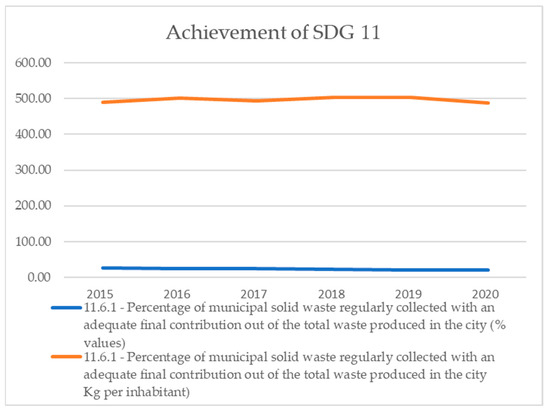
Figure 5.
Achievement of SDG 11.6.1.
Figure 5 highlights progress towards achieving SDG 11 by assessing two key indicators concerning municipal solid waste management from the years 2015 to 2020. During the observed period, the percentage of municipal solid waste frequently collected (represented by a blue line) persisted at a reliably low level, starting at a slight percentage in the year 2015 and keeping this low level through the year 2020. This shows a slight change in the amount of municipal solid waste being effectively managed in terms of consistent collection and final disposal, showing a significant area for development in waste management practices within the cities. Alternatively, the orange line (representing the kilogram per inhabitant measure) presents a relatively higher and steady trend. Starting at about 500 kg per inhabitant in 2015, this experienced slight variations but remained around the same level, representing a stable amount of the waste being collected per capita. These findings suggest a difference between the amount of waste generated per person and the effectiveness of the systems of waste collection and management. While per capita waste collection is sustained at a relatively persistent level, the overall low percentage of sufficiently managed waste points to inadequacies and potential issues in scaling up waste management practices to meet total demand. To advance towards achievement of SDG 11, it is important to address these inadequacies by improving the systems of waste collection, growing the capacity for final waste disposal, and applying more efficient waste management policies that can deal with the total production of waste by urban populations.
SDG 12. Ensure sustainable consumption and production patterns: The waste indicators of SDG 12 are measured under indicators 12.4.1 and 12.5.1. Figure 6 below mentions the outcomes of different indicators of SDG 12.
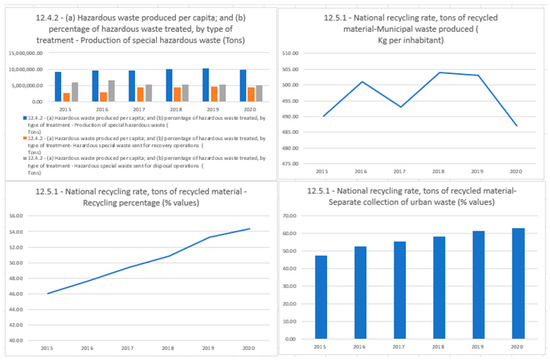
Figure 6.
Achievement of SDG 12.4.2 and 12.5.1.
The above Figure 6 mentions the achievements of waste indicators of SDG 12 and mentions the performance under different indicators. The data have been analyzed from 2015 to 2020 to find out the performance of waste indicators.
Graph one on the performance of indicator 12.1.2 shows three key indicators, including “the production of special hazardous waste (represented by blue bars)”, “the hazardous waste sent for recovery operations (represented by orange bars)”, and “the hazardous waste sent for disposal operations (represented by gray bars)”. In the observed period, the generation of special hazardous waste remained constantly high, remaining at the value of around 9 million tons per year. This shows a steady production of hazardous waste, highlighting ongoing industrial and economic activities that contribute to hazardous waste generation. The orange bars, which represent hazardous waste sent for recovery operations, show a comparatively lower but constant trend as compared to overall production. This ranges from around 2 million tons to 2.5 million tons every year. This constant trend suggests consistent determination in recovering and recycling hazardous waste, although at a lower scale compared to its production. The gray bars, which indicate hazardous waste sent for disposal operations, also present a constant yet higher level as compared to the recovery operations, ranging from around 4 million tons to 5 million tons each year. This specifies that an important portion of hazardous waste is being disposed of rather than recovered, which might highlight limitations in the recovery infrastructure, or the nature of waste produced that makes the recovery less achievable. The data shows an insistent challenge in handling hazardous waste, where waste generation remains high, and disposal operations dominate over efforts of recovery.
The performance of SDG target 12.5.1 has been mentioned in three different areas. Graph two highlights the national recycling rate in terms of the percentage of recycled material from the years 2015 to 2020. In the mentioned period, there is a clear rising trend in the rate of recycling, highlighting a steady and significant advancement in practices and policies of recycling. At the initial value of 46% in the year 2015, the rate of recycling steadily improved annually, attaining about 54% by the year 2020. This constant rise highlights ongoing commitments and successful initiatives for enhancing the systems of recycling, awareness among the public, and improving the overall efficiency of the practices of waste management. Graph three presents the national rate of recycling in terms of municipal waste generated per inhabitant, with values measured in kilograms, from the year 2015 to 2020. The data present a shifting trend in the amount of municipal waste generated per inhabitant. At the starting value of around 490 kg per inhabitant in the year 2015, the waste production increased to about 500 kg in the year 2016. Following this trend, there was a small decline in the year 2017, reducing back to about 490 kg. In the year 2018, the waste generation increased again, reaching around 505 kg per inhabitant, before steadying somewhat above 500 kg in the year 2019. However, by the year 2020, there was a prominent reduction, with the waste production per inhabitant reducing to about 485 kg. The graph overall represents the importance of continuous determination in promoting waste reduction at the individual level. Graph four highlights the national rate of recycling by focusing on the separate collection of urban waste as a percentage of the total urban waste from the years 2015 to 2020. In the year 2015, separate urban waste collection was recorded at about 47%. Over the following years, there was a stable rise in this value, reaching 52% in the year 2016. This trend continued to increase; the percentage remained at about 55% in the year 2017, 57% in the year 2018, and 60% in the year 2019. In the year 2020, it reached about 61%. This constant increase in the separate collection of urban waste suggests important progress in the practices of waste segregation. The data also represents the positive impact of targeted determinations for improving the separate urban waste collection. This development is important for enhancing rates of recycling and minimizing the environmental impact of waste, supporting the wider aims of SDG 12 related to responsible consumption and production.
6.2. Results of Pearson’s Correlation Coefficients
The results of Pearson’s Correlation coefficients have been presented separately. The results of each SDG with social and economic indicators are presented in a separate Table 1 below.

Table 1.
Correlation coefficients (indicators of SDG 6 and social and economic indicators).
The results of the correlation coefficients of indicators of SDG 6 and social and economic indicators highlight different associations between different variables. The above table highlights those associations.
The total migration rate, highlighted as the net number of people per thousand inhabitants migrating into or out of the region, highlights significant negative correlations −0.468 with % of the safely treated civil and industrial wastewater, and −0.468 with % of the water bodies achieving high or good ecological quality. These findings suggest that regions dealing with higher migration rates may face the challenges of maintaining environmental quality.
In terms of age brackets, the population aged 0–14 is significantly correlated with different environmental quality indicators. It demonstrates positive correlations of 0.597 with % of the safely treated wastewater and with % of the water bodies achieving high or good ecological quality, respectively. These positive correlations highlight that regions with higher proportions of the population aged 0–14 tend to show better environmental quality standards. There are similar correlation values with the population aged 15–64, showing significant correlation, including 0.653 with % of the safely treated wastewater, and 0.653 with % of the water bodies achieving the high or good ecological quality, respectively. This also highlights that regions with a higher proportion of working-age population aged 15–64 may benefit from the better practices of environmental management, while the population aged 65 or over shows significant negative correlations with different indicators, presenting the correlation of −0.620 with % of the safely treated wastewater, and −0.620 with % of the water bodies achieving high or good ecological quality, respectively. These negative correlations suggest that the areas with higher elderly populations might experience poorer environmental quality.
In terms of economic indicators, the average wage values (in euros) have been taken, reflecting the economic situation over time. They have mixed correlations with the SDG 6 indicators. The correlation values include −0.131 with % of the safely treated wastewater, and −0.620 with % of the water bodies achieving high or good ecological quality, respectively. The data proposes a complex relationship between levels of income and SDG 6 conditions, where higher wages may be associated with better infrastructure and management.
In the values of household size, the average household size in Italy is moderately correlated with various SDG 6 indicators. The significant correlations include 0.632 with % of the safely treated wastewater, and 0.632 with % of the water bodies achieving high or good ecological quality, respectively. These correlations highlight that larger households are more prevalent in the regions with better achievements of SDG 6 indicators.
The study has also highlighted the unemployment and employment rates. The unemployment rate shows significant correlations with different indicators. It shows a positive correlation of 0.531 with the % of safely treated wastewater, and with % of the water bodies achieving high or good ecological quality, respectively, while the employment rate is found to be significantly correlated with a negative correlation of −0.531 with % of the safely treated wastewater and with % of the water bodies achieving high or good ecological quality, respectively. These results suggest that higher employment rates might be associated with better environmental management in a few contexts.
The study has also highlighted the relationship between the male and female populations in achieving the indicators of SDG 6. It is found that the total number of males highlights significant positive correlations with different indicators. Prominent correlations include 0.632 with both the indicators; there are similar correlations with the female population, which has correlations of 0.635 with both the indicators.
Table 2 shows the results of correlation coefficients among different indicators of SDG 7 and social and economic indicators. The correlation between the proportion of the population with access to electricity and various other indicators shows different relationships. There is a weak positive correlation of 0.205 with the total rate of migration per thousand inhabitants, suggesting that regions with higher rates of migration may have somewhat better access to electricity. There are strong negative correlations of −0.784 with the population aged 0–14 and −0.792 and the population aged 15–64, highlighting those areas with a higher % of younger and middle-aged populations who tend to have less access to electricity. In contrast, there is a strong positive correlation of 0.790 with the population aged 65 and over, resulting in areas with more elderly populations tending to have better access to electricity. The average annual wage represents a weak positive correlation of 0.154, while the average number of people per household correlates to −0.769, the unemployment rate is −0.803, and the employment rate is 0.803; these all have strong correlations that highlight significant relationships between these economic and social factors and with this SDG 7 indicator. The correlation of this indicator with the male population is 0.072, and with the female population, it is 0.068, reflecting weaker relationships. These findings highlight that demographic and economic aspects significantly influence SDG indicator 7.1.1.
Table 2.
Correlation coefficients (indicators of SDG 7 and social and economic indicators).
A similar SDG indicator with a different focus, “Proportion of population with access to electricity People who cannot afford to heat their homes adequately”, is strongly positively correlated at 0.978 with the population aged 0–14 and 0.939 with the population aged 15–64, highlighting that regions with higher amounts of younger and middle-aged populations also have more people who cannot afford suitable heating. In contrast, there is a very strong negative correlation of −0.973 with the population aged 65 and over, highlighting that areas with more elderly people have fewer individuals unable to afford heating. The average annual wage represents a very weak negative correlation of −0.060. There are very strong positive correlations: 0.944 with the average number of people per household, 0.989 with the unemployment rate, and a very strong negative correlation, −0.989, with the employment rate. This suggests that higher rates of unemployment and larger household sizes are linked to more people making efforts to afford heating. The correlation with males is −0.231 and females is −0.227; both are weakly negative.
The SDG indicator 7.2.1, “Share of energy from renewable sources in total final energy consumption. Share of energy from renewable sources in gross final energy consumption”, shows a moderate positive correlation of 0.439 with the total migration rate per thousand inhabitants, highlighting a moderate association between migration rates and the use of sources of renewable energy. There are strong negative correlations, −0.843 with the population aged 0–14 and −0.854 with the population aged 15–64, and a strong positive correlation of 0.825 with the population aged 65 and over. This specifies that regions with higher elderly populations are more likely to use renewable sources of energy, while those with younger populations are less likely in this regard. The average annual wage has a moderate negative correlation of −0.413. The average number of people per household correlates to −0.712, the unemployment rate is −0.846, and the employment rate is 0.846; these show strong correlations, representing significant relationships between these economic factors and this specific indicator of SDG. The correlation with males is 0.480, and with females is 0.476; these are moderate positive correlations. The moderate positive correlation with migration rates suggests that the regions experiencing higher migration may also be adopting renewable sources of energy, potentially because of increased demand and new development of infrastructure. The strong negative correlations with the younger populations highlight a need for targeted efforts to increase the adoption of renewable energy in these areas. The positive correlation with the elderly population mentions the potential for organizing communities to invest in renewable energy. Economic factors like household size, unemployment, and employment rates have significant roles in the usage of renewable energy, suggesting that economic stability and support for households can help promote the adoption of renewable energy.
The SDG indicator 7.2.1, “Share of energy from renewable sources in total final energy consumption. Energy consumption from renewable sources excluding transport sector as a percentage of gross final energy consumption”, has a moderate positive correlation of 0.460 with a total migration rate per thousand inhabitants, highlight a moderate relationship between migration and the use of renewable energy, excluding the transport sector. There are strong negative correlations with the population aged 0–14 at −0.806 and with the population aged 15–64 at −0.825, and a strong positive correlation at 0.787 with the population aged 65 and over. The average annual wage presents a moderate negative correlation of −0.481. The average number of people per household has a correlation value of −0.666, the unemployment rate is −0.805, and the employment rate is 0.805. This reflects significant relationships between these economic factors and the use of renewable energy. The correlation with males is 0.476, and with females is 0.473, which is moderately positive. The moderate positive correlation with the migration rates highlights that regions with higher migration might see an increase in the usage of renewable energy, likely because of the expansion of infrastructure to meet increasing demand. The strong negative correlations with younger populations show the challenge of promoting renewable energy. The positive correlation with elderly populations highlights that older, more stable communities are more motivated to invest in renewable energy. The economic correlations highlight that financial stability and household size significantly influence the adoption of renewable energy.
SDG 7.2.1, with a focus on “Share of energy from renewable sources in total final energy consumption. Energy consumption from renewable sources in the thermal sector as a percentage of gross final energy consumption”, has a weak positive correlation of 0.266 with the total migration rate per thousand inhabitants. There are moderate negative correlations with the population aged 0–14 at −0.606 and aged 15–64 at −0.547, and a moderate positive correlation at 0.586 with the population aged 65 and over. The average annual wage mentions a moderate negative correlation of −0.462. The average number of people per household correlates to −0.536, the unemployment rate is −0.545, and the employment rate is 0.545; it also shows moderate correlations, suggesting a significant but not strong relationship with these factors. The correlation with males is 0.116, and with females, 0.115—very weakly positive. The weak positive correlation with the migration rates suggests a smaller increase in the use of renewable energy in the thermal sector in areas with higher migration. The moderate negative correlations with younger populations suggest a need for increased efforts toward promoting thermal renewable energy. The positive correlation with the elderly population suggests that older communities are more motivated towards using renewable energy in the thermal sector. The economic correlations mention the influence of financial stability and household size on renewable energy adoption in the thermal sector.
SDG indicator 7.2.1, with a focus on “Share of energy from renewable sources in total final energy consumption. Electricity from renewable sources”, shows a weak positive correlation of 0.332 with the total migration rate per thousand inhabitants. There are very strong negative correlations with the population aged 0–14 at −0.913 and aged 15–64 at −0.910, and a very strong positive correlation at 0.905 with the population aged 65 and over. The average annual wage shows a very weak negative correlation of −0.022. The average number of people per household correlates to −0.838, the unemployment rate is −0.946, and the employment rate is 0.946.
The correlation with males is 0.429, and with females is 0.425, which is moderate and positive. The weak positive correlation with migration rates highlights that areas with higher migration may see a small increase in the adoption of renewable electricity. The very strong negative correlations with the younger populations show a significant challenge to promoting renewable electricity among these groups. The strong positive correlation with the elderly population suggests that older communities are more likely to adopt renewable electricity. Economic factors like household size, unemployment, and employment rates play key roles in the adoption of renewable electricity.
Table 3 shows the results of correlation coefficients among two different indicators of SDG 11 and social and economic indicators. The SDG indicator 11.6.1 focuses on “the percentage of municipal solid waste regularly collected with an adequate final contribution out of the total waste production in the city” and is very strongly positively correlated with the population aged 0–14 at 0.962 and 15–64 at 0.961, highlighting that areas with higher proportions of younger and middle-aged populations have better practices of waste collection. This might be because younger and middle-aged populations are more likely to be actively engaged in their daily activities, which promotes better waste management. In contrast, there is a very strong negative correlation with the population aged 65 and over at −0.972, showing that areas with higher elderly populations have poorer practices of waste collection. This may be because older populations may produce less waste overall or have different behaviors toward waste management. The average annual wage shows a weak negative correlation of −0.232, highlighting that higher wages do not necessarily translate into better practices of waste collection practices. The average number of people per household correlates to 0.969, the unemployment rate is 0.946, and the employment rate is −0.946. This reflects significant relationships between these economic factors and the efficiency of waste collection. Larger households and higher unemployment rates are linked with better practices of waste collection, probably because of increased awareness and communal efforts in waste management. The very weak correlations with male, 0.141, and female, 0.144, populations suggest that gender distribution has a negligible impact on the efficiency of waste collection.
Table 3.
Correlation coefficients (indicators of SDG 11 and social and economic indicators).
The SDG indicator 11.6.1, with the focus on “the percentage of municipal solid waste regularly collected with an adequate final contribution out of the total waste production in the city”, presents very weak correlations with most demographic indicators. There is a strong positive correlation with average annual wage, at 0.833, highlighting that higher-income areas tend to have better practices of waste collection in terms of kg per inhabitant. This suggests that wealthier areas might have better resources and infrastructure for waste management. There are strong negative correlations with male and female populations, −0.836 for both, suggesting that areas with larger populations might struggle more with effective waste collection on a per inhabitant basis. This could be because higher population densities lead to more waste generation and potential challenges in the collection and administration. The very weak correlations with the total migration rate, the population aged 0–14, aged 15–64, and age 65 and over, the average number of people per household, unemployment rate, and employment rate highlight the minimal relationship with these factors, suggesting that other variables not captured in these dataset might have an impact on waste collection efficiency per inhabitant.
Table 4 shows the results of correlation coefficients among two different indicators of SDG 12, focusing on different areas under these indicators, with possible associations with social and economic indicators. The waste indicator of SDG 12.4.2, focusing on “hazardous waste production per capita and the treatment of special hazardous waste”, has a weak positive correlation of 0.289 with the total migration rate, highlighting a smaller increase in hazardous waste production with higher rates of migration. There are strong negative correlations with populations aged 0–14 at −0.755 and aged 15–64 at −0.746, indicating that regions with younger populations tend to produce less hazardous waste. In contrast, there is a strong positive correlation of 0.780 with the population aged 65 and over, which indicates higher hazardous waste production in areas with more elderly populations. The average annual wage presents a moderate positive correlation of 0.517, while the average number of people per household correlates with −0.847. The unemployment rate is −0.721 and the employment rate is 0.721. The moderate negative correlations with male −0.542) and female −0.545 populations show no gendered impact in this regard.
Table 4.
Correlation coefficients (indicators of SDG 12 and social and economic indicators).
The SDG indicator 12.4.2, with the focus on “hazardous waste production per capita and hazardous waste sent for recovery”, shows a moderate positive correlation of 0.429 with the total migration rate, showing some relationship between migration and recovery of hazardous waste. There are strong negative correlations with the population aged 0–14, 0.845, and 15–64, −0.824, and a strong positive correlation of 0.853 with the population aged 65 and over, highlighting that regions with older populations are more engaged in the recovery operations of hazardous waste. The average annual wage has a very weak positive correlation of 0.122. The average number of people per household is −0.862, the unemployment rate is −0.793, and the employment rate is 0.793, showing strong correlations and highlighting important economic impacts. The weak negative correlations with male, −0.292, and female, −0.294, populations show a minor decrease in the hazardous waste recovery.
Similarly, the SDG indicator 12.4.2, with a focus on “hazardous waste production per capita and hazardous waste sent for disposal”, presents a weak negative correlation of −0.395 with the total migration rate, highlighting a smaller decrease in the waste sent for disposal with higher rates of migration. There are also strong positive correlations with the population aged 0–14, 0.778, and aged 15–64, 0.743, and a strong negative correlation of −0.771 with the population aged 65 and over, suggesting that regions with younger populations generate more waste sent for disposal. In comparison, those with older populations generate less. The average annual wage shows a very weak positive correlation of 0.068. The average number of people per household is 0.740, the unemployment rate is 0.752, and the employment rate of −0.752 has strong correlations and significant economic impacts. The very weak negative correlations with male −0.108 and female −0.107 populations suggests a negligible impact on hazardous waste disposal practices.
The SDG indicator 12.5.1, with a focus on the “national recycling rate” from the results in the table, shows a weak positive correlation of 0.300 with the total migration rate, highlighting a small increase in recycling with higher migration rates. There are also very strong negative correlations with the population aged 0–14, 0.992, and 15–64, −0.958, and a very strong positive correlation of 0.995 with the population aged 65 and over, showing that the regions with older populations have higher recycling rates. The average annual wage has a very weak positive correlation of 0.180. The average number of people per household, −0.994, unemployment rate, −0.982, and employment rate, 0.982, show very strong correlations, mentioning suggesting economic differences impact on recycling practices. The very weak negative correlations with male −0.015 and female −0.019 populations suggest minimal impact on recycling rates.
Similarly, SDG 12.5.1, with a focus on “national recycling rate and the amount of municipal waste subject to separate collection”, shows the results as a moderate positive correlation of 0.344 with the total migration rate, which highlights a moderate increase in separate collection with higher rates of migration. There are also very strong negative correlations with the population aged 0–14, 0.925, and aged 15–64, 0.910, and a very strong positive correlation, 0.939, with the population aged 65 and over, highlighting that regions with older populations have higher rates of separate waste collection. The average annual wage has a moderate positive correlation of 0.316. The average number of people per household, −0.963, unemployment rate, −0.900, and employment rate, 0.900, present very strong correlations, which highlight significant economic impacts on the separate collection practices. The weak negative correlations with male, −0.281, and female, −0.284, populations highlight a minor decrease in separate collections.
The same indicator, SDG 12.5.1, with a focus on “national recycling rate and the separate collection of urban waste”, mentions a moderate positive correlation of 0.380 with the total migration rate, which highlights a moderate increase in urban waste collection with higher rates of migration. There are also very strong negative correlations with the population aged 0–14, 0.970, and aged 15–64, 0.958, and a very strong positive correlation of 0.979 with the population aged 65 and over, highlighting that regions with older populations have higher rates of urban waste collection. The average annual wage has a very weak positive correlation of 0.192. The average number of people per household, −0.979, unemployment rate, −0.949, and employment rate, 0.949, present very strong correlations, showing significant economic impacts on urban waste collection practices. The very weak negative correlations with male, −0.147, and female, −0.151, populations suggest a slight influence on urban waste collection rates.
The national recycling rate and municipal waste produced per inhabitant, focused by SDG 12.5.1, suggest a very weak negative correlation, −0.136, with the total migration rate, highlighting a slight decrease in the waste generation with higher rates of migration. There are very weak correlations with the population aged 0–14 at 0.085, aged 15–64 at 0.089, and aged 65 and over at −0.047, which suggests a slight impact of these age groups on waste production. The average annual wage has a strong positive correlation of 0.833, which indicates that higher-income areas tend to produce more waste per inhabitant. The average number of people per household, −0.102, unemployment rate, 0.104, and employment rate, −0.104, show very weak correlations, which highlight a slight economic impact on waste production. The strong negative correlations with male, −0.836, and female, −0.836, populations do not show any real impact in this regard.
The national recycling rate and circular usage rate, focused on SDG indicator 12.5.1, present a moderate positive correlation of 0.410 with the total migration rate, which indicates a moderate increase in circular usage with higher rates of migration. There are very strong negative correlations with the population aged 0–14, 0.967, and aged 15–64, 0.968, and a very strong positive correlation of 0.961 with the population aged 65 and over, showing that regions with older populations have higher circular usage rates. The average annual wage has a very weak negative correlation of −0.085. The average number of people per household, −0.898, unemployment rate, −0.972, and employment rate, 0.972, show very strong correlations, which indicate significant economic impacts on circular usage rates. The weak positive correlations with male, 0.259, and female, 0.255, populations suggest that gender has a slight impact.
6.3. Results of Partial Least Squares Regression (PLSR)
The table below shows PLS coefficients of population metrics and social and economic indicators of the achievements of Sustainable Development Goals 6, 7, 11, and 12 (See Table 5); these goals present the indicators of waste management. The achievements of the indicators of each SDG were arranged in the composite indicator under each SDG. The independent variables were taken as population metrics and social and economic indicators, and Partial Least Squares Regression has been applied among the independent variables and composite indicators of each SDG and dependent variable. The results are presented in +/−, indicating the positive or negative relationship. In contrast, variable importance in projection (VIP) scores are presented to summarize the influence a predictor has on both the X and Y variables. Typically
Table 5.
PLS Coefficients.
- VIP > 1: The variable is taken as important and has a strong impact.
- VIP < 1: The variable has a lower impact and may be less important to the model.
The results for each SDG have been divided into population metrics and social and economic indicators as below.
Population Metrics
SDG 6: The group of individuals aged 0–14 demonstrates an influence of 0.0326 on the accomplishment of Sustainable Development Goal 6. This suggests that as the percentage of the population within this age bracket rises, there is an increase in the achievement of SDG 6. This suggests that younger populations might contribute positively towards improvements in clean water and sanitation. There is also a small positive impact of 0.0321 on the population aged 15–64, which indicates that an increase in % of this age population somewhat increases the SDG 6 achievement. The elderly population, aged 65 and above, has an effect of 0.0329, indicating that a higher percentage of this age group correlates with a decrease in progress towards achieving SDG 6.
SDG 7: The population of children aged 0 to 14 has an effect of 0.0366 on SDG 7, indicating that a higher percentage of this age group correlates with a lower achievement of SDG 7. Similarly, the population of individuals aged 15 to 64 also shows an impact of 0.0368, suggesting that an increase in the percentage of this age group leads to a decrease in the achievement of SDG 7. However, the population aged 65 and over shows a small positive impact of 0.0351, which highlights an increase in % of the population aged 65 and over and also helps to increase the achievement of SDG 7.
SDG 11: The population of children aged 0 to 14 has shown an impact of 0.0351, indicating a modest improvement in achieving Sustainable Development Goal (SDG) 11. The increase in this age group’s population is contributing positively to the development of cities and communities. Similarly, the population of individuals aged 15 to 64 has led to an impact of 0.0360, signifying a slight advancement in SDG 11 with the growth in this age group population. There is a small negative impact of −0.0324 by the population aged 65 and over, which indicates a small decrease in the achievement of SDG 11 with an increase in the population of this age group.
SDG 12: The population aged 0–14 shows a small negative impact of −0.0373, which indicates a smaller decrease in the achievement of SDG 12 with an increase in the population of this age group, which may present challenges in ensuring sustainable consumption and production patterns with a larger young population. At the same time, the population aged 15–64 shows a small negative impact of −0.0359, which indicates a minor decrease in the achievement of SDG 12 with an increase in the population of this age group. While the population aged 65 and over has a small positive impact of 0.0393, it indicates a minor increase in the achievement of SDG 12 with an increase in the population of this age group.
The overall analysis shows that the population aged 0–14 has mixed effects on the SDGs, but positively influences clean water, sanitation, and sustainable cities, while also posing challenges for affordable energy and sustainable consumption. However, the analysis shows that the working-age population aged 15–64 generally supports the improvements in clean water and sustainable cities but might face challenges in the achievement of affordable energy and sustainable consumption. Similarly, the elderly population has mixed kinds of impacts, negatively affecting clean water and sustainable cities but positively impacting affordable energy and sustainable consumption.
Social Indicators
SDG 6: The average number of people per household has resulted in a small positive impact of value 0.0333, which indicates that an increase in the average number of people per household somehow helps increase the achievement of SDG 6. The study has also assessed the impact of male and female populations separately. The male population results in a very small positive impact of 0.0095, which highlights that an increase in the male population has a minor impact in terms of increasing the achievement of SDG 6. Similarly, the female population also has a very small positive impact of 0.0097, which highlights a similar context as the male population.
SDG 7: The average number of people per household has a small negative impact of −0.0279, which suggests that an increase in the average number of people per household might not help in achieving SDG 7, but it can decrease the achievement slightly on the other hand. Looking separately at the male and female populations, the study found a small positive impact on the male population, 0.0338, and the female population, 0.0336, highlighting the gendered impact on the achievement of SDG 7.
SDG 11: The average number of people per household has a small positive impact of 0.0203, which highlights the slight impact on achieving SDG 11, suggesting that an increase in the average number of people per household might slightly increase the achievement of SDG 11. Assessing the male and female populations separately, a moderate negative impact of males, −0.0631, and females, −0.0629, has been found, which highlights the slightly gendered impact in decreasing the achievement of SDG 11.
SDG 12: The average number of people per household has resulted in a small negative impact of −0.0462, which highlights its impact on a minor decrease in the achievement of SDG 12 with an increase in the average number of people per household. The impact of male and female populations has been assessed on the achievement of SDGs separately. The study showed that there is a moderate negative impact from the male population of −0.0488, as well as the female population, of −0.0490, which does not show a gendered impact overall.
Overall analysis suggests that larger household sizes slightly support the achievement of SDGs in terms of improvements in clean water and sustainable cities, but at the same time may delay progress in affordable energy and sustainable consumption. In the overall analysis, looking separately at male and female populations, an increase in the male population was found to positively influence clean water and affordable energy, but negatively impact sustainable cities and consumption patterns. In the same way, an increase in the female population has a positive impact on clean water and affordable energy but might negatively impact sustainable cities and consumption patterns.
Economic Indicators
SDG 6: The average annual wage has resulted in a small negative impact of −0.0056, which suggests that an increase in the average annual wage might decrease the achievement of SDG 6 slightly. While the employment rate has resulted in a small negative impact of −0.0314, it shows that an increase in the employment rate might not positively impact the achievement of SDG 6.
SDG 7: The average annual wage has resulted in a small negative impact of −0.0324, which shows that an increase in the average annual wage might not help in achieving SDG 7. There is a small positive impact of 0.0369 on the employment rate, which shows that an increase in the employment rate slightly increases the achievement of SDG 7.
SDG 11: The average annual wage has resulted in a moderate positive impact of 0.0577 on the achievement of SDG 11, which shows a moderate increase in the achievement of SDG 11 with an increase in the average annual wage, while when the employment rate is lower, a negative impact of −0.0369 has been found, which shows a minor decrease in the achievement of SDG 11 with an increase in the employment rate.
SDG 12: The average annual wage has resulted in a moderate positive impact of 0.0394 on the achievement of SDG 12; it highlights the moderate increase in the achievement of SDG 12 with an increase in average annual wage. At the same time, the employment rate has also resulted in a small positive impact of 0.0345 on the achievement of SDG 12, which shows a slight increase in the achievement of SDG 12, with an increase in the employment rate.
The overall analysis shows that higher wages contribute significantly towards sustainable cities and sustainable consumption, though there may be slightly negative impacts on clean water and affordable energy. While higher employment rates generally support affordable energy and sustainable consumption, this might bring challenges for clean water and sustainable cities.
6.4. Results of Elastic Net Regression
The results of the Elastic Net are discussed in two different figures in this paper, including the Elastic Net coefficients paths for each SDG in the figure and the cross-validation error in another figure. The results are further divided into two parts, including Elastic Net coefficients paths and cross-validation error.
Elastic Net Regression plots for each SDG in the above Figure 7 highlight the coefficient paths of various socio-economic predictors as the function of regularization parameter, lambda. As lambda increases, less influential coefficients are shrunk toward zero to allow the model to isolate the most significant predictors.
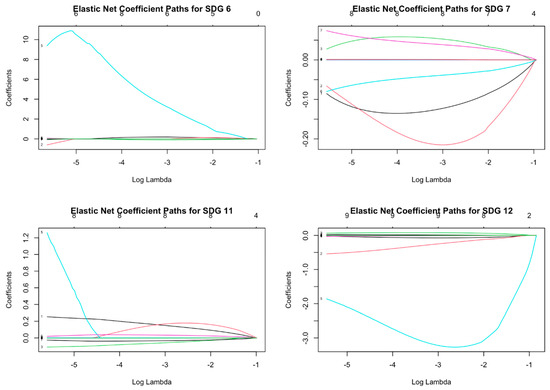
Figure 7.
Elastic Net coefficients paths.
For SDG 6 on clean water and sanitation, various predictors show notable influence. The average annual wage and unemployment rate show large coefficients that persist across a range of lambda values. This suggests that both economic conditions and labor market performance are important factors in determining water-related performance. These variables were less inclined to shrinkage under high regularization, suggesting that they are strong and significant predictors for SDG 6. Regarding SDG 7 on affordable, reliable, sustainable, and modern energy, predictors like average household size and population aged 0–14 emerged as key drivers. These factors show strong relationships with the performance of SDG 7, reflecting the strong impact of population dynamics on patterns and access to energy consumption. The coefficient paths for these variables remained non-zero over a wide range of lambda values, suggesting their considerable influence in achieving the SDG 7 indicators. For SDG 11 on sustainable cities and communities, socio-economic variables like the unemployment rate and total migration rate are found to be influential. The relatively slow shrinkage of these coefficients as lambda increased shows that the flow of migration and levels of employment play important roles in determining the performance of indicators of SDG 11. These findings come into line with the view that population mobility and conditions of the labor market are key determinants of the overall performance of waste indicators of SDG 11. Average annual wage strongly influences SDG 12, which focuses on responsible consumption and production. The sustained importance of this variable across different levels of regularization suggests that economic conditions, mainly wage levels, are important in shaping consumption patterns and their impact on performance. Higher wages likely drive increased consumption, which directly impacts the use of resources and the generation of waste, thus affecting the achievement of indicators of SDG 12.
In Figure 8, in the top-left panel, the plot for SDG 6 shows a clear downward trend in mean squared error (MSE) as lambda increases. The lowest error (lambda.min) happens at a value of around log (λ) ≈ −1.5, with a slight increase in error beyond this point as regularization continues increasing. This suggests that, firstly, the model performs optimally when lambda is relatively small, retaining larger predictors, and secondly, as lambda increases, fewer variables are retained, which eventually leads to a small increase in the error. This balance would prioritize only the most significant socio-economic factors, like the rate of unemployment and average wage, to predict performance on SDG 6 without overfitting.
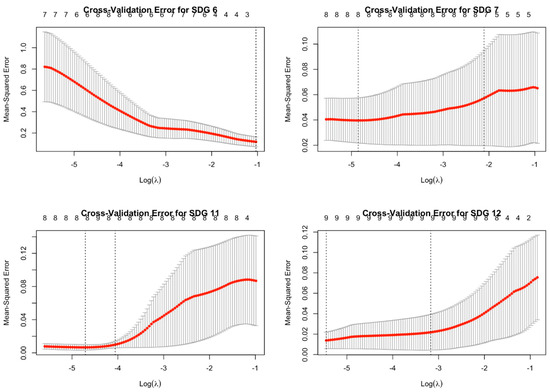
Figure 8.
Cross-validation error.
The SDG 7 is displayed in the top-right panel and shows a different pattern, where MSE starts to increase as lambda moves beyond the approximate log (λ) ≈ −5. This suggests that, firstly, a smaller lambda, corresponding to a more compound model, achieves better performance. Secondly, the low regularization suggests that multiple socio-economic factors, together with possibly the size of the household and population age distribution, contribute to predicting the performance of SDG 7, and finally, the sharp increase in MSE as lambda increases shows that the model becomes too much as regularization is applied. The lambda. min (lowest point) happens at a relatively small lambda, suggesting that the addition of more variables improves the model’s performance for achievements of indicators of SDG 7.
SDG 11 is displayed in the bottom-left panel; the trend of SDG 11 is similar to SDG 6, where MSE decreases with increasing lambda until log (λ) ≈ −4, where it steadies at a minimum. The difference here is that the curve flattens rather quickly. Firstly, the lambda.min and lambda.1se are close, suggesting that a slightly more regularized model (fewer variables) performs almost as well as the full model. Secondly, this shows that only a small number of predictors, like the total rate of migration and rate of employment, are significant in explaining the performance of SDG 11 indicators, and additional variables contribute little to reducing error.
SDG 12 is displayed at the bottom-right panel, indicating an interesting pattern where the MSE remains quite low until lambda increases beyond log (λ) ≈ −4. Beyond this point, the error rises sharply; firstly, lambda.min occurs around log (λ) ≈ −4.5, which means that a relatively small penalty may lead to the best model performance. Nevertheless, the sharp rise in MSE beyond this suggests that over-regularization quickly worsens the model. Secondly, the plot suggests that the optimal model contains different predictors, likely the rate of unemployment and average annual wage, as the model works best when it retains a moderate number of predictors.
7. Discussion
Through legislative initiatives, EU policies, and initiatives aligned with the SDGs, Italy has experienced significant changes in its waste management systems in recent years. Despite the progress, various challenges are also faced by Italy in achieving the waste targets of the SDGs, mainly the disposal of hazardous waste and recycling efficiency. This research article focused on providing a comprehensive analysis of Italy’s progress on SDGs 6, 7, 11, and 12 between the years 2015 and 2020, putting the focus on the roles of social, demographic, and economic variables to influence the performance of waste indicators of SDGs in these goals. Several national performance trends for these waste indicators are highlighted in this study. A marked decline in the percentage of wastewater treatment and secondary or advanced treatment was found from the year 2015 to 2020, highlighting the challenges concerning the achievement of SDG 6 to maintain a high level of wastewater treatment. On the other hand, improvements in energy access (SDG 7: affordable and sustainable energy) were found with an increasing share of renewable energy in overall electricity generation. However, the adoption of renewable energy by the transport sector lags, indicating a lower share of consumption of renewable energy by this sector. There has been an increase in the recycling rate from 46% in 2015 to 61% in 2020, concerning the achievement of SDG 12, “responsible consumption and production”. The generation of hazardous waste remains an issue, with an extensive portion being disposed of rather than recovered.
This paper provides important insights derived from applying Pearson’s Correlation, Partial Least Square Regression (PLSR), and Elastic Net Regression, emphasizing the relationship between the waste indicators of SDGs and social, economic, and geographical factors. Significant associations are found between outcomes of waste management indicators of SDGs and demographic variables while applying Pearson’s Correlation. For example, regions with younger populations of 0–14 and 15–64 show a positive correlation with environmental quality indicators like a higher percentage of wastewater treatment or better quality of water (SDG 6). On the contrary, areas with higher elderly populations, those aged 65 and above, show negative correlations mainly in terms of wastewater treatment and the quality of the environment. This pattern of findings highlights that regions with a higher population or more economically active populations might benefit from the improved infrastructure and practices of waste management, while regions with elderly populations face challenges in maintaining the same level of waste management. The findings emphasize the need to have targeted policies accounting for demographic variations when designing strategic approaches for sustainable waste management.
The deeper insights into the complex associations between these variables are provided by the PLSR and Elastic Net Regression. The results of PLSR indicate the varying effects of the size of the household, employment, and wage levels on the achievement of SDGs. For example, larger households had a positive correlation with the improvements in waste management, especially SDG 6, while the level of employment influences SDG 7 with a positive correlation. By efficiently managing multicollinearity, the Elastic Net Regression found key predictors, like the rate of migration and population demographics, as influential in determining the success of waste management under SDG 11 and SDG 12. This model highlights the role of economic stability, as highlighted by employment and wages, in improving the rate of recycling and reducing the generation of hazardous waste. The practical applications of these findings suggest a holistic approach to address the energy transition and sustainable waste management with a focus on economic and social factors that influence these outcomes.
The findings of this study contribute to the theoretical discourse on waste management and sustainable development through the integration of insights into the complex associations among geographical, social, and economic variables, as well as their impacts on SDG outcomes. The findings also extend the theoretical understanding of how the regional economic and social dynamics shape the performance of waste management, emphasizing integrated solid waste management’s multidimensional influences. The findings also highlight the need to have adaptive theoretical models that can incorporate demographic variations like migration trends and age distributions into the analysis of waste indicators of SDGs and their relationship with the overall context. In addition, the importance of PLSR and Elastic Net Regression for unraveling multicollinearity and identifying key predictors of SDG success has also been highlighted. The methodologies enhance the theoretical frameworks to evaluate sustainability by providing more in-depth context-specific understandings. In the national context of Italy, this study develops the theoretical understanding of integrated solid waste management within diverse geographical and socio-economic settings, offers a replicable mode for other regions, and aims to achieve the targets of the SDGs. Furthermore, the study also highlights the theoretical importance of aligning strategies of waste management with demographic shifts and economic stability by bridging gaps in the literature, which often overlook these important aspects.
8. Conclusions
This study has demonstrated that demographic and economic dimensions significantly impact the achievement of waste indicators of SDGs in Italy, with positive contributions from young and economically sound populations. The robust evidence on the association of socio-economic variables with waste management efficiency highlights the need for customized policies to address these regional and demographic disparities. Italy has made significant progress in waste management and increased the rate of recycling. However, challenges remain, such as the disposing of hazardous waste and adopting renewable energy, especially in the transport sector. The study had its limitations, especially in terms of its dependence on publicly available data only, which may not help in capturing regional or local disparities in the practices of waste management; however, the availability of resources and time only allowed the possibility to gain these insights from the available data on SDGs and socio-economic and demographic variables. Furthermore, assessing the role of policy interventions to improve the achievement of waste indicators and SDGs might provide actionable insights to explore the progress of Italy in achieving these specific SDG targets, but the limited scope of this study did not extend the focus to policy interventions. In addition, the availability of the dataset and limited access to socio-economic and demographic variables only made these analyses possible, as discussed in the study. Furthermore, assessing the role of policy interventions to improve the achievement of waste indicators and SDGs might provide actionable insights to explore the progress of Italy in achieving these specific SDG targets, but the limited scope of this study did not extend the focus to policy interventions. Based on the results of this study, the authors suggest some policy implications with regard to integrating waste management with SDGs and aligning waste reduction and treatment strategies, which might be promoted by establishing targets and monitoring systems, as well as other initiatives, to track the progress of waste concerning SDG indicators. The study also suggests future possible research studies to assess targeted interventions, analyzing regional outcomes, applying a holistic approach to study social, economic, and environmental outcomes of waste management, or studying the regional outcomes of each specific SDG indicator with an in-depth focus.
Author Contributions
Conceptualization, methodology, formal analysis, data curation, writing—original draft preparation, writing—review and editing, M.R.; supervision, E.B.; data curation, literature review, B.N. All authors have read and agreed to the published version of the manuscript.
Funding
This research was funded by the National Operational Program (PON) “Research and Innovation” 2014–2020, funded by ESF–REACT EU as part of PhD at the University of Ferrara, Italy.
Institutional Review Board Statement
Not applicable.
Informed Consent Statement
Not applicable.
Data Availability Statement
Data are contained within the article.
Conflicts of Interest
The authors declare no conflicts of interest.
References
- ISPRA. Quality of Urban Environment; The Higher Institute for Environment Research and Protection: Roma, Italy, 2014. [Google Scholar]
- Petteruti, C. Country report: Italy. IUCNAEL EJournal 2014, 243–248. Available online: https://www.iucnael.org/en/documents/1229-italy-2 (accessed on 10 November 2024).
- Obi, L.; Muiruri, B. Stink That Haunts City Three Years Later. Daily Nation. 2016. Available online: https://nation.africa/kenya/news/garbage-stink-that-haunts-city-three-years-later-1192038 (accessed on 2 December 2024).
- D’Alisa, G.; Burgalassi, H.; Healy, H.; Walyer, M. Conflict in Campania: Waste emergency or crisis of democracy. Ecol. Econ. 2010, 70, 239–249. [Google Scholar] [CrossRef]
- Mazzanti, M.; Montini, A. Waste Management Beyond the Italian North-South Divide: Spatial Analyses of Geographical, Economic and Institutional Dimensions; Edward Elgar: Glos, UK, 2014. [Google Scholar]
- Cárcel-Carrasco, J.; Peñalvo-López, E.; Pascual-Guillamón, M.; Salas-Vicente, F. An Overview about the Current Situation on C&D Waste Management in Italy: Achievements and Challenges. Buildings 2021, 11, 284. [Google Scholar] [CrossRef]
- Agovino, M.; Ferrara, M.; Garofalo, A. An exploratory analysis on waste management in Italy: A focus on waste disposed in landfill. Land Use Policy 2016, 57, 669–681. [Google Scholar] [CrossRef]
- Lubello, C.; Fiaschi, S.; Notari, G. Municipal solid waste composition and efficiency of separate collection: A case study in Italy. Clean. Waste Syst. 2025, 11, 100272. [Google Scholar] [CrossRef]
- Fasano, F.; Addante, A.S.; Valenzano, B.; Scannicchio, G. Variables Influencing per Capita Production, Separate Collection, and Costs of Municipal Solid Waste in the Apulia Region (Italy): An Experience of Deep Learning. Int. J. Environ. Res. Public Health 2021, 18, 752. [Google Scholar] [CrossRef]
- D’Adamo, I.; Mazzanti, M.; Morone, P.; Rosa, P. Assessing the relation between waste management policies and circular economy goals. Waste Manag. 2022, 154, 27–35. [Google Scholar] [CrossRef]
- Puntillo, P. Circular economy business models: Towards achieving sustainable development goals in the waste management sector—Empirical evidence and theoretical implications. Corp. Soc. Responsib. Environ. Manag. 2023, 30, 941–954. [Google Scholar] [CrossRef]
- D’adamo, I.; Gastaldi, M.; Imbriani, C.; Morone, P. Assessing regional performance for the Sustainable Development Goals in Italy. Sci. Rep. 2021, 11, 24117. [Google Scholar] [CrossRef]
- Richiedei, A.; Pezzagno, M. Territorializing and Monitoring of Sustainable Development Goals in Italy: An Overview. Sustainability 2022, 14, 3056. [Google Scholar] [CrossRef]
- Esposito De Falco, S.; Montera, R. Reaching the SDGs by 2030: At what point is Italy? Evidence from firms at the regional clusters’ level. Sustain. Dev. 2024, 42, 189–213. [Google Scholar]
- Marfe, G.; Perna, S.; Hermann, A. Addressing Hazardous Waste Management as a Means to Achieving the Sustainable Development Goal 3; Springer: Cham, Switzerland, 2024. [Google Scholar]
- Di Vaio, A.; Dell’Amura, G.; Chhabra, M.; Garofalo, A. Circular economy and waste production models for sustainable development goals 12 and 14: Evidence from cruise sustainability reporting. Sustain. Dev. 2024, 32, 6686–6702. [Google Scholar] [CrossRef]
- Cudecka-Purina, N.; Kuzmina, J.; Butkevics, J.; Olena, A.; Ivanov, O.; Atstaja, D. A Comprehensive Review on Construction and Demolition Waste Management Practices and Assessment of This Waste Flow for Future Valorization via Energy Recovery and Industrial Symbiosis. Energies 2024, 17, 5506. [Google Scholar] [CrossRef]
- Agovino, M.; Cerciello, M.; Musella, G.; Garofalo, A. European waste management regulations and the transition towards circular economy. A shift-and-share analysis. J. Environ. Manag. 2024, 254, 120423. [Google Scholar] [CrossRef] [PubMed]
- Geissdoerfer, M.; Savaget, P.; Bocken, N.M.P.; Hultink, E.J. The circular economy—A new sustainability paradigm? J. Clean. Prod. 2017, 143, 757–768. [Google Scholar] [CrossRef]
- Kaza, S.; Yao, L.C.; Bhada-Tata, P.; Van Woerden, F. What a Waste 2.0: A Global Snapshot of Solid Waste Management to 2050; World Bank: Washington, DC, USA, 2018. [Google Scholar]
- Ghisellini, P.; Catia, C.; Sergio, U. A review on circular economy: The expected transition to a balanced interplay of envi-ronmental and economic systems. J. Clean. Prod. 2016, 114, 11–32. [Google Scholar] [CrossRef]
- Schroeder, P.; Anggraeni, K.; Weber, U. The relevance of circular economy practices to the Sustainable Development Goals. J. Ind. Ecol. 2019, 23, 77–95. [Google Scholar] [CrossRef]
- Musella, G.; Agovino, M.; Casaccia, M.; Crociata, A. Evaluating waste collection management: The case of macro-areas and municipalities in Italy. Environ. Dev. Sustain. 2018, 21, 2857–2889. [Google Scholar] [CrossRef]
- Mazzarano, M.; Quatrosi, M.; Pronti, A. Waste management and Italian provinces: Why pay more for less? Waste Manag. 2022, 154, 340–349. [Google Scholar] [CrossRef]
- Calderaro, M.R.; Fusco, A.; Amitrano, C.C. The European Union Regulation 2020/741: From the Management of Water Resources to the EU Legislation for Its Reuse; Springer: Berlin/Heidelberg, Germany, 2024. [Google Scholar]
- Anselmi, D.; D’adamo, I.; Gastaldi, M.; Lombardi, G.V. A comparison of economic, environmental and social performance of European countries: A sustainable development goal index. Environ. Dev. Sustain. 2024, 26, 20653–20677. [Google Scholar] [CrossRef]
- Dos Santos, L.C.; Giannetti, B.F.; Agostinho, F.; Liu, G.; Almeida, C.M. A multi-criteria approach to assess intercon-nections among the environmental, economic, and social dimensions of circular economy. J. Environ. Manag. 2023, 342, 118317. [Google Scholar] [CrossRef] [PubMed]
- Starovoytova, D. Solid waste management at a university campus (part 1/10): Comprehensive-review on legal framework and background to waste management, at a global context. J. Environ. Earth Sci. 2018, 8, 2225-0948. [Google Scholar]
- Memon, M.A. Integrated Solid Waste Management. 2025. Available online: https://sustainabledevelopment.un.org/content/dsd/csd/csd_pdfs/csd-19/learningcentre/presentations/May%202%20am/1%20-%20Memon%20-%20ISWM.pdf (accessed on 22 April 2025).
- Ahmed, M.M. Integrated Solid Waste Management; International Environmental Technology Centre (IETC): Osaka, Japan, 2023. [Google Scholar]
- Latan, H.; Noonan, R.; Nunan, D. Partial Least Squares Path Modeling: Basic Concepts, Methodological Issues and Applications; Springer: Berlin/Heidelberg, Germany, 2018. [Google Scholar]
- Latan, H.; Ramli, N.; Sarstedt, M. The use of partial least squares path modeling in sustainability research: A review of past research and suggestions for future applications. Int. J. Sustain. Dev. World Ecol. 2017, 24, 1–15. [Google Scholar]
- Hair, J.F.; Sarstedt, M.; Ringle, C.M.; Mena, J.A. An assessment of the use of partial least squares structural equation modeling in marketing research. J. Acad. Mark. Sci. 2012, 40, 414–433. [Google Scholar] [CrossRef]
- Jumin, E.; Basaruddin, F.B.; Yusoff, Y.B.M.; Latif, S.D.; Ahmed, A.N. Solar radiation prediction using boosted decision tree regression model: A case study in Malaysia. Environ. Sci. Pollut. Res. 2021, 28, 26571–26583. [Google Scholar] [CrossRef]
- Kulisz, M.; Kujawska, J.; Cioch, M.; Cel, W.; Pizoń, J. Comparative Analysis of Machine Learning Methods for Predicting Energy Recovery from Waste. Appl. Sci. 2024, 14, 2997. [Google Scholar] [CrossRef]
- Dalal, N.; Solanki, C.; Desai, A. Plate Load Tests on Municipal Solid Waste Dump Site to Assess Ground Improvement Al-ternatives. J. Environ. Sci. Eng. 2011, 5, 910–914. [Google Scholar]
- Matijová, M.; Onuferová, E.; Rigelský, M.; Stanko, V. Impact of Selected Indicators of Tourism Capacity and Performance in the Context of the Unemployment Rate in Slovakia. J. Tour. Serv. 2019, 10, 1–23. [Google Scholar] [CrossRef]
Disclaimer/Publisher’s Note: The statements, opinions and data contained in all publications are solely those of the individual author(s) and contributor(s) and not of MDPI and/or the editor(s). MDPI and/or the editor(s) disclaim responsibility for any injury to people or property resulting from any ideas, methods, instructions or products referred to in the content. |
© 2025 by the authors. Licensee MDPI, Basel, Switzerland. This article is an open access article distributed under the terms and conditions of the Creative Commons Attribution (CC BY) license (https://creativecommons.org/licenses/by/4.0/).