Article

Towards Sustainable and Resilient Infrastructure: Hurricane-Induced Roadway Closure and Accessibility Assessment in Florida Using Machine Learning

by
Samuel Takyi
*,
Richard Boadu Antwi
,
Eren Erman Ozguven
,
Leslie Okine
and
Ren Moses
Department of Civil and Environmental Engineering, FAMU–FSU College of Engineering, 2525 Pottsdamer Street, Tallahassee, FL 32310, USA
*
Author to whom correspondence should be addressed.
Sustainability 2025, 17(9), 3909; https://doi.org/10.3390/su17093909
Submission received: 4 April 2025 / Revised: 22 April 2025 / Accepted: 22 April 2025 / Published: 26 April 2025

Abstract

:
Natural disasters like hurricanes can severely disrupt transportation systems, leading to roadway closures and limiting accessibility, which has extreme economic, social, and sustainability implications. This study investigates the impact of hurricanes Ian and Idalia on roadway accessibility in Florida using machine learning techniques. High-resolution satellite imagery, combined with demographic and hurricane-related roadway data, was used to assess the extent of road closures in southeast Florida (Hurricane Ian) and northwest Florida (Hurricane Idalia). The model detected roadway segments as open, partially closed, or fully closed, achieving an overall accuracy of 89%, with confidence levels of 92% and 85% for the two hurricanes, respectively. The results showed that heavily populated coastal regions experienced the most significant disruptions, with more extensive closures and reduced accessibility. This research demonstrates how machine learning can enhance disaster recovery efforts by identifying critical infrastructure in need of immediate attention, supporting sustainable resilience in post-hurricane recovery. The findings suggest that integrating such methods into disaster planning can improve the efficiency and sustainability of recovery operations, helping to allocate resources more effectively in future disaster events.

1. Introduction

Hurricanes have been responsible for a great number of fatalities and property damage in the U.S. history. Between 1980 and 2021, the approximate total hurricane-induced cost of damages in the U.S. was more than USD 2 trillion [1]. A significant portion of this adverse impact was on the critical infrastructure such as roadways, bridges, and tunnels, which are necessary for our society’s operations and functionality [2]. As hurricanes intensify in frequency and severity, the need for infrastructure systems that are both resilient and sustainable becomes more urgent. Rather than viewing these as separate goals, this study positions resilience, particularly in maintaining and restoring transportation networks, as a fundamental component of sustainability. By rapidly detecting roadway closures and assessing accessibility after hurricanes, planners can support more equitable recovery, reduce response time, and limit economic disruption.
Similarly, Hurricane Ian severely impacted southeast Florida’s transportation network in 2022, and Hurricane Idalia crippled northwest Florida’s roadways, both causing extensive damage. Assessing this damage following the hurricanes is essential for post-event reconstruction and humanitarian aid [3]. Specifically, determining the magnitude and duration of these impacts in the context of roadway disruptions and transportation accessibility has the utmost importance for efficient response and recovery operations and has, thus, become a significant topic of interest in the literature.
In the context of sustainability, building and maintaining resilient infrastructure is a crucial step in mitigating the long-term impacts of such disasters. The increasing frequency and intensity of hurricanes driven by climate change have emphasized the need for a shift toward sustainable infrastructure that can withstand and adapt to extreme weather events [4]. Recent studies have also emphasized the importance of understanding wind environments under extreme weather conditions, which directly relate to hurricane impacts. Ref. [5] proposed an adaptive optimization framework for wind environments in coastal village spatial forms in Western Guangdong, highlighting how spatial configurations can be modified to reduce wind-related vulnerabilities. This is particularly relevant for hurricane-prone regions, where infrastructure design must consider wind forces to enhance resilience. Additionally, ref. [6] applied machine learning techniques to study the relationship between urban wind–heat environments and urban development elements in high-density areas, offering insights into how data-driven models can improve environmental management in urban planning. These studies complement our focus by underscoring the value of spatial and machine learning approaches in understanding and mitigating extreme weather impacts. Building on these foundations, our study extends the application of machine learning, particularly the YOLOv3 detection model, to assess hurricane-induced roadway closures using aerial imagery, contributing to infrastructure resilience and disaster response planning. Ensuring that critical transportation infrastructure such as roadways are resilient and sustainable not only supports immediate disaster response but also contributes to the broader goals of environmental sustainability and community well-being [7]. The integration of sustainability principles into infrastructure planning has become essential to reducing vulnerability to future disasters while promoting environmental stewardship and social equity [8].
In addition to improving response efficiency, assessing hurricane impacts on roadways through innovative techniques like machine learning contributes to the long-term sustainability and resilience of transportation networks. Sustainable infrastructure is essential not only for rapid recovery but also for mitigating future damages from recurring storms. By identifying vulnerable regions in advance, decision makers can prioritize infrastructure reinforcements and implement adaptive strategies that minimize future disruptions and environmental impacts. This practical, data-driven approach supports building a transportation system that can endure the growing intensity of hurricanes and other natural disasters, ensuring a more resilient and sustainable recovery process.
Traditional approaches of assessing post-hurricane roadway conditions and accessibility rely on manual observations and reports, which can be challenging and prone to error. While it is possible to manually analyze remotely sensed images using skilled human analysis and image annotation tools, this would also be very labor-intensive and slow down the ability to respond quickly to natural disasters like hurricanes. Although several automated techniques for damage mapping using imagery from satellites have been proposed, practical damage mapping is still based on labor- and time-intensive manual analysis of satellite images [9]. However, current developments in machine learning methods that utilize satellite imagery offer innovative and efficient solutions to evaluate how hurricanes impact roadways. High-resolution satellite images, which are typically made accessible shortly after a disaster event like a hurricane, are an ideal data source for faster damage assessment over broad areas for rapid response activities [10]. This provides the opportunity for the complex patterns of hurricane-induced destruction and disruption caused to be analyzed and understood with the use of machine learning tools, allowing for more efficient emergency response and preparation in the future.
Although satellite images have been increasingly available lately, their complexity and limited spatial resolution have been two reasons why automated approaches have not been developed [9]. In addition, the development of reliable methodologies to assess the impact of hurricanes on roadways depends on a substantial amount of training samples on roadway closures from past hurricanes, which are typically not easily accessible [11]. The transferability of a pre-trained supervised model that was previously created for a different geographic region is also limited [11]. However, the pre-trained model can be fine-tuned using a modest number of training samples that reflect the area of interest. Therefore, a sizable number of training samples is needed for each study region, either for building a new model or calibrating an existing model.
In the literature, several studies have used machine learning and other remote sensing techniques to assess the impact of natural disasters on the infrastructure. For example, bi-temporal remote sensing images have been used in several studies [12,13] to create a near real-time and precise map of earthquake damage. In another study, the performance of a random forest classifier was used to identify collapsed buildings and assess building damage by comparing the performance of convolutional neural network (CNN) features and the grey-level co-occurrence matrix texture together with high-resolution post-earthquake imagery [14].
Decision trees [15], random forests [16], and neural networks [17,18] are a few examples of machine learning techniques that have been successful in other domains and can be applied to hurricane damage assessment. These algorithms have the potential to gain knowledge from historical data on roadway closures and accessibility, wind speeds, rainfall amounts, storm surge heights, and the geographic characteristics of the impacted areas. Debris field detection, ingress route blockage detection, building damage detection and assessments, and remote sensing in tactical support of rescue plans are some potential applications for using machine learning with satellite images [19]. However, there is still a need for tools that can readily be trained and used to process massive volumes of imagery from disaster zones, as well as tools that can adapt to disaster-related features. For image processing, algorithms like support vector machine [20] and K-nearest neighbor [21] have frequently been used compared to conventional computer vision techniques like scale-invariant feature transform (SIFT) [22] and the histogram of oriented gradients (HOG) [23].
Machine learning models have been increasingly used to process and analyze remotely sensed images for various disaster management and urban monitoring tasks. Convolutional neural networks (CNNs) have shown great success in extracting features from satellite and aerial imagery for damage assessment and land cover classification [24]. For example, ref. [25] developed a CNN-based framework for building damage detection using post-disaster aerial images. Similarly, ref. [26] used deep learning models to detect road surface damage from satellite imagery in affected areas. In the context of hurricane damage, refs. [27,28,29] demonstrated how object-based deep learning can be applied to high-resolution imagery for rapid post-event analysis. More recently, you only look once (YOLO) models, including YOLOv3, have been used for real-time object detection tasks in complex disaster scenes [30,31,32], offering a balance of speed and accuracy in identifying road damages, debris, and obstructions.
Machine learning models with remotely sensed images can provide reliable projections about the state of the roadways during and in the aftermath of hurricanes by examining these variables and finding patterns and connections. In addition, to capture the dynamic nature of hurricane impacts, machine learning models can manage huge volumes of data, such as real-time sensor data, satellite imagery, social media feeds, and official reports [33,34,35,36]. They can also help forecast more accurately and raise decision makers’ situational awareness. To prioritize response efforts, machine learning models can also identify crucial roadway segments. Emergency response teams can successfully plan for evacuation routing, resource deployment, and the pre-positioning of supplies by anticipating which roadways would likely be affected by closures or restricted accessibility. In the wake of a hurricane, this preventive approach can help save lives, reduce property damage, and speed up the recovery process.
This study developed a machine learning and high-resolution satellite imagery-based methodology to assess the impact of hurricanes Ian and Idalia on roadways with a specific focus on roadway closures and transportation accessibility. The dual objectives are (1) to detect and classify storm-related road closures using a trained detection model applied to aerial imagery, and (2) to evaluate post-storm roadway accessibility disruptions across the transportation network. The outcomes provide spatial insights to support sustainable recovery and infrastructure resilience planning in vulnerable coastal regions. To fully understand the relationship between the hurricanes’ impact and the physical characteristics of the affected areas, this study incorporated Geographic Information System (GIS) data layers such as evacuation routes and boundary shapefiles, land use, elevation, hydrological features, and population density. A novel machine learning model was developed to classify roadway conditions (open, partially closed, and fully closed) based on post-hurricane imagery. A comprehensive dataset of roadway conditions in Lee and Taylor counties, Florida, after being impacted by Hurricane Ian and Idalia, respectively, was curated and labeled, serving as a valuable resource for future research. This information could help in identifying vulnerable locations and evaluating the accessibility of the roadways at those locations. The proposed technique can be used by engineers and urban planners to assess the resilience of the roadway infrastructure to hurricanes and identify areas that are vulnerable to significant damage.

2. Study Area, Hurricanes Ian and Idalia, and Data

A Category 4 hurricane, Hurricane Ian, made landfall in Southwest Florida on 28 September 2022, as the fifth-strongest tropical cyclone in the U.S. history [37], with maximum sustained winds of 150 miles per hour [38]. It was the strongest hurricane to hit Florida since Hurricane Michael in 2018 and the first Category 4 hurricane to impact Southwest Florida since Hurricane Charley in 2004. Lee County, located on the southwest coast of Florida, covers an area of approximately 1212 square miles. It includes several cities and towns such as Fort Myers, Cape Coral, and Bonita Springs, along with numerous barrier islands and a diverse range of landscapes. The region is characterized by its coastal and inland environments, featuring urban areas, agricultural lands, wetlands, and water bodies. The county lies between 26.3° N to 26.8° N latitude and 81.5° W to 82.3° W longitude. The elevation varies from sea level along the coast to about 30 feet inland. The roadway network in Lee County consists of major highways, arterial roads, and local streets. Key highways include Interstate 75 (I-75) and U.S. Route 41, which are vital for transportation and evacuation during emergencies. The county has several critical bridges and causeways connecting the mainland to barrier islands, such as the Sanibel Causeway and the Matlacha Pass Bridge. The county has a mix of densely populated urban centers and sparsely populated rural areas. Urbanization is concentrated in cities like Fort Myers and Cape Coral. Lee County is highly vulnerable to hurricanes due to its coastal location. Hurricane Ian, which struck the region, caused widespread damage, including flooding, wind damage, and debris accumulation on roadways. The destruction of critical transportation infrastructure such as roadways and bridges have profound implications for the sustainability of the region’s recovery efforts. Maintaining and rebuilding resilient infrastructure that can withstand such extreme events is essential for long-term community [4].
Taylor County, Florida, serves as another significant study area for assessing the impact of hurricanes on roadway infrastructure. In 2023, the region was notably affected by Hurricane Idalia, a Category 4 hurricane, which brought extensive damage to its roadway networks and other critical infrastructure. The proposed detection model was applied to this hurricane to test the applicability of the model to other hurricanes and affected areas other than Hurricane Ian and Lee County, which were used to train the model. Taylor County covers approximately 1232 square miles (3191 square kilometers), making it one of the larger counties in Florida by land area. The county is bordered by the Gulf of Mexico to the southwest and includes several rivers, creeks, and the extensive Econfina River State Park. The county’s roadway network includes state highways, county roads, and local streets. Key highways include U.S. Route 98, which runs along the coast, and U.S. Route 221, which traverses the county from north to south. Taylor County has a population of approximately 21,000 residents. The population is concentrated in the county seat, Perry, with smaller communities and rural areas spread throughout the county. The impact on transportation infrastructure necessitated a detailed analysis of roadway conditions to support disaster response and recovery efforts. This analysis, framed by sustainability goals, ensures that future infrastructure designs are more resilient and better equipped to handle similar extreme weather events.
The National Oceanic and Atmospheric Administration (NOAA) projected that Ian’s insured and uninsured losses were more than USD 50 billion. As seen in Figure 1, it moved inland after landfall and swiftly intensified into a tropical storm before returning to the Atlantic Ocean [39]. It had a drastic impact on the Gulf Coast of southwest Florida where several coastal areas of Lee and Collier counties experienced storm surges that were approximately 12 to 18 feet (3.6 to 5.5 m) above the sea level [40]. This paper will focus on two of these impacted counties, namely, Lee and Taylor counties. Evaluating and improving the sustainability of infrastructure to cope with such impacts is a priority for disaster resilience in the region.
High-resolution aerial imagery of the affected areas was acquired shortly after the hurricane’s passage, with ground sample distances (GSD) ranging from 1.5 feet (18 inches) per pixel (≈2.19 pixels/m) to 0.25 feet (3 inches) per pixel (≈13.12 pixels/m). This level of detail enables the classification of roadway conditions into open, partially closed, and fully closed classes. The post-hurricane imagery was acquired through the National Hurricane Center and the National Oceanic and Atmospheric Administration from 9 September 2022, to 3 October 2022, after Hurricane Ian made landfall. The pre-hurricane imagery was acquired from the Florida Aerial Photo Look-Up System (APLUS) through the Florida Department of Transportation (FDOT). The imagery was collected using advanced aerial surveying techniques to ensure detailed and accurate representations of the road conditions. This timely collection was critical for assessing the immediate impacts of the hurricane and for providing actionable insights for emergency response teams. The integration of sustainability considerations in the collection and analysis of such imagery ensures that future disaster recovery can prioritize rebuilding with resilience and climate adaptation in mind. This information indicated whether roadways were blocked or impassable as well as any accessibility problems. Existing road network shapefiles for Lee County were obtained from local government GIS databases. These shapefiles provided a detailed layout of the road infrastructure, including major highways, arterial roads, and local streets. The road network data was essential for delineating the areas of interest and for applying the classification model to assess road conditions. These efforts underscore the importance of creating a sustainable and resilient transportation system that can minimize the disruption caused by future natural disasters.
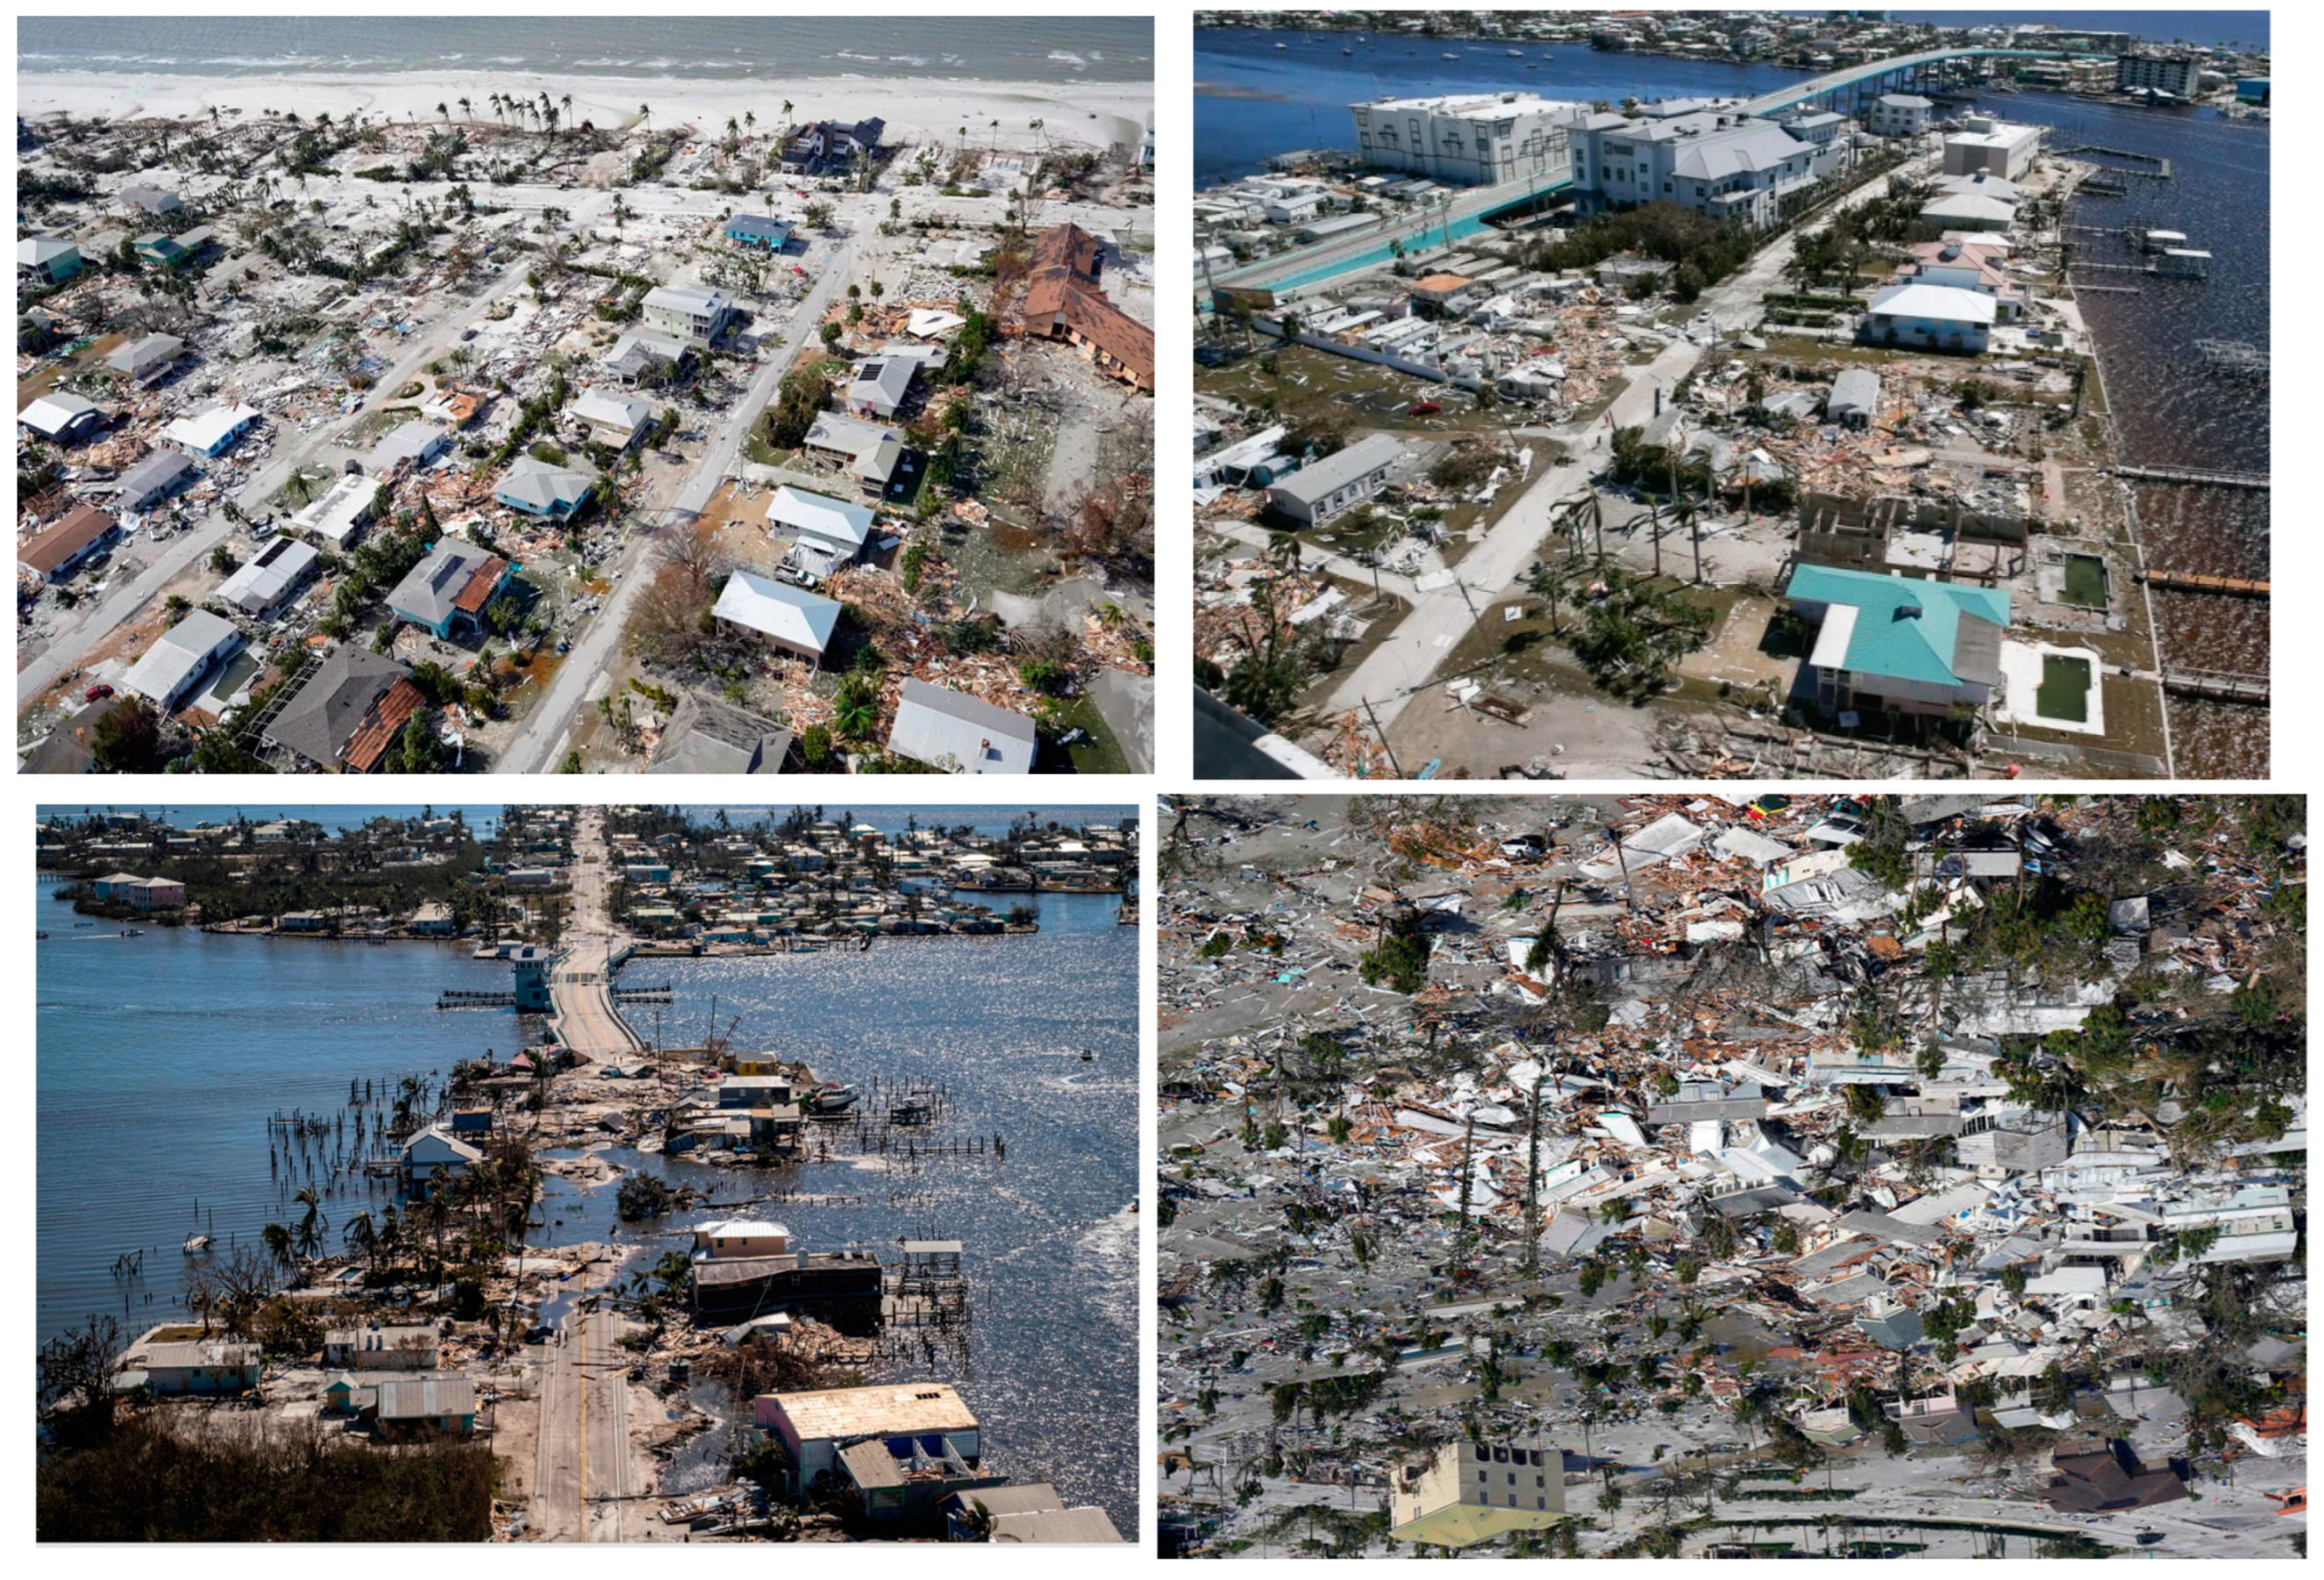
Several examples of damage caused by Hurricane Ian on the roadways can be seen in Figure 2. To fully understand the relationship between the hurricane’s impact and the physical characteristics of the affected areas, this study incorporated GIS data layers such as evacuation routes and boundary shapefiles, land use, elevation, hydrological features, and population density. Additionally, emergency response reports and documentation that include roadway closures, evacuation routes, and other response actions were available from emergency management agencies, transportation departments, and other relevant organizations. These reports helped with model training and validation and offered other insights.

3. Methodology

The proposed methodology shown in Figure 3 involves the following steps:

3.1. Data Collection and Preparation

High-resolution satellite images with ground sample distances (GSD) ranging from 1.5 feet (18 inches) per pixel (≈2.19 pixels/m) to 0.25 feet (3 inches) per pixel (≈13.12 pixels/m) of the study area, captured before and after hurricanes Ian and Idalia, were obtained covering both the roadway network and surrounding areas from Florida Department of Transportation’s Surveying Office [42] and the National Oceanic and Atmospheric Administration [43]. Roadway closure and transportation accessibility information was also obtained before, during, and after hurricanes Ian and Idalia [42,43]. A buffer of 6 m was applied to the roadway network shapefiles, which were obtained from Florida Geographic Data Library [44], to define the areas of interest for assessing roadway conditions. This buffer ensured that the analysis captured the full extent of roadway impacts, including debris and partial closures that extended beyond the immediate roadway surface.

3.2. Data Preprocessing

3.2.1. Image Registration

Pre-hurricane and post-hurricane satellite imageries were registered and aligned to allow for precise comparison and analysis. The process of aligning two or more images spatially to improve comparison or integration is known as image registration. When working with images taken from several sensors at different times or from different angles, this has been known to be helpful, with the objective of bringing images into a common coordinate system. The fundamental steps in image registration are shown in Figure 4.

3.2.2. Image Resampling

The pre-hurricane images were resampled to match the coordinate system and pixel resolution of the post-hurricane imagery (Figure 5). When resampling an image, the spatial extent is preserved but the pixel resolution is changed. In this study, the nearest neighbor method was used to resample the imagery.

3.2.3. Image Segmentation

An image is divided into numerous different areas or segments using this computer vision technique centered on features like color, texture, or shape [45]. Image segmentation is the process of dividing the imagery into semantically significant sections, each of which stands for a particular object or portion of the image. It is an essential stage in many computer vision applications [46], such as scene analysis, object recognition, and understanding imagery. We can extract useful information from an image by segmenting it, which will make it easier to process or analyze.
Although there are several methods for segmenting images, a convolutional neural network (CNN)-based deep learning methodology was used in this study. CNNs have been frequently employed for image segmentation [47] since the emergence of deep learning. Neural networks were also used by models like U-Net, Mask R-CNN [48], and FCNs (fully convolutional networks) [49] to learn complex features and forecast pixel-level segmentation masks. In this study, samples were trained based on significant features required for this study, such as roadways and buildings. Segmentation was based on these relevant features and satellite imageries were segmented to extract relevant roadway information. This process helped in separating out individual roadway segments for analysis, as shown in Figure 6.

3.2.4. Image Classification

The classification process in this study is an object-based supervised classification where several classifiers exist for supervised classification such as random forest, support vector machine, and maximum likelihood classifiers. In this paper, a support vector machine classifier was used in the image classification process supported by segmentation, training of the sample collection, and editing. Figure 7 shows the workflow of the entire image classification process.
During the image classification process, segmented images were generated from the original images. An ISO cluster classification was applied initially with random colors to classify all features into five classes. A support vector machine classifier was used to classify the images into several features, as shown below in Figure 8, with manually labelled training samples. The final classification was performed based on the manually labelled training data. The result of the classification is shown in Figure 8.

3.3. Data Processing and Training Procedure

3.3.1. Manual Labeling

The collected aerial imagery underwent a meticulous manual labeling process to prepare it for training the machine learning model. The labeling process involved the following steps:
  • Identification of Roadway Segments: Roadway segments within the imagery were identified and extracted based on their visibility and accessibility.
  • Drawing Bounding Boxes: Rectangular bounding boxes were drawn around roadway segments to demarcate areas of interest. Each bounding box encompassed a roadway section, capturing both the roadway surface and the adjacent areas that might contain debris or obstructions.
  • Classification Criteria: Each bounding box was labeled according to the observed conditions within the enclosed area. The classification criteria were based on the presence and extent of debris and damage:
    (1)
    Open: roadway segments with no visible obstructions or debris, indicating fully passable conditions.
    (2)
    Partially Closed: roadway segments with partial obstructions or debris that hindered traffic flow but did not completely block the road.
    (3)
    Fully Closed: roadway segments completely obstructed by debris or damage, rendering them impassable.
  • Ensuring Consistency: The labeling process was carried out by trained personnel to ensure consistency and accuracy. Each labeled segment was cross-checked and validated to minimize errors and ensure reliable training data.

3.3.2. Training Procedure

Training includes the following steps:
  • Data Splitting: The labeled data were divided into three subsets: training, validation, and testing.
  • Training Set: This set was used to train the machine learning model; this set contained 80% of the labeled data.
  • Validation Set: This set was used to tune the model parameters and avoid overfitting; this set allowed for model performance evaluation during training and 10% was used.
  • Testing Set: This set was used to assess the final model’s performance; this set provided an unbiased evaluation of the model’s ability to classify road conditions accurately and contained 10% of the entire labeled data.
The creation of training data is a key step in developing a reliable model to detect roadway closures from satellite images. The reliability and accuracy of the model’s predictions will be considerably impacted by well-developed and annotated data. The essential phases in data preparation are shown in Figure 9. First, pre- and post-hurricane aerial images were obtained. These images cover the entire county area affected by the hurricane. Also, data including buildings, roadblocks, construction zones, accidents, floods, and other types of roadway closures were obtained. The collected images were manually labelled using rectangular bounding boxes to identify areas of roadway closures in three main classes: (1) open, (2) partially closed, and (3) fully closed roadways. To boost the dataset’s diversity and strengthen the generalization of the model, data augmentation techniques including rotation and scaling were applied to the annotated images. Three subsets of the dataset were created: the training set, the validation set, and the test set. The validation set was created to fine-tune hyperparameters and avoid overfitting, and the test set was used to assess the performance of the final model.
The annotated data were converted into a YOLO format suitable for the chosen deep learning architecture. To effectively handle the datasets, data loading techniques like batching were utilized to give data to the model in digestible chunks.

3.4. Machine Learning Model Development for Roadway Extraction from Aerial Imagery

A multitask roadway extraction model [50] was used in this study to extract roadway features from the aerial imagery as seen in Figure 10. The model uses the centerline extraction network, which runs in parallel during training. The multilevel conceptual characteristics were taken out of the roadway detection network and convolved to create the roadway centerline extraction network [50]. Resnet 34 is used as the fundamental multi-task learning network here. Unlike U-Net, ResNet-34, a Residual Network (ResNet) architecture variant, is not a multi-task learning network. ResNet is mostly applied to deep convolutional neural networks (CNNs) intended for feature extraction and image categorization. Unlike U-Net, it has a different kind of architecture, and its main function is not multi-task learning or producing finer details. The deep designs of ResNet with skip connections or residual blocks are well known. The vanishing gradient issue was partially resolved by these connections, enabling the training of extremely deep networks. Through the ability to extract hierarchical characteristics from input images, ResNet, with 34 layers, can recognize and depict intricate patterns and structures found in images. The model metrics and loss graph can be seen in Figure 11. Figure 12 shows the ground truth results, and Figure 13 presents the extracted roadways.

3.5. Machine Learning Model Training and Development for Detection

We used a convolutional neural network (CNN) model to classify roadway conditions. The model was trained on labeled data, with features including roadway surface condition, debris presence, and closure extent. The training process involved specific hyperparameters: model architecture, YOLO V3; learning rate, 0.001; number of epochs, 20; batch size, 4; image size, 256 × 256; training split, 80%; test split, 10%; validation split, 100% of the dataset; non-max suppression threshold, 0.3; augmentation techniques, horizontal and vertical flips and random rotation.
The model was trained using 600 manually labelled bounding boxes based on the three classes of roadways (i.e., open, partially closed, and fully closed) using the deep learning toolbox in ArcGIS Pro 3.30. A total of 40% of the training dataset contained open classes, 30% contained partially closed, and the remaining 30% contained fully closed classes. The partially closed and fully closed datasets were roadway areas that were closed due to a variety of factors such as debris from damage of buildings, trees, and flooding. The learning rate, input image size, number of epochs, batch size, anchor box size and ratios, and training and test data percentages are among the configurable parameters and hyperparameters of the object detection model. The validation and training loss graph was used to illustrate the ML model evaluation metrics. Using a suitable loss function, the YOLO v3 model was trained on the provided dataset. On the validation set, which comprises 10% of the input training dataset, the validation loss and mean average precision were calculated. The batch size, learning rate, and training epoch are the object detection parameters that have the most influence on object detection. To obtain the best results, the model’s hyperparameters were adjusted based on how well it performed on the validation set. The performance of the trained model was assessed on the test set to calculate its accuracy, precision, recall, and F1-score in identifying roadway closures. The data preparation processes were iterated, changing the model design, or gathering new data based on the adequacy of the model’s performance. This action helped in improving the outcomes.

Yolo v3 Architecture

One of the fastest object detection methods available is called “you only look once”, or YOLO. YOLO acquires universal representations of items and performs noticeably better than top detection techniques like DPM and R-CNN when trained on actual images [51]. When compared to Fast R-CNN, its background errors are reduced by more than half [52]. YOLOv2 uses the Darknet-19 classification network to extract features, whereas YOLOv3 uses the far more advanced Darknet-53 network [53]. YOLOv3 was selected due to its excellent balance between detection speed and accuracy [30], making it ideal for real-time disaster response. YOLOv3 is well suited for detecting multiple objects in complex environments, such as roadway damage or obstacles after a hurricane [54]. One of the key advantages of YOLOv3 is its ability to be scaled and transferred across various geographical areas and conditions through transfer learning [30]. YOLOv3’s pre-trained models on large-scale datasets like COCO allow for quick adaptation to new regions with minimal additional labeled data. In this study, we fine-tuned YOLOv3 with a smaller, localized dataset containing images of roadway closures and damages typical in Florida during hurricanes.
This method enables the model to be easily adapted for deployment in other regions that are vulnerable to hurricanes, with the ability to detect and assess similar roadway damages and closures. YOLOv3’s lightweight architecture ensures that it remains effective in different geographic contexts, whether urban or rural, by rapidly learning region-specific characteristics from fine-tuned datasets. It has been successfully applied in similar scenarios, like urban roadway damage detection and disaster recovery efforts, where both speed and accuracy are critical. Even though it is no longer the most accurate object detection algorithm, it is still a great option when real-time detection is required without sacrificing too much precision. Therefore, it was employed in this study.
Initially, YOLO v3 was based on Darknet, a network with 53 layers originally trained on ImageNet. To enhance its detection capabilities, an additional 53 convolutional layers were added, resulting in a total of 106 layers for the YOLO v3 fully convolutional architecture [55]. This extension contributes to the slower performance of YOLO v3 when compared to YOLO v2. In terms of measured floating-point operations per second, Darknet-53 also performs the best [30]. This indicates that the network structure makes better use of the GPU, making evaluation more efficient and faster. YOLOv3 is highly scalable, and its pre-trained weights on the COCO and ImageNet datasets allow for efficient transfer learning [56,57]. By fine-tuning the model with a small number of labeled images specific to the region or disaster type, YOLOv3 can be effectively adapted to other hurricane-prone areas with varying infrastructure and environmental conditions. The current architecture of YOLO v3 can be seen in Figure 14, whereas the ground truth/prediction results are shown in Figure 15 and the loss graph is shown in Figure 16.

4. Model Results on Hurricane Ian Impacts

Quantitative findings of the study are presented here, with a focus on how Hurricane Ian affected roadways and based on a dataset of high-resolution images taken before and after Hurricane Ian. Note that we classified roadways into three groups, namely, open, totally closed, and partially closed, as part of the study. Bounding boxes were used as part of the process to identify and classify roadway segments according to these conditions along with georeferencing and resolution standardization as preprocessing techniques. Findings indicate that roadway conditions were properly identified by the classification model, which showed good accuracy. According to the results, roadway segments were classified as fully closed, partially closed, and open classifications, with an average confidence level of 92% by the model. Table 1 presents a summary of the outcomes for each class.
In addition, visualizations were created to supplement the numerical results. These included confusion matrices and sample images that showed the bounding boxes that were detected. A representative confusion matrix for the three classes is shown in Table 2, giving a summary of true positives, true negatives, false positives, and false negatives. 
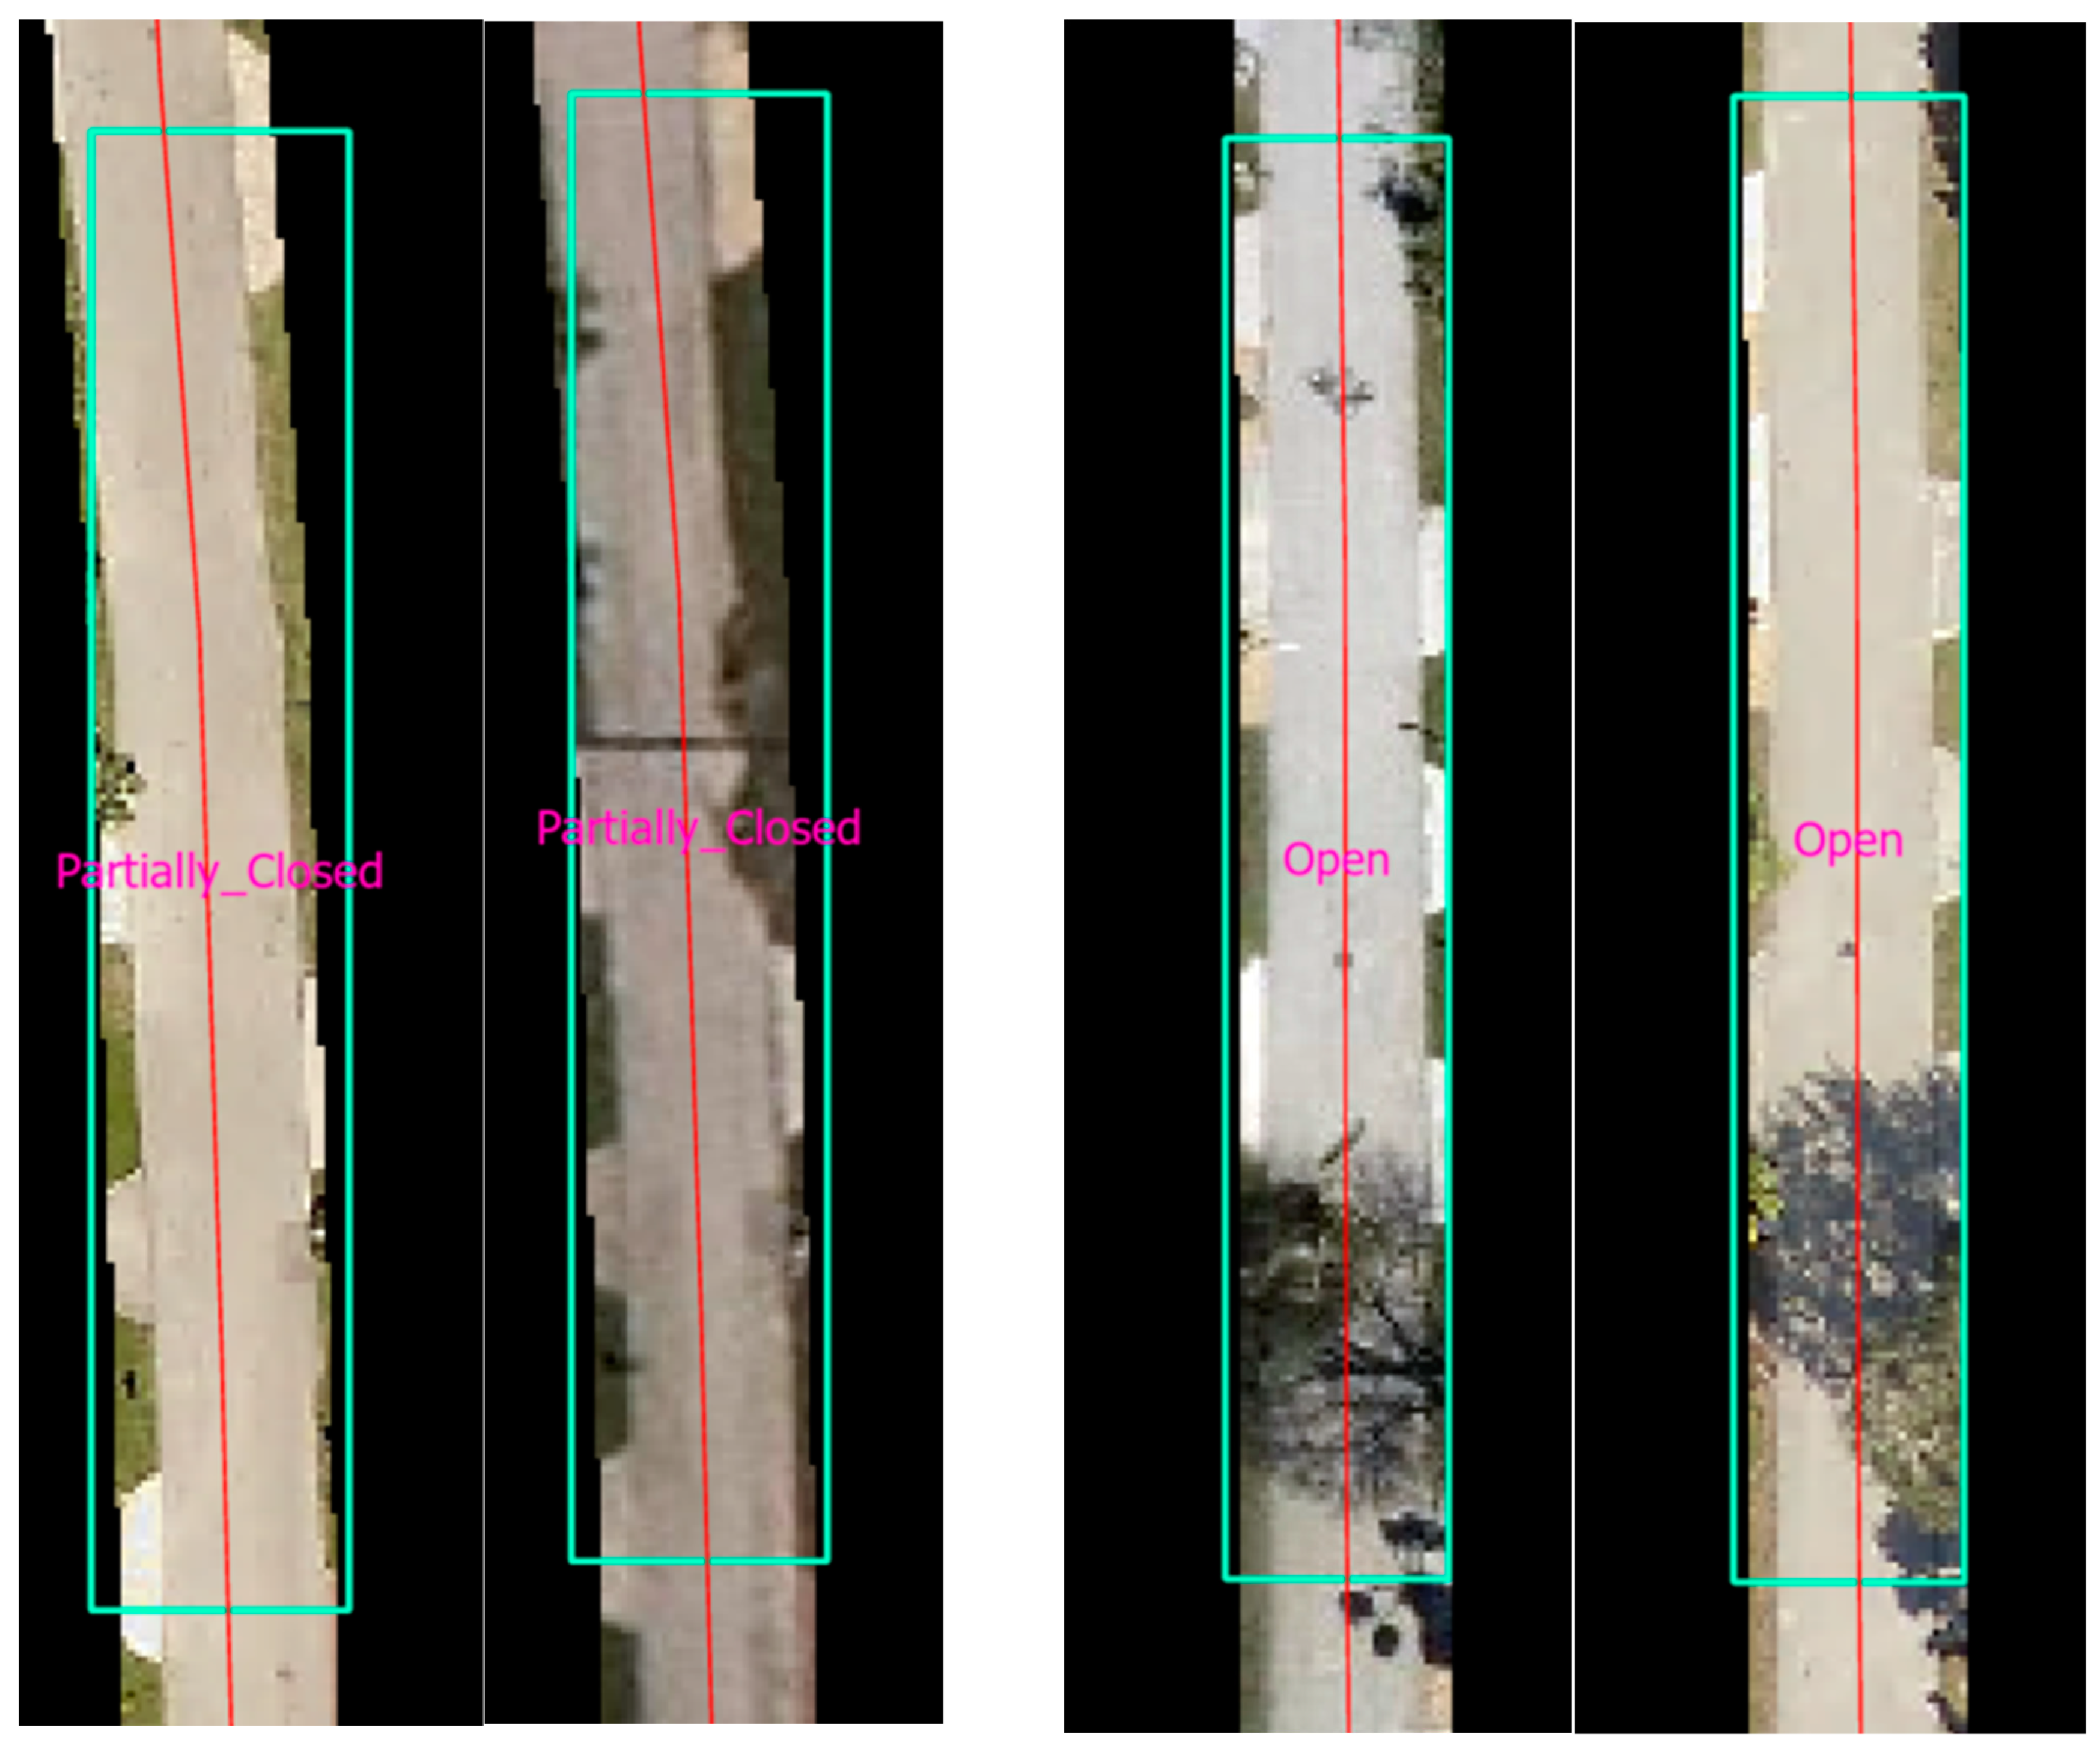
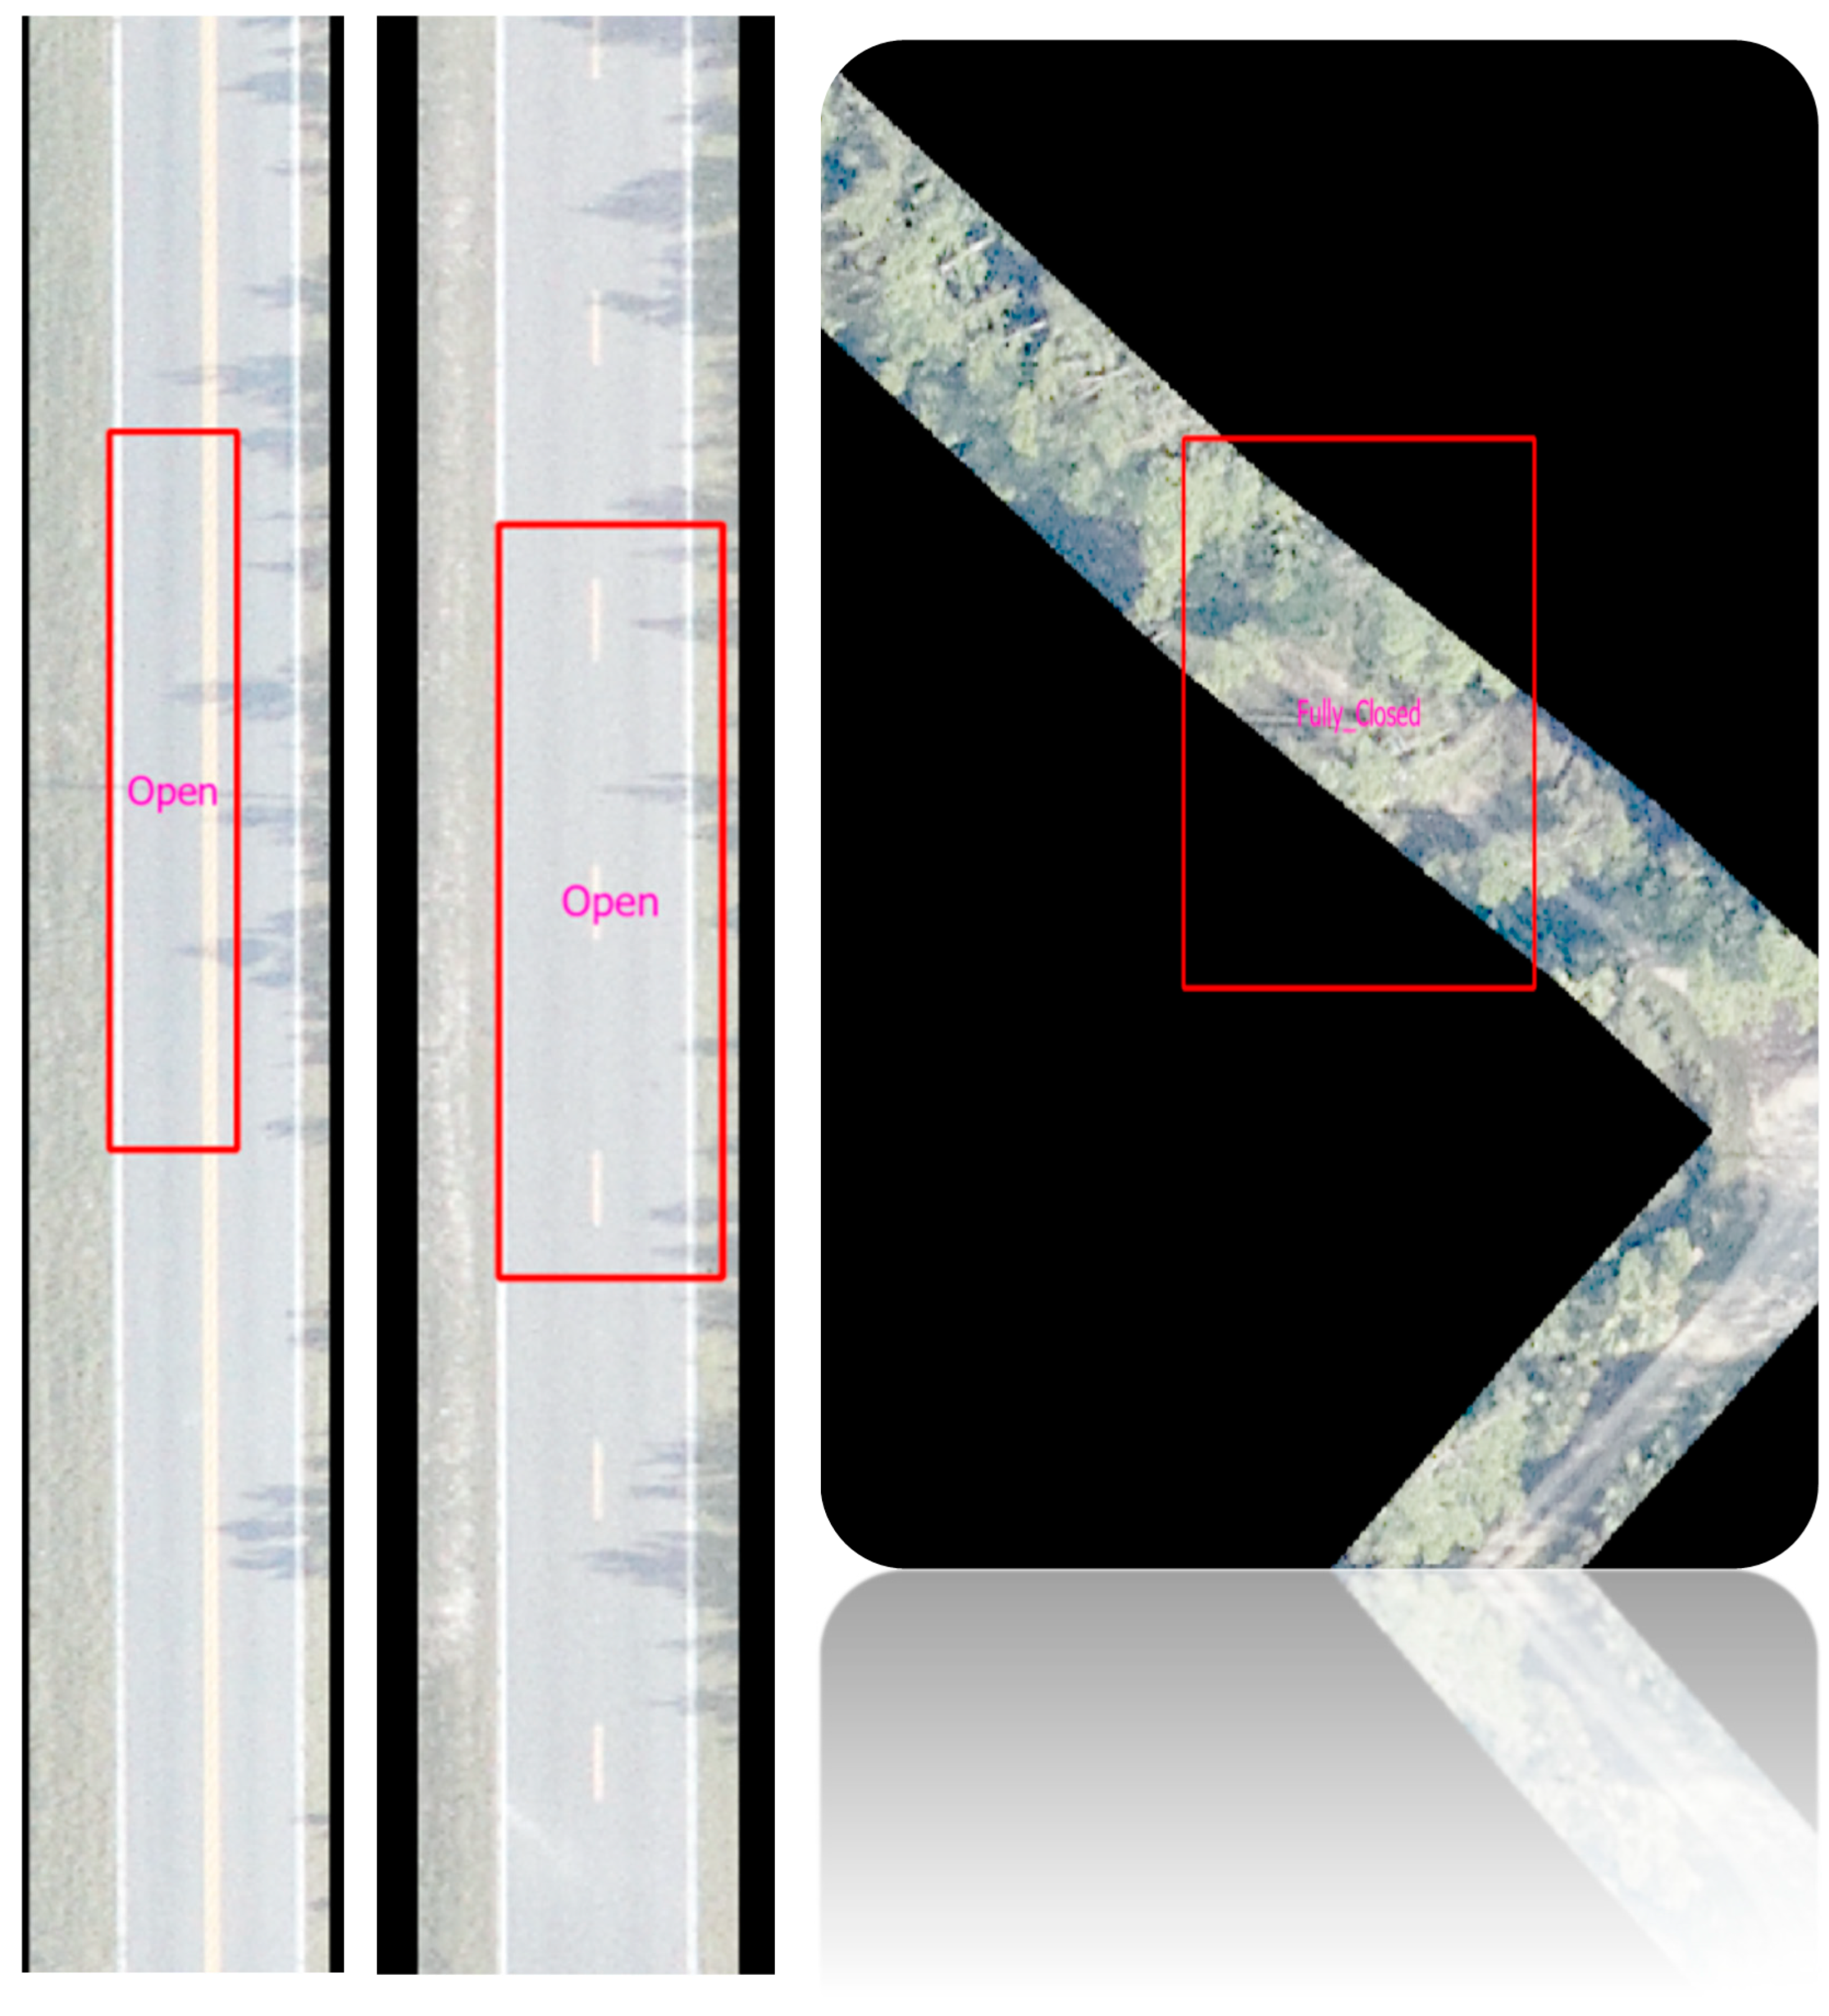
Figure 17 shows several images presenting the performance of the model, whereas Figure 18 shows some images where the model failed in detection.
  • The diagonal parts show accurate predictions, going from top-left to bottom-right.
  • Misclassifications are represented by off-diagonal elements.
  • As an example, the numbers in the “Open” row and “Fully Closed” column denote the number of cases that were actually open but were anticipated to be fully closed.
To assess the effectiveness of the proposed model in detecting roadway conditions after the hurri-cane event, a confusion matrix in Table 2 was constructed to summarize the classification results across three categories: open, partially closed, and fully closed roads. Each entry in the matrix reflects the number of pixels (or segments) the model correctly or incorrectly identified for each class. The diagonal values indicate correct classifications, while the off-diagonal values represent misclassifi-cations, such as incorrectly labeling a fully closed road as partially closed. This matrix serves as a critical tool for understanding how well the model distinguishes between different levels of road obstruction, which is vital for informing evacuation planning, accessibility assessments, and emergency response operations in disaster-affected areas.
Finally, we used precision, recall, and F1-score to evaluate the model’s performance. The conventional formulas shown below were utilized to calculate these measures for every class. Recall measures the ability to identify every positive occurrence, precision expresses the accuracy of positive predictions, and the F1-score offers a fair evaluation that takes both precision and recall into account.
The ratio of accurately predicted positive observations to the total number of predicted positives is known as precision. It measures how frequently positive predictions were accurate.
P = T P T P + F P
where
  • TP (true positives) is the number of instances correctly predicted as positive.
  • FP (false positives) is the number of instances incorrectly predicted as positive.
Recall is the ratio of correctly predicted positive observations to the total actual positives. It measures the model’s ability to capture all positive instances.
R = T P T P + F N
where
  • TP (true positives) is the number of instances correctly predicted as positive.
  • FN (false negatives) is the number of instances incorrectly predicted as negative.
The ratio of the harmonic means of recall and precision is known as the F1-score. It offers a fair evaluation, particularly in cases where the proportion of positive to bad occurrences is imbalanced.
F 1 = 2 . ( P . R ) P + R
Table 3 presents the computed performance metrics that offer a comprehensive evaluation of the model’s ability to classify roadway conditions impacted by Hur-ricane Ian. These metrics include precision, recall, and F1-score for each of the three classes: open, partially closed, and fully closed roads. In addition to con-firming the overall correctness of the classification, these metrics help assess the model’s effectiveness in accurately detecting and distinguishing between varying degrees of road accessibility. The results shown in Table 3 provide valuable insight into the model’s performance and highlight its potential application in real-world post-disaster response scenarios.

5. Discussions on Findings

The findings indicate that the impacts of Hurricane Ian were most noticeable in coastal regions, which suggests that there were more roadway closures. However, the interaction between debris and storm surge made precise detection more difficult. In the context of infrastructure recovery, sustainability becomes crucial because long-term disaster management heavily relies on rebuilding roadways with resilience to future storm surges.
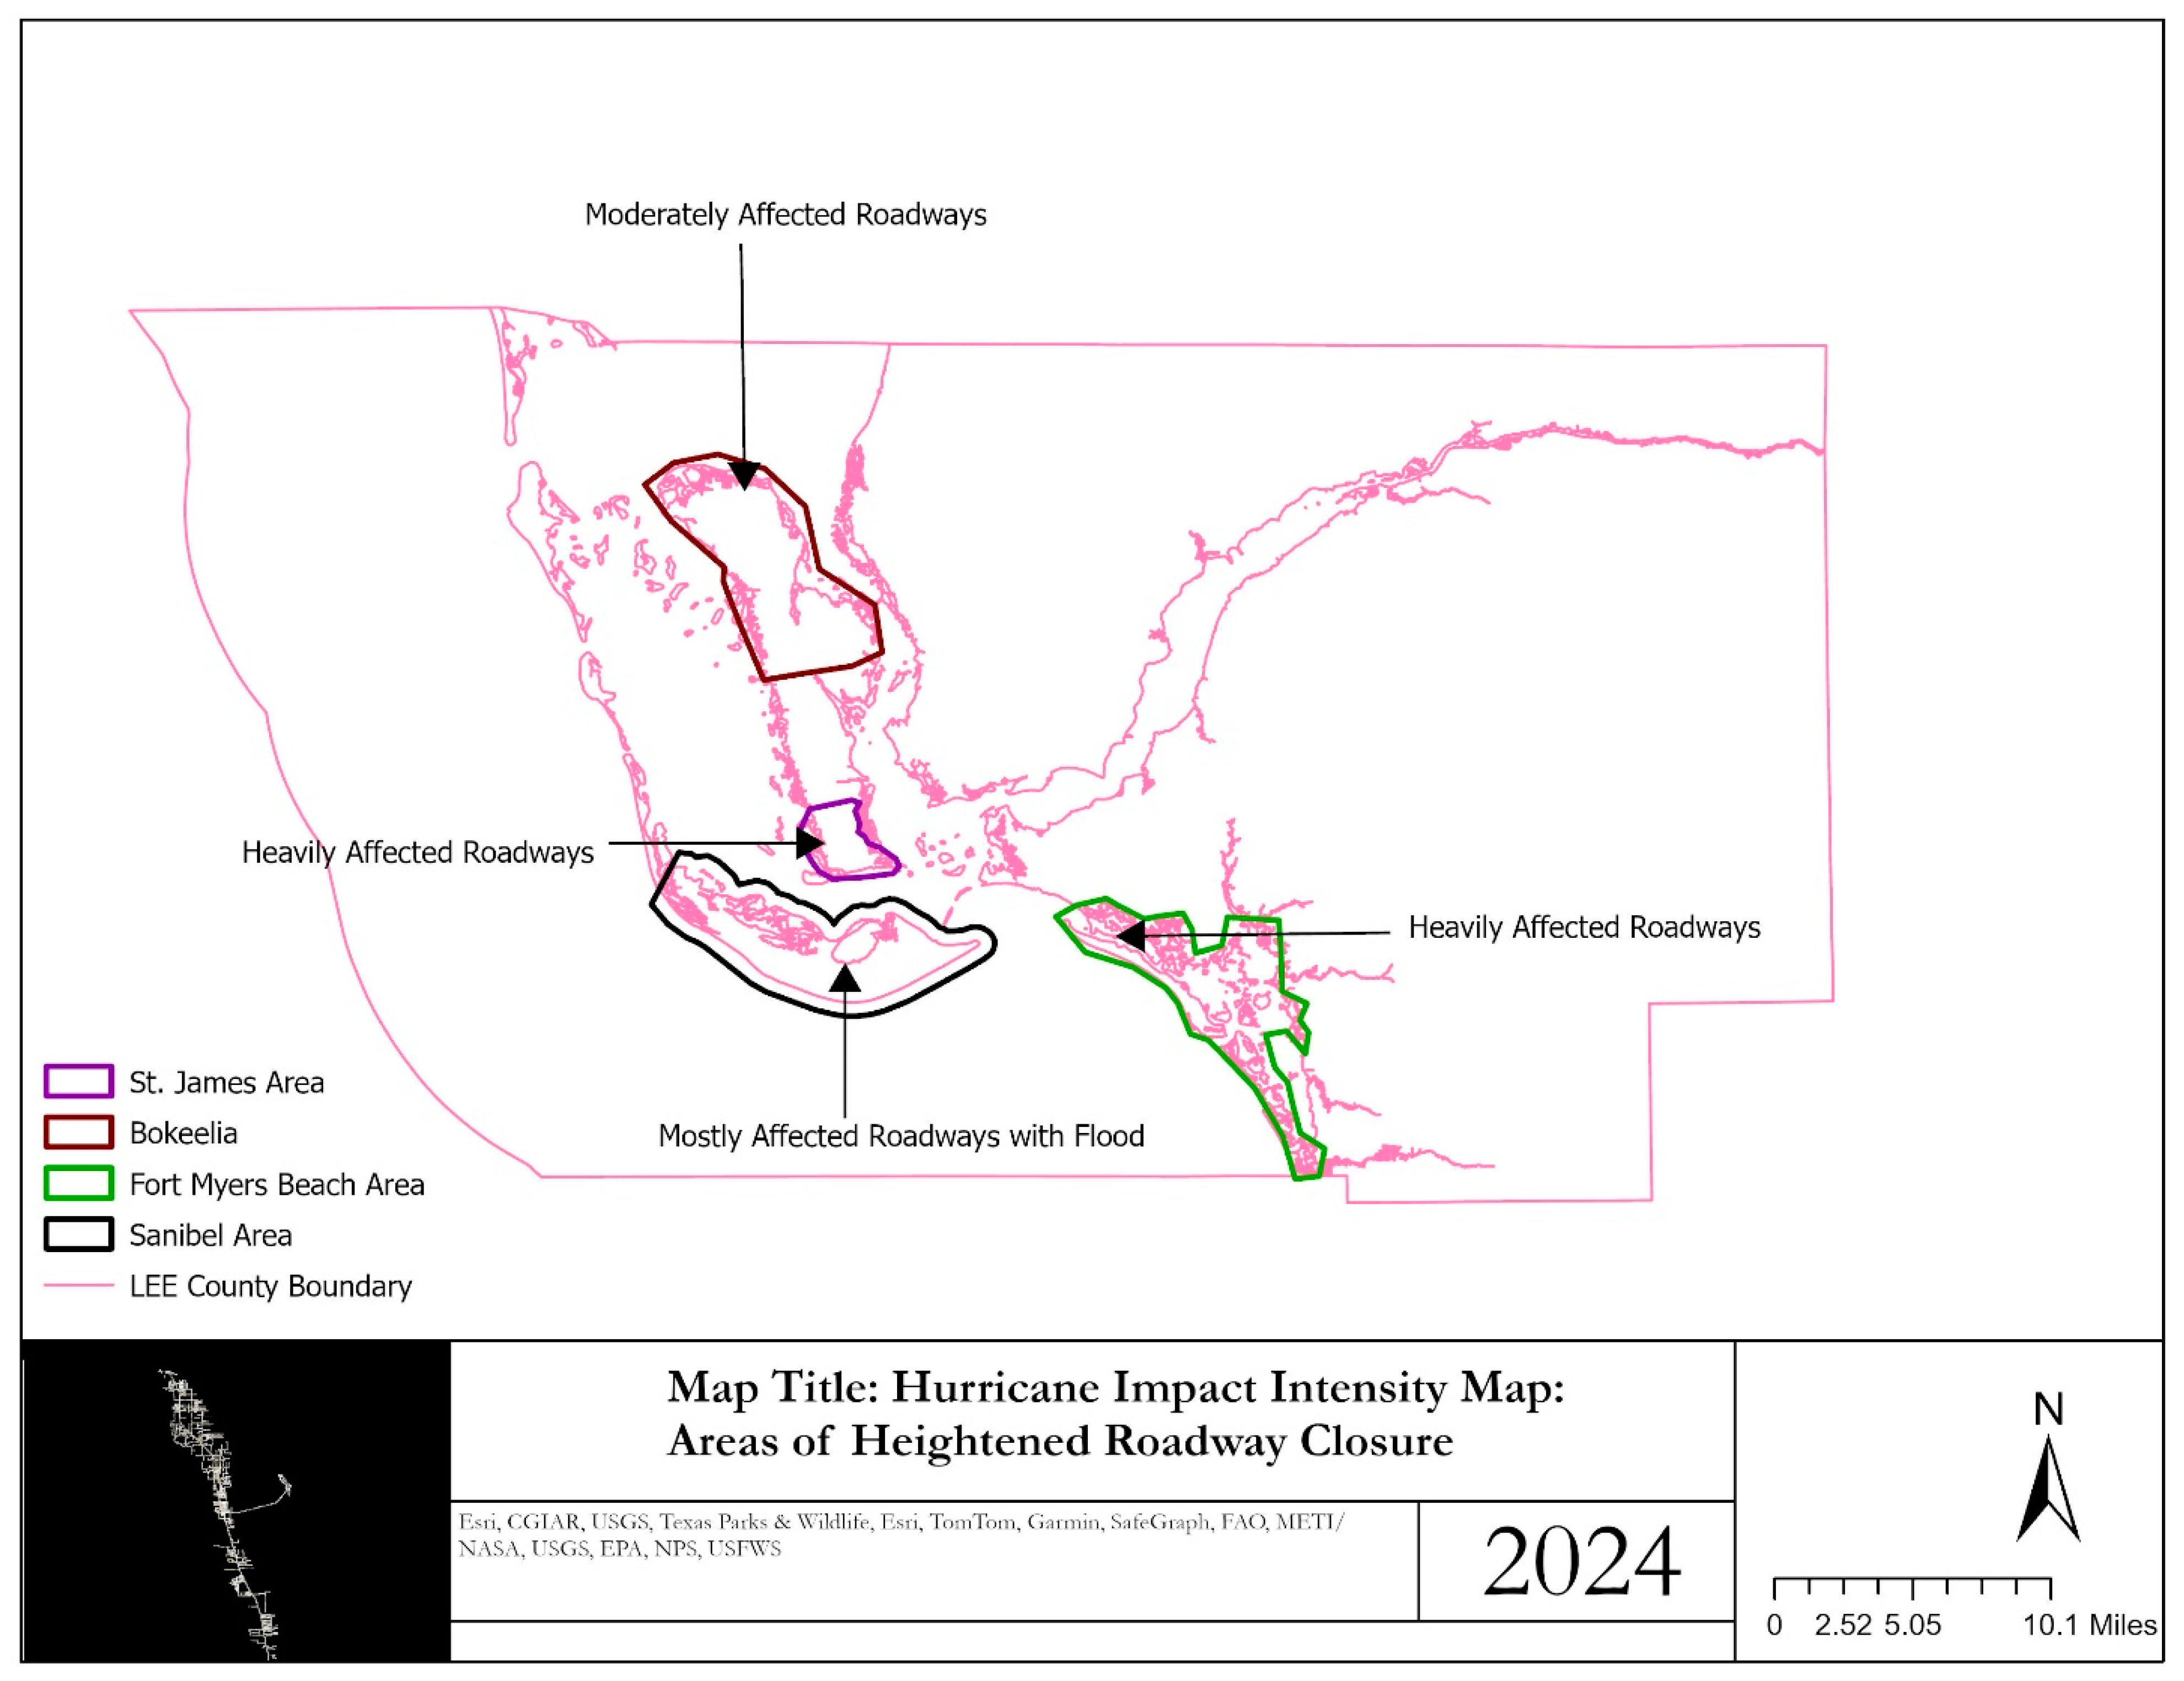
The Sanibel area was impacted, as shown in Figure 19, and the model identified many closures. The Fort Myers area had 24 fully closed detections, and the St. James area had 14 fully closed road detections out of the overall 55 fully closed roadway detections. The Bokeelia and Pine Island areas were affected moderately per the model detection, and Sanibel had many flooded roadways where the model had a minimum number of fully closed detections but had several partially closed roadway detections. However, when analyzed from aerial imagery, most of the closures in these regions were due to sea debris and flooding. This highlights the need for sustainable, adaptive designs that can better withstand such debris accumulation in the future, preventing prolonged disruptions to mobility. The map shown in Figure 19 also shows how seriously affected the roadways were in the Fort Myers beach region and on San Carlos Island. Many roadways in these locations were totally blocked due to debris from buildings and trees, as well as debris from the seawater. The roadway debris from mobile homes and other buildings was found in regions that were not near beaches, resulting in both partial and full closures. Among these, the areas of St. James City and the Flamingo Bay Area were severely impacted. Such widespread and severe disruption calls for a reconsideration of urban planning and infrastructure resilience in the region, promoting sustainable recovery efforts. Compared to other areas of the county, Bokeelia and Pine Island’s roadways were less severely impacted, according to the model.
We also focused on the demographics of the impacted region and tried to provide some insights on the vulnerability of the populations with respect to the findings of the model related to roadway closures. U.S. Census tract data on the total population and aged (65+) population have been used for this purpose. Figure 20 illustrates how an in-depth assessment of the overall population distribution across affected and unaffected areas is made possible by the study’s use of census tract data.
Figure 20 indicates that there have been higher population numbers, both total and aged, in heavily affected areas, which are probably the ones experiencing the greatest impact of hurricane-related damage. On the other hand, places that were relatively spared from the hurricane’s impacts have lower total populations. These findings underscore the importance of developing resilient communities where both young and elderly populations can be better protected from future storm events. Creating sustainable evacuation plans that prioritize the most vulnerable can ensure equitable recovery efforts. The correlation between the number of older people in Figure 21 and the intensity of the hurricane effect is also a significant observation. Elderly people make up a larger percentage of the population in heavily impacted areas, which are marked by their heightened vulnerability. This realization highlights the importance of integrating sustainability into both disaster preparedness and recovery plans to ensure that senior citizens are not left behind. This realization emphasizes the possible difficulties older populations may encounter during and after hurricanes, such as those related to their health conditions, highlighting the need for providing better accessibility in these catastrophic situations. Understanding the population patterns in both affected and unaffected areas has major implications for emergency response strategies. Areas that are severely affected and have higher total and older population numbers need to receive more attention and resources. Using this information on roadway closures, emergency responders can prioritize help, develop better evacuation strategies, and provide better access to healthcare services where the most urgent need exists. Incorporating sustainable planning into these emergency response efforts ensures that future disasters are met with better preparedness and that vulnerable populations have consistent access to the resources they need. Local government agencies, nonprofits, and community organizations can also create customized resilience-building initiatives by identifying high-risk locations and those that are living in that region.
The model’s effectiveness in these domains is essential for understanding accessibility issues, particularly for senior citizens living in coastal areas. The results of the detection indicate that there might be challenges in accurately predicting roadway accessibility for this group of people. This gap highlights the importance of developing systems that consider long-term sustainability and resilience in the face of recurrent disasters, ensuring better accessibility for elderly populations in future hurricane events. It is essential to understand how Hurricane Ian affected roadway accessibility when developing emergency response plans with a focus on the elderly. In addition, the rapid decision making of emergency responders is facilitated by the correct identification of roadway conditions, which enables effective resource allocation and prioritizes help for older populations who may have mobility issues. Sustainability in these efforts means that future decisions about resource allocation and road repairs will consider long-term environmental factors, ensuring that communities recover and thrive in the wake of future disasters.

5.1. Application of the Model to Hurricane Idalia

To validate the robustness and generalizability of our model, we applied it to the aftermath of Hurricane Idalia, which impacted Northeast Florida, specifically in Taylor County as shown in Figure 22. Aerial images were obtained from the National Hurricane Center and National Oceanic and Atmospheric Administration [43]. The timestamp for these images is from 8 August 2023, to 2 September 2023, after Hurricane Idalia made landfall. The classification results demonstrated that our model effectively identifies roadway conditions in different geographic areas and for different hurricane events.

Results

The model categorized roadways into three classes as before: open, partially closed, and fully closed. The detection results were encouraging, showing a high level of accuracy across all categories, at an average confidence of 85% as seen in Table 4. The precision rates for each class—open, partially closed, and fully closed—were notably high, indicating that the model is reliable in differentiating between various roadway conditions.
These findings support the applicability of our model beyond the initial study area in Lee County, Florida. The high precision rates across different classifications suggest that the model is capable of accurately assessing roadway conditions in the wake of different hurricanes, thereby offering a valuable tool for disaster response and recovery efforts in various regions. By successfully applying the model to Hurricane Idalia, we have demonstrated its effectiveness in identifying the extent of roadway closures and debris presence under different circumstances. This validation highlights the model’s potential for broader use in emergency management and urban planning.
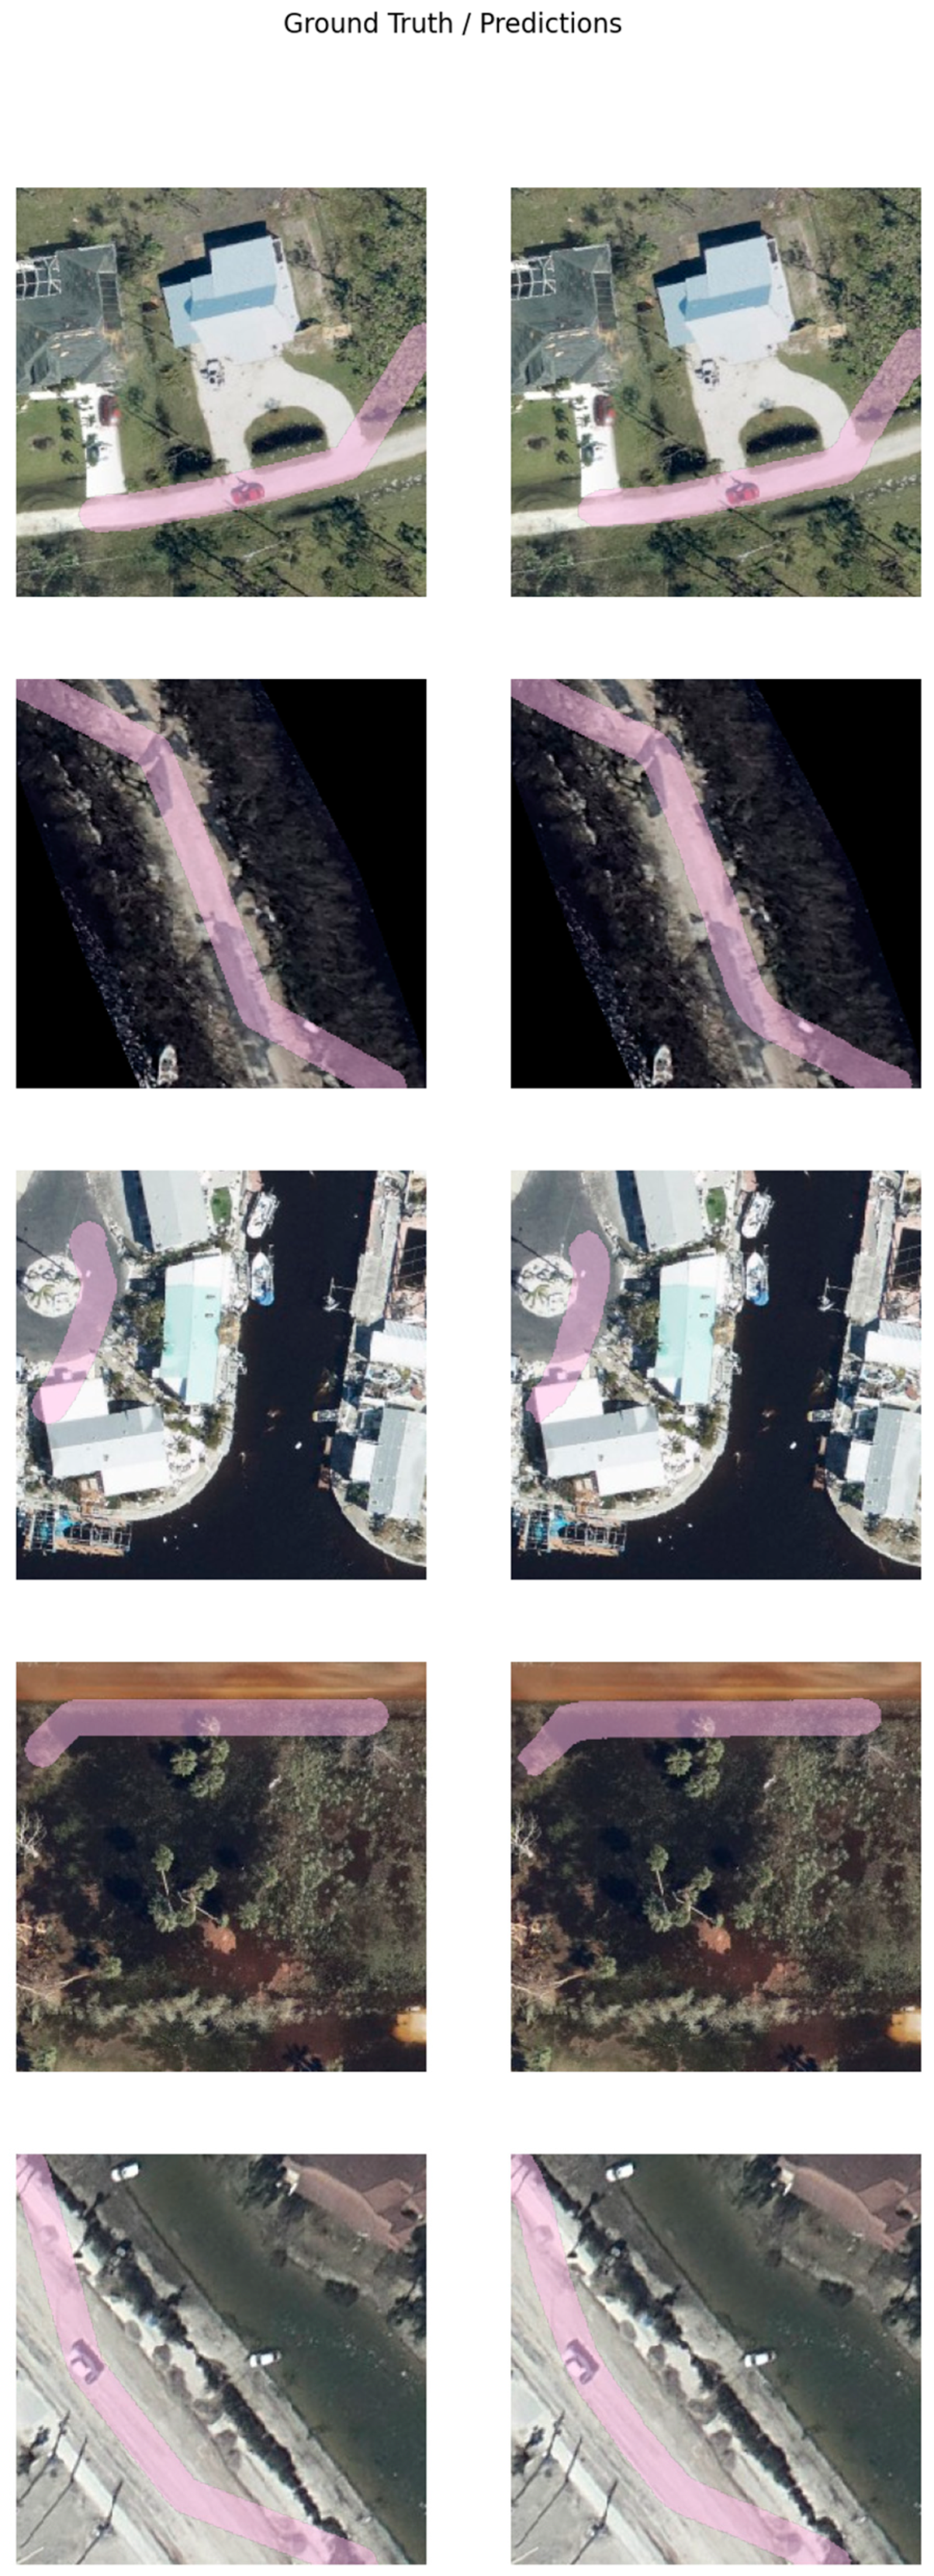
The model’s sample detection outputs for Hurricane Idalia-affected road conditions are shown in Figure 23. These graphic outcomes show how well the model can identify and differentiate between roads that are open, partially closed, and completely closed. The image provides a clear visual validation of the model’s classification performance by highlighting distinct segments according to their state. Figure 23 illustrates how the detected outputs closely match the ground truth, demonstrating the model’s potential for emergency response planning and post-hurricane roadway assessment.

6. Conclusions, Limitations, and Future Work

This study provided a machine learning-based methodology to assess the impact of hurricanes Ian and Idalia on roadways, focusing on roadway closures and accessibility. By classifying road conditions into three categories—open, totally closed, and partially closed—we leveraged high-resolution satellite imagery and machine learning techniques to generate timely and accurate data. The roadway closure and damage detection results derived from YOLOv3 can be seamlessly integrated into GIS-based emergency management systems, enhancing decision making during disaster recovery efforts. By automating the detection of hurricane-induced roadway closures, this approach provides timely insights into affected roadways, which can be used to optimize evacuation routes and prioritize recovery efforts.
The model’s real-time detection capabilities allow for dynamic updates of roadway networks, with detected closures and damage directly visualized on digital maps, ensuring transportation agencies and emergency responders have accurate, up-to-date information. Moreover, this model can play a crucial role in long-term infrastructure planning by identifying vulnerable areas that are most susceptible to damage from future hurricanes, helping to prioritize future mitigation efforts. Incorporating the model’s detection results into infrastructure management systems can support sustainable and resilient transportation networks, where rapid response times and informed decision making are essential for minimizing the impact of disasters.
These insights are crucial for improving disaster response, optimizing emergency planning, and enhancing the long-term resilience of transportation infrastructure. The findings of this research underscore the importance of integrating sustainable disaster resilience strategies into emergency response planning. The ability to quickly assess roadway conditions can help local governments and emergency responders develop more adaptive and resource-efficient recovery plans, reducing unnecessary delays and optimizing aid distribution. Moreover, the insights gained from this study can inform climate-resilient infrastructure investments, such as reinforcing roadways in flood-prone areas and improving drainage systems to minimize future disruptions. By ensuring road networks are not only restored but also built to withstand future extreme weather events, communities can achieve greater long-term sustainability and preparedness.
Despite its contributions, this study has some inherent limitations. One key challenge is the presence of debris, vegetation, or occlusions, which can obstruct visibility in aerial imagery and introduce uncertainty in roadway classification and detection. Differentiating between fully and partially closed roads was particularly challenging, as variations in debris distribution could lead to misclassification. Environmental factors such as shadows, terrain variations, and reflections sometimes affect model accuracy. Additionally, while YOLOv3 demonstrated strong performance in detecting roadway damages and closures, its effectiveness can diminish under real-time conditions where high-quality or up-to-date aerial imagery may be unavailable. Factors such as low-resolution imagery, poor visibility, occlusions (e.g., flooding or tree canopy), and outdated datasets can result in false positives or missed detections, especially in complex urban or rural terrains. These challenges highlight the need for more robust, adaptive machine learning models that can improve real-time disaster assessment and support sustainable infrastructure planning by incorporating dynamic, evolving roadway conditions, ultimately supporting more resilient and timely disaster response efforts.
Future research should explore ways to mitigate these limitations while reinforcing sustainability in disaster response efforts. Incorporating real-time satellite and sensor data could enable the continuous monitoring of roadway conditions, ensuring that emergency responses are not only timely but also resource efficient. Moreover, machine learning algorithms could be enhanced to account for evolving debris accumulation patterns, enabling better post-disaster mobility planning. By integrating predictive analytics with sustainable infrastructure design, such as nature-based solutions for flood mitigation and energy-efficient road maintenance strategies, future models can contribute to both short-term disaster response and long-term climate adaptation.
Understanding the dynamic interaction between hurricanes and roadway infrastructure is critical for improving emergency response, transportation planning, and community resilience. By ensuring that disaster recovery efforts prioritize sustainable rebuilding practices, this research can help pave the way for more resilient, adaptive, and environmentally responsible infrastructure systems.

Author Contributions

The following authors confirm their contribution to the paper with regards to study conception and design: S.T., R.B.A., E.E.O., L.O., and R.M. Data collection and Methodology: S.T., R.B.A., E.E.O., and L.O.; analysis and interpretation of results: S.T., R.B.A., E.E.O., L.O., and R.M.; manuscript preparation: S.T., R.B.A., E.E.O., L.O., and R.M. All authors have read and agreed to the published version of the manuscript.

Funding

This research was funded by the Rural Equitable and Accessible Transportation (REAT) Center, a Tier-1 University Transportation Center (UTC) funded by the United States Department of Transportation (USDOT), through agreement number 69A3552348321.

Institutional Review Board Statement

Not applicable.

Informed Consent Statement

Not applicable.

Data Availability Statement

The pre-hurricane images were obtained from the Florida Department of Transportation’s APLUS database [42], while the post-hurricane images were sourced from the National Oceanic and Atmospheric Administration [43] and National Hurricane Center website. Road network, evacuation route, census, and demographic data were acquired from the Florida Geographic Data Library [44].

Acknowledgments

This work has been partially supported by the Rural Equitable and Accessible Transportation (REAT) Center and the U.S. Department of Transportation. The opinions, findings, and conclusions, expressed in this publication, are those of the authors and do not necessarily reflect the views of the REAT Center and the U.S. Department of Transportation.

Conflicts of Interest

The authors declare that they have no conflicts of interest related to this study.

References

  1. National Oceanic and Atmospheric Administration (NOAA) “Hurricane Costs”. Available online: https://coast.noaa.gov/states/fast-facts/hurricane-costs.html (accessed on 26 June 2023).
  2. Jeffrey, E.F. What-in-the-World-Is-Infrastructure. Available online: https://corenergy.reit/wp-content/uploads/2018/03/what-in-the-world-is-infrastructure.pdf (accessed on 26 June 2023).
  3. Hu, S. Convolutional Neural Network Combined with Transfer Learning for Damage Assessment with Satellite Imagery. In Proceedings of the CAIBDA 2022, 2nd International Conference on Artificial Intelligence, Big Data and Algorithms, Nanjing, China, 17–19 June 2022; pp. 1–7. [Google Scholar]
  4. Baroud, H.; Barker, K.; Ramirez-Marquez, J.E.; Rocco, S.C.M. Importance Measures for Inland Waterway Network Resilience. Transp. Res. E Logist. Transp. Rev. 2014, 62, 55–67. [Google Scholar] [CrossRef]
  5. Pang, Y.; Liang, Z.; Xie, P.; Li, L. Adaptive Optimization of Wind Environment in Coastal Village Spatial Forms of Western Guangdong. Buildings 2024, 14, 3721. [Google Scholar] [CrossRef]
  6. Li, J.; Yang, Z.; Zhao, X.; Li, Y.; Huang, X.; Chen, Y.; Shi, F. Study of the Correlation between the Urban Wind–Heat Environment and Urban Development Elements in High-Density Urban Areas: A Case Study of Central Shanghai. Buildings 2024, 14, 315. [Google Scholar] [CrossRef]
  7. Kustova, I.; Hudenko, J.; Lace, N. A Systematic Review of Sustainability Criteria in Infrastructure Development. Sustainability 2024, 16, 4564. [Google Scholar] [CrossRef]
  8. Lounis, Z.; McAllister, T.P. Risk-Based Decision Making for Sustainable and Resilient Infrastructure Systems. J. Struct. Eng. 2016, 142, F4016005. [Google Scholar] [CrossRef]
  9. Vetrivel, A.; Kerle, N.; Gerke, M.; Nex, F.; Vosselman, G. Towards Automated Satellite Image Segmentation and Classification for Assessing Disaster Damage Using Data-Specific Features with Incremental Learning. In Proceedings of the GEOBIA, Enschede, The Netherlands, 14–16 September 2016. [Google Scholar]
  10. Kerle, N.; Hoffman, R.R. Collaborative Damage Mapping for Emergency Response: The Role of Cognitive Systems Engineering. Nat. Hazards Earth Syst. Sci. 2013, 13, 97–113. [Google Scholar] [CrossRef]
  11. Dong, L.; Shan, J. A Comprehensive Review of Earthquake-Induced Building Damage Detection with Remote Sensing Techniques. ISPRS J. Photogramm. Remote Sens. 2013, 84, 85–99. [Google Scholar] [CrossRef]
  12. Peng, B.; Meng, Z.; Huang, Q.; Wang, C. Patch Similarity Convolutional Neural Network for Urban Flood Extent Mapping Using Bi-Temporal Satellite Multispectral Imagery. Remote Sens 2019, 11, 2492. [Google Scholar] [CrossRef]
  13. Sánchez-Silva, M.; García, L. Earthquake Damage Assessment Based on Fuzzy Logic and Neural Networks. Earthq. Spectra 2001, 17, 89–112. [Google Scholar] [CrossRef]
  14. Ji, M.; Liu, L.; Du, R.; Buchroithner, M.F. A Comparative Study of Texture and Convolutional Neural Network Features for Detecting Collapsed Buildings after Earthquakes Using Pre- and Post-Event Satellite Imagery. Remote Sens. 2019, 11, 1202. [Google Scholar] [CrossRef]
  15. Spekkers, M.H.; Kok, M.; Clemens, F.H.L.R.; Ten Veldhuis, J.A.E. Decision-Tree Analysis of Factors Influencing Rainfall-Related Building Structure and Content Damage. Nat. Hazards Earth Syst. Sci. 2014, 14, 2531–2547. [Google Scholar] [CrossRef]
  16. Tavus, B.; Kocaman, S.; Gokceoglu, C. Flood Damage Assessment with Sentinel-1 and Sentinel-2 Data after Sardoba Dam Break with GLCM Features and Random Forest Method. Sci. Total Environ. 2022, 816, 151585. [Google Scholar] [CrossRef]
  17. Zapico, J.L.; González, M.P.; Worden, K. Damage Assessment Using Neural Networks. Mech. Syst. Signal Process. 2003, 17, 119–125. [Google Scholar] [CrossRef]
  18. Kourehli, S.S. Damage Assessment in Structures Using Incomplete Modal Data and Artificial Neural Network. Int. J. Struct. Stab. Dyn. 2015, 15, 1450087. [Google Scholar] [CrossRef]
  19. Barnes, C.F.; Fritz, H.; Yoo, J. Hurricane Disaster Assessments with Image-Driven Data Mining in High-Resolution Satellite Imagery. IEEE Trans. Geosci. Remote Sens. 2007, 45, 1631–1640. [Google Scholar] [CrossRef]
  20. Cortes, C.; Vapnik, V.; Saitta, L. Support-Vector Networks Editor. Mach. Learn. 1995, 20, 273–297. [Google Scholar] [CrossRef]
  21. Cover, T.M.; Hart, P.E. Approximate Formulas for the Information Transmitted by a Discrete Communication Channel. IEEE Trans. Inf. Theory 1952, 24, 335–342. [Google Scholar]
  22. Lowe, D.G. Distinctive Image Features from Scale-Invariant Keypoints. Int. J. Comput. Vis. 2004, 60, 91–110. [Google Scholar] [CrossRef]
  23. Dalal, N.; Triggs, B. Histograms of Oriented Gradients for Human Detection. In Proceedings of the IEEE Computer Society Conference on Computer Vision and Pattern Recognition (CVPR’05), San Diego, CA, USA, 20–26 June 2005; pp. 886–893. [Google Scholar]
  24. Zhu, X.X.; Tuia, D.; Mou, L.; Xia, G.-S.; Zhang, L.; Xu, F.; Fraundorfer, F. Deep Learning in Remote Sensing: A Comprehensive Review and List of Resources. IEEE Geosci. Remote Sens. Mag. 2017, 5, 8–36. [Google Scholar] [CrossRef]
  25. Bischke, B.; Helber, P.; Folz, J.; Borth, D.; Dengel, A. Multi-Task Learning for Segmentation of Building Footprints with Deep Neural Networks. In Proceedings of the 2019 IEEE International Conference on Image Processing (ICIP), Taipei, Taiwan, 22–25 September 2019; pp. 1480–1484. [Google Scholar]
  26. Kulambayev, B.; Beissenova, G.; Katayev, N.; Abduraimova, B.; Zhaidakbayeva, L.; Sarbassova, A.; Akhmetova, O.; Issayev, S.; Suleimenova, L.; Kasenov, S.; et al. A Deep Learning-Based Approach for Road Surface Damage Detection. Comput. Mater. Contin. 2022, 73, 3403–3418. [Google Scholar] [CrossRef]
  27. Naito, S.; Tomozawa, H.; Mori, Y.; Nagata, T.; Monma, N.; Nakamura, H.; Fujiwara, H.; Shoji, G. Building-Damage Detection Method Based on Machine Learning Utilizing Aerial Photographs of the Kumamoto Earthquake. Earthq. Spectra 2020, 36, 1166–1187. [Google Scholar] [CrossRef]
  28. Wang, Y.; Feng, W.; Jiang, K.; Li, Q.; Lv, R.; Tu, J. Real-Time Damaged Building Region Detection Based on Improved YOLOv5s and Embedded System from UAV Images. IEEE J. Sel. Top. Appl. Earth Obs. Remote Sens. 2023, 16, 4205–4217. [Google Scholar] [CrossRef]
  29. Zheng, Z.; Zhong, Y.; Wang, J.; Ma, A.; Zhang, L. Building Damage Assessment for Rapid Disaster Response with a Deep Object-Based Semantic Change Detection Framework: From Natural Disasters to Man-Made Disasters. Remote Sens. Environ. 2021, 265, 112636. [Google Scholar] [CrossRef]
  30. Redmon, J.; Farhadi, A. Yolov3: An Incremental Improvement. 2018. Available online: https://arxiv.org/abs/1804.02767 (accessed on 12 June 2023).
  31. Zhang, X.; Dong, X.; Wei, Q.; Zhou, K. Real-Time Object Detection Algorithm Based on Improved YOLOv3. J. Electron. Imaging 2019, 28, 053022. [Google Scholar] [CrossRef]
  32. Zhao, L.; Li, S. Object Detection Algorithm Based on Improved YOLOv3. Electronics 2020, 9, 537. [Google Scholar] [CrossRef]
  33. Wang, Y.; Ruan, S.; Wang, T.; Qiao, M. Rapid Estimation of an Earthquake Impact Area Using a Spatial Logistic Growth Model Based on Social Media Data. Int. J. Digit. Earth 2019, 12, 1265–1284. [Google Scholar] [CrossRef]
  34. Pourebrahim, N.; Sultana, S.; Edwards, J.; Gochanour, A.; Mohanty, S. Understanding Communication Dynamics on Twitter during Natural Disasters: A Case Study of Hurricane Sandy Understanding Communication Dynamics on Twitter During. Int. J. Disaster Risk Reduct. 2019, 37, 101176. [Google Scholar] [CrossRef]
  35. Kim, J.; Bae, J.; Hastak, M. Emergency Information Diffusion on Online Social Media during Storm Cindy in U.S. Int. J. Inf. Manag. 2018, 40, 153–165. [Google Scholar] [CrossRef]
  36. Martín, Y.; Cutter, S.L.; Li, Z.; Emrich, C.T.; Mitchell, J.T. Using Geotagged Tweets to Track Population Movements to and from Puerto Rico after Hurricane Maria. Popul. Environ. 2020, 42, 4–27. [Google Scholar] [CrossRef]
  37. Pavur, G.; Lakshmi, V.; Lambert, J.H. A Hydrological and Socioeconomic Risk Assessment of Tropic Cyclone Disasters by Leveraging Space-Based Earth Observation. In Proceedings of the 25th EGU General Assembly, Online, 23–28 April 2023. [Google Scholar] [CrossRef]
  38. Sodders, N.; Stockdale, K.; Baker, K.; Ghanem, A.; Vieth, B.; Harder, T.; Morbidity and Mortality Weekly Report. Notes from the Field Vibriosis Cases Associated with Flood Waters During and After Hurricane Ian-Florida, September–October 2022. Available online: https://www.cdc.gov/mmwr/volumes/72/wr/mm7218a5.htm (accessed on 28 June 2023).
  39. Karimiziarani, M.; Moradkhani, H. Social Response and Disaster Management: Insights from Twitter Data Assimilation on Hurricane Ian. Int. J. Disaster Risk Reduct. 2022, 95, 103865. [Google Scholar] [CrossRef]
  40. National Environmental Satellite Data and Information Service Hurricane Ian’s Path of Destruction. Available online: https://www.nesdis.noaa.gov/news/hurricane-ians-path-of-destruction (accessed on 28 June 2023).
  41. Available online: https://cn.bing.com/Images/Search?q=hurricane+ian&qpvt=Hurricane+Ian&form=IGRE&first=1&cw=1473&ch=823 (accessed on 28 June 2023).
  42. Florida Department of Transportation. Available online: https://aplus.fdot.gov/ (accessed on 28 June 2023).
  43. National Oceanic and Atmospheric Administration. Available online: https://storms.ngs.noaa.gov/storms/idalia/index.html#7/29.15/-82.97 (accessed on 28 June 2023).
  44. Florida Geographic Data Library. Available online: https://fgdl.org/ (accessed on 28 June 2023).
  45. Szeliski, R. Computer Vision: Algorithms and Applications; Springer: Berlin/Heidelberg, Germany, 2022. [Google Scholar] [CrossRef]
  46. Minaee, S.; Boykov, Y.; Porikli, F.; Plaza, A.; Kehtarnavaz, N.; Terzopoulos, D. Image Segmentation Using Deep Learning: A Survey. IEEE Trans. Pattern Anal. Mach. Intell. 2022, 44, 3523–3542. [Google Scholar] [CrossRef] [PubMed]
  47. Ajmal, H.; Rehman, S.; Farooq, U.; Ain, Q.U.; Riaz, F.; Hassan, A. Convolutional Neural Network Based Image Segmentation: A Review. Proc. SPIE 2018, 10649, 191–203. [Google Scholar] [CrossRef]
  48. He, K.; Gkioxari, G.; Dollar, P.; Girshick, R. Mask R-CNN. In Proceedings of the IEEE International Conference on Computer Vision, Venice, Italy, 22–29 October 2017; pp. 2980–2988. [Google Scholar] [CrossRef]
  49. Szegedy, C.; Liu, W.; Jia, Y.; Sermanet, P.; Reed, S.; Anguelov, D.; Erhan, D.; Vanhoucke, V.; Rabinovich, A. Going deeper with convolutions. In Proceedings of the 2015 IEEE Conference on Computer Vision and Pattern Recognition (CVPR), Boston, MA, USA, 7–12 June 2015; pp. 1–9. [Google Scholar] [CrossRef]
  50. Lu, X.; Zhong, Y.; Zheng, Z.; Liu, Y.; Zhao, J.; Ma, A.; Yang, J. Multi-Scale and Multi-Task Deep Learning Framework for Automatic Road Extraction. IEEE Trans. Geosci. Remote Sens. 2019, 57, 9362–9377. [Google Scholar] [CrossRef]
  51. Zeng, J.; Zhong, H. YOLOv8-PD: An Improved Road Damage Detection Algorithm Based on YOLOv8n Model. Sci. Rep. 2024, 14, 12052. [Google Scholar] [CrossRef]
  52. Redmon, J.; Divvala, S.; Girshick, R.; Farhadi, A. You Only Look Once: Unified, Real-Time Object Detection. In Proceedings of the IEEE Conference on Computer Vision and Pattern Recognition, Las Vegas, NV, USA, 27–30 June 2016; pp. 779–788. [Google Scholar]
  53. Tsang, S.H. Review: Yolov3—You Only Look Once (Object Detection). 2018. Available online: https://medium.com/data-science/review-yolov3-you-only-look-once-object-detection-eab75d7a1ba6 (accessed on 25 June 2023).
  54. Silva, L.A.; Leithardt, V.R.Q.; Batista, V.F.L.; Villarrubia Gonzalez, G.; De Paz Santana, J.F. Automated Road Damage Detection Using UAV Images and Deep Learning Techniques. IEEE Access 2023, 11, 62918–62931. [Google Scholar] [CrossRef]
  55. Kathuria, A. What’s New in YOLO v3? 2018. Available online: https://towardsdatascience.com/digging-deep-into-yolo-v3-a-hands-on-guide-part-1-78681f2c7e29/ (accessed on 25 June 2023).
  56. Redmon, J. YOLO: Real-Time Object Detection. Available online: https://ieeexplore.ieee.org/document/7780460 (accessed on 25 June 2023).
  57. Redmon, J.; Farhadi, A. YOLO9000: Better, Faster, Stronger. In Proceedings of the 2017 IEEE Conference on Computer Vision and Pattern Recognition (CVPR), Honolulu, HI, USA, 21–26 July 2017. [Google Scholar]
Figure 1. Map of study area, Hurricane Ian’s track, and path over the state of Florida [41].
Sustainability 17 03909 g001
Figure 2. Images of damage (such as debris, pavement washout, and obstruction) caused by Hurricane Ian on roadway infrastructure [41].
Sustainability 17 03909 g002aSustainability 17 03909 g002b
Figure 3. Flowchart of the Entire Methodology.
Sustainability 17 03909 g003
Figure 4. Flowchart of image registration processing.
Sustainability 17 03909 g004
Figure 5. Images before and after resampling: (a) pre-hurricane satellite imagery before resampling, (b) pre-hurricane imagery after resampling, and (c) post-hurricane imagery, the reference for resampling.
Sustainability 17 03909 g005
Figure 6. (a) Original post-hurricane image, and (b) segmented post-hurricane image.
Sustainability 17 03909 g006
Figure 7. Flowchart of image classification process.
Sustainability 17 03909 g007
Figure 8. (a) post-hurricane imagery, (b) segmented post-hurricane imagery, (c) ISO cluster classification, and (d) SVM-classified post-hurricane imagery.
Sustainability 17 03909 g008
Figure 9. Framework for training data for the model.
Sustainability 17 03909 g009
Figure 10. Framework of the multi-scale and multi-task automatic roadway extraction model.
Sustainability 17 03909 g010
Figure 11. Roadway extractor model metrics and loss graph.
Sustainability 17 03909 g011
Figure 12. Ground truth/prediction results for roadway extraction model.
Sustainability 17 03909 g012
Figure 13. Results of the extracted roadways.
Sustainability 17 03909 g013
Figure 14. YOLO v3 network architecture.
Sustainability 17 03909 g014
Figure 15. Ground truth/prediction results for detection model.
Sustainability 17 03909 g015
Figure 16. Loss graph for detection model.
Sustainability 17 03909 g016
Figure 17. Sample images with superimposed bounding boxes offering a visual depiction of the model’s ability to identify different roadway conditions.
Sustainability 17 03909 g017
Figure 18. Areas that were falsely detected due to occlusion.
Sustainability 17 03909 g018
Figure 19. Affected areas impacted by Hurricane Ian and roadway closures.
Sustainability 17 03909 g019
Figure 20. Total population impact assessment by census tracts.
Sustainability 17 03909 g020
Figure 21. Aged population impact assessment by census tracts.
Sustainability 17 03909 g021
Figure 22. Area of machine learning model application in Taylor County, Florida.
Sustainability 17 03909 g022
Figure 23. Sample detection images for Hurricane Idalia and the model’s ability to identify different roadway conditions.
Sustainability 17 03909 g023
Table 1. Numbers according to the roadway classification.
Roadway ClassificationCount
Open Roadways110
Fully Closed Roadways55
Partially Closed Roadways96
Table 2. A representative confusion matrix providing an overview of true positives, true negatives, false positives, and false negatives across the three classes.
Predicted Class
Actual ClassOpenFully ClosedPartially Closed
Open104948
Fully Closed6383
Partially Closed1547
Table 3. Model performance evaluations.
True Positive (TP)False Positive (FP)False Negative (FN)
Open104577
Fully Closed38914
Partially Closed47651
Precision (%)Recall (%)F1-Score (%)
Open659477
Fully Closed817377
Partially Closed894862
Table 4. Model performance evaluations for Hurricane Idalia.
ClassOpenPartially ClosedFully ClosedTotal
Number of Detections1151638169
True Positive (TP)False Positive (FP)False Negative (FN)
Open9322
Fully Closed3627
Partially Closed15117
Precision (%)Recall (%)F1-Score (%)
Open8110090
Fully Closed958489
Partially Closed944763
Disclaimer/Publisher’s Note: The statements, opinions and data contained in all publications are solely those of the individual author(s) and contributor(s) and not of MDPI and/or the editor(s). MDPI and/or the editor(s) disclaim responsibility for any injury to people or property resulting from any ideas, methods, instructions or products referred to in the content.

