Article

Optimizing Reverse Logistics Network for Waste Electric Vehicle Batteries: The Impact Analysis of Chinese Government Subsidies and Penalties

1
Energy Economy Research Center, School of Business Administration, Henan Polytechnic University, Jiaozuo 454003, China
2
School of Finance and Economics Administration, Henan Polytechnic University, Jiaozuo 454003, China
*
Author to whom correspondence should be addressed.
Sustainability 2025, 17(9), 3885; https://doi.org/10.3390/su17093885
Submission received: 26 February 2025 / Revised: 19 April 2025 / Accepted: 23 April 2025 / Published: 25 April 2025

Abstract

:
The rapid development of the new energy vehicle industry has resulted in a significant number of waste electric vehicle batteries (WEVBs) reaching the end of their useful life. The recycling of these batteries holds both economic and environmental value. As policy is a critical factor influencing the recycling of waste electric vehicle batteries, its role in the network warrants deeper investigation. Based on this, this study integrates both subsidy and penalty policy into the design of the waste electric vehicle battery reverse logistics network (RLN), aiming to examine the effects of single policy and policy combinations, thereby filling the research gap in the existing literature that predominantly focuses on single-policy perspectives. Considering multiple battery types, different recycling technologies, and uncertain recycling quantities and qualities, this study develops a fuzzy mixed-integer programming model to optimize cost and carbon emission. The fuzzy model is transformed into a deterministic equivalent form using expected intervals, expected values, and fuzzy chance-constrained programming. By normalizing and weighting the upper and lower bounds of the multi-objective functions, the model is transformed into a single-objective optimization problem. The effectiveness of the proposed model and solution method was validated through an empirical study on the construction of a waste electric vehicle battery reverse logistics network in Zhengzhou City. The experimental results demonstrate that combined policy outperforms single policy in balancing economic benefits and environmental protection. The results provide decision-making support for policymakers and industry stakeholders in optimizing reverse logistics networks for waste electric vehicle batteries.

1. Introduction

Driven by the Dual Carbon Strategy, China’s new energy vehicle industry has achieved leapfrog development. Since 2018, China’s new energy vehicle market has experienced explosive growth. By the end of 2024, the number of new energy vehicles in China had reached 31.4 million, solidifying the country’s position as the world’s largest new energy vehicle market. However, electric vehicle batteries, the core components of new energy vehicles, have a limited lifespan of only 5 to 8 years [1]. This indicates that, as time progresses, an increasing number of waste electric vehicle batteries are approaching the end of their useful lives, heralding a surge in battery waste streams. Electric vehicle batteries contain critical metals such as lithium, cobalt, and nickel. The improper disposal of these batteries not only leads to resource wastage but also causes environmental pollution [2]. Therefore, to effectively mitigate environmental pollution and avoid resource wastage, the proper management of waste electric vehicle batteries becomes crucial. Reverse logistics has emerged as a pivotal resource recovery and reuse paradigm, emphasizing activities such as the transportation, warehousing, refurbishment, remanufacturing, disassembly, and disposal of end-of-life products through various functional nodes in the recovery process. These logistics activities not only generate economic benefits but also reduce the extraction of natural resources, mitigate environmental pollution, and thereby foster sustainable development in human society [3]. Given these circumstances, the establishment of a RLN for the systematic recovery of waste electric vehicle batteries represents a critical strategy to optimize both economic and environmental benefits.
Existing studies on electric vehicle battery recycling mainly focus on recovery models [4,5,6], collection channels [7,8], recycling levels [9], and recycling strategies [10]. Among these, the research on the decision-making of recycling models for waste electric vehicle batteries is relatively mature, but studies on RLN design for waste electric vehicle batteries remain scarce. As part of the limited existing literature, Wang et al. [11] investigated the design of a recycling network for waste electric vehicle batteries and clarified the responsibilities of third-party recyclers in the reverse logistics process. Rosenberg et al. [12] developed a dynamic optimization model for the reverse supply chain of waste electric vehicle batteries, addressing multi-period, multi-echelon network planning, including capacity expansion for disassembly centers and recycling plants. Mu et al. [13] constructed and optimized a six-level sustainable dynamic reverse logistics network model, demonstrating its superiority in balancing economic, environmental, and social benefits through multi-objective combinatorial optimization. Saeedi et al. [14] proposed a two-stage stochastic programming model to optimize the sustainable closed-loop supply chain for electric vehicle batteries. Kamyabi et al. [15] integrated system dynamics and two-stage stochastic mixed-integer programming to optimize the closed-loop supply chain network for lead–acid batteries, analyzing the cost and environmental impacts of insufficient recycling capacity, while exploring the role of trade credit and bank credit in supply chain financing decisions. Lin et al. [16] designed a RLN for retired power batteries in Chengdu using a mixed-integer linear programming model, evaluated its economic benefits and resource recovery potential, and proposed optimization strategies to improve network sustainability. Hao et al. [17] developed a multi-objective, multi-period RLN model for electric vehicle battery recall to minimize safety and environmental risks while maximizing social responsibility and economic benefits. Yang et al. [18] established a multi-objective optimization model for a sustainable RLN considering dual-channel recycling, solved it with an improved hybrid co-evolutionary genetic algorithm, and validated its effectiveness in coordinating economic, environmental, and social benefits while analyzing the impact of price competition and uncertainty. Tosarkani et al. [19] introduced a fully fuzzy programming method to predict profit intervals for a multi-echelon, multi-component, and multi-product battery closed-loop supply chain under uncertainty conditions, incorporating a fuzzy analytic network process for green factors and solving the multi-objective problem using distance-based techniques and the ε-constraint method.
However, none of these studies considered the influence of policy on the RLN design for waste electric vehicle batteries. In fact, the current RLN for waste electric vehicle batteries remains in its early developmental stage, requiring substantial economic investment while making it difficult for node enterprises within the network to achieve profitability in the short term. Consequently, policy plays a crucial role in the construction of waste electric vehicle battery RLN. There is limited existing policy-oriented research on the optimization of RLN for power batteries. Of these studies, Saha [20] analyzed the promotional effect of subsidy policies on the design of waste electric vehicle battery RLNs. He [21] and Lei Wang [22] incorporated the impact of carbon emission penalty policies into their study. Evidently, current policy-related studies predominantly consider either single subsidy policies or single penalty policies, focusing exclusively on the influence of single policy on RLN design. In China’s practice, however, the government typically employs combined policy that effectively integrate subsidy and penalty policies to guide the layout of waste electric vehicle battery RLN. Table 1 presents the subsidy and penalty policies implemented by local governments in some regions. Obviously, the combined policy has been widely adopted by the government, achieving significant implementation outcomes. Nevertheless, critical questions remain: Is it truly the case that combined policies are more effective than a single policy? In other words, in which aspects do the combined policies outperform single policies, and to what extent are they optimized? These questions represent key concerns for both policymakers and industry practitioners. This study proposes an optimization model for waste electric vehicle battery RLNs from the perspective of a combined policy and conducts a comparative analysis on the impacts between single and combined policies on network design. This study provides scientific decision-making references for policymakers and node enterprises within waste electric vehicle battery RLN, which constitutes both the starting point and one of the primary contributions of this research.
Meanwhile, as mandated by the “Technical Specifications for Comprehensive Utilization of Waste Power Batteries from New Energy Vehicles” (2024), waste electric vehicle batteries must undergo graded management. Dong [33] emphasizes the critical importance of battery state of health (SOH) assessment. Batteries with higher SOH should be prioritized for cascade utilization in electric vehicle service scenarios or energy storage systems [34], while those with lower SOH should undergo resource recovery through recycling processes [35]. Regarding the recycling of batteries with lower SOH, two dominant technologies are typically employed: hydrometallurgy and pyrometallurgy. Hydrometallurgy involves dissolving pretreated mixtures in acid or alkaline solutions, followed by chemical precipitation, extraction, and other methods to concentrate and separate target elements. This process generates relatively low carbon emissions but incurs higher operational costs due to its complexity [36]. In contrast, pyrometallurgy employs thermal treatment of ores and concentrates to recover precious metals through controlled physical and chemical transformations. While operationally simpler and more cost-effective, this method results in significantly higher carbon emissions [37]. Table 2 presents a comparative analysis of these two recycling technologies with respect to cost and carbon emissions. It is noteworthy that the existing literature on RLN design for waste electric vehicle batteries has overlooked this practical consideration. This study addresses this gap by comprehensively incorporating the impacts of recycling technologies on both cost and carbon emissions, thereby establishing a more realistic and applicable network model. This represents one of the key theoretical and practical contributions of our research.
Furthermore, current studies on RLN design for waste electric vehicle batteries have predominantly focused on deterministic conditions, representing an oversimplification of real-world scenarios. In operational environments, both the quantity and quality of returned batteries exhibit inherent uncertainty and are therefore more accurately modeled as fuzzy parameters. For example, Saha [20] considered the fuzziness in WEVB quantity, while Lin [16] and He [21] incorporated uncertainties in both WEVB quantity and quality. However, these studies were limited to single battery types and did not account for combined policy or different recycling technologies. Our research advances the field by incorporating fuzzy parameters for both quantity and quality across multiple battery types, significantly improving the practical applicability of the theoretical model. Table 3 comprehensively summarizes the relevant literature on waste electric vehicle battery RLNs.
The primary contributions of this study are as follows:
(1)
Diverging from existing studies, this study establishes a RLN optimization model for electric vehicle batteries that concurrently integrates subsidy and penalty policies through a policy combination perspective. By conducting comparative analyses of implementation outcomes between single policy and combined policy, this study provides decision-making support for governments formulating battery recycling policies.
(2)
Meanwhile, this study takes into account the differences between hydrometallurgy and pyrometallurgy in terms of cost and carbon emissions, significantly improving the practical relevance of the findings.
(3)
Furthermore, this study incorporates dual-aspect uncertainties in quantity and quality characteristics of multi-variant waste electric vehicle batteries into the modeling framework, the proposed model demonstrates superior applicability in addressing real-world recycling complexities.
The remainder of this study is organized as follows: Section 2 formulates the multi-objective problem, fuzzy model, and solution methods. Section 3 analyzes parameter sensitivity and policy effects. Section 4 concludes with findings and future directions.

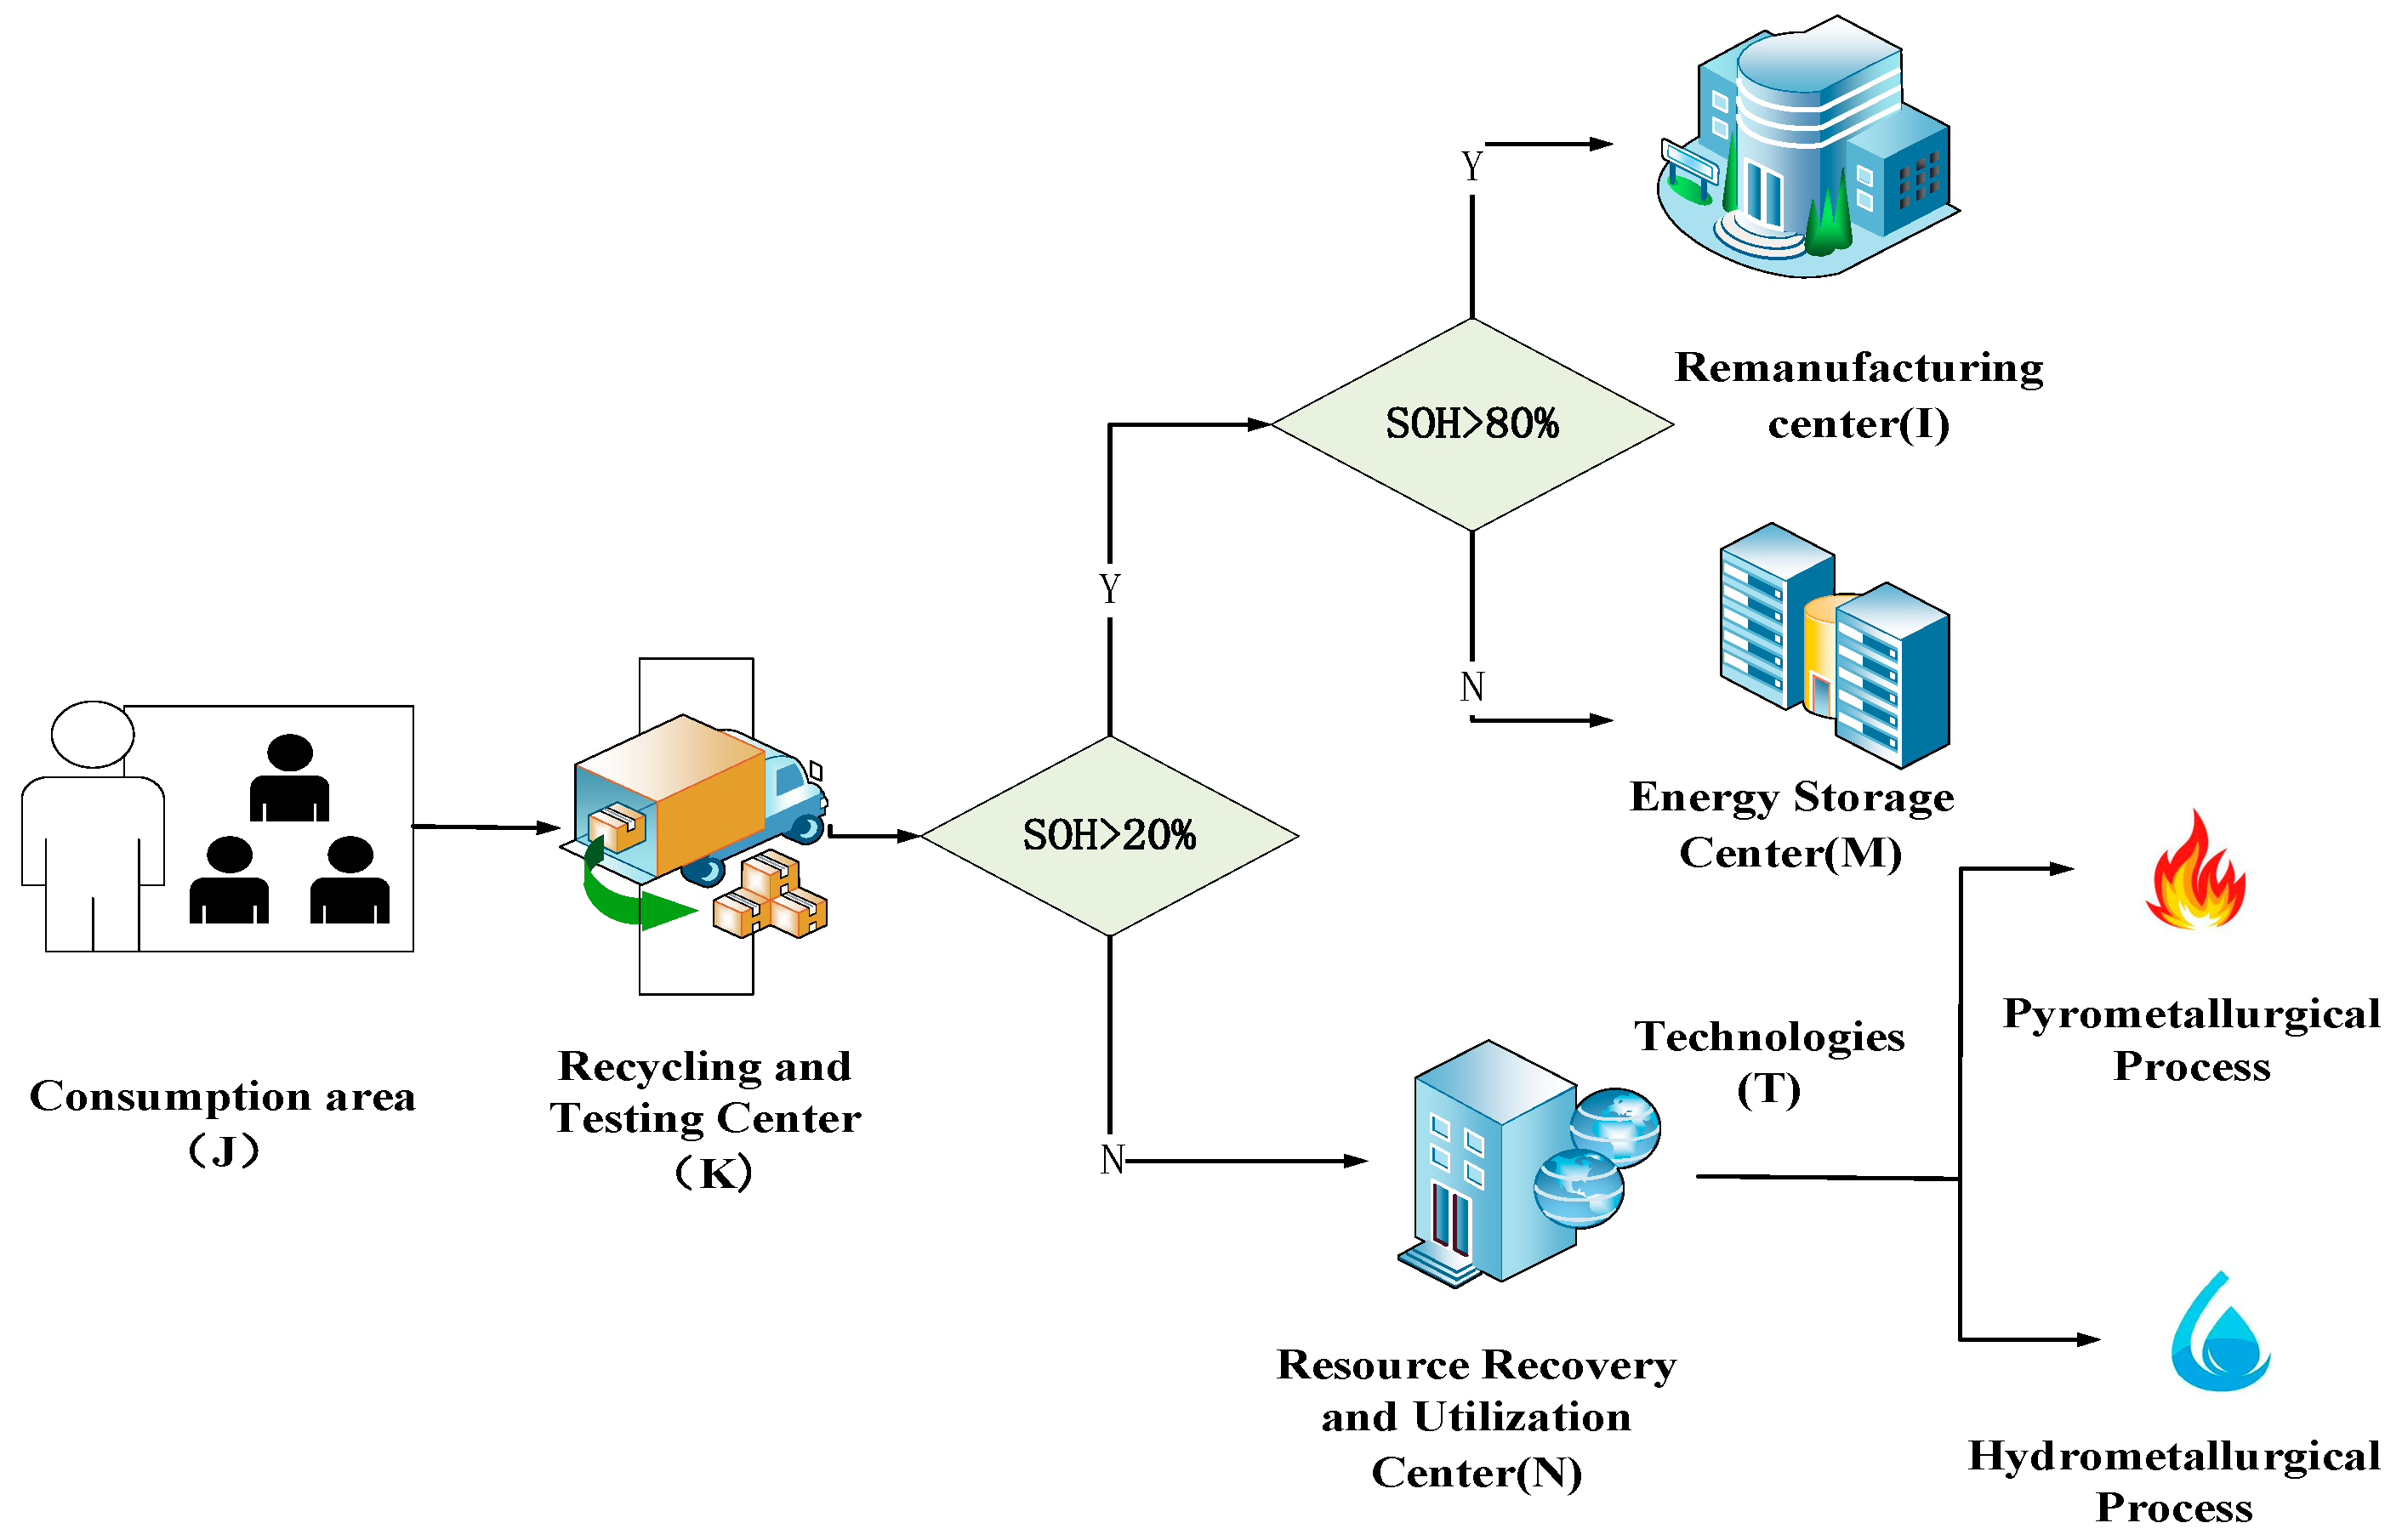
2. Problem Description and Proposed Model

This study proposes a RLN framework for waste electric vehicle batteries, as illustrated in Figure 1. The RLN system integrates multiple logistics facilities, including consumption areas, recycling and testing centers, remanufacturing centers, energy storage centers, and resource recovery and utilization centers. The operational process initiates with the collection of waste electric batteries from consumption areas at predetermined recycling rates, followed by a series of recycling at testing centers, including disassembly, performance evaluation, and classification. Based on the state of health (SOH) assessment, batteries are then routed to appropriate facilities through differentiated pathways: (1) cascade utilization involving either remanufacturing centers (for batteries with SOH > 80%) or energy storage centers (for those with 20% ≤ SOH ≤ 80%), and (2) material recovery through pyrometallurgical or hydrometallurgical processes at resource recovery and utilization centers (for batteries with SOH < 20%) to extract valuable metals for new battery production. The study focuses on two predominant batteries—lithium iron phosphate (LFP) and nickel manganese cobalt (NMC) batteries—with customized treatment strategies: LFP batteries, characterized by longer residual lifespan and lower metal content, are preferentially cascaded, whereas NMC batteries, with higher metal content but shorter cycle life and inferior thermal stability, are primarily directed to material recovery processes.

2.1. Assumptions

The main assumptions considered in the proposed model are as follows:
(1)
The candidate locations and capacities of each facility are known.
(2)
There is only a single mode of transportation.
(3)
Facility capacities of all potential facilities are limited and known in advance.
(4)
The transportation costs at each stage are related to the type of electric vehicle batteries being transported, the transportation cost, and the quantity of transportation.
(5)
The alternative locations and capacities of the recycling and testing center, remanufacturing center, energy storage center, and resource recovery and utilization center are known.
(6)
The recovery rate of waste electric vehicle batteries at the recycling and testing center is correlated with subsidies. Based on practical experience, a higher subsidy leads to a higher recovery rate. Drawing inspiration from reference [38], the recovery rate is set as shown in Equation (1) and ε j represents the recovery rate for the consumption area; ε 0 denotes the base recovery rate; and δ is the subsidy coefficient.
ε j = ε 0 1 + δ

2.2. Notations

The sets, parameters, and variables configured for the model in this study are presented in Table A1 of Appendix A.

2.3. Model Construction

With the objective of minimizing the total recycling cost and carbon emission control amount in the RLN, a fuzzy multi-objective programming model is constructed as follows:
Objective Function:
min F 1 = F C + T C + O C + P C + P P
F C = k F k X k + l F l X l + m F m X m + n t F n t X n t
T C = j k e C j k Q j k e + k l e C k l Q k l e + k m e C k m Q k m e + k n t e C k n t Q k n t e
O C = j k e O k e Q j k e + k l e O l e Q k l e + k m e O m e Q k m e + k n t e O n t e Q k n t e
R C = j k e P e × Q j k e j k e P e Q j k e δ
Equation (2) represents the minimization of total cost, which consists of fixed construction cost (FC), transportation cost (TC), operation cost (OC), and recycling cost (RC). Of these, FC is the sum of the construction costs of fixed facilities of the RTC, RC, ESC, and RRUC. TC is the sum of transportation costs between each level in the RLN. OC is the sum of operation and processing costs of the RTC, RC, ESC, and RRUC. RC is the recycling cost of waste electric vehicle batteries at the RTC.
min F 2 = θ × B C E + T C E + O C E C A P
B C E = k R k X k + l R l X l + m R m X m + n t R n t X n t
T C E = j k e E j k Q j k e + k l e E k l Q k l e +   k m e E k m Q k m e + k n t e E k n t Q k n t e
O C E = j k e S k e Q j k e + k l e S l e Q k l e +   k m e S m e Q k m e + k n t e S n t e Q k n t e
Equation (7) represents the minimization of the controlled quantity of carbon emissions, which consists of the carbon emissions from fixed facility construction (BCE), transportation carbon emissions (TCE), and operational carbon emissions (OCE). Of these, BCE is the sum of carbon emissions from the fixed construction of RTC, RC, ESC, and RRUC. TCE is the total carbon emissions from transportation between each level in the RLN. OCE is the sum of carbon emissions from the operation and processing of RTC, RC, ESC, and RRUC.
Constraints:
s.t.
k Q j k e = Q ˜ j e ε j , j , e
j Q j k e = l Q k l e + m Q k m e + n t Q k n t e , k , e
Q k e = l Q k l e + m Q k m e , k , e
Q k e = j Q j k e × b ˜ e , k , e  
l Q k l e = Q k e × c ˜ e , k , e
t X n t 1 , n
j e Q j k e H K X K , k  
k e Q k l e H l X l , l
k e Q k m e H m X m , m
k e Q k n t e H n t X n t , n , t
Q j k e , Q k l e , Q k m e , Q k n t e , Q k e 0  
X k , X l , X m , X n t 0 , 1 , k , l , m , n , t  
Equation (11) represents the product of the quantity of electric vehicle batteries generated by CAs multiplied by the recycling rate, which equals the quantity of waste electric vehicle batteries recycled by RTCs. Equation (12) signifies the flow balance before and after RTCs. Equation (13) indicates the number of electric vehicle batteries received by cascading utilization enterprises from RTCs. Equation (14) delineates the relationship between the number of batteries that can be utilized in a cascading manner and the recycling quantity at RTCs. Equation (15) illustrates the relationship between the quantity of remanufactured batteries and the number of batteries available for cascading utilization. Equation (16) states that each RRUC can select at most one recycling technology. Equations (17)–(20) represent the maximum processing capacity constraints of RTCs, RCs, ESCs, and RRUCs, respectively. Equations (21) and (22) define the value ranges of the variables.

2.4. The Solution of the Model

2.4.1. The Equivalent Auxiliary Crisp Model

The aforementioned model contains some uncertain parameters, and to proceed with further solutions and computation, it needs to be transformed into a deterministic equivalent form. Assuming η ˜ = η 1 , η 2 , η 3 is a triangular fuzzy number, and η 1 η 2 η 3 , with a confidence level of α , based on fuzzy theory [39,40], the model is transformed into the corresponding deterministic form as follows:
The objective function and the constraints that do not contain fuzzy numbers remain unchanged. Constraints (11), (14), and (15) can be transformed into the following forms, respectively:
α 2 Q j e 3 + Q j e 2 2 + 1 α 2 Q j e 1 + Q j e 2 2 × ε j k Q j k e , j , e  
1 α 2 Q j e 3 + Q j e 2 2 + α 2 Q j e 1 + Q j e 2 2 × ε j k Q j k e , j , e  
α 2 b e 3 + b e 2 2 + 1 α 2 b e 1 + b e 2 2 × j Q j k e Q k e , k , e
1 α 2 b e 3 + b e 2 2 + α 2 b e 1 + b e 2 2 × j Q j k e Q k e , k , e  
α 2 c e 3 + c e 2 2 + 1 α 2 c e 1 + c e 2 2 × Q k e l Q k l e , k , e
1 α 2 c e 3 + c e 2 2 + α 2 c e 1 + c e 2 2 × Q k e l Q k l e , k , e  

2.4.2. The Proposed Method

The two objectives in the model conflict with each other and differ significantly in units and numerical values. The article addresses this by transforming them in the following manner:
Step 1: For a given value of confidence level, calculate the optimal lower bound value α L B S and the optimal upper bound value α U B S of the two objectives.
(1) For the objective functions F 1 and F 2 , calculate their respective single-objective models to obtain the α optimal upper bound solution and its objective function value, denoted as x 1 α U B S , F 1 α U B S and x 2 α U B S , F 2 α U B S .
(2) The lower bound objective function values for F 1 and F 2 are calculated using the following formula:
F 1 α L B S = F 1 x 2 α U B S , F 2 α L B S = F 2 x 1 α U B S
Step 2: Normalization: Convert the cost and controlled quantity of carbon emissions objectives into values within the [0, 1] interval to eliminate the interference of dimensions and orders of magnitude. The transformation formulas are as follows:
F 1 = F 1 F 1 α L B S F 1 α U B S F 1 α L B S
F 2 = F 2 F 2 α L B S F 2 α U B S F 2 α L B S
Step 3: Assign different weights to the two objectives, where β 0 β 1 and 1 β are the weight coefficients for the objective functions F 1 and F 2 , respectively. Transform the multi-objective into the following single objective:
min F 3 = β F 1 + 1 β F 2

3. Case Study

As an archetypal inland megacity, Zhengzhou exemplifies both industrial transformation pressures (with traditional automotive production still accounting for 58% of total capacity) and emerging industry development demands. Its RLN construction experience offers transferable insights for 75 new energy vehicle (NEV) promotion cities in China (63% classified as second-tier or below), serving as a strategic reference framework for nationwide adoption. Compared to first-tier cities like Beijing and Shanghai, Zhengzhou’s operational context more authentically captures prevalent implementation barriers such as supply chain integration complexities and infrastructure modernization expenditures, thereby establishing a generalizable analytical framework with strategic reference value for regional industrial transitions. The city demonstrates multiple distinctive advantages. At the industrial level, Zhengzhou stands out as a significant automobile manufacturing base, with companies like Yutong Bus producing considerable volumes of new energy vehicles. Furthermore, the vicinity is clustered with battery manufacturing enterprises such as Duofuduo, providing abundant sources for reverse logistics and establishing a solid foundation for a comprehensive industry chain. From a geographical perspective, Zhengzhou, as a national transportation hub, boasts comprehensive railway, highway, and aviation networks, enabling efficient transportation and extensive coverage, which facilitates optimal resource allocation. The policy environment is favorable, with the local government vigorously supporting the development of new energy vehicles and the circular economy by issuing a series of regulations and policies to guide and regulate the industry. The concentration of new energy vehicle manufacturers (e.g., BYD) in Zhengzhou signals significant scalability potential for reverse logistics operations. The urban industrial ecosystem integrates automotive OEMs (Yutong), battery exchange infrastructure, renewable energy storage systems, and dedicated battery recycling plants, collectively creating an integrated nodal infrastructure critical for RLN implementation. Zhengzhou’s pioneering RLN development for waste electric vehicle batteries provides a replicable demonstration framework for urban circular economy transitions. The data presented in this study are sourced from the “China Statistical Yearbook”, the relevant literature, internet sources, and field research data.

3.1. Input Data

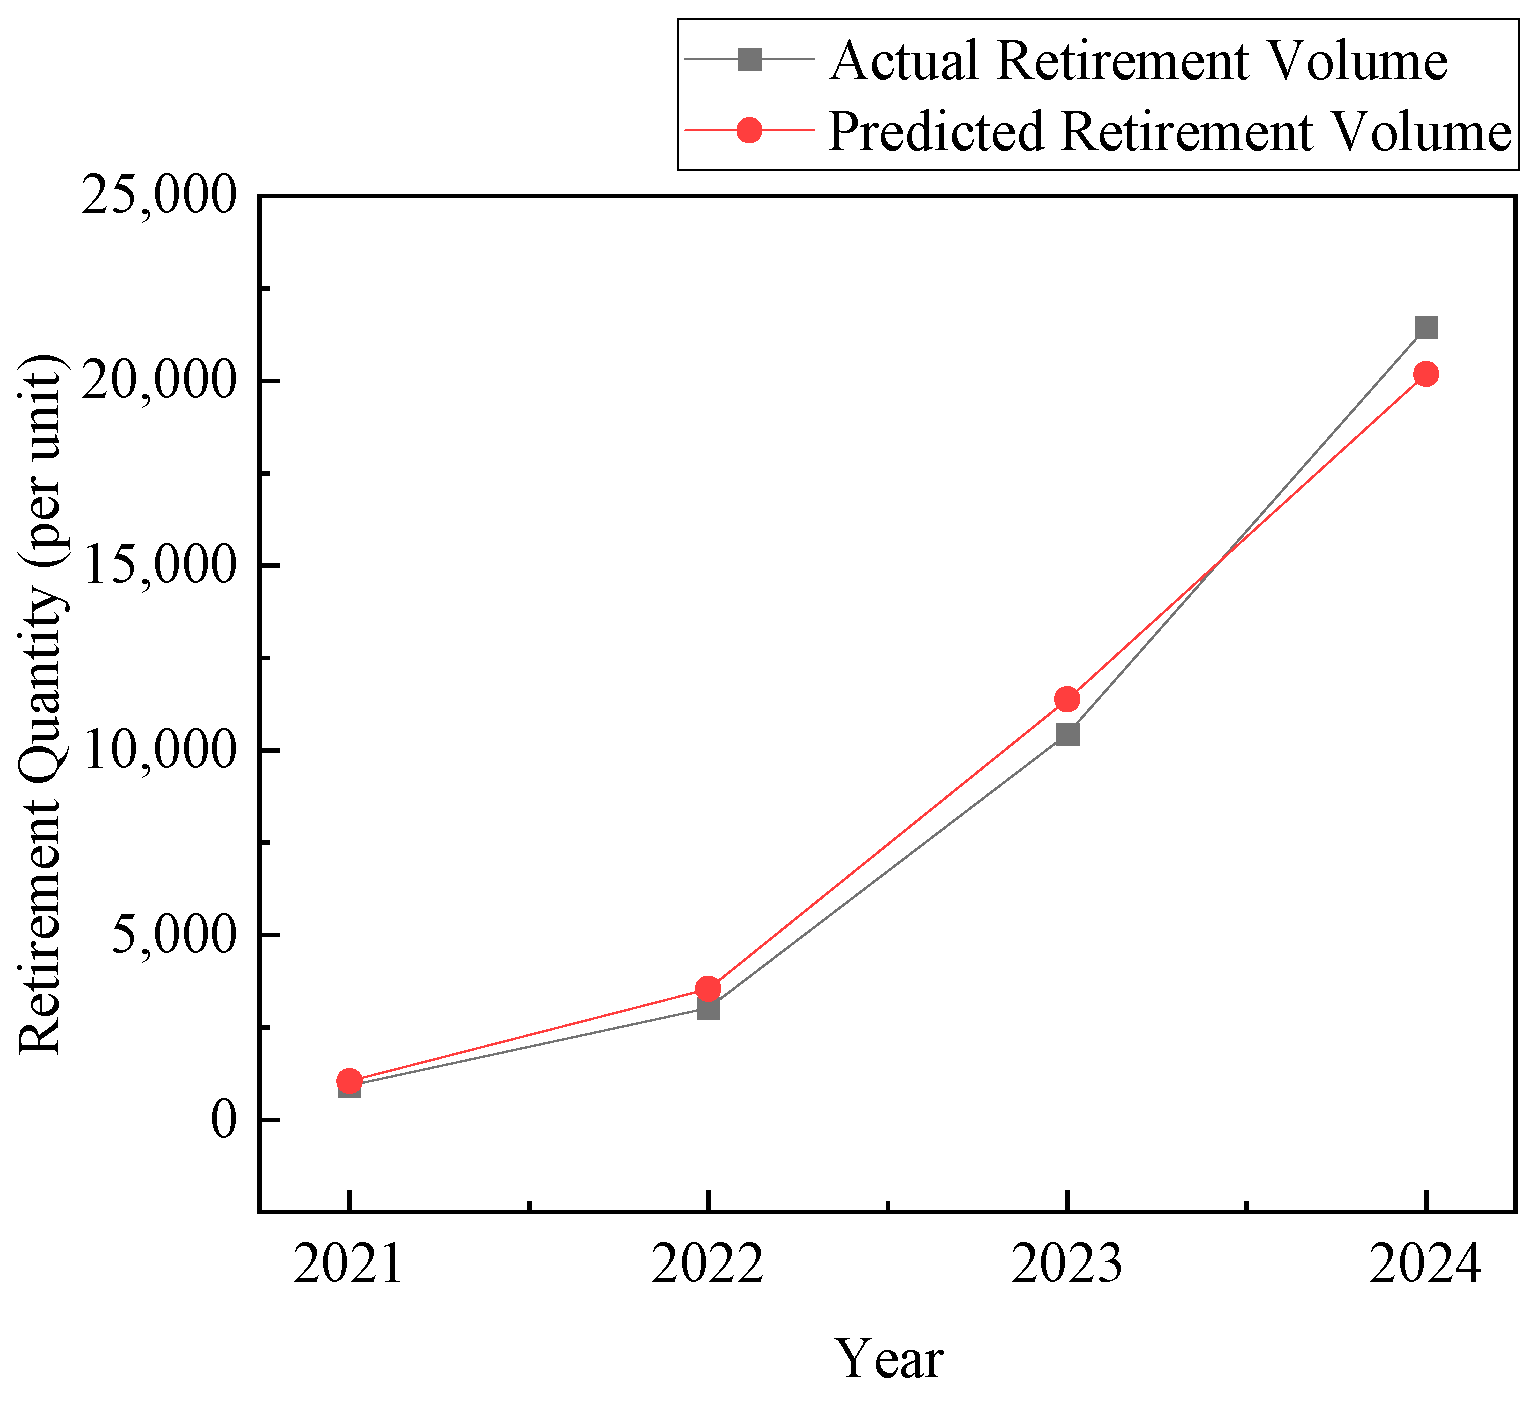
3.1.1. Prediction of Recycling Volume

This study has selected the year 2025 as the target year for assessing the impact of policy implementation. The Stanford estimation model has been utilized to predict the number of waste electric vehicle battery products based on sales volumes, expected service lives, and lifespan distributions of waste electric vehicle batteries. Zhengzhou’s new energy vehicle sales data from 2013 to 2024 was conducted, with complete empirical datasets comprehensively tabulated in Table 4. This study comprehensively referenced national regulations on battery service life, the lifespan standards set by battery designs themselves, and data obtained from field visits to recycling centers to accurately determine the proportion of service lives within each of these years. Through systematic analysis and calculation, the final proportions for the service life distribution over the 5 to 8-year period were determined as 13%, 32%, 33%, and 17%, respectively. Subsequently, based on these established proportions, rigorous calculations were performed to estimate the waste electric vehicle battery quantity in Zhengzhou from 2021 to 2024. The results of these calculations were then meticulously compared with actual data, as illustrated in Figure 2. Comparative analysis revealed that the average relative error between the calculated and actual retired battery quantity was 4.7%, which falls within an acceptable range upon verification. This attests to the high reliability and accuracy of the computational methodology and models employed in this study. Drawing upon these validated research outcomes and analytical conclusions, this study further projects that Zhengzhou City will generate 24,854 units of waste electric vehicle batteries in 2025.
The number of waste electric vehicle batteries in the forecast area is influenced by numerous factors, including economic policies, economic development levels, population density, industrial layout, and consumer’s preferences for electric vehicles, among others [41]. In light of these multiple and complex factors, this article divides the production and sales of electric vehicles into four regions based on geographical location. The number of waste electric vehicle batteries collected in a region is directly proportional to its population [42]. Based on this relationship, predictions are made regarding the recycling volumes of electric vehicle batteries in different regions of Zhengzhou. The estimation of the ratio of LFP battery to NMC battery is derived from the officially published proportions of battery recycling types. The weight of the battery pack in each electric vehicle is assumed to be 250 kg [43]. Considering the inherent uncertainties, the proportional factor for fuzzy variables is set at 10%, leading to predictions for the recycling volumes of the two types of batteries in various consumption regions of Zhengzhou in 2025, represented using triangular fuzzy numbers. The fuzzy numbers for recycling two battery types in each region are shown in Table 5.

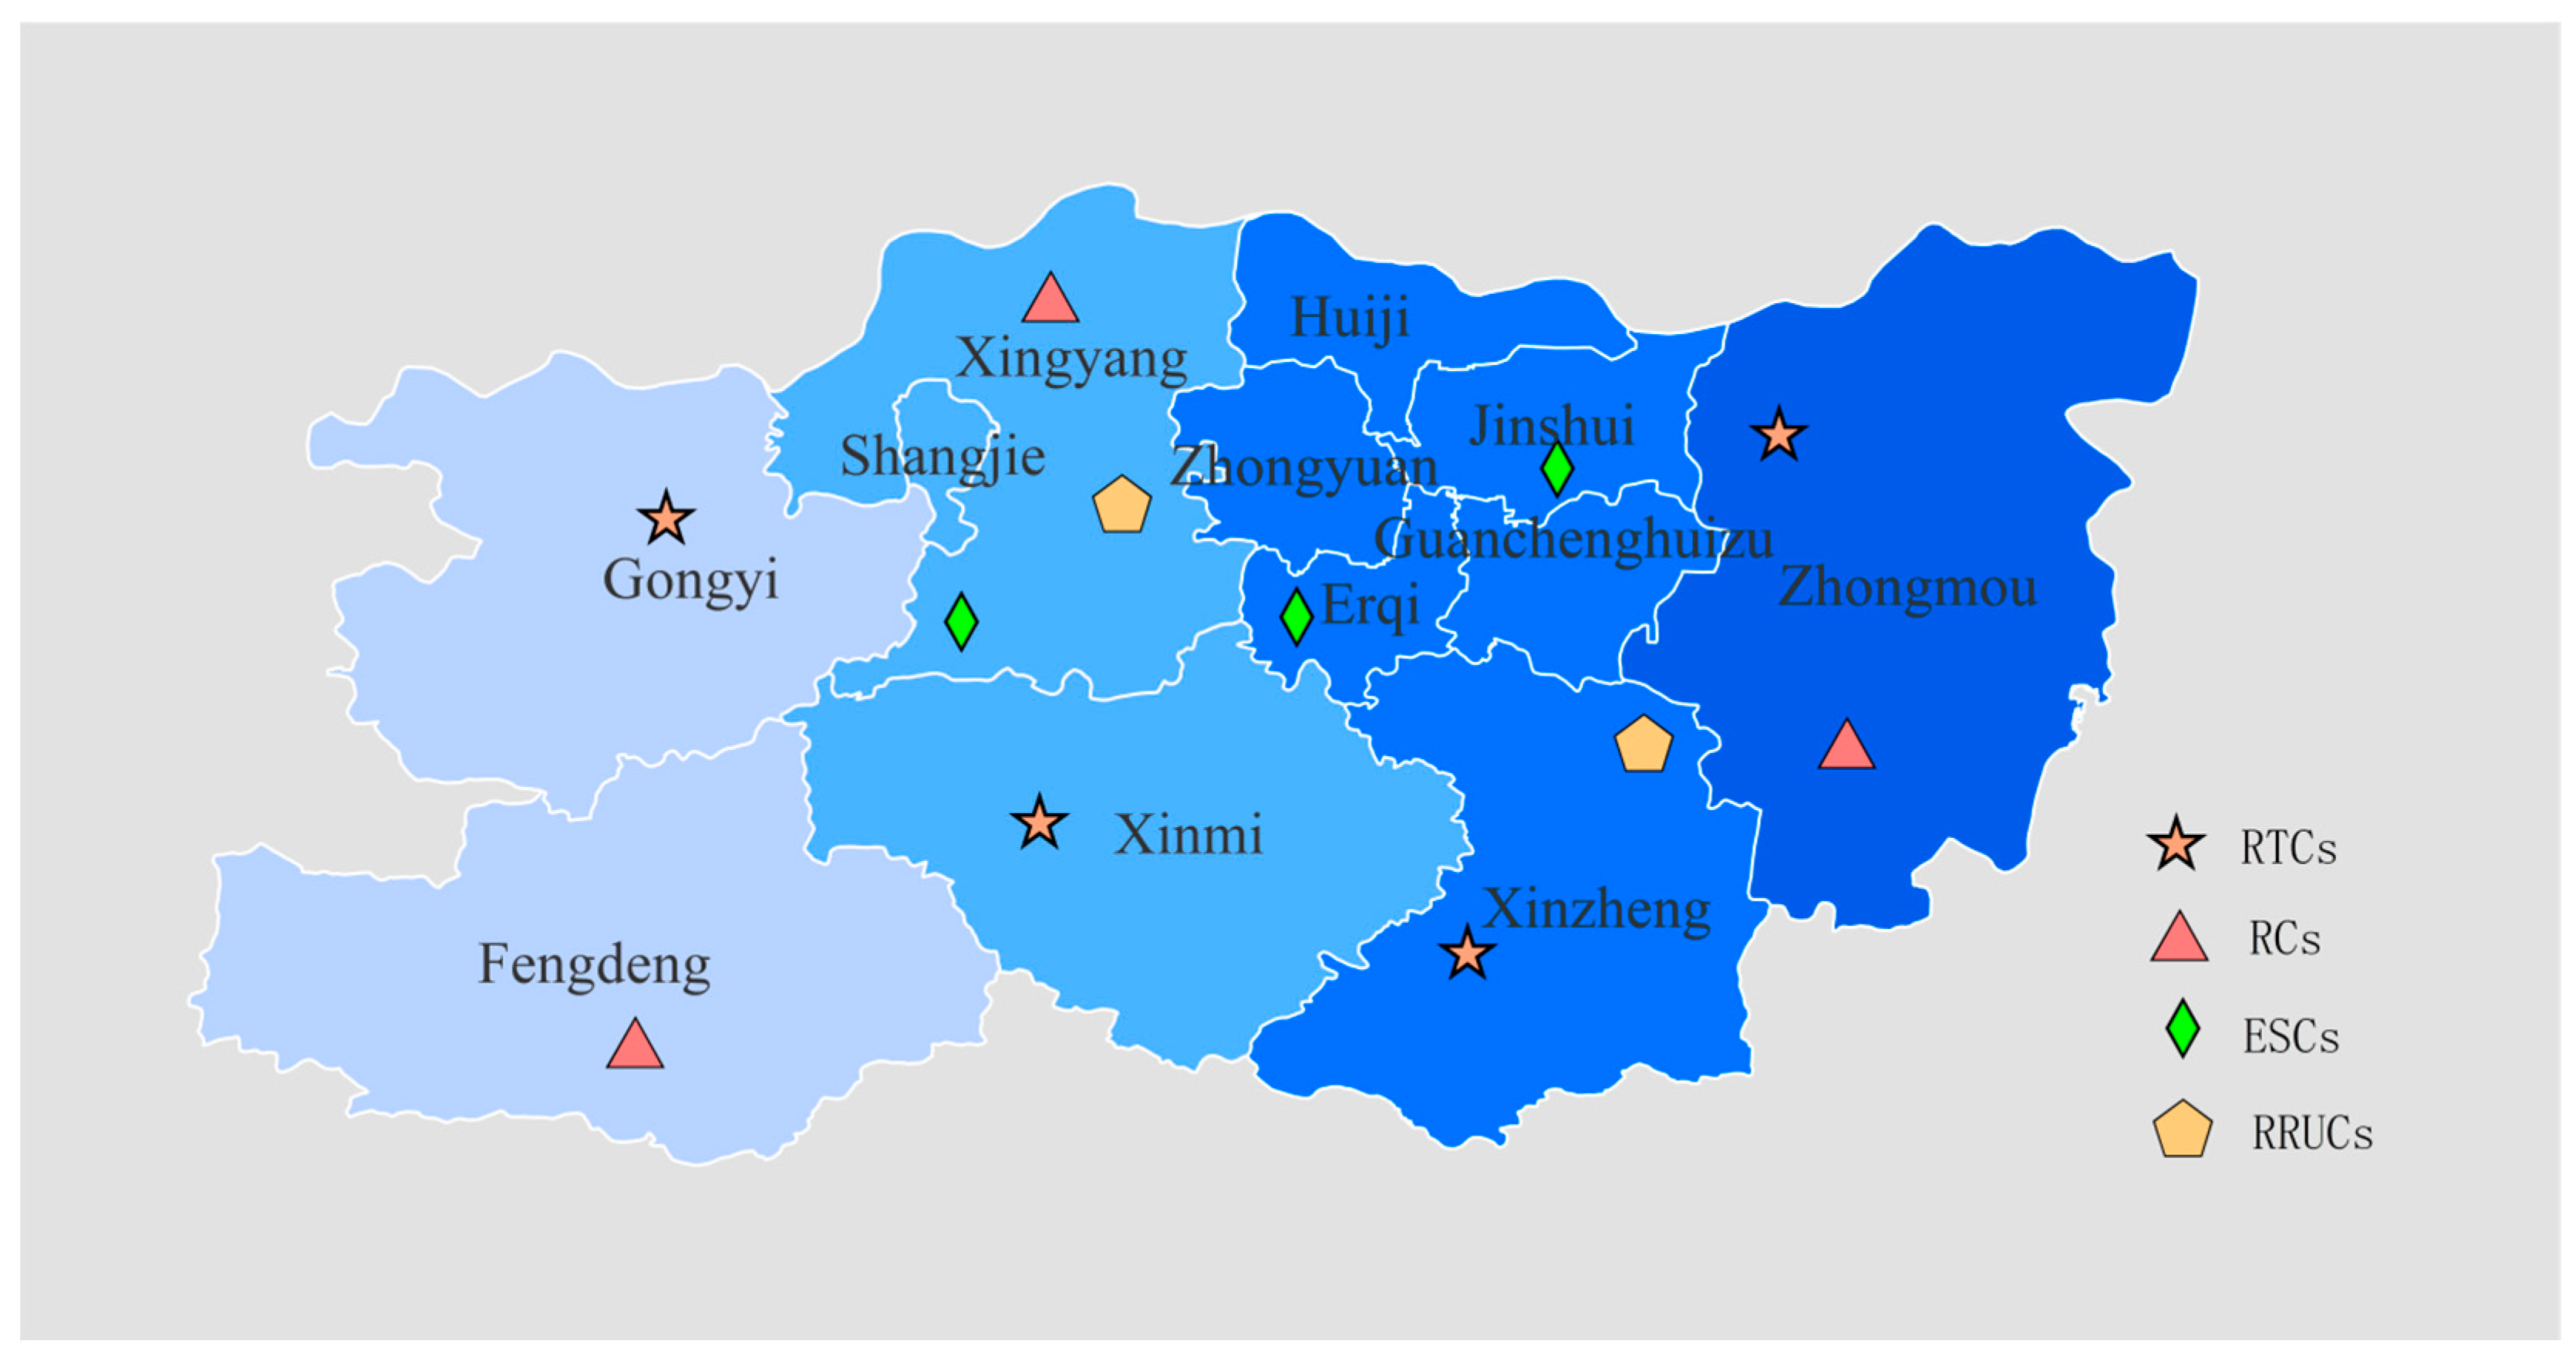
3.1.2. Network Layout and Parameter Settings

A thorough analysis of the contemporary development trends of new energy vehicle brands, including BYD, Geely Automobile, and Lixiang Auto in Zhengzhou, alongside a meticulous examination of the existing infrastructure within this region, has resulted in the delineation of four primary new energy vehicle consumption regions within the Zhengzhou metropolitan area. Considering the intricacies of the battery recycling process, which involves multiple nodes, this study proposes a streamlined approach to enhance research and operational efficiency. Specifically, recycling and processing nodes are uniformly defined as recycling and testing centers. Through systematic screening and evaluation of existing recycling facilities in Zhengzhou, four recycling and testing centers have been established. These centers have demonstrated their effectiveness in addressing the waste electric vehicle battery recycling demands of their respective regions. From an industrial chain integration perspective, each recycling and inspection center is closely linked to multiple critical facilities, including remanufacturing centers, energy storage centers, and resource recovery and utilization centers. The spatial distribution of these facilities is illustrated in Figure 3.
The parameter configurations were established based on empirical data and supported by the relevant literature [17,21]. The recycling prices are estimated based on average values, with waste LFP batteries fetching approximately 8000 yuan/ton and waste NMC batteries approximately 26,000 yuan/ton. The initial value of the subsidy coefficient was set at 0, and the initial value of the penalty coefficient was set at 1. Furthermore, due to the existence of informal recycling channels, the proportion of waste electric vehicle batteries recovered through formal channels was 30% [17], and the base recovery rate was 30%. The weight coefficient β was set to 0.7. Other parameters are presented in Table 6.

3.2. Results Presentation and Sensitivity Analysis

3.2.1. Results

The solution presented in this section was obtained on a Lenovo computer (manufacturer: Lenovo Group, Beijing, China) configured with an 11th Gen Intel© Core© i5-1135G7 @ 2.40 GHz 2.42 GHz processor, procured through authorized channels in Suzhou, China. Parameter settings referenced the previous subsection. Using this optimization model, the total cost amounted to 97,474,200, and the carbon emissions were 721,250.2. Table 7 presents the objective function values and facility location decisions when considering both economic and environmental objectives simultaneously, as well as when considering only a single objective. From the perspective of enterprises, there is a greater propensity towards minimizing costs while overlooking environmental impacts. Consequently, when cost is the sole criterion for decision-making, nodes with reduced construction costs are selected. In terms of recycling technologies, pyrometallurgical recycling is chosen due to its lower costs. Conversely, from the government’s perspective, as the environmental regulator, it is necessary to impose restrictions on carbon dioxide emissions from industrial facilities. In such scenarios, facilities with elevated economic costs but diminished carbon dioxide emissions are selected. Additionally, hydrometallurgical recycling is adopted under these circumstances. In the multi-objective model presented in this study, both economic and environmental factors are duly considered. By incurring marginally higher economic costs, carbon dioxide emissions in the RLN can be more effectively curtailed, thereby balancing both economic and environmental benefits.

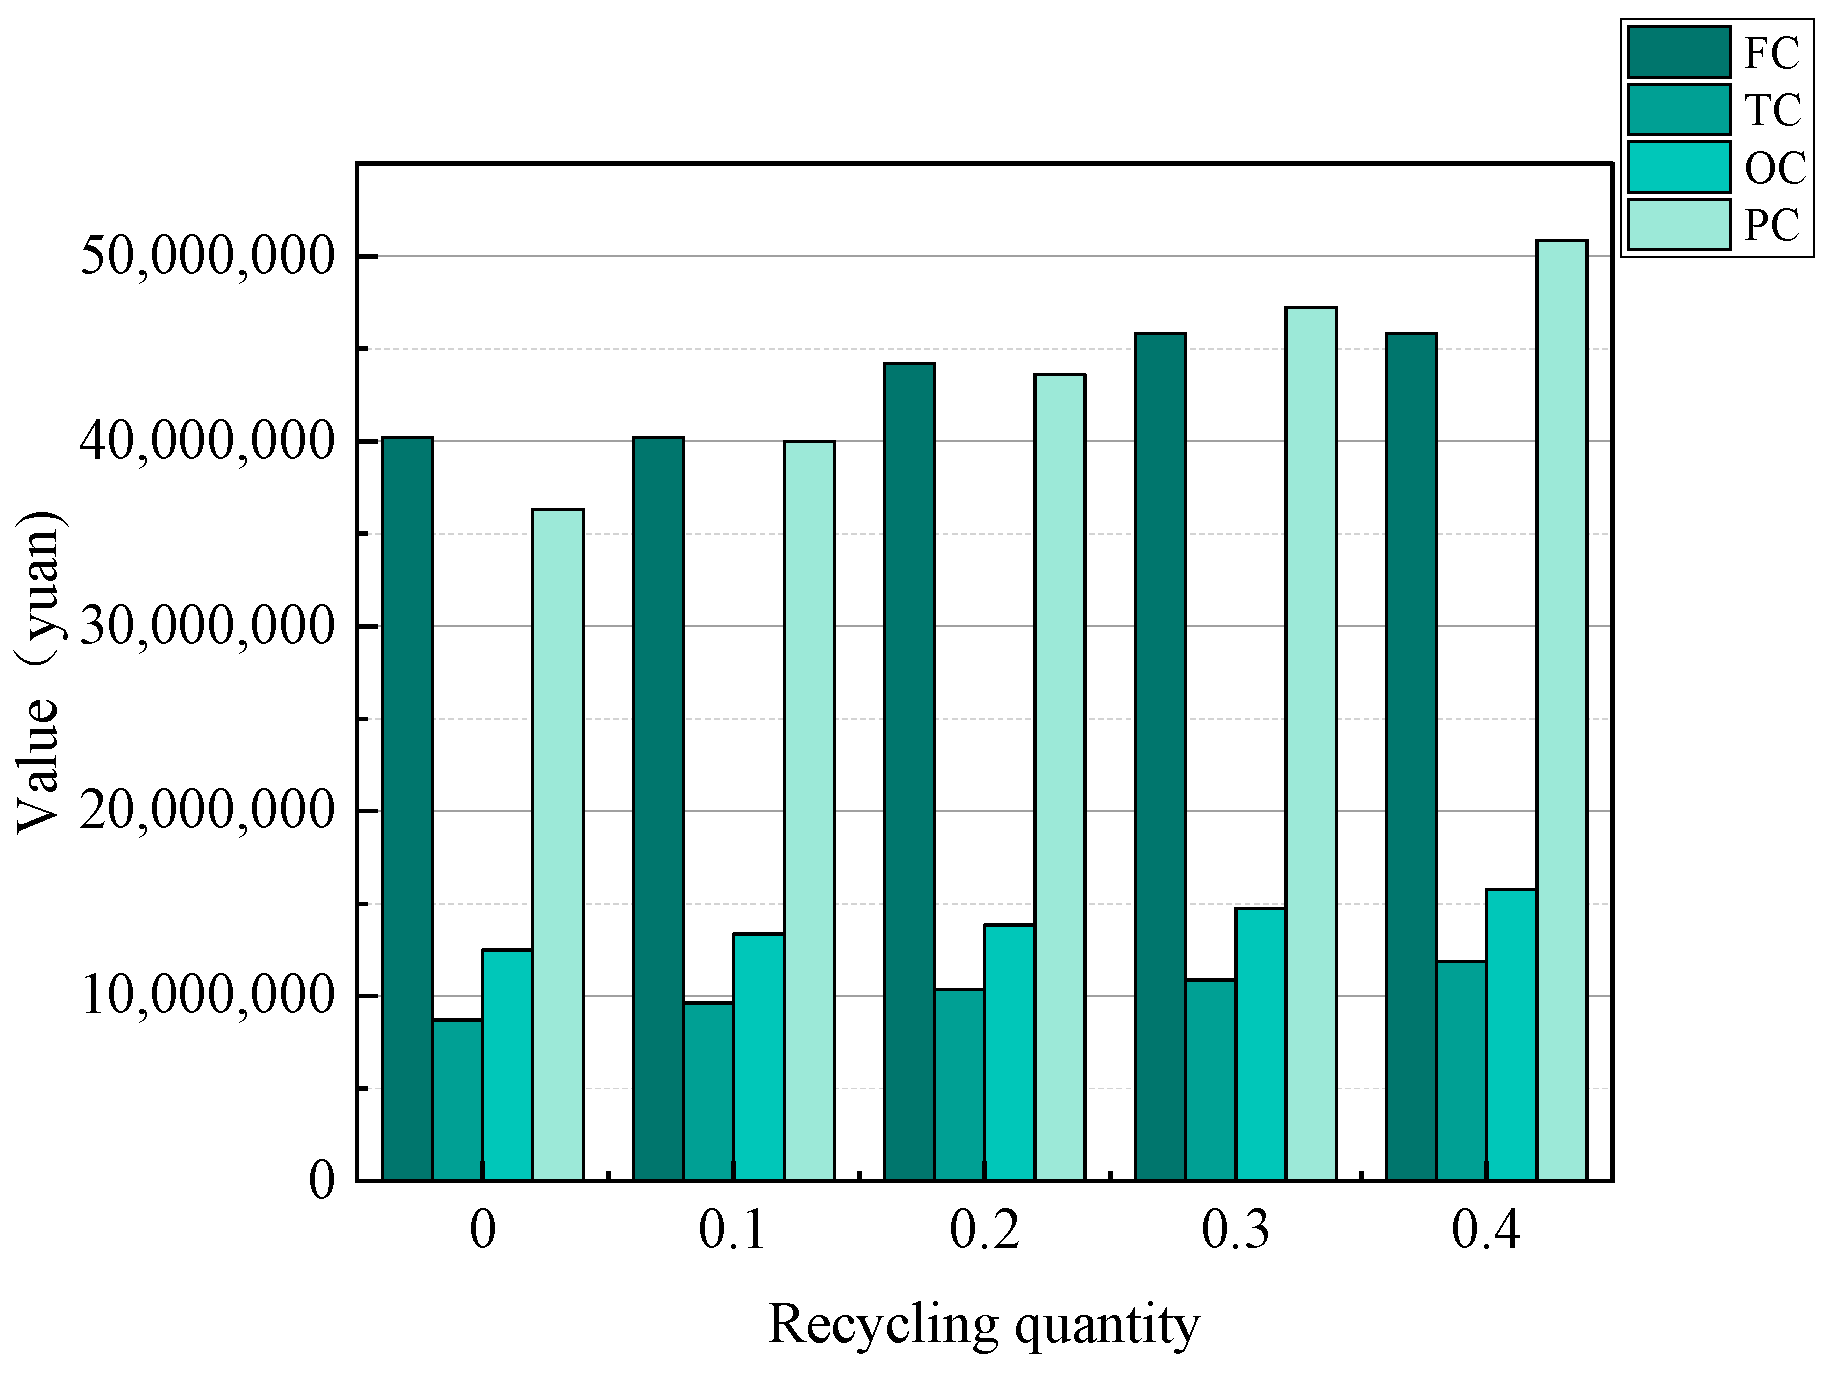
3.2.2. Sensitivity Analysis of Recycling Quantity

Under the guidance of carbon peaking and carbon neutrality policies, new energy vehicles have emerged as a strategic industry that has adapted well to the development of the times. As one of its core components, the large-scale retirement of power batteries under warranty period and lifespan constraints will also lead to an increase in recycling volume. The present study analyzes the impact of recycling quantity on RLN design. To this end, the quantity of waste batteries recycled is varied within the range of [0, +40%]. Costs and facility locations are presented in Figure 4 and Table 8, respectively. An examination of the data reveals a clear correlation between an increase in recycling quantity and an increase in total costs, carbon emissions, and the number of facilities. As recycling quantities are increased, facilities with higher processing capabilities are selected due to the capacity constraints of existing facilities or new facilities are chosen. Consequently, when designing the network, decision-makers must take into account the current status of industry development to make strategic investments in facility models. This strategic approach is expected to enhance resource utilization and reduce waste generation, contributing to environmental sustainability and economic efficiency. As an alternative course of action, when the quantity of recyclables increases, decision-makers may elect to enhance the processing capacity of existing facilities. This course of action involves lower investments when compared to the construction of new facilities.

3.2.3. Sensitivity Analysis of Recycling Quality

In order to analyze the impact of quality on the RLN, the discussion will center on four levels of product quality. In this study, the cascade utilization rate is adjusted within the ±20% range. As demonstrated in Figure 5, the results for various costs are illustrated, while the results for location selection results are presented in Table 9. As the quality of recycling improves, both the total cost and carbon emissions decrease. This is due to the enhancement in product quality, which has led to an increase in the transportation of batteries to cascade utilization facilities. These facilities offer cost and carbon emission advantages over recycling processes. From the perspective of location selection, product quality exerts a significant influence on the selection and number of RCs, ESCs, and RRUCs. Consequently, when formulating a RLN, decision-makers must meticulously assess the quality of waste electric vehicle batteries. The assessment results should then inform the reasonable arrangement of cascade utilization and recycling facilities. Concurrently, advancements in detection technology have the potential to reduce the number of waste electric vehicle batteries that require recycling. This approach serves a multi-objective, simultaneously achieving environmental protection and reducing economic costs.

3.3. Analysis of the Implementation Effect of Policies

In order to analyze the impact of government subsidy and penalty policies on the RLND for waste electric vehicle batteries, three scenarios are established. Scenario 1 examines the influence of subsidy policy on the design of the RLN for waste electric vehicle batteries, consisting of seven sets of experiments, with the first set analyzing the impact in the absence of subsidy policy. Scenario 2 explores the repercussions of implementing a penalty policy on the design of RLN, encompassing a series of seven experiments. The initial experiment assesses the scenario in the absence of a penalty policy. Scenario 3 explores the impact of a combined subsidy–penalty policy on the RLN design, encompassing a total of 49 sets of experiments. The three scenarios comprise a total of sixty-three experiments.

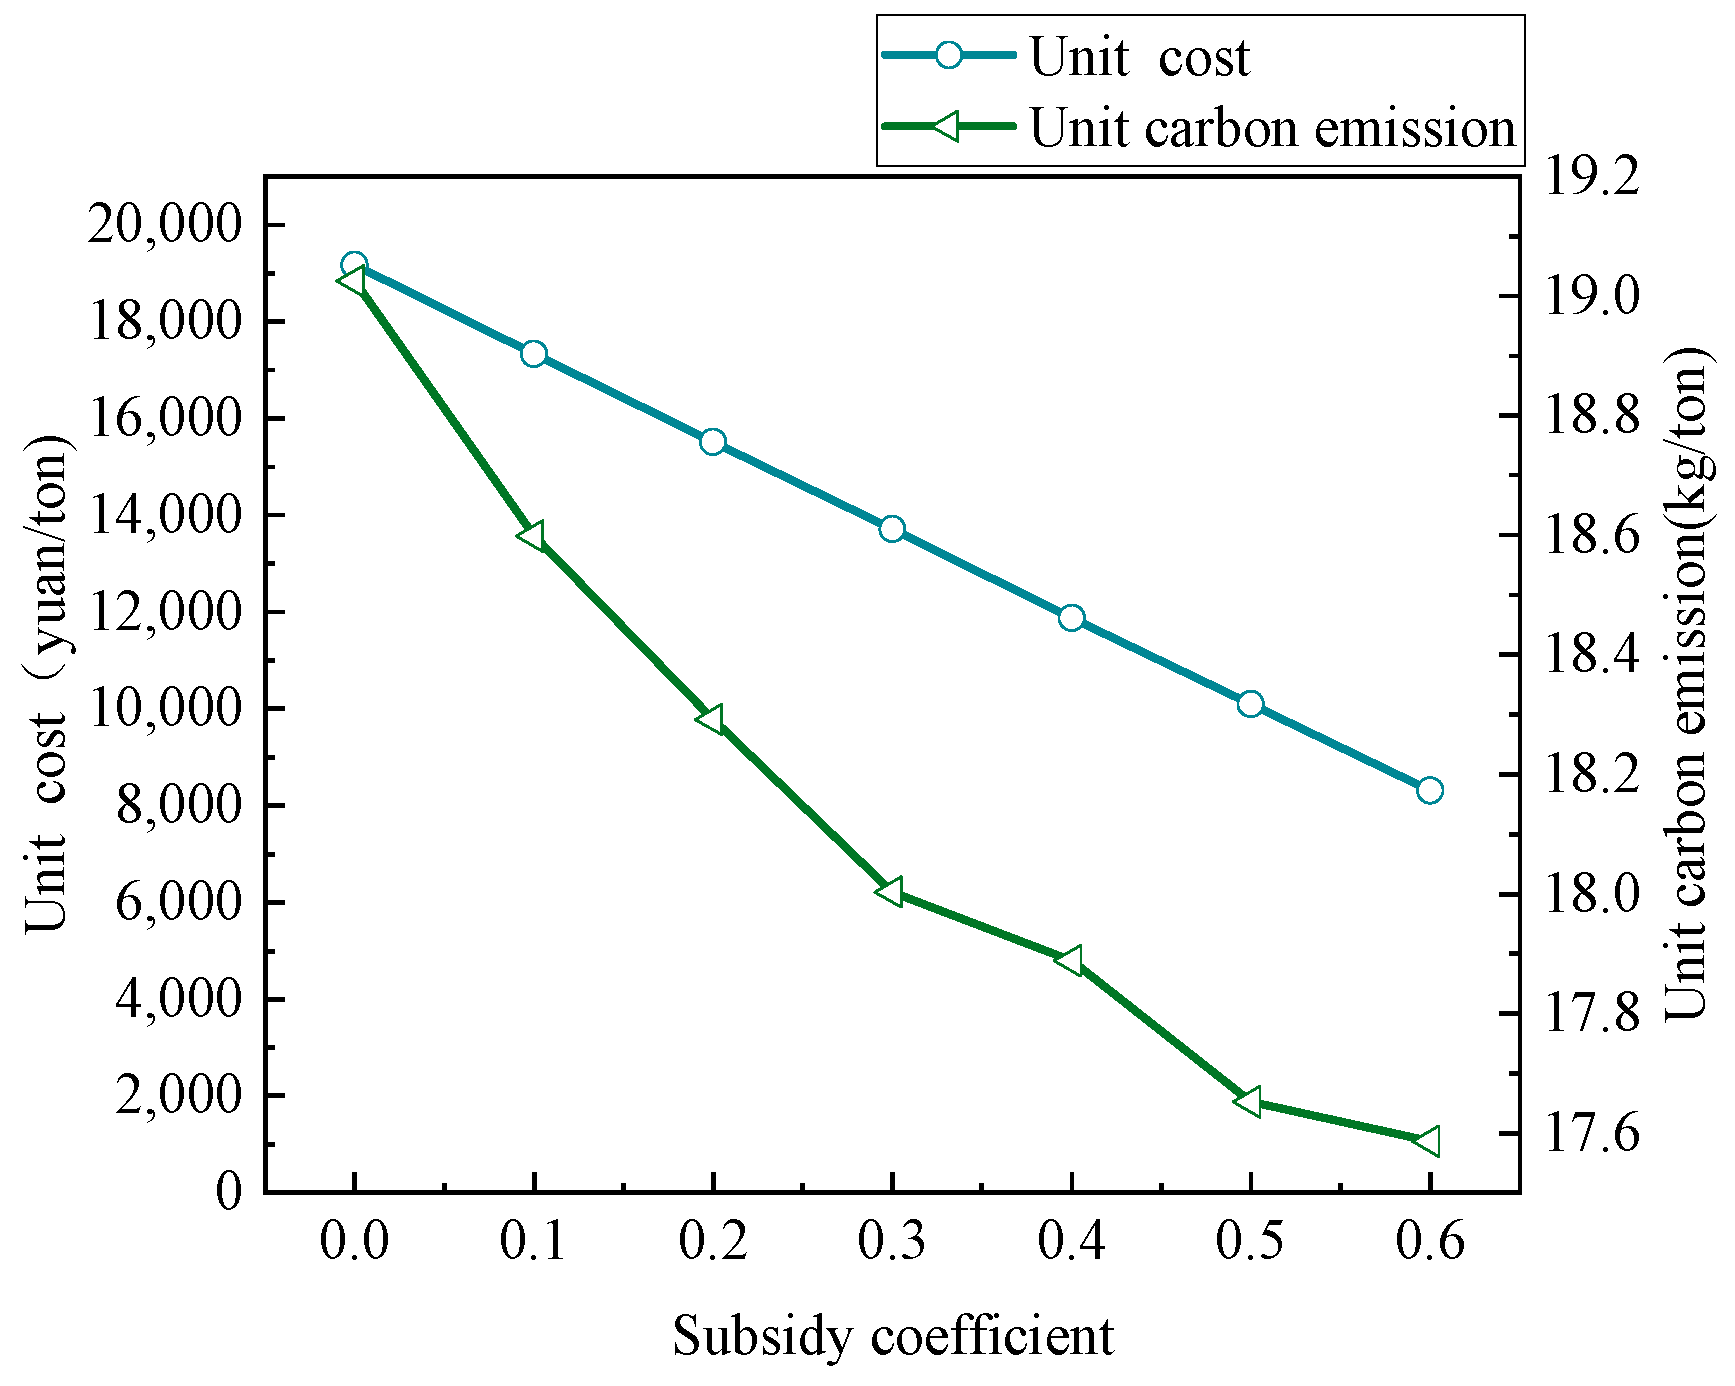
3.3.1. Scenario 1: Analysis of Subsidy Policy (Including the Scenario Without Subsidy Policy)

In order to analyze the role of government subsidy policies in the RLN design for waste electric vehicle batteries, a set of experiments was conducted. The subsidy coefficients were increased from 0 to 0.6 in increments of 0.1, and seven sets of experiments were carried out as a result. When the subsidy coefficient is set to 0, it signifies the absence of government subsidy policies. The experimental results are displayed in Figure 6. The implementation of subsidy policies has been shown to result in a reduction in the unit cost and unit carbon emissions of the electric vehicle battery RLNs when compared to a scenario lacking government subsidy policies. This suggests that government subsidy policies play a role in alleviating economic pressures on recycling enterprises, enhancing their commitment to recycling activities, and contributing to environmental protection. Furthermore, it can be observed that as the subsidy coefficient increases, the unit cost and unit carbon emissions of the electric vehicle battery RLN gradually decrease, while the quantity of recycled batteries significantly increases. When the subsidy coefficient is set at 0.6, the quantity of recycled batteries increases from 1863 tons to 2982 tons. This suggests that increasing subsidy incentives further helps to boost the enthusiasm for recycling work in the RLN and recover more waste electric vehicle batteries. Presently, the recycling rate of electric vehicle batteries in China is only 30%, with approximately 70% of electric vehicle batteries flowing to informal recycling facilities, such as small workshops. Due to limitations in processing technology and other issues, these informal recycling points generate higher carbon emissions. The adoption of subsidy policies has the potential to enhance the competitive advantage of recycling prices for formal enterprises, thereby diverting electric vehicle batteries from small workshops to formal processing enterprises. This will result in a moderate improvement in environmental conditions.

3.3.2. Scenario 2: Analysis of Penalty Policy (Including the Scenario Without Penalty Policy)

In order to analyze the impact of government penalty policies on the RLN design for electric vehicle batteries, a set of experiments was conducted. The penalty coefficients in these experiments ranged from 1 to 13, with an increment of 2. It is important to note that a penalty coefficient of 1 represents the scenario in which government penalty policies are not in effect. The experimental results are illustrated in Figure 7. The implementation of penalty policies has been shown to result in a reduction in unit carbon emissions for electric vehicle battery RLN designs in comparison to scenarios that do not incorporate such government policy measures. However, the unit cost is higher than in the scenario without government penalty policies. This demonstrates that government penalty policies can encourage the transformation of network nodes towards more environmentally friendly practices, help control carbon dioxide emissions, and benefit environmental protection, albeit at the cost of sacrificing some economic interests.

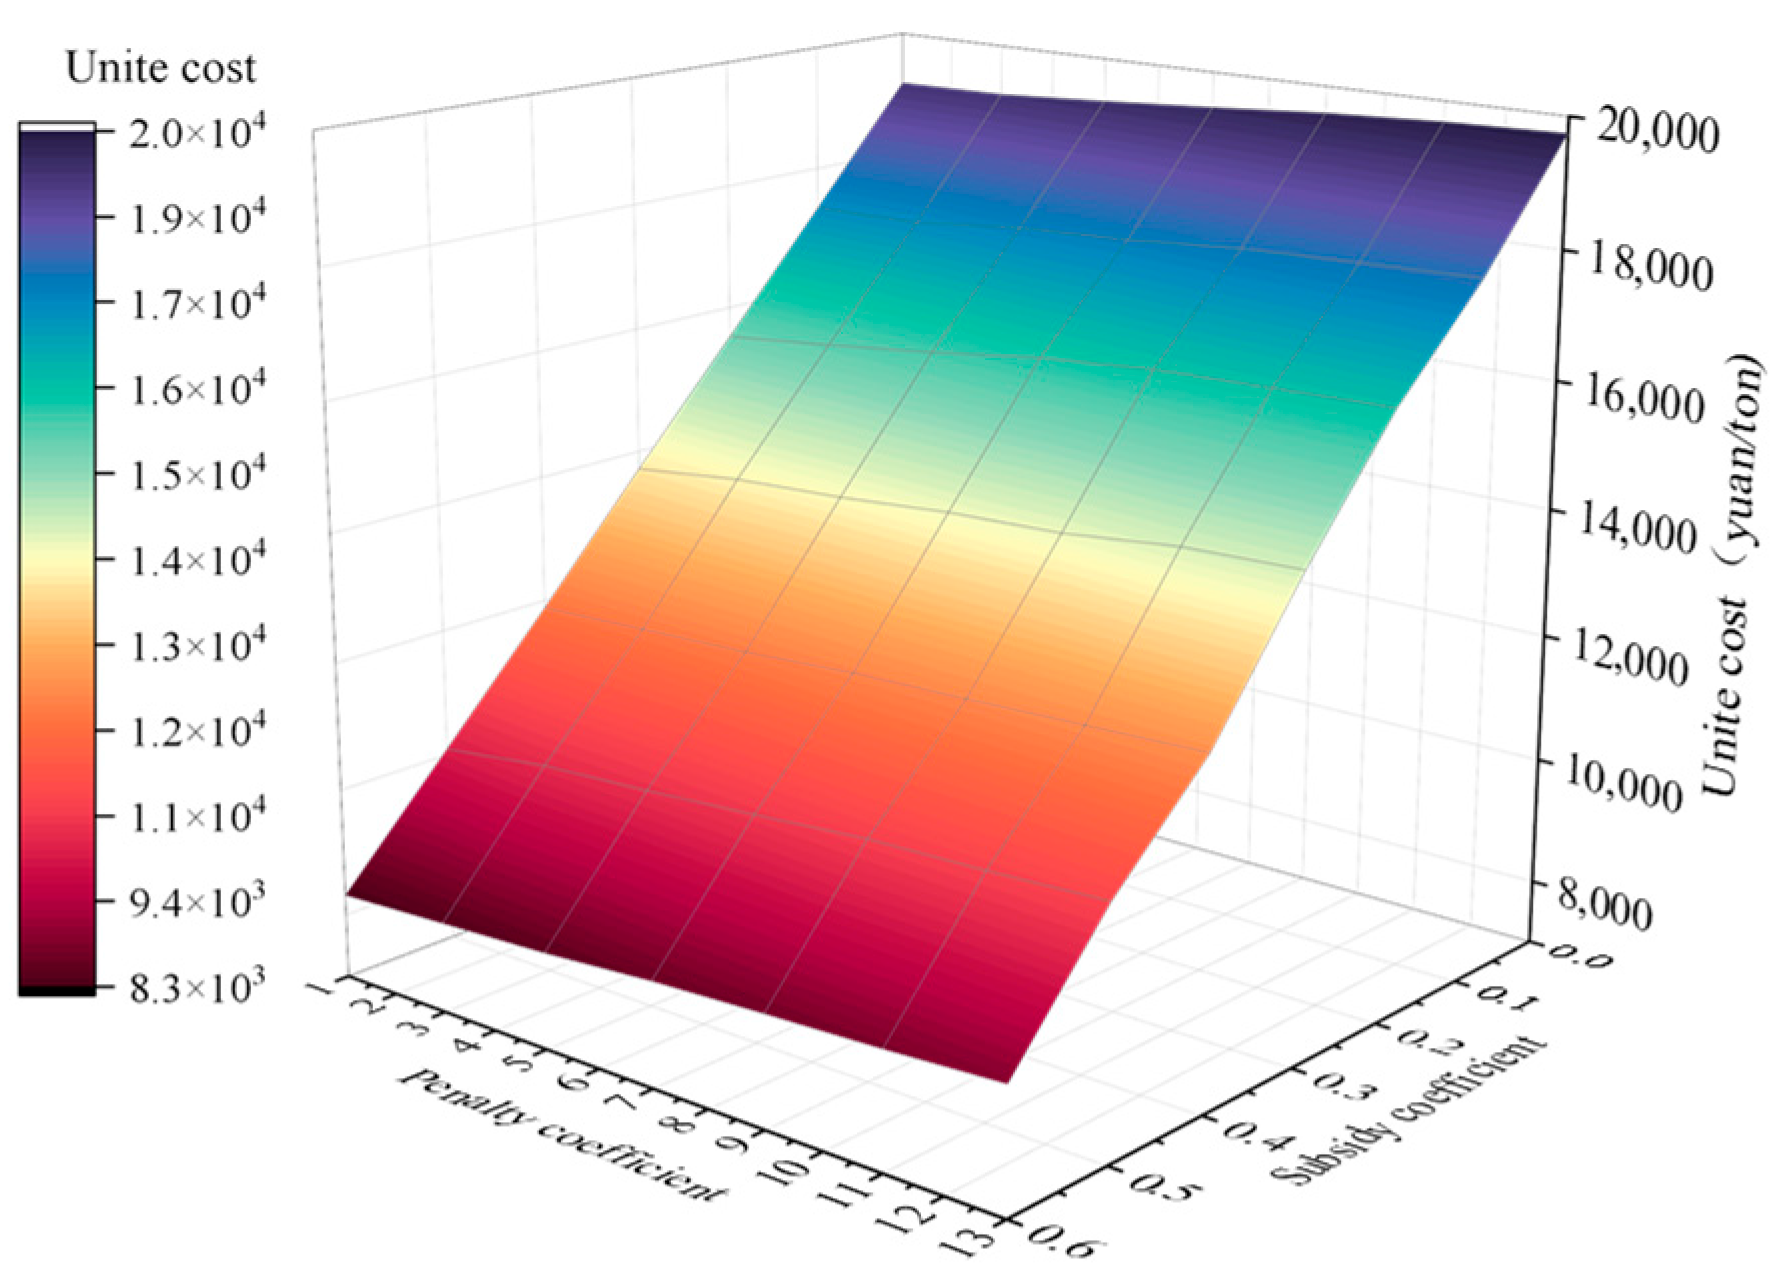
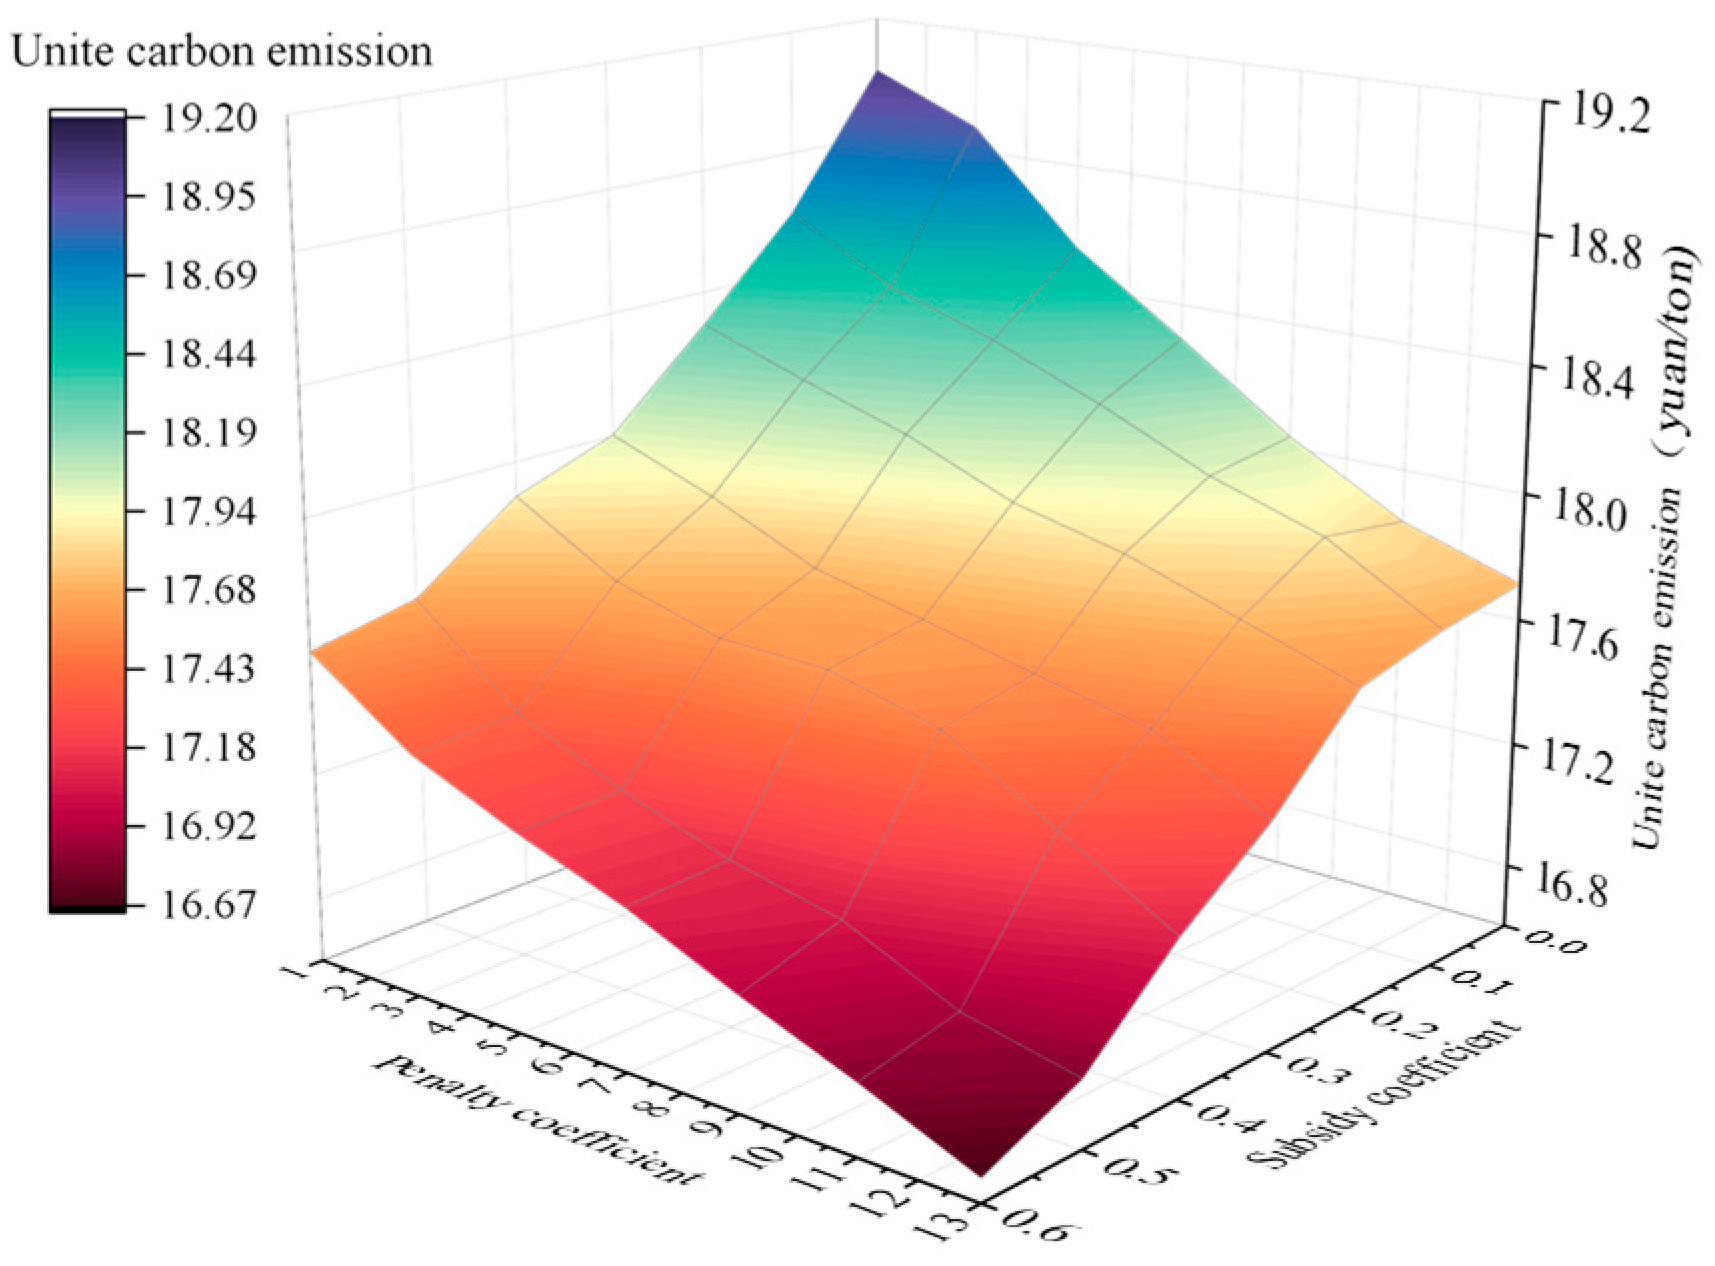
3.3.3. Scenario 3: Analysis of Combined Subsidy–Penalty Policy

In order to analyze the role of the government’s combined subsidy–penalty policy in the RLN design for electric vehicle batteries, 36 sets of experiments were conducted. The subsidy coefficient was increased from 0.1 to 0.6 in increments of 0.1, and the penalty coefficient was increased from 3 to 13 in increments of 2. The alterations in unit cost and unit carbon emissions of the electric vehicle battery RLN after implementing the combined subsidy–penalty policy are illustrated in Figure 8 and Figure 9, respectively. It is evident that, as the intensity of the combined subsidy–penalty policy’s intensity increases, both the unit recycling cost and unit carbon emissions of the electric vehicle battery RLN demonstrate a downward trend. A subsequent examination of the experimental findings reveals that, in contrast to the first set of experiments δ = 0.1 , θ = 3 , the last set of experiments δ = 0.6 , θ = 13 demonstrated a 45.54% increase in recovery volume, a 48.61% reduction in unit recycling cost, and a 5.85% reduction in unit carbon emissions. The findings suggest that the implementation effect of the combined subsidy–penalty policy is significant. The policy can increase the total recovery volume while reducing the unit recycling cost and inhibiting the increase in carbon emissions. This ensures enthusiasm for RLN recycling efforts and balances both economic and environmental benefits.
To facilitate a more detailed comparison and analysis of the implementation effects of the government’s single subsidy policy and the combined subsidy–penalty policy, the subsidy coefficient was set to increase from 0.1 to 0.6 in increments of 0.1, with a penalty coefficient of 7 in the combined subsidy–penalty policy. As illustrated in Figure 10a, a comparison of the unit costs associated with these two policies is provided. In the six experimental sets, the unit costs of the combined subsidy–penalty policy exhibited an increase of 1.73%, 0.96%, 3.35%, 2.19%, 4.37%, and 3.91%, respectively, with an average increase of 3.21%. This finding suggests that the combined subsidy–penalty policy is less effective than the single subsidy policy in terms of unit costs. As illustrated in Figure 10b, a comparison of unit carbon emissions between the two policies is presented. In the six sets of experiments, the unit carbon emissions of the combined subsidy–penalty policy decreased by 3.05%, 2.65%, 2.59%, 2.83%, 3.03%, and 2.52%, respectively, with an average decrease of 2.78%. The findings of this study demonstrate that the combined subsidy–penalty policy is more effective than the single subsidy policy in controlling unit carbon emissions.
To further compare and analyze the implementation effects of the government’s single penalty policy and the combined subsidy–penalty policy, the penalty coefficient was set to increase from 3 to 13 in increments of 2, with a subsidy coefficient of 0.3 in the combined subsidy–penalty policy. As illustrated in Figure 10c, a comparison of the unit costs reveals that there is an average decrease of 27.22% when comparing the two policies. The respective costs are 27.45%, 26.82%, and 26.76%. This finding suggests that the combined subsidy–penalty policy is more effective than the single penalty policy in terms of unit costs. As demonstrated in Figure 10d, a comparison is made between the unit carbon emissions resulting from the implementation of the two policies. In the six sets of experiments, the unit carbon emissions of the combined subsidy–penalty policy decreased by 2.81%, 3.19%, 3.60%, 3.76%, 3.65%, and 3.99%, respectively, with an average decrease of 2.78%. The findings of this study demonstrate that the combined subsidy–penalty policy is also more effective than the single penalty policy in controlling unit carbon emissions.

3.3.4. Comparison of Solution Methods

The deviation index (DI) represents the reasonable state of each solution in relation to its respective ideal and lowest points [44]. Accordingly, the deviation index serves as a criterion for determining the suitability of a particular decision-making technique for addressing a specific optimization problem. A lower value indicates greater suitability. Accordingly, it is essential to ascertain the discrepancy between the outcomes yielded by disparate decision-making techniques and the ideal and lowest points, as illustrated in Equation (33).
D I = j = 1 n f j f j i d e a l 2 j = 1 n f j f j i d e a l 2 + j = 1 n f j f j n o n i d e a l 2
where f j i d e a l , f j n o n i d e a l represents the values of the objective function f j at the ideal and non-ideal points.
As shown in the results presented in Table 10, in each of the 11 experimental groups, except for 2 groups where the deviation indices were the same, the deviation indices of the method proposed in this study were lower than those of the LP-metric method in the remaining groups. It is evident that the solution effect of the method proposed in this study is superior.

4. Conclusions and Suggestions

This study explores the implications of government subsidies and penalties in the design of RLNs for electric vehicle batteries. It analyzes factors such as cascaded utilization characteristics of waste electric vehicle batteries, diverse recycling technologies, multiple battery types, and uncertainties in recovery quantity and quality. This study proposes a RLN for waste electric vehicle batteries and integrates logistics facilities, including consumption areas, recycling and testing centers, remanufacturing centers, energy storage centers, and resource recovery centers. A multi-objective planning model is established to minimize total costs and control carbon emissions. The Stanford estimation method is applied to predict the volume of waste electric vehicle batteries in Zhengzhou in 2025, and the model is validated against the city’s facility node layout. Pursuant to the findings of the experimental results, the subsequent sustainable recommendations are hereby proposed:
  • As demonstrated in Section 3.2.1, the RLN design for electric vehicle batteries should abandon the singular pursuit of cost minimization and instead adopt a multi-objective model balancing cost and environmental factors, thus achieving a balanced approach that considers economic and environmental benefits can facilitate more effective carbon emission reduction with minimal economic impact and promoting sustainable development.
  • The findings presented in Section 3.2.2 and Section 3.2.3 suggest that decision-makers should strategically invest in facilities that align with prevailing industry trends, such as the escalating volume of battery recycling, which is driven by advancements in the new energy vehicle sector. Proactive planning for higher-capacity facilities or reserving expansion space can address growing recycling demands, enhance resource utilization efficiency, and reduce waste. In addition, decision-makers should emphasize the quality assessment of waste electric vehicle batteries and make informed decisions on whether to direct them to cascade utilization facilities or recycling treatment facilities based on evaluation results. Continuous improvement in detection technologies can reduce the number of batteries requiring recycling treatment, thereby lowering total costs and emissions while achieving dual environmental and economic benefits.
  • As demonstrated in Section 3.3.1 and Section 3.3.2, governments should leverage subsidy policies by appropriately increasing financial incentives to alleviate economic pressures on recycling enterprises, enhance their operational enthusiasm, and channel more waste electric vehicle batteries to formal processing channels. This approach has the potential to enhance the overall recycling rates within the industry and to contribute to the improvement of environmental conditions. While the implementation of penalty policies has the potential to promote the development of environmentally friendly network nodes and regulate carbon emissions, it may also result in economic trade-offs. Consequently, governments should strive to balance economic and environmental concerns when implementing penalties, establishing reasonable standards that achieve environmental objectives without imposing corporate burdens.
  • According to Section 3.3.3, it is recommended that governments implement a combination of subsidy and penalty policies to achieve synergistic effects. Despite the potential for short-term increases in unit cost resulting from the implementation of combined subsidy–penalty policies, these strategies have been demonstrated to yield substantial long-term benefits. These benefits include the enhancement of total recycling volumes, the reduction in unit costs, the mitigation of emission growth, the optimization of the balance between economic and environmental benefits, and the promotion of the effective management of reverse logistics for waste electric vehicle batteries.
Future research endeavors could explore forward logistics-integrated closed-loop supply chain network design for power batteries, developing multi-criteria objective functions that holistically integrate economic, social, and environmental dimensions, thereby aligning with sustainable development principles. Furthermore, additional exploration using multi-objective solving methods to identify more efficient solutions is warranted.

Author Contributions

Conceptualization, methodology, validation, visualization, Z.F.; software, conceptualization, validation, formal analysis, writing—original draft preparation, supervision, X.L.; software, conceptualization, validation, formal analysis, Q.G.; resources, project administration, S.L. All authors have read and agreed to the published version of the manuscript.

Funding

This work was partly supported by the grants from the National Social Science Fund (23BGL058), the Postgraduate Education Reform and Quality Improvement Project of Henan Province (YJS2025SZ11), Humanities and Social Sciences Research Fund Project of Henan Polytechnic University (SKZD2025-07), and Philosophy and Social Sciences Innovation Team Support Program of Henan Higher Education Institutions (2024-CXTD-06).

Institutional Review Board Statement

Not applicable.

Informed Consent Statement

Not applicable.

Data Availability Statement

Data will be made available on request.

Acknowledgments

The authors especially thank the Editors and anonymous referees for their kind reviews and helpful comments.

Conflicts of Interest

The authors declare no conflicts of interest.

Appendix A

Table A1. Notations and definitions in this study.
SetsDefinitions
E Index of waste electric vehicle batteries, e ∈ {1, 2, …, E};
J Index of consumption area (CA), j ∈ {1, 2, …, J};
KIndex of recycling and testing center (RTC), k ∈ {1, 2, …, K};
L Index of remanufacturing center (RC), l ∈ {1, 2, …, L};
M Index of energy storage center (ESC), m ∈ {1, 2, …, M};
N Index of resource recovery and utilization center (RRUC), n ∈ {1, 2, …, N};
T Index of technology used in the resource recovery and utilization center, t ∈ {1, 2, …, T}
ParametersDefinitions
F k Fixed construction cost of the RTC;
F l Fixed construction cost of RC;
F m Fixed construction cost of ESC;
F n t Fixed construction cost of RRUC with t-technology;
O k e Operating cost per unit e-kind of waste electric vehicle battery at the RTC;
O l e Operating cost per unit e-kind of waste electric vehicle battery at the RC;
O m e Operating cost per unit e-kind of waste electric vehicle battery at the ESC;
O n t e Operating cost per unit e-kind of waste electric vehicle battery at the RRUC with t-technology;
H k Maximum processing capacity of the RTC;
H l Maximum processing capacity of the RC;
H m Maximum processing capacity of the ESC;
H n t Maximum processing capacity of the RRUC n with t-technology;
R k Carbon emission from building a RTC;
R l Carbon emission from building a RC;
R m Carbon emission from building an ESC;
R n t Carbon emission from building a RRUC n with t-technology;
S k e Carbon emissions from processing unit e-kind of waste electric vehicle battery in RTC;
S l e Carbon emissions from processing unit e-kind of waste electric vehicle battery in RC;
S m e Carbon emissions from processing unit e-kind of waste electric vehicle battery in ESC;
S n t e Carbon emissions from processing unit e-kind of waste electric vehicle battery in RRUCs with t-technology;
C j k Transportation cost per unit e-kind of waste electric vehicle battery from consumption area j to RTC;
C k l Transportation cost per unit e-kind of waste electric vehicle battery from RTC k to RC;
C k m Transportation cost per unit e-kind of waste electric vehicle battery from RTC k to ESC;
C k n t Transportation cost per unit e-kind of waste electric vehicle battery from RTC k to RRUC n with t-technology;
E j k Carbon emissions during the transportation of per unit e-kind of waste electric vehicle battery from the consumption area j to the RTC k ;
E k l Carbon emissions during the transportation of per unit e-kind of waste electric vehicle battery from the RTC k to the RC;
E k m Carbon emissions during the transportation of per unit e-kind of waste electric vehicle battery from the RTC k to the ESC;
E k n t Carbon emissions during the transportation of per unit e-kind of waste electric vehicle battery from RTC k to RRUC n with t-technology;
Q ˜ j e Number of waste electric vehicle batteries generated by consumption area;
P e Recycling price per unit e-kind of waste electric vehicle batteries at the RTC;
b ˜ e Proportion of e-kind of waste electric vehicle batteries used for cascade utilization;
c ˜ e Proportion of the number of e-kind of waste electric vehicle batteries to RCs l to the number of e-kind of waste electric vehicle batteries for cascade utilization;
C A P The carbon emissions allowed by the government for companies to generate, i.e., the rated carbon emission allowance;
θ The penalty coefficient set by the government for exceeding the rated carbon emissions.
VariablesDefinitions
X k Binary variable equal to 1 if the RTC k is opened, and 0 otherwise;
X l Binary variable equal to 1 if the RC l is opened, and 0 otherwise;
X m Binary variable equal to 1 if the ESC m is opened, and 0 otherwise;
X n t Binary variable equal to 1 if RRUC n with t-technology is opened, and 0 otherwise;
Q j k e Integer variable indicating the number of e-kind of waste electric vehicle batteries shipped from the CA j to the RTC k ;
Q k l e Integer variable indicating the number of e-kind of waste electric vehicle batteries shipped from the RTC k to the RC l ;
Q k m e Integer variable indicating the number of e-kind of waste electric vehicle batteries shipped from the RTC k to the ESC m ;
Q k e Integer variable indicating the number of e-kind of waste electric vehicle batteries that can undergo cascade utilization from the RTC k ;
Q k n t e Integer variable representing the quantity of e-kind of waste electric vehicle batteries transported from the RTC k to the RRUC utilizing technology with t-technology.

References

  1. Sun, S.; Jin, C.; He, W.; Li, G.; Zhu, H.; Huang, J. Management Status of Waste Lithium-Ion Batteries in China and a Complete Closed-Circuit Recycling Process. Sci. Total Environ. 2021, 776, 145913. [Google Scholar] [CrossRef] [PubMed]
  2. Notter, D.A.; Gauch, M.; Widmer, R.; Wäger, P.; Stamp, A.; Zah, R.; Althaus, H.-J. Contribution of Li-Ion Batteries to the Environmental Impact of Electric Vehicles. Environ. Sci. Technol. 2010, 44, 6550–6556. [Google Scholar] [CrossRef] [PubMed]
  3. Kilic, H.S.; Kalender, Z.T.; Solmaz, B.; Iseri, D. A Two-Stage MCDM Model for Reverse Logistics Network Design of Waste Batteries in Turkey. Appl. Soft Comput. 2023, 143, 110373. [Google Scholar] [CrossRef]
  4. Wang, Y.; Zhang, Z.; Li, X.; Zhang, B.; Song, H. Collaborative Decision-Making Based on Effort Level: Power Battery Recycling Alliance. Procedia Comput. Sci. 2023, 221, 1155–1161. [Google Scholar] [CrossRef]
  5. Lyu, X.; Xu, Y.; Sun, D. An Evolutionary Game Research on Cooperation Mode of the NEV Power Battery Recycling and Gradient Utilization Alliance in the Context of China’s NEV Power Battery Retired Tide. Sustainability 2021, 13, 4165. [Google Scholar] [CrossRef]
  6. Zhang, M.; Wu, W.; Song, Y. Study on the Impact of Government Policies on Power Battery Recycling under Different Recycling Models. J. Clean. Prod. 2023, 413, 137492. [Google Scholar] [CrossRef]
  7. Zhu, X.; Li, W. The Pricing Strategy of Dual Recycling Channels for Power Batteries of New Energy Vehicles under Government Subsidies. Complexity 2020, 2020, 1–16. [Google Scholar] [CrossRef]
  8. Li, J.; Xu, Y.; Jiao, J.; Yang, R.; Zha, J. Do Recycling Channels Affect Young Consumers’ Choices for Formal Power Battery Recycling? J. Clean. Prod. 2023, 425, 138766. [Google Scholar] [CrossRef]
  9. Pappu, S.; Muduli, S.; Katchala, N.; Tata, N.R.; Bulusu, S.; Martha, S.K. Easy and Scalable Synthesis of NiMnCo-Oxalate Electrode Material for Supercapacitors from Spent Li-Ion Batteries: Power Source for Electrochromic Devices. Energy Fuels 2022, 36, 13398–13407. [Google Scholar] [CrossRef]
  10. Fan, J.; Teng, H.; Wang, Y. Research on Recycling Strategies for New Energy Vehicle Waste Power Batteries Based on Consumer Responsibility Awareness. Sustainability 2022, 14, 10016. [Google Scholar] [CrossRef]
  11. Wang, C.; Feng, X.; Woo, S.; Wood, J.; Yu, S. The Optimization of an EV Decommissioned Battery Recycling Network: A Third-Party Approach. J. Environ. Manag. 2023, 348, 119299. [Google Scholar] [CrossRef]
  12. Rosenberg, S.; Glöser-Chahoud, S.; Huster, S.; Schultmann, F. A Dynamic Network Design Model with Capacity Expansions for EoL Traction Battery Recycling–A Case Study of an OEM in Germany. Waste Manag. 2023, 160, 12–22. [Google Scholar] [CrossRef]
  13. Mu, N.; Wang, Y.; Chen, Z.-S.; Xin, P.; Deveci, M.; Pedrycz, W. Multi-Objective Combinatorial Optimization Analysis of the Recycling of Retired New Energy Electric Vehicle Power Batteries in a Sustainable Dynamic Reverse Logistics Network. Environ. Sci. Pollut. Res. 2023, 30, 47580–47601. [Google Scholar] [CrossRef] [PubMed]
  14. Saeedi, M.; Parhazeh, S.; Tavakkoli-Moghaddam, R.; Khalili-Fard, A. Designing a Two-Stage Model for a Sustainable Closed-Loop Electric Vehicle Battery Supply Chain Network: A Scenario-Based Stochastic Programming Approach. Comput. Ind. Eng. 2024, 190, 110036. [Google Scholar] [CrossRef]
  15. Kamyabi, E.; Moazzez, H.; Husseinzadeh Kashan, A. A Hybrid System Dynamics and Two-Stage Mixed Integer Stochastic Programming Approach for Closed-Loop Battery Supply Chain Optimization. Appl. Math. Model. 2022, 106, 770–798. [Google Scholar] [CrossRef]
  16. Lin, J.; Li, X.; Zhao, Y.; Chen, W.; Wang, M. Design a Reverse Logistics Network for End-of-Life Power Batteries: A Case Study of Chengdu in China. Sustain. Cities Soc. 2023, 98, 104807. [Google Scholar] [CrossRef]
  17. Hao, H.; Sun, Y.; Mei, X.; Zhou, Y. Reverse Logistics Network Design of Electric Vehicle Batteries Considering Recall Risk. Math. Probl. Eng. 2021, 2021, 5518049. [Google Scholar] [CrossRef]
  18. Yang, Y.; Guan, Q.; Yu, Y.; Lin, M. Sustainable Reverse Logistics Network Optimization Model Based on Dual-Channel Power Battery Recycling Mode. Comput. Integr. Manuf. Syst. 2023, 29, 2461–2473. [Google Scholar] [CrossRef]
  19. Tosarkani, B.M.; Amin, S.H. A Possibilistic Solution to Configure a Battery Closed-Loop Supply Chain: Multi-Objective Approach. Expert. Syst. Appl. 2018, 92, 12–26. [Google Scholar] [CrossRef]
  20. Saha, A.K. Stochastic Optimization of Value Recovery Network for Li-Ion Batteries in the United States under Price and Return Volume Uncertainties. Resour. Conserv. Recycl. 2024, 206, 107623. [Google Scholar] [CrossRef]
  21. He, M.; Li, Q.; Wu, X.; Izui, K. Designing a Multi-Level Reverse Logistics Network for Waste Batteries of Electric Vehicles under Uncertainty—A Case Study in the Yangtze River Delta Urban Agglomerations of China. J. Clean. Prod. 2024, 472, 143418. [Google Scholar] [CrossRef]
  22. Wang, L.; Wang, X.; Yang, W. Optimal Design of Electric Vehicle Battery Recycling Network–From the Perspective of Electric Vehicle Manufacturers. Appl. Energy 2020, 275, 115328. [Google Scholar] [CrossRef]
  23. General Office of Shanghai Municipal People’s Government. Interim Measures for Encouraging the Purchase and Use of New Energy Vehicles in Shanghai. Available online: https://czj.sh.gov.cn/zys_8908/zcfg_8983/zcfb_8985/qy_9027/qtqyfczc/20140529/0017-156685.html (accessed on 2 April 2025).
  24. Shanghai Municipal People’s Government. Shanghai Municipal Carbon Emission Management Measures. Available online: https://www.shanghai.gov.cn/nw12344/20250314/d7f358a1242d4b7e91884fed6a967d3b.html (accessed on 2 April 2025).
  25. Hefei Municipal Bureau of Industry and Information Technology. Notice on Applying for 2024 Hefei New Energy Vehicle Financial Subsidy Funds. Available online: https://gxj.hefei.gov.cn/tzgg/18768287.html (accessed on 2 April 2025).
  26. Hefei Municipal People’s Government. Notice on Issuing the Implementation Plan for Energy Conservation and Emission Reduction in Hefei During the 14th Five-Year Plan Period; Hefei Municipal People’s Government: Hefei, China, 2022.
  27. Guangxi Zhuang Autonomous Region Development and Reform Commission. Notice on Issuing the Implementation Rules for Fiscal Subsidies of the Three-Year Action Plan for New Energy Vehicle Promotion and Application in Guangxi Zhuang Autonomous Region. fgw.gxzf.gov.cn. Available online: http://fgw.gxzf.gov.cn/zfxxgkzl/wjzx/zyzc/zdyj/t11266170.shtml (accessed on 2 April 2025).
  28. Department of Ecology and Environment of Guangxi Zhuang Autonomous Region. Announcement on Three Typical Cases of Failure to Fully Surrender Carbon Emission Allowances on Time. Available online: http://sthjt.gxzf.gov.cn/zfxxgk/zfxxgkgl/fdzdgknr/xzsysf/zfgs/t12906268.shtml (accessed on 2 April 2025).
  29. Fujian Provincial People’s Government. Fujian Province Provides Incentives and Subsidies to Enterprises for Recycling Waste Power Batteries from New Energy Vehicle. Available online: https://www.fujian.gov.cn/xwdt/fjyw/202404/t20240414_6428212.htm (accessed on 2 April 2025).
  30. Fujian Provincial People’s Government. Notice of Fujian Provincial People’s Government on Issuing the Implementation Plan for Energy Conservation and Emission Reduction During the 14th Five-Year Plan Period in Fujian Province. Available online: https://www.fujian.gov.cn/zwgk/zxwj/szfwj/202206/t20220617_5932061.htm (accessed on 2 April 2025).
  31. Chengdu Municipal People’s Government. Notice on Organizing Applications for 2024 Subsidy Projects Supporting the Recycling, Cascade Utilization, and Regeneration of Waste Power Batteries from New Energy Vehicles in Chengdu; Chengdu Municipal People’s Government: Chengdu, China, 2024.
  32. Chengdu Municipal People’s Government. Notice of Chengdu Municipal People’s Government on Issuing the Implementation Plan for Carbon Peaking in Chengdu. Available online: https://cds.sczwfw.gov.cn/art/2024/3/20/art_15398_252241.html?areaCode=510100000000 (accessed on 2 April 2025).
  33. Dong, H.; Hu, Q.; Li, D.; Li, Z. Predictive Battery Thermal and Energy Management for Connected and Automated Electric Vehicles. IEEE Trans. Intell. Transp. Syst. 2025, 26, 2144–2156. [Google Scholar] [CrossRef]
  34. Wang, C.; Yuan, Z.; Wang, Y.; Cao, W.; Jiang, F. Overview of Key Technologies for Cascade Utilization of Retired Power Batteries. Adv. New Renew Energy 2021, 9, 327–341. [Google Scholar]
  35. Kastanaki, E.; Giannis, A. Dynamic Estimation of End-of-Life Electric Vehicle Batteries in the EU-27 Considering Reuse, Remanufacturing and Recycling Options. J. Clean. Prod. 2023, 393, 136349. [Google Scholar] [CrossRef]
  36. Jena, K.K.; AlFantazi, A.; Mayyas, A.T. Comprehensive Review on Concept and Recycling Evolution of Lithium-Ion Batteries (LIBs). Energy Fuels 2021, 35, 18257–18284. [Google Scholar] [CrossRef]
  37. Lv, W.; Wang, Z.; Cao, H.; Sun, Y.; Zhang, Y.; Sun, Z. A Critical Review and Analysis on the Recycling of Spent Lithium-Ion Batteries. ACS Sustain. Chem. Eng. 2018, 6, 1504–1521. [Google Scholar] [CrossRef]
  38. Zhou, Z.; Yang, B.; Xu, B.; Zhu, X. Optimization Design of End-of-Life Vehicle Reverse Logistics Network Under Government Guidance. Mod. Manuf. Eng. 2015, 12, 113–120, 125. [Google Scholar] [CrossRef]
  39. Liu, B.; Peng, J. Uncertainty Theory Tutorial; Tsinghua University Press: Beijing, China, 2025. [Google Scholar]
  40. Jimenez, M.; Arenas, M.; Bilbao, A.; Rodriguez, M.V. Linear Programming with Fuzzy Parameters: An Interactive Method Resolution. Eur. J. Oper. Res. 2007, 177, 1599–1609. [Google Scholar] [CrossRef]
  41. Kumar, P. Analyzing Challenges for Sustainable Supply Chain of Electric Vehicle Batteries Using a Hybrid Approach of Delphi and Best-Worst Method. Resour. Conserv. Recycl. 2021, 175, 105879. [Google Scholar] [CrossRef]
  42. Wenzhu Liao, G.H.; Luo, X. Collaborative Reverse Logistics Network for Electric Vehicle Batteries Management from Sustainable Perspective. J. Environ. Manag. 2022, 324, 116352. [Google Scholar] [CrossRef] [PubMed]
  43. Hendrickson, T.P.; Kavvada, O.; Shah, N.; Sathre, R.; Scown, C.D. Life-Cycle Implications and Supply Chain Logistics of Electric Vehicle Battery Recycling in California. Environ. Res. Lett. 2015, 10, 014011. [Google Scholar] [CrossRef]
  44. Selim, H.; Ozkarahan, I. A Supply Chain Distribution Network Design Model: An Interactive Fuzzy Goal Programming-Based Solution Approach. Int. J. Adv. Manuf. Technol. 2008, 36, 401–418. [Google Scholar] [CrossRef]
Figure 1. Waste electric vehicle batteries recycling mechanism map.
Sustainability 17 03885 g001
Figure 2. A comparative graph of predicted retirement volume versus actual retirement volume.
Sustainability 17 03885 g002
Figure 3. Distribution map of RLN nodes for waste electric vehicle batteries in Zhengzhou.
Sustainability 17 03885 g003
Figure 4. Costs at different recycling quantities.
Sustainability 17 03885 g004
Figure 5. Costs at different recycling quality levels.
Sustainability 17 03885 g005
Figure 6. The unit cost and unit carbon emissions under different subsidy coefficients.
Sustainability 17 03885 g006
Figure 7. The unit cost and unit carbon emissions under different levels of penalty coefficients.
Sustainability 17 03885 g007
Figure 8. Unit cost under the combined subsidy–penalty policy.
Sustainability 17 03885 g008
Figure 9. Unit carbon emissions under the combined subsidy–penalty policy.
Sustainability 17 03885 g009
Figure 10. Comparison chart of results between single policy and combined subsidy–penalty policies. (a) Comparison of unit costs under the single subsidy policy and the combined subsidy–penalty policy. (b) Comparison of unit carbon emissions under the single subsidy policy and the combined policy. (c) Comparison of unit costs under single penalty policy and combined subsidy–penalty policy. (d) Comparison of carbon emissions per unit under the single penalty policy and the combined subsidy–penalty policy.
Sustainability 17 03885 g010
Table 1. Subsidy and penalty policy for waste electric vehicle battery recycling in some regions.
RegionSubsidy PolicyPenalty Policy
Shanghai CityA subsidy of RMB 1000 is granted for each set of electric vehicle batteries recycled [23].A comprehensive carbon emission allowance management system has been established, synchronized with the dual-control mechanism governing total emission volumes and intensity thresholds [24].
Hefei CityBattery and vehicle manufacturers receive capacity-based incentives of RMB 10/kWh for establishing functional recycling systems for end-of-life power batteries [25].Sector-specific decarbonization measures are enforced, including green transformation initiatives for key industries, the implementation of energy-efficient building standards, and emission reduction protocols for transportation systems [26].
Guangxi Zhuang Autonomous RegionThe subsidy framework combines operational support (RMB 20/kWh based on actual battery recovery volumes) with capital subsidies covering up to 30% of recycling facility construction costs [27].Regulatory authorities impose fines ranging from RMB 20,000 to 30,000 on entities failing to meet carbon quota obligations, accompanied by mandatory corrective orders issued through municipal-level ecological environment departments [28].
Fujian ProvinceEnterprises meeting industry standards qualify for a one-time RMB 200,000 reward, while large-scale recycling operations processing ≥10,000 tons annually (or achieving ≥5000 tons/750,000 kWh in renewable utilization) receive tiered subsidies up to RMB 10 million (calculated at RMB 1000/ton or RMB 6.6/kWh) [29].Enhanced enforcement mechanisms combine the strict implementation of energy conservation laws with upgraded industrial emission controls, including the intensified monitoring of production processes and the systematic reinforcement of energy efficiency targets [30].
Chengdu CityRecycling enterprises receive a weight-based compensation of RMB 500/metric ton for processed batteries, subject to an annual cap of RMB 1 million per entity [31].The implementation of industrial carbon reduction and supply chain enhancement initiatives, and the establishment of incentive mechanisms for emissions reduction [32].
Table 2. The advantages and disadvantages of recycling technologies.
TechnologyAdvantageDisadvantage
Hydrometallurgy [36]Low carbon emissions,
low environmental pressure
Complex process,
high costs
Pyrometallurgy [37]Simple process,
low costs
High carbon emissions,
high environmental pressure
Table 3. Literature review on RLN design for waste electric vehicle batteries.
StudiesMultiple
Recycling
Technologies
Policy ConsiderationBattery TypeFuzzy ParametersObjective
YesNoSingleMultiQuantityQualitySingleMulti
Subsidy
Policies
Penalty
Policies
Wang [11]
Rosenberg [12]
Mu [13]
Saeedi [14]
Kamyabi [15]
Lin [16]
Hao [17]
Yang [18]
Tosarkani [19]
Saha [20]
He [21]
Wang [22]
This study
Table 4. The sales data of electric vehicle batteries in Zhengzhou.
Year201320142015201620172018201920202021202220232024
Sales volume5529211326335016,78536,00919,61429,54877,968109,207183,896278,523
Table 5. Fuzzy number representation of waste electric vehicle battery volumes in four RTCs of Zhengzhou.
RTCs NMC   Battery   ( Q j 1 , 1 Q j 1 , 2 Q j 1 3 ) LFP   Battery   ( Q j 2 , 1 Q j 2 , 2 Q j 2 3 )
1(392.76, 436.4, 480.04)(419.58, 466.2, 512.82)
2(450.81, 500.9, 550.99)(481.59, 535.1, 588.61)
3(1597.68, 1775.2, 1952.72)(1706.67, 1896.3, 2085.03)
4(181.26, 201.4, 221.54)(193.68, 215.2, 236.72)
Table 6. Parameter settings.
ParametersDistribution
Function/Value
ParametersDistribution
Function/Value
ParametersDistribution Function/Value
F k U(4,000,000, 6,000,000) H m U(1000, 5000) C j k U(500, 2000)
F l U(4,000,000, 7,000,000) H n t U(1000, 5000) C k l U(500, 2000)
F m U(5000000, 700,000) R k U(2000, 6000) C k m U(500, 2000)
F n t U(5,000,000, 7,000,000) R l U(2000, 6000) C k n t U(500, 2000)
O k e U(500, 2000) R m U(2500, 6000) E j k U(10, 30)
O l e U(500, 2000) R n t U(2500, 6000) E k l U(10, 30)
O m e U(500, 2000) S k e U(0, 100) E k m U(10, 30)
O n t e U(1000, 2500) S l e U(0, 100) E k n t U(10, 30)
H k U(1000, 6000) S m e U(0, 100) b ˜ e U(0.1, 0.7)
H l U(500, 2000) S n t e U(10, 200) c ˜ e U(0.1, 0.7)
Table 7. Comparison of results between single-objective and multi-objective approaches.
CostCarbon EmissionsRTCsRCsESCsRRUCsTechnology
Cost of single-
objective model
94,184,340879,949.41, 211, 21, 21, 1
Controlled quantity of carbon emissions in single-objective model103,225,500647,462.73, 432, 31, 22, 2
Multi-objective model97,767,470700,579.51, 411, 31, 22, 1
The numbers in columns 4–8 of the table indicate that the candidate facility or processing technology corresponding to each numbered item has been selected.
Table 8. Facility selection for different quantities of waste electric vehicle batteries.
CostCarbon
Emissions
RTCsRCsESCsRRUCsTechnology
097,767,470700,579.51, 411, 31, 22, 1
10%103,159,000780,503.72, 411, 31, 21, 2
20%112,012,600911,751.31, 2, 41,1, 31, 21, 2
30%118,661,400987,876.71, 2, 421, 31, 21, 2
40%123,129,3001,054,7161, 2, 421, 31, 21, 2
The numbers in columns 4–8 of the table indicate that the candidate facility or processing technology corresponding to each numbered item has been selected.
Table 9. Facility selection for different quality of waste electric vehicle batteries.
CostCarbon
Emissions
RTCsRCsESCsRRUCsTechnology
−20%100,767,503765,490.61, 2, 411, 21, 22, 1
−10%98,467,509723,4241, 2, 411, 21, 22, 1
097,767,502700,579.51, 2, 411, 31, 22, 1
10%97,567,509656,8341, 2, 421, 31, 22, 1
20%95,767,499606,453.71, 2, 422, 31, 22, 1
The numbers in columns 4–8 of the table indicate that the candidate facility or processing technology corresponding to each numbered item has been selected.
Table 10. Comparison of deviation index results.
β The Proposed MethodLP-Metric Method
F 1 F 2 DI F 1 F 2 DI
198,747,390955,749.30.0398,747,390955,749.30.03
0.998,751,470951,750.60.03100,124,600836,851.60.15
0.898,765,830950,141.70.03101,015,200802,361.60.25
0.7100,124,600836,851.60.15102,770,200753,735.70.44
0.6100,315,400827,781.20.17104,600,800730,6930.64
0.5102,770,200753,735.70.44104,600,800730,6930.64
0.4102,770,200753,735.70.44105,506,800724,659.50.74
0.3104,600,800730,6930.64107,487,500715,249.50.95
0.2104,600,800730,6930.64107,906,800711,7260.97
0.1107,487,500715,249.50.95107,906,800711,7260.97
0107,906,800711,7260.97107,906,800711,7260.97
average//0.41//0.61
Disclaimer/Publisher’s Note: The statements, opinions and data contained in all publications are solely those of the individual author(s) and contributor(s) and not of MDPI and/or the editor(s). MDPI and/or the editor(s) disclaim responsibility for any injury to people or property resulting from any ideas, methods, instructions or products referred to in the content.

