1. Introduction
Potassium nitrate (KNO
3) is a widely used compound in both agricultural and industrial applications [
1]. In agriculture, it serves as a dual-source fertilizer for nitrogen and potassium, two essential nutrients for crop productivity. Beyond this, KNO
3 plays an important role in industries such as pyrotechnics, glass manufacturing, and pharmaceuticals [
1], where its oxidizing and solubility properties are valued [
2]. Despite its versatility and importance, the production of KNO
3 is typically associated with considerable environmental burdens. These include high energy consumption, reliance on virgin raw materials, and the generation of by-products that often require additional treatment or disposal [
3,
4].
LCA studies show that nitrate-based fertilizers present considerable environmental burdens, including high GHG emissions and energy use [
3,
5,
6,
7]. Unlike other nitrogen-based fertilizers, potassium nitrate (KNO
3) is not currently included in the Reference Documents on Best Available Techniques (BREFs) developed under the Industrial Emissions Directive (IED). As a result, systematized data on resource efficiency, emissions, and environmental performance for KNO
3 production are scarce and fragmented. This gap reinforces the relevance of conducting detailed environmental and economic assessments for this product, particularly in the context of circular and symbiotic industrial strategies.
In this context, the implementation of industrial symbiosis (IS) emerges as a promising pathway [
8]. IS refers to the collaboration between different industrial actors to exchange and reuse materials, energy, water, and by-products [
7,
9,
10,
11,
12], thereby increasing overall efficiency and reducing environmental externalities. While IS has been successfully applied in industrial clusters such as cement, steel, and pulp and paper [
7,
9,
13,
14], its application in the fertilizer industry—and particularly in the production of KNO
3—remains underexplored in both the scientific literature and practical implementation.
The integration of IS into fertilizer manufacturing could help reduce the environmental footprint of production by avoiding virgin resource extraction, lowering energy demand, and minimizing waste [
7,
12,
15,
16]. For example, waste heat from one facility could be used to power evaporation or crystallization steps in KNO
3 production, while by-products from other chemical processes (such as nitric acid or potassium salts) could substitute for raw feedstocks. These exchanges not only reduce environmental impacts but also offer potential economic benefits by decreasing input costs and waste management expenses [
10,
17,
18].
Despite the potential benefits, evidence of such symbiotic applications in the fertilizer sector remains scarce. This study aims to address this gap by investigating the integration of IS strategies in a real-world KNO
3 production facility located in the industrial area of Escombreras (Murcia, Spain). This region, characterized by a dense network of energy- and material-intensive industries, provides a fertile ground for testing the technical and economic feasibility of IS interventions [
19]. The case is developed in the framework of the CORALIS project (Horizon 2020, Grant Agreement No. 958337), which promotes symbiotic solutions in European industrial clusters [
20].
To evaluate the impact of these strategies, the study combines two complementary methodologies: life cycle assessment (LCA) and life cycle costing (LCC). LCA provides a quantitative analysis of the environmental effects across the entire life cycle of KNO
3, from raw material extraction to production [
21]. Using the ReCiPe method [
22] and data from the Ecoinvent 3.8 database [
23], key impact categories such as climate change, fossil resource depletion, and cumulative energy demand are assessed. On the other hand, LCC offers a comprehensive view of the economic performance, considering all costs associated with materials, energy, waste management, and potential savings from IS implementation [
24,
25].
This dual analysis ensures that both the environmental and financial dimensions of industrial symbiosis are addressed. Furthermore, it allows for the identification of trade-offs and synergies, offering insights into the feasibility and replicability of such interventions in other industrial contexts. The results aim to inform policymakers, industrial stakeholders, and researchers on the real benefits and barriers associated with symbiotic strategies in fertilizer production.
Importantly, the study contributes to the limited body of literature specifically focused on the sustainable production of potassium nitrate. While much research has been conducted on the optimization of individual unit operations or emissions reductions through cleaner technologies, few studies have taken a holistic systems approach that integrates circularity principles into the process design [
1,
4,
6,
26]. This work adds new evidence to support the viability of IS in closing material loops, decarbonizing high-impact sectors, and enhancing the resource efficiency of chemical production systems.
The findings of this research also align with broader policy frameworks such as the European Green Deal and the Science-Based Targets initiative (SBTi), which encourage industrial decarbonization through innovation and resource efficiency [
27,
28,
29]. By embedding IS into the production of KNO
3, the case study demonstrates how industry-specific interventions can contribute to wider sustainability transitions, promoting economic competitiveness while reducing environmental burdens.
In summary, this study explores the potential of industrial symbiosis to transform the sustainability profile of potassium nitrate production. Through a combined LCA–LCC assessment, it offers a robust and multidimensional evaluation of IS implementation in a real industrial context. In doing so, it addresses a clear gap in the current literature and provides practical insights for advancing circular economy strategies within the fertilizer industry and beyond.
2. Framework for the Integration of LCA and LCC
The integration of environmental and economic performance assessment methods, particularly life cycle assessment (LCA) and life cycle costing (LCC), is increasingly important in sustainability studies [
30]. However, a standardized and universally accepted framework for their integration remains an open challenge in the literature [
31]. Different approaches have been proposed—ranging from sequential applications to fully merged models—but most authors agree that coherence in system definition, data sources, and assumptions is fundamental to ensure meaningful results.
In this study, a parallel but harmonized approach was adopted to integrate LCA and LCC, following the guidance of [
25,
32]. Under this framework, both methodologies are applied independently but use a shared basis in terms of functional unit, system boundaries, time horizon, and inventory data. This strategy allows each method to retain its analytical strengths while ensuring comparability of outcomes and internal consistency across dimensions.
Both the LCA and LCC in this work adopt a cradle-to-gate perspective, evaluating the environmental and economic impacts associated with the production of 1 kg of KNO
3. The system boundaries include raw material extraction, energy consumption, auxiliary chemicals, and infrastructure requirements, aligning with ISO 14040/44 [
33,
34] for LCA and general best practices for cost modeling. A 30-year operational lifespan was used for capital depreciation and time-based impact allocation, ensuring temporal consistency across both assessments.
Data collection for both assessments was carried out in parallel, using a combination of primary data from project partners (Grupo Fertiberia and Azcatec) and secondary data from the Ecoinvent 3.8 database. By using the same datasets, technologies, and process assumptions, the comparability between LCA and LCC results is strengthened. This alignment enables more accurate interpretation of trade-offs between environmental impacts and economic performance.
To extend the analysis beyond internal costs, the study also applies an environmental life cycle costing (eLCC) approach. This involves the monetization of selected environmental impacts obtained from the LCA—such as greenhouse gas emissions, fossil resource depletion, and water use—using cost factors derived from European environmental policy studies [REF]. The resulting external costs are then added to the traditional LCC results, offering a more complete picture of the economic implications of environmental performance.
This integrated approach enhances the robustness of the assessment by allowing direct comparison of sustainability scenarios using a common metric (€/kg of product). It also supports decision-making by revealing cost savings not only from operational efficiencies but also from avoided environmental damage and potential policy-related costs (e.g., carbon pricing, water use penalties).
Overall, the combined LCA–LCC–eLCC framework applied in this study ensures methodological transparency and consistency. It contributes to the growing body of research on integrated sustainability assessment tools and responds to the need for practical, applicable methods to evaluate circular economy interventions in industrial systems.
3. Materials and Methods
LCA is a well-established methodology for identifying and quantifying the environmental impacts of a product, service, or technology throughout its entire life cycle, from raw material extraction to disposal. It follows a structured framework defined by the International Organization for Standardization (ISO) 14040/14044 standards [
33,
34], ensuring a systematic and comprehensive approach.
The LCA process consists of four interrelated phases: (a) goal and scope definition, (b) life cycle inventory analysis (LCI), (c) life cycle impact assessment (LCIA), and (d) results interpretation, carried out iteratively to refine the analysis. The LCIA phase evaluates environmental impacts using characterization models, while the final interpretation step translates the findings into actionable insights.
Similarly, life cycle costing (LCC) was conducted in parallel to LCA, following a structured methodology to assess the economic aspects of the product life cycle. This integrated approach provides a comprehensive evaluation of both environmental and economic performance, supporting sustainability-oriented strategies.
3.1. Goal and Scope
The goal of this study was to develop a cradle-to-gate life cycle system for assessing the environmental impacts of potassium nitrate (KNO
3) production and to explore mitigation measures. The scope definition establishes the functional unit as 1 kg of potassium nitrate. The simplified cradle-to-gate system boundary used in this study includes KNO
3 synthesis, starting from raw material production (e.g., potassium chloride and ammonium nitrate), as well as the use of auxiliaries, energy (such as electricity and steam), construction (including maintenance of infrastructure) as is shown in the
Supplementary Materials: Figure S1. The packaging and catalysts for foreground systems were excluded from the system boundary. KNO
3 production is assumed to be an integrated project that includes both raw material production and potassium nitrate synthesis. Decommissioning impacts were excluded due to lack of reliable data and their expected negligible contribution over the 30-year lifespan.
The life cycle assessment (LCA) in this work evaluates the entire life cycle of the KNO3 production plant, considering apart from the operational data, the upstream processes involving the construction of the installation. As a result, the environmental assessment for the generation of a 1 kg of product includes the entire supply chain (e.g., mining, processing, and transporting raw materials).
3.1.1. Baseline Scenario Process
The baseline scenario (
Figure 1) takes into account the conventional production processes of potassium nitrate (KNO
3) and other chemical compounds at QSr. Potassium nitrate is mainly used as a fertilizer and is produced through the chemical reaction of ammonium nitrate (NH
4NO
3) and potassium chloride (KCl). This process generates ammonium chloride (NH
4Cl) as a by-product. Around 50% of the KNO
3 obtained is crystallized, while the remaining portion is mixed with NH
4Cl and sold as a fertilizer.
The process was modeled using SimaPro 9.3.0.3., following a process-based approach. Each production stage was represented by unit processes connected through mass and energy flows. The model includes all relevant inputs such as raw materials (e.g., KCl, NH4NO3 or HNO3), energy carriers (electricity, steam), process water, and auxiliary chemicals, as well as outputs including the main product (KNO3), co-products (e.g., HCl), emissions to air and water, and solid residues.
For the foreground system, primary data were collected directly from Fertiberia and Azcatec, including infrastructure requirements, replacement materials, and reagent preparation. Background processes, including raw material production, electricity mix, and auxiliary chemicals, were modeled using the Ecoinvent 3.8 database. Geographical selection followed a tiered approach: Spanish datasets (ES) were used whenever available, followed by regional European datasets (RER), and finally global datasets (GLO) if no regional options existed.
In addition, market data sheets and safety data sheets were used to estimate the likely origin of raw materials and to inform the modeling of transport distances, which were incorporated based on actual or representative supply chains. The model follows a cradle-to-gate system boundary, capturing all upstream impacts but excluding downstream use and end-of-life stages. This approach ensures methodological consistency and supports traceability between the inventory and the results presented in subsequent sections.
The key problem in the section of KNO3 production is the incomplete conversion of reactants, the process involves side purification and recirculation stages to enhance efficiency and product purity. In particular, the crystallization process requires highly pure compound solutions, with additional cleaning and separation steps required to ensure the desired product quality.
Regarding utility consumption, the process is highly dependent on the following:
Electricity, primarily used for the refrigeration unit in the KNO3 production section.
Steam, generated in a natural gas boiler, is required for heating and evaporation processes.
Water, which is necessary for both the chemical processes and steam generation.
The KNO3 production process operates discontinuously throughout the year, adapting to the seasonal fertilizer demand. This scenario serves as the reference system for assessing potential improvements and synergies under the CORALIS project framework, with the aim to enhance resource efficiency and optimize the integration of industrial by-products.
3.1.2. CORALIS Scenario Process
At the heart of the symbiosis scenario is the implementation of a cutting-edge reactor employing ion-exchange resins to produce KNO
3 (
Figure 2). This innovative reactor utilizes resins specifically designed to enhance the efficiency of ion exchange between potassium chloride (KCl) and nitric acid (HNO
3). This process utilizes nitric acid (HNO
3) and potassium chloride (KCl), producing diluted HCl (12%) as a by-product.
This system is considered innovative due to several design and operational improvements over conventional batch reactors. The reactor operates in a closed-loop configuration with four interconnected columns, a pressurization vessel, and a resin transfer vessel arranged in a U-shape, allowing continuous resin circulation. The movement of resin is achieved through either pressurized air pulses or peristaltic pumps, and the process avoids frequent washing cycles or resin removal, reducing operational downtime.
Ion exchange occurs in multiple sequential steps involving the reaction of potassium chloride (KCl) with the resin to produce HCl, followed by regeneration using nitric acid (HNO3) to yield KNO3. By using equinormal solutions across all columns, the process maintains osmotic balance, preventing resin degradation and extending service life. Moreover, high-purity products (up to 95% KNO3) are obtained while avoiding the contamination typically associated with ionic leakage. This eliminates waste generation and enhances the circularity and economic viability of the system.
Through an innovative pilot wastewater treatment plant (
Supplementary Materials: Figure S2), the CaCl
2 solution is concentrated and reacted with sulfuric acid (H
2SO
4), yielding concentrated HCl (30%) and gypsum (CaSO
4·2H
2O) as outputs. This configuration is considered innovative for several reasons. First, it valorizes the by-product HCl from the KNO
3 production process, replacing the need for imported concentrated HCl in the lixiviation of celestite (SrSO
4), a key raw material in the site’s strontium production. Second, it avoids the discharge of CaCl
2-rich effluents, which previously reacted with sulphates from neighboring industries, causing operational issues in the shared wastewater network. Third, it recovers two marketable co-products: synthetic gypsum, which is reused as filler in ammonium nitrate production, and HCl 30%, which is reused internally for lixiviation and other processes. Additionally, a biological treatment is applied to remove nitrogen from the CaCl
2 stream under high salinity conditions—an uncommon but critical innovation for regulatory compliance and circularity.
The key innovation lies in the resin’s ability to selectively exchange ions, significantly reducing impurities in the resulting KNO3. This not only improves the quality of the final product but also decreases the environmental impact by reducing the need for intensive downstream purification processes. The reactor’s modular design allows for scalability and adaptability to different production volumes, making it a cornerstone of the symbiosis scenario at Escombreras.
In addition to reducing emissions and water consumption, the Escombreras site is also piloting technologies to replace imported materials and utilize by-products from neighboring industries. This approach underscores its commitment to integrating sustainable practices and aligning with European policies for a circular economy.
3.2. Life Cycle Inventory (LCI) Analysis
The inventory analysis considers a systematic data collection process where all the inputs and outputs (e.g., energy, materials and emissions) are collected within the system boundaries of the KNO3 production process. This inventory is tailored according to the functional unit selected. The first step consists of an exhaustive review of the literature on previous inventories from other KNO3 production processes developed, and primary data were collected from the different life cycle stages presented in.
It is important to remark on the relevance of the data inventoried based on foreground information obtained by the CORALIS project through Fertiberia Group and Azcatec information for the main stages:
Construction: In this stage, there are no common processes and equipment. Both systems are independent for the production of KNO3. It considers the equipment of the old plant for the baseline scenario and the new installation of resin reactor for KNO3 production for the CORALIS scenario.
Operation and maintenance: These stages consider the inputs and outputs related to the KNO3 production process.
Supplementary Materials: Tables S1 and S2 summarize the material and energy inputs and outputs per functional unit (1 kg of KNO
3) for both the baseline and CORALIS scenarios. The values were obtained by normalizing the total inventory flows over the 30-year operational lifetime using the respective production outputs. This comparative quantification enhances the understanding of process-level differences and supports the interpretation of the LCA and LCC results presented in the following sections.
3.3. Life Cycle Impact Assessment (LCIA)
Once the scope of the study and inventory of the processes have been defined, an impact assessment of the process section plant is performed to evaluate their environmental impact. The modeling of the inputs and outputs of the KNO3 production process and those of the construction step was developed using SimaPro software version 9.3.0.3 and in-house databases complemented by Ecoinvent 3.8, where each unit process was defined with corresponding mass and energy flows. The software enabled the connection of foreground and background data, the use of predefined Ecoinvent datasets, and the automated calculation of impacts.
For the data analysis and characterization factors, the ReCiPe 2016 v1.1 Midpoint environmental method was adopted due to its broad coverage of environmental issues, scientific robustness, and suitability for industrial systems. It provides a harmonized structure for quantifying 18 environmental impact categories at midpoint level, striking a balance between scientific accuracy and interpretability. The hierarchist perspective (H) was chosen as it reflects a consensus-based time horizon and policy-relevant assumptions. The impact categories evaluated in this analysis are presented in the
Supplementary Materials: Table S1.
The midpoint analysis implied the comparison of results attaining the normalization and characterization processes. The former was useful for identifying the most impactful categories on the total normalized value. The latter was useful for determining the contribution of the different processes to the obtained impact.
3.4. Interpretation
This phase of the LCA methodology has the objective of extracting the relevant conclusions from impact assessment results, requiring that they align with the goal and scope of the study. In addition, this stage includes a critical evaluation of the data and the most important impact categories, along with a discussion with recommendations for the new technology deployed in the Escombreras demo site.
3.5. Environmental Life Cycle Costing (eLCC)
The LCC analysis was conducted using a cradle-to-gate approach to evaluate the economic performance of potassium nitrate (KNO3) production under baseline and symbiotic scenarios. This assessment complements the environmental evaluation, providing an integrated perspective on the economic implications of process improvements.
All economic values used in this study refer to the year 2024, based on market data and supplier-specific information provided by Azcatec and Fertiberia Group. External environmental cost factors were obtained from the EcoCost/Value model [
35].
The LCC analysis includes capital expenditure (CAPEX) and operational expenditure (OPEX). CAPEX accounts for the investment costs associated with infrastructure, equipment, and technological implementation for KNO3 production, while OPEX covers recurring expenses such as raw materials, energy consumption, maintenance, labor, and waste management. This consistency ensures that both economic and environmental assessments follow a unified methodological framework.
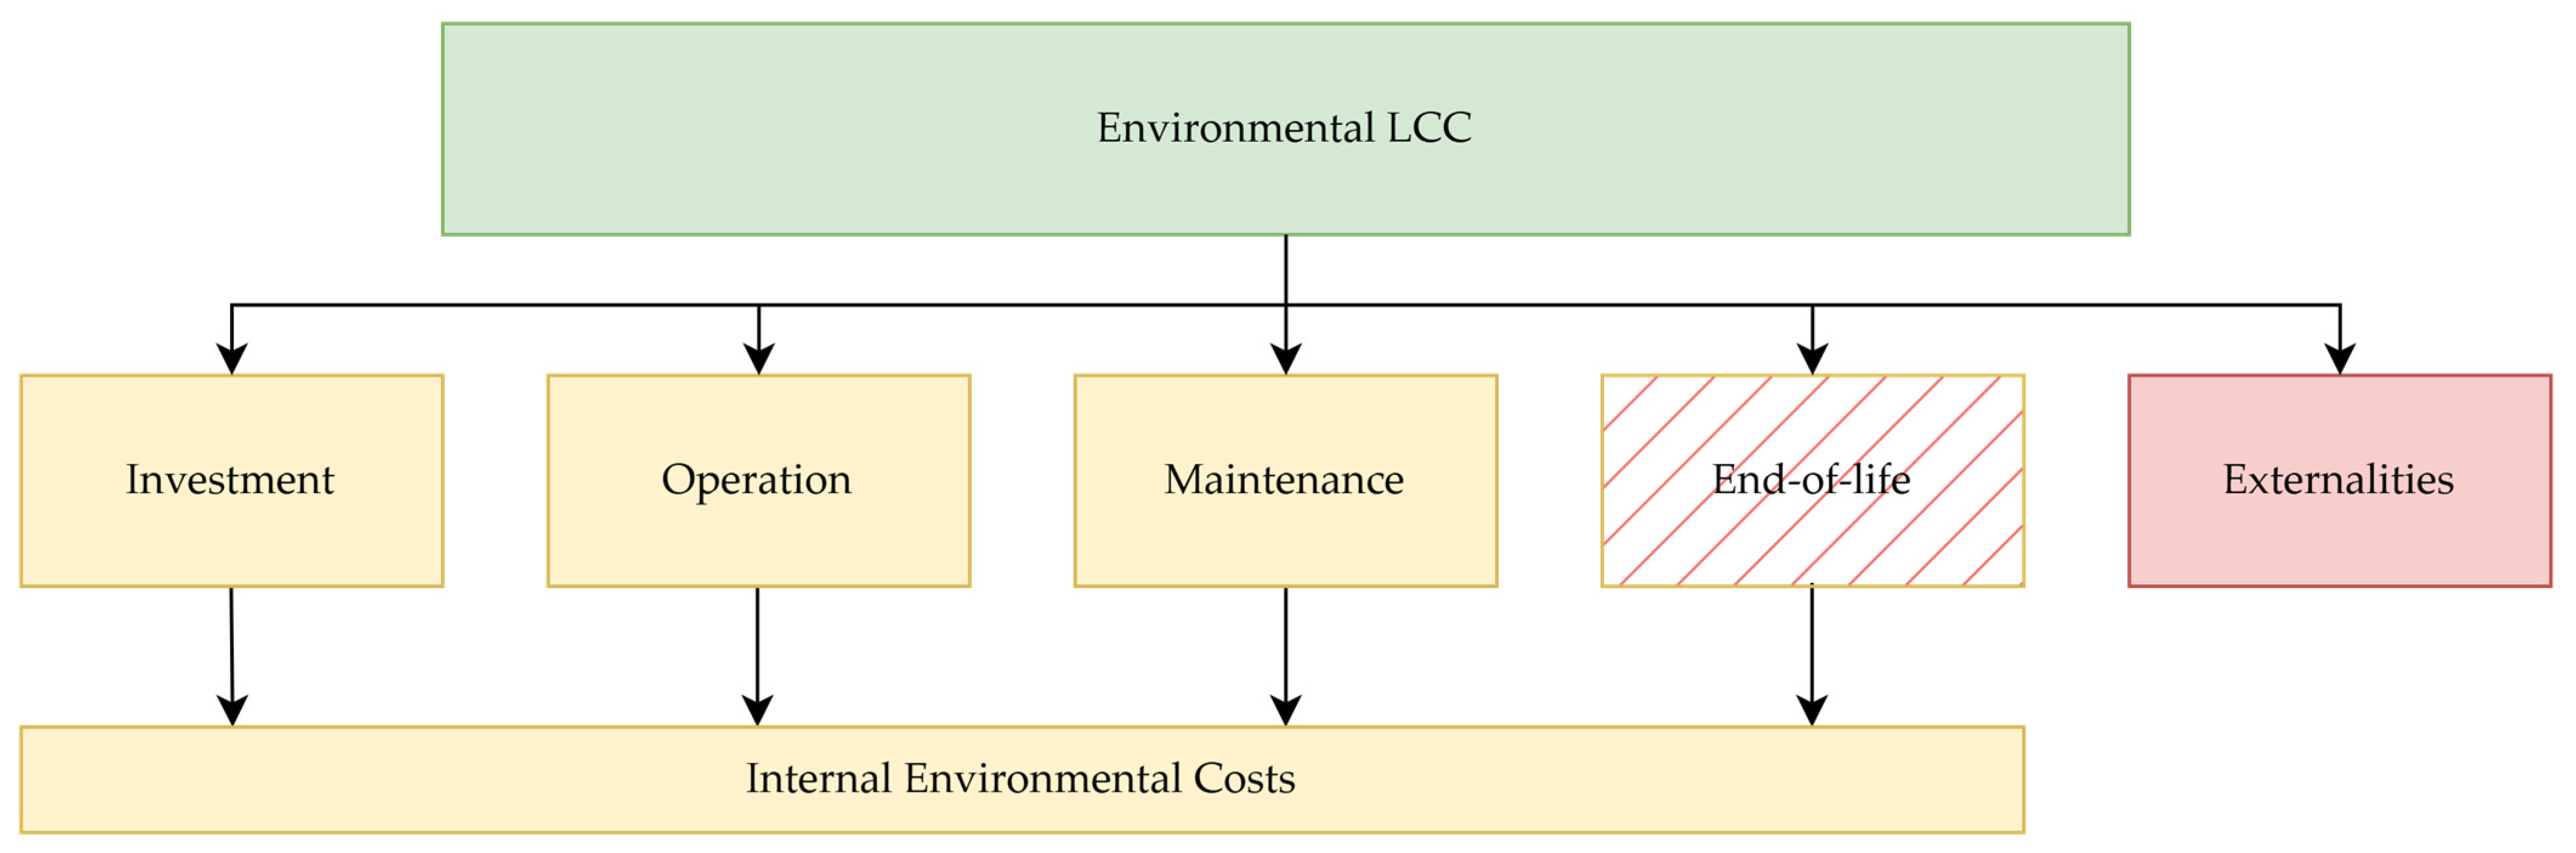
Beyond internal costs, the LCC framework also incorporates economic externalities derived from IS strategies (
Figure 3). These externalities include cost savings from reduced emissions, considering potential incentives, carbon taxes, and offset mechanisms, as well as resource efficiency improvements, where optimized material use and by-product valorization contribute to lowering overall operational costs.
An environmental life cycle costing (eLCC) approach was applied by monetizing the environmental externalities associated with each impact category [
36]. This methodology enables the inclusion of non-market environmental damage in the life cycle cost analysis, enhancing the completeness and robustness of the assessment [
24].
Supplementary Materials: Table S4 presents the environmental cost factors used in the evaluation, expressed in euros per functional unit for each impact category [
36]. These unit costs were derived from the recent literature and reflect the midpoint characterization of environmental damage within European policy frameworks [
35].
By integrating these external costs into the overall economic evaluation, the LCC framework transitions from a pure financial analysis to a more holistic sustainability assessment. This enhanced view enables stakeholders to better understand the true cost of production and the long-term benefit of implementing IS strategies. The application of eLCC supports informed decision-making, facilitates environmental-economic trade-offs, and reinforces the alignment of industrial practices with the principles of circular economy and climate policy goals [
24].
4. Results
4.1. The Environmental Impact Assessment of Life Cycle
The results of the LCA conducted for both the baseline scenario and CORALIS scenario at the Escombreras demo site are presented below, highlighting the environmental impact categories and contributions of various process components. The assessment aims to identify key areas of improvement in resource efficiency and emission reduction, reflecting the advantages of the CORALIS approach.
4.1.1. Environmental Performance of Baseline Scenario
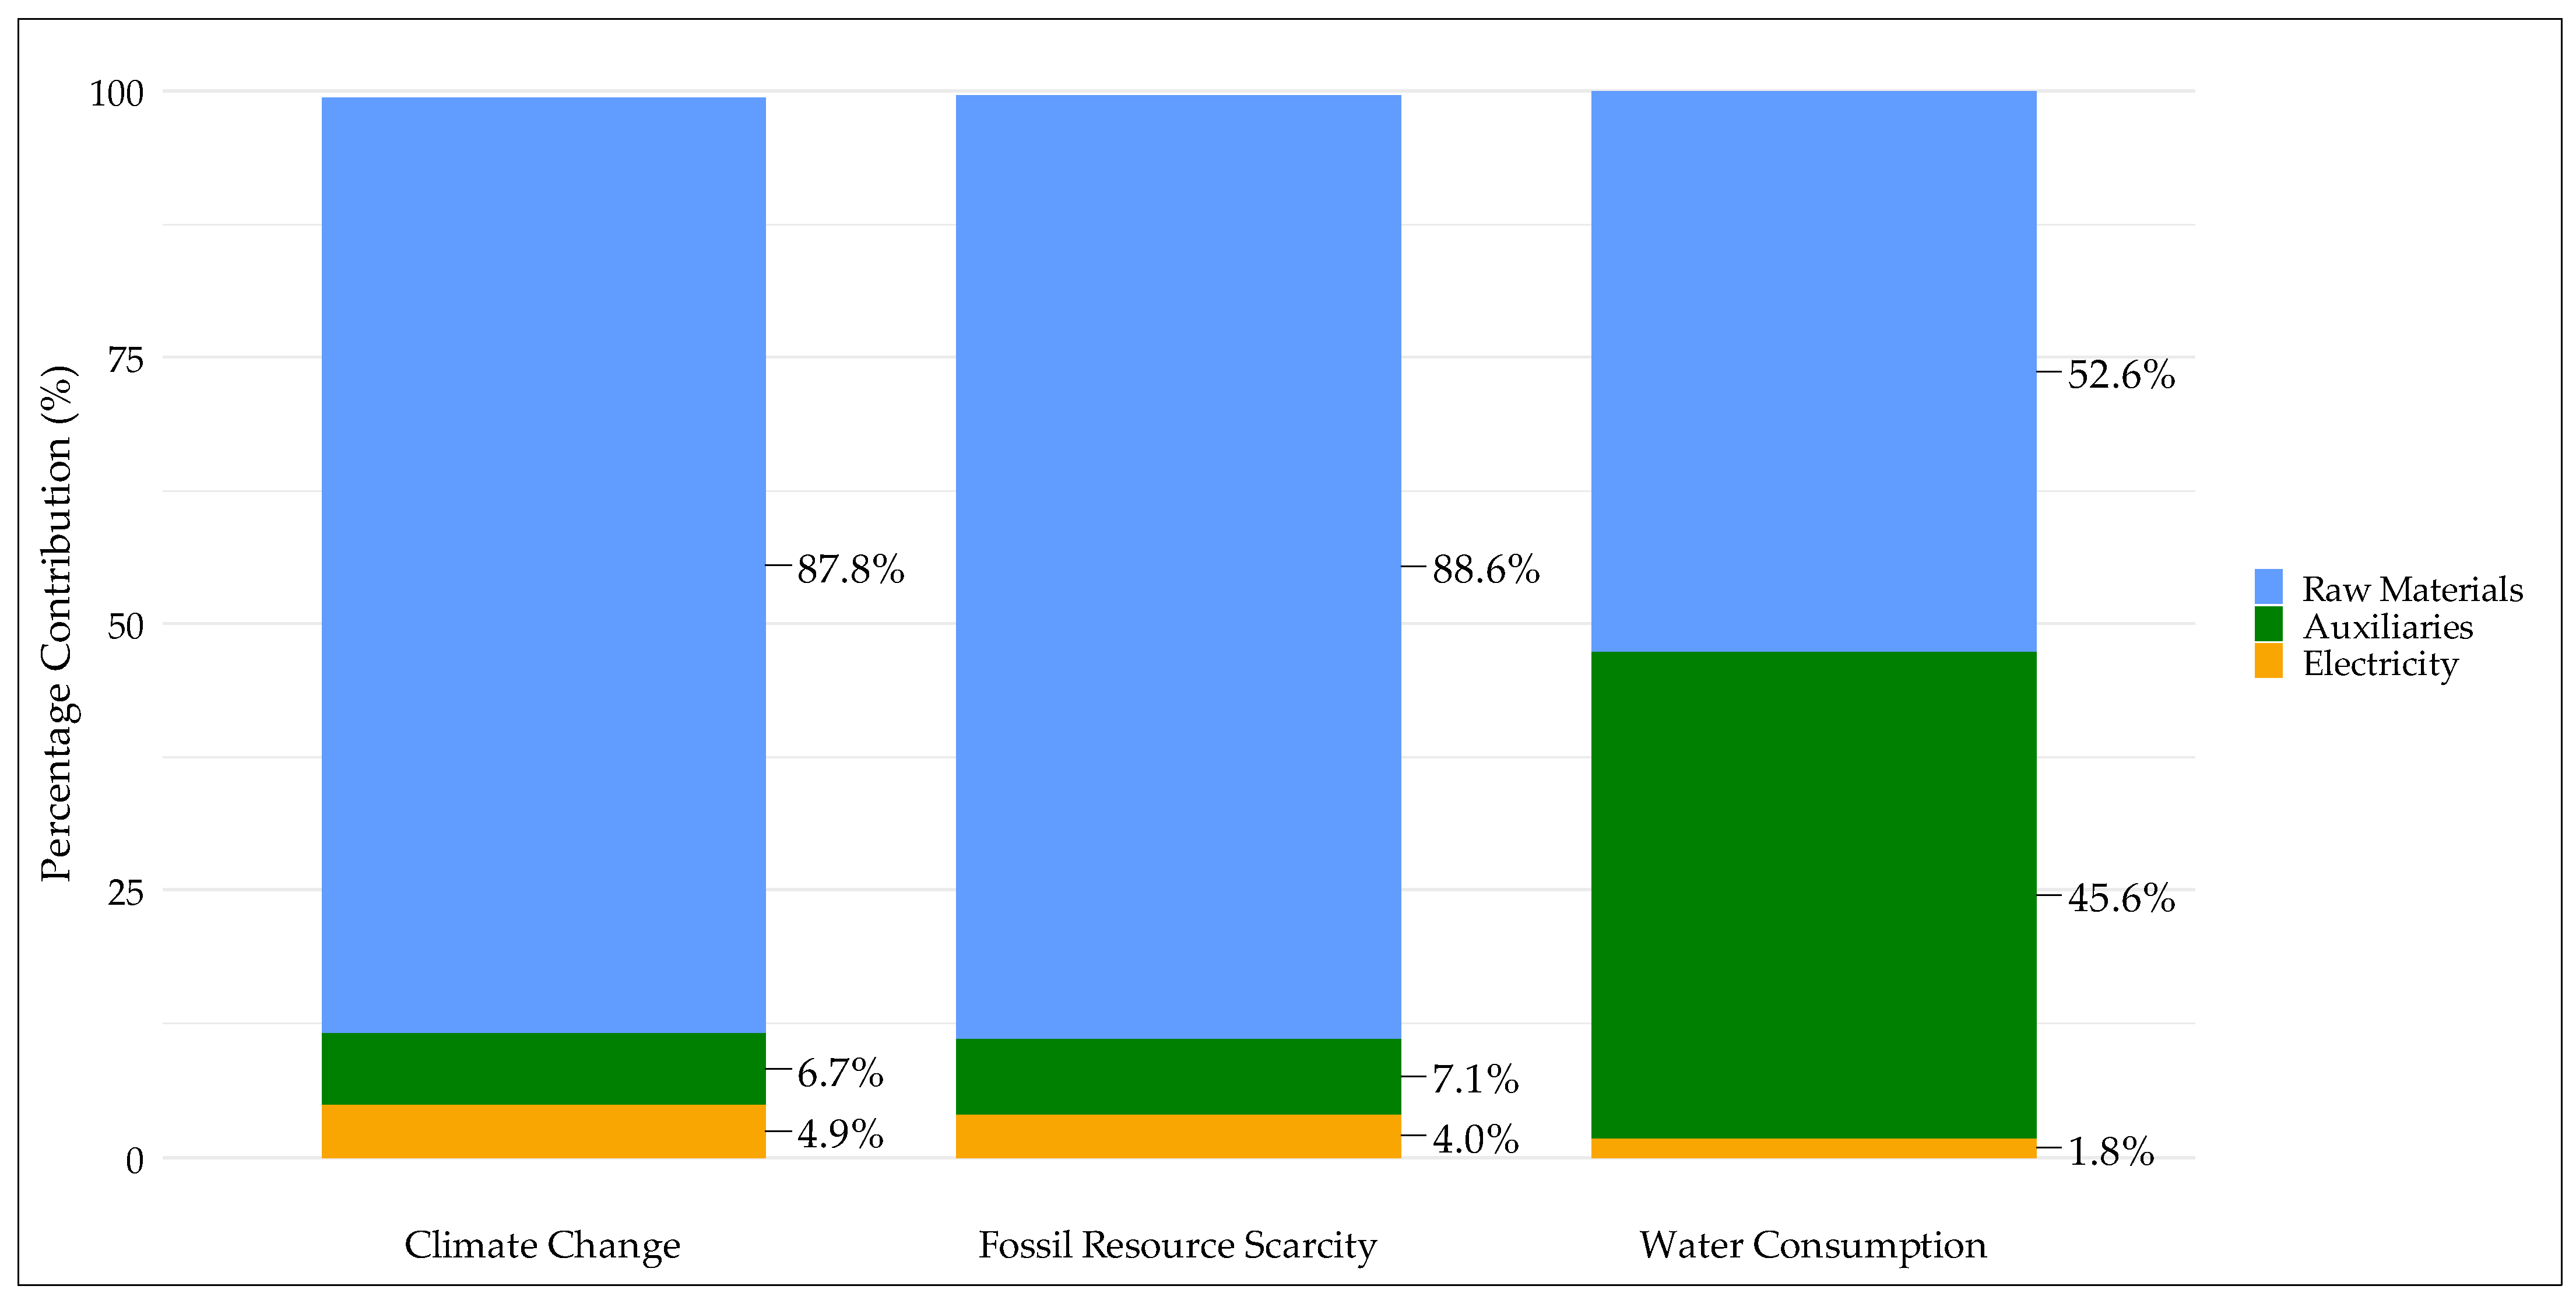
The characterization results for the baseline scenario indicate that raw material consumption represents the dominant source of environmental burdens across all selected impact categories, particularly in climate change (87.8% of total GWP emissions), fossil resource scarcity (88.6% of total fossil resource depletion), and water consumption (52.6% of total water use). These findings align with previous studies on resource-intensive chemical production, where raw material extraction and processing are often the most significant contributors to environmental impacts due to high energy demands, emissions associated with material refinement, and land and water use requirements.
Electricity consumption, while less significant than raw materials, remains a relevant contributor, particularly in categories where energy-intensive industrial processes play a key role. In the baseline scenario, electricity use accounts for 4.9% of total GWP emissions, 4.0% of fossil resource depletion, and 1.8% of total water consumption. This impact is primarily attributed to grid electricity dependency, which incorporates fossil fuel-based power generation, leading to indirect emissions and depletion of non-renewable resources.
Auxiliary materials also exert a notable influence, contributing 6.7% to total GWP emissions, 7.1% to fossil resource depletion, and 45.6% to water consumption. The relatively high water demand associated with auxiliaries suggests that chemical inputs, such as solvents and process reagents, require substantial water inputs either for production or in operational phases.
By contrast, equipment manufacturing and transport-related emissions exhibit negligible contributions across all impact categories. The embedded impacts of plant infrastructure, machinery, and logistics account for less than 1% of total environmental burdens, confirming that long operational lifetimes dilute the environmental relevance of capital investments in comparison with continuous process inputs.
A detailed breakdown of the environmental impacts is presented in
Table 1, where raw material consumption clearly emerges as the predominant driver of environmental burdens in climate change, fossil resource scarcity, and water consumption. The relative contributions to climate change, fossil resource scarcity, and water consumption are further illustrated in
Figure 4, which provides a visual breakdown of the emissions and resource depletion associated with raw materials, electricity, and process auxiliaries. This representation highlights the overwhelming dominance of raw materials in total environmental burdens, reinforcing the need for process efficiency improvements and material substitutions as primary impact mitigation strategies.
These results are consistent with previous research demonstrating the dominance of upstream supply chain processes—particularly the sourcing and transformation of raw materials—in driving environmental impacts in chemical manufacturing systems. For instance, prior LCA studies on nitrate-based fertilizers have shown that feedstock extraction, purification, and conversion steps contribute more than 80% of total GHG emissions and fossil depletion. The values observed in the baseline scenario, especially the 87.8% GWP and 88.6% FFP contributions from raw materials, fall within this established range.
The contribution of electricity to total GHG emissions (4.9%) reflects the dependency on grid-connected power, whose carbon intensity remains notable in conventional European industrial systems. According to the European Environment Agency [
37], electricity generation in the EU has reduced its carbon intensity by 35% between 2005 and 2020, yet fossil fuels still represent a substantial share in several member states, contributing to indirect emissions in grid-based operations.
4.1.2. Environmental Performance of CORALIS Scenario
The CORALIS scenario, which integrates IS strategies, demonstrates substantial environmental benefits across all three impact categories. By optimizing resource flows, minimizing material inputs, and leveraging waste valorization, the CORALIS approach significantly reduces environmental burdens when compared to the baseline scenario.
A detailed LCIA reveals that the implementation of IS strategies leads to a 76.5% reduction in climate change impacts, a 77.9% decrease in fossil resource scarcity, and an 82.6% lower water consumption relative to the conventional production system. These reductions are primarily attributed to the following causes:
Enhanced resource efficiency, reducing dependency on virgin raw materials.
Lower energy consumption, due to process optimization and heat recovery.
Reduction in auxiliary inputs, minimizing chemicals and water-intensive operations.
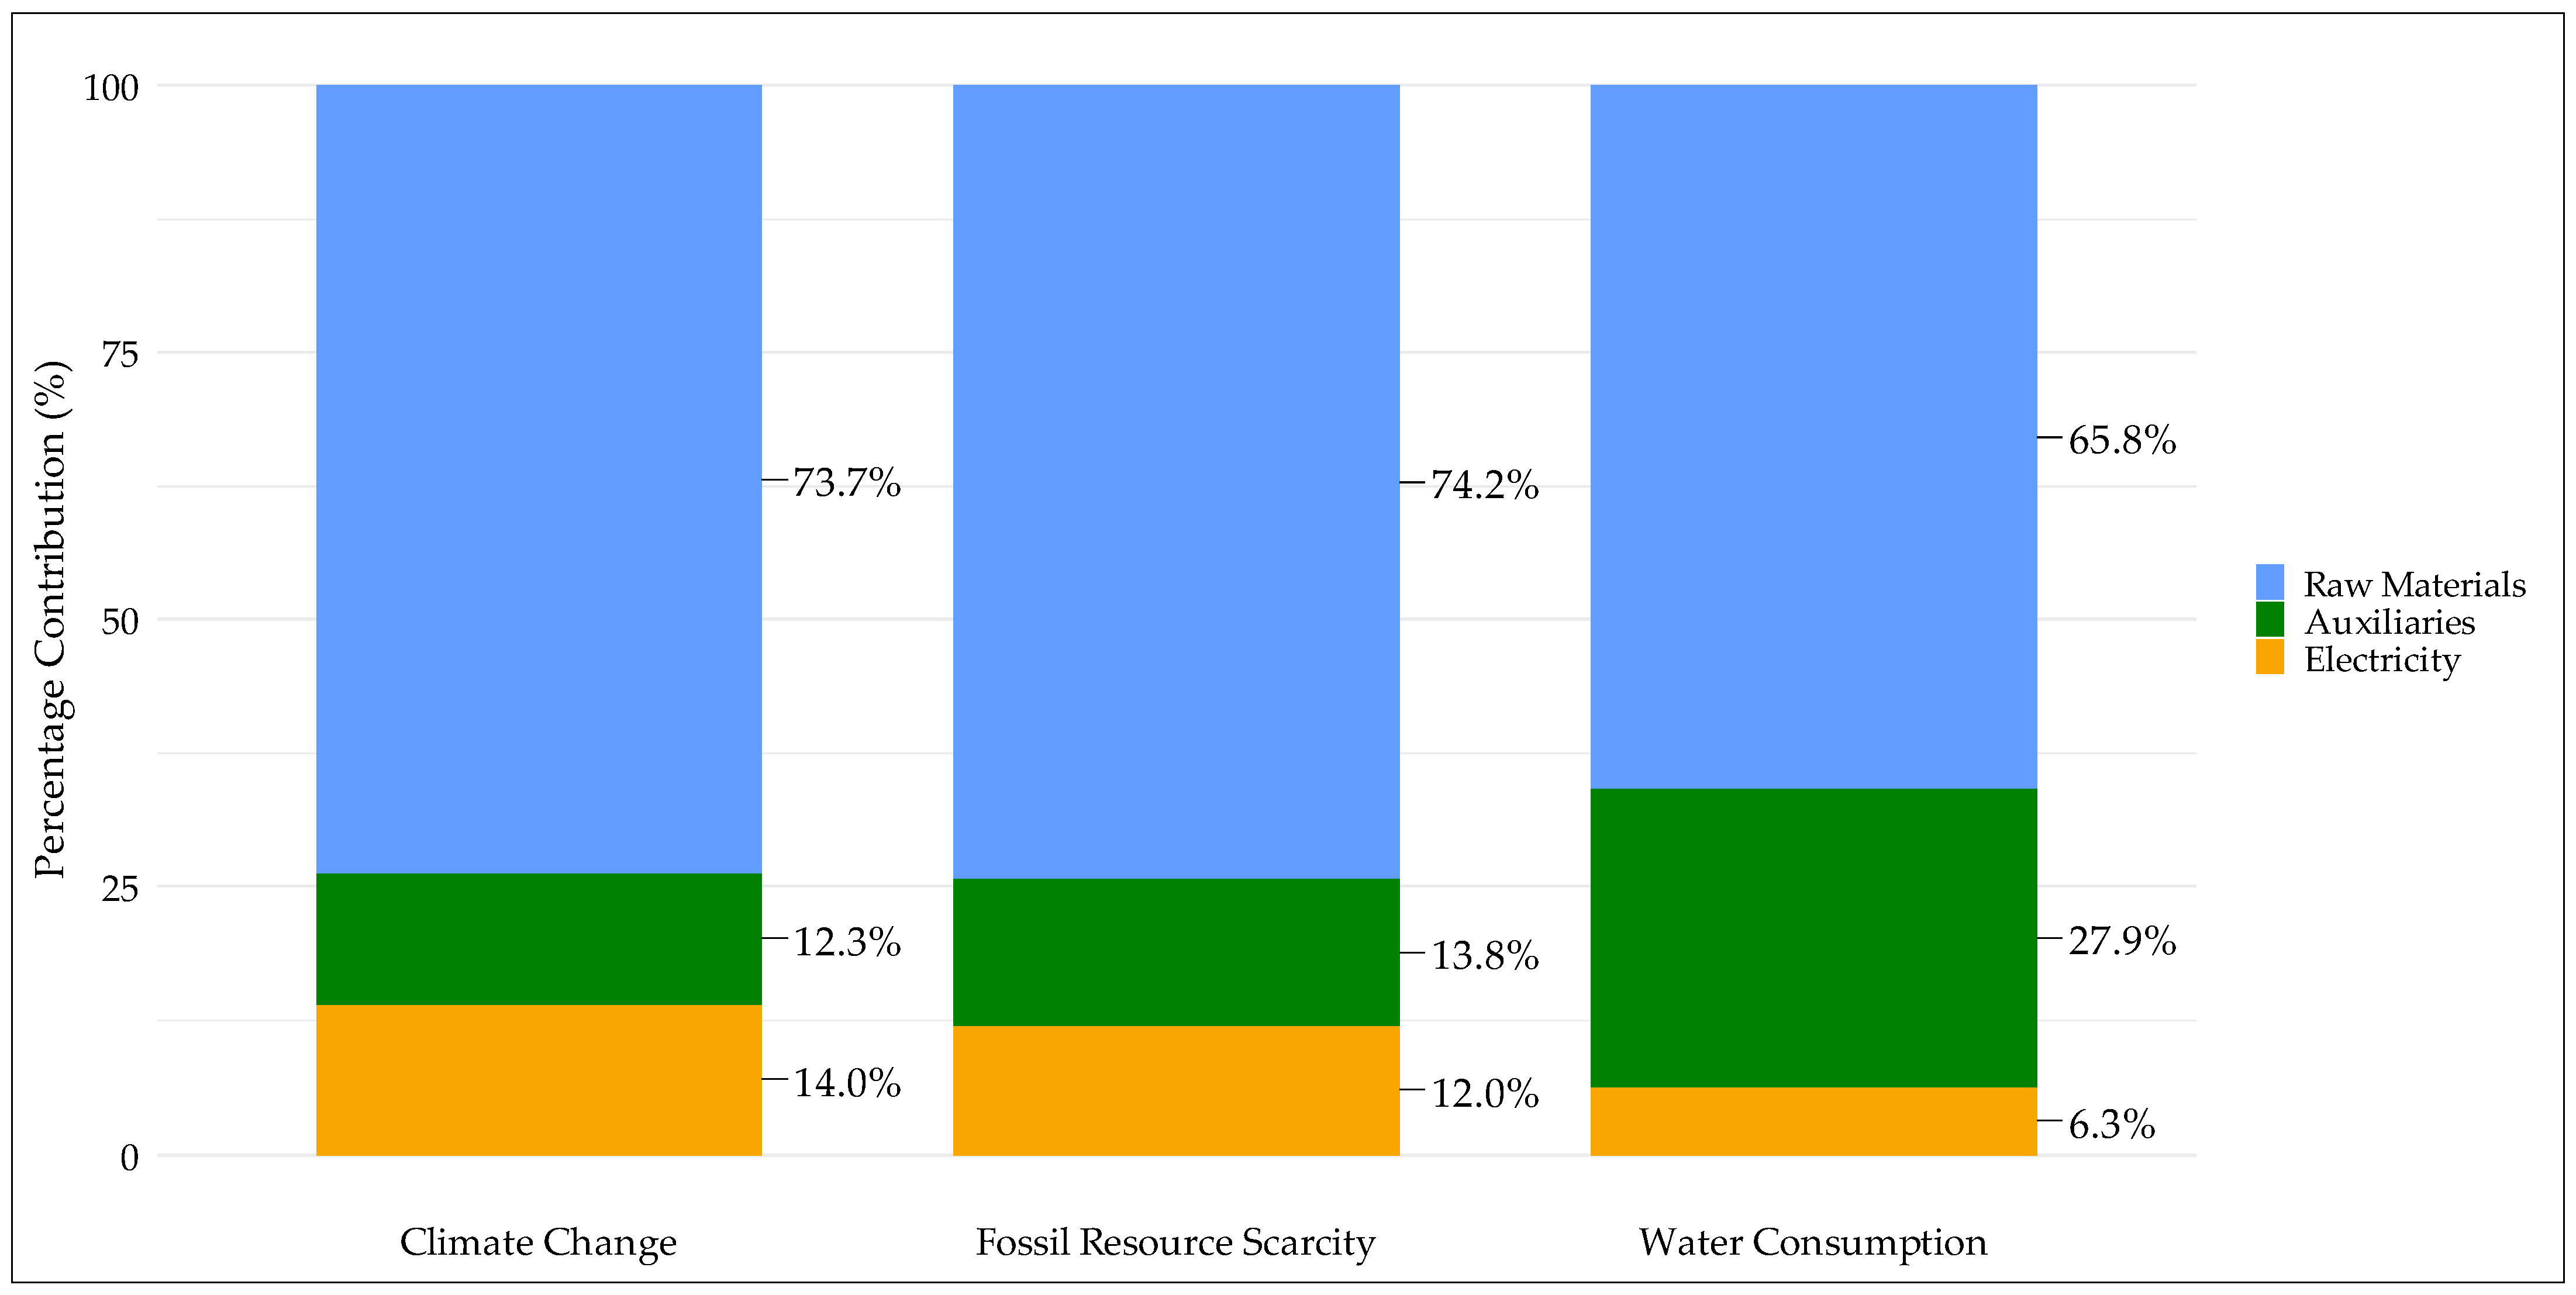
The breakdown of contributions by life cycle stage, presented in
Table 2, highlights that raw materials remain the dominant contributor to environmental impacts. However, in contrast to the baseline scenario, the relative contribution of raw materials is lower, reflecting the efficiency improvements introduced by IS. Notably, electricity and auxiliary processes exhibit less pronounced impacts, underscoring the effectiveness of energy-efficient technologies and material recovery within the CORALIS framework.
A visual representation of these results is provided in
Figure 5, illustrating the contribution of each life cycle stage to climate change, fossil resource scarcity, and water consumption in the CORALIS scenario.
Furthermore, the implementation of symbiotic exchanges enables additional reductions in Scope 3 emissions, further enhancing the sustainability profile of the system. Future research could explore alternative IS configurations, such as waste-to-energy integration or circular feedstock loops, to maximize the potential benefits identified in this assessment.
4.1.3. Comparative Assessment
The CORALIS approach demonstrates substantial environmental benefits compared to the conventional baseline scenario, with significant reductions observed across all impact categories. The LCA results, summarized in
Table 3, reveal that the largest improvement occurs in water consumption, which decreases by 82.6%, followed by climate change (76.5%) and fossil resource scarcity (77.9%).
These results underscore the effectiveness of IS strategies in reducing material demand, improving process efficiency, and minimizing emissions throughout the life cycle of KNO
3 production. In addition to the key impact categories discussed, the full characterization results for all ReCiPe midpoint impact categories are provided in the
Supplementary Materials: Tables S5 and S6. These include detailed values for both the baseline and CORALIS scenarios, enabling a complete assessment of all potential environmental trade-offs and burden-shifting effects.
The relative reductions achieved in the CORALIS scenario can be attributed to the following causes:
Decreased raw material consumption: The integration of resource-sharing strategies significantly reduces the extraction and processing of virgin materials, leading to lower emissions and resource depletion across all categories.
Optimized energy consumption: The implementation of process optimization and heat recovery mechanisms results in a lower overall energy demand, thereby reducing greenhouse gas (GHG) emissions and fossil resource use.
Minimized process auxiliary requirements: Enhanced material circularity within the system reduces the demand for chemicals and water-intensive operations, directly contributing to lower water consumption and emissions.
The most significant reduction is observed in water consumption, which decreases by 82.6% due to enhanced material circularity and reduced process water demand. Similarly, fossil resource scarcity is reduced by 77.9%, largely attributed to lower virgin material usage and optimized energy consumption.
A direct visual comparison of these reductions is provided in
Figure 6, illustrating the extent to which the CORALIS scenario reduces water consumption and fossil resource scarcity compared to the baseline scenario.
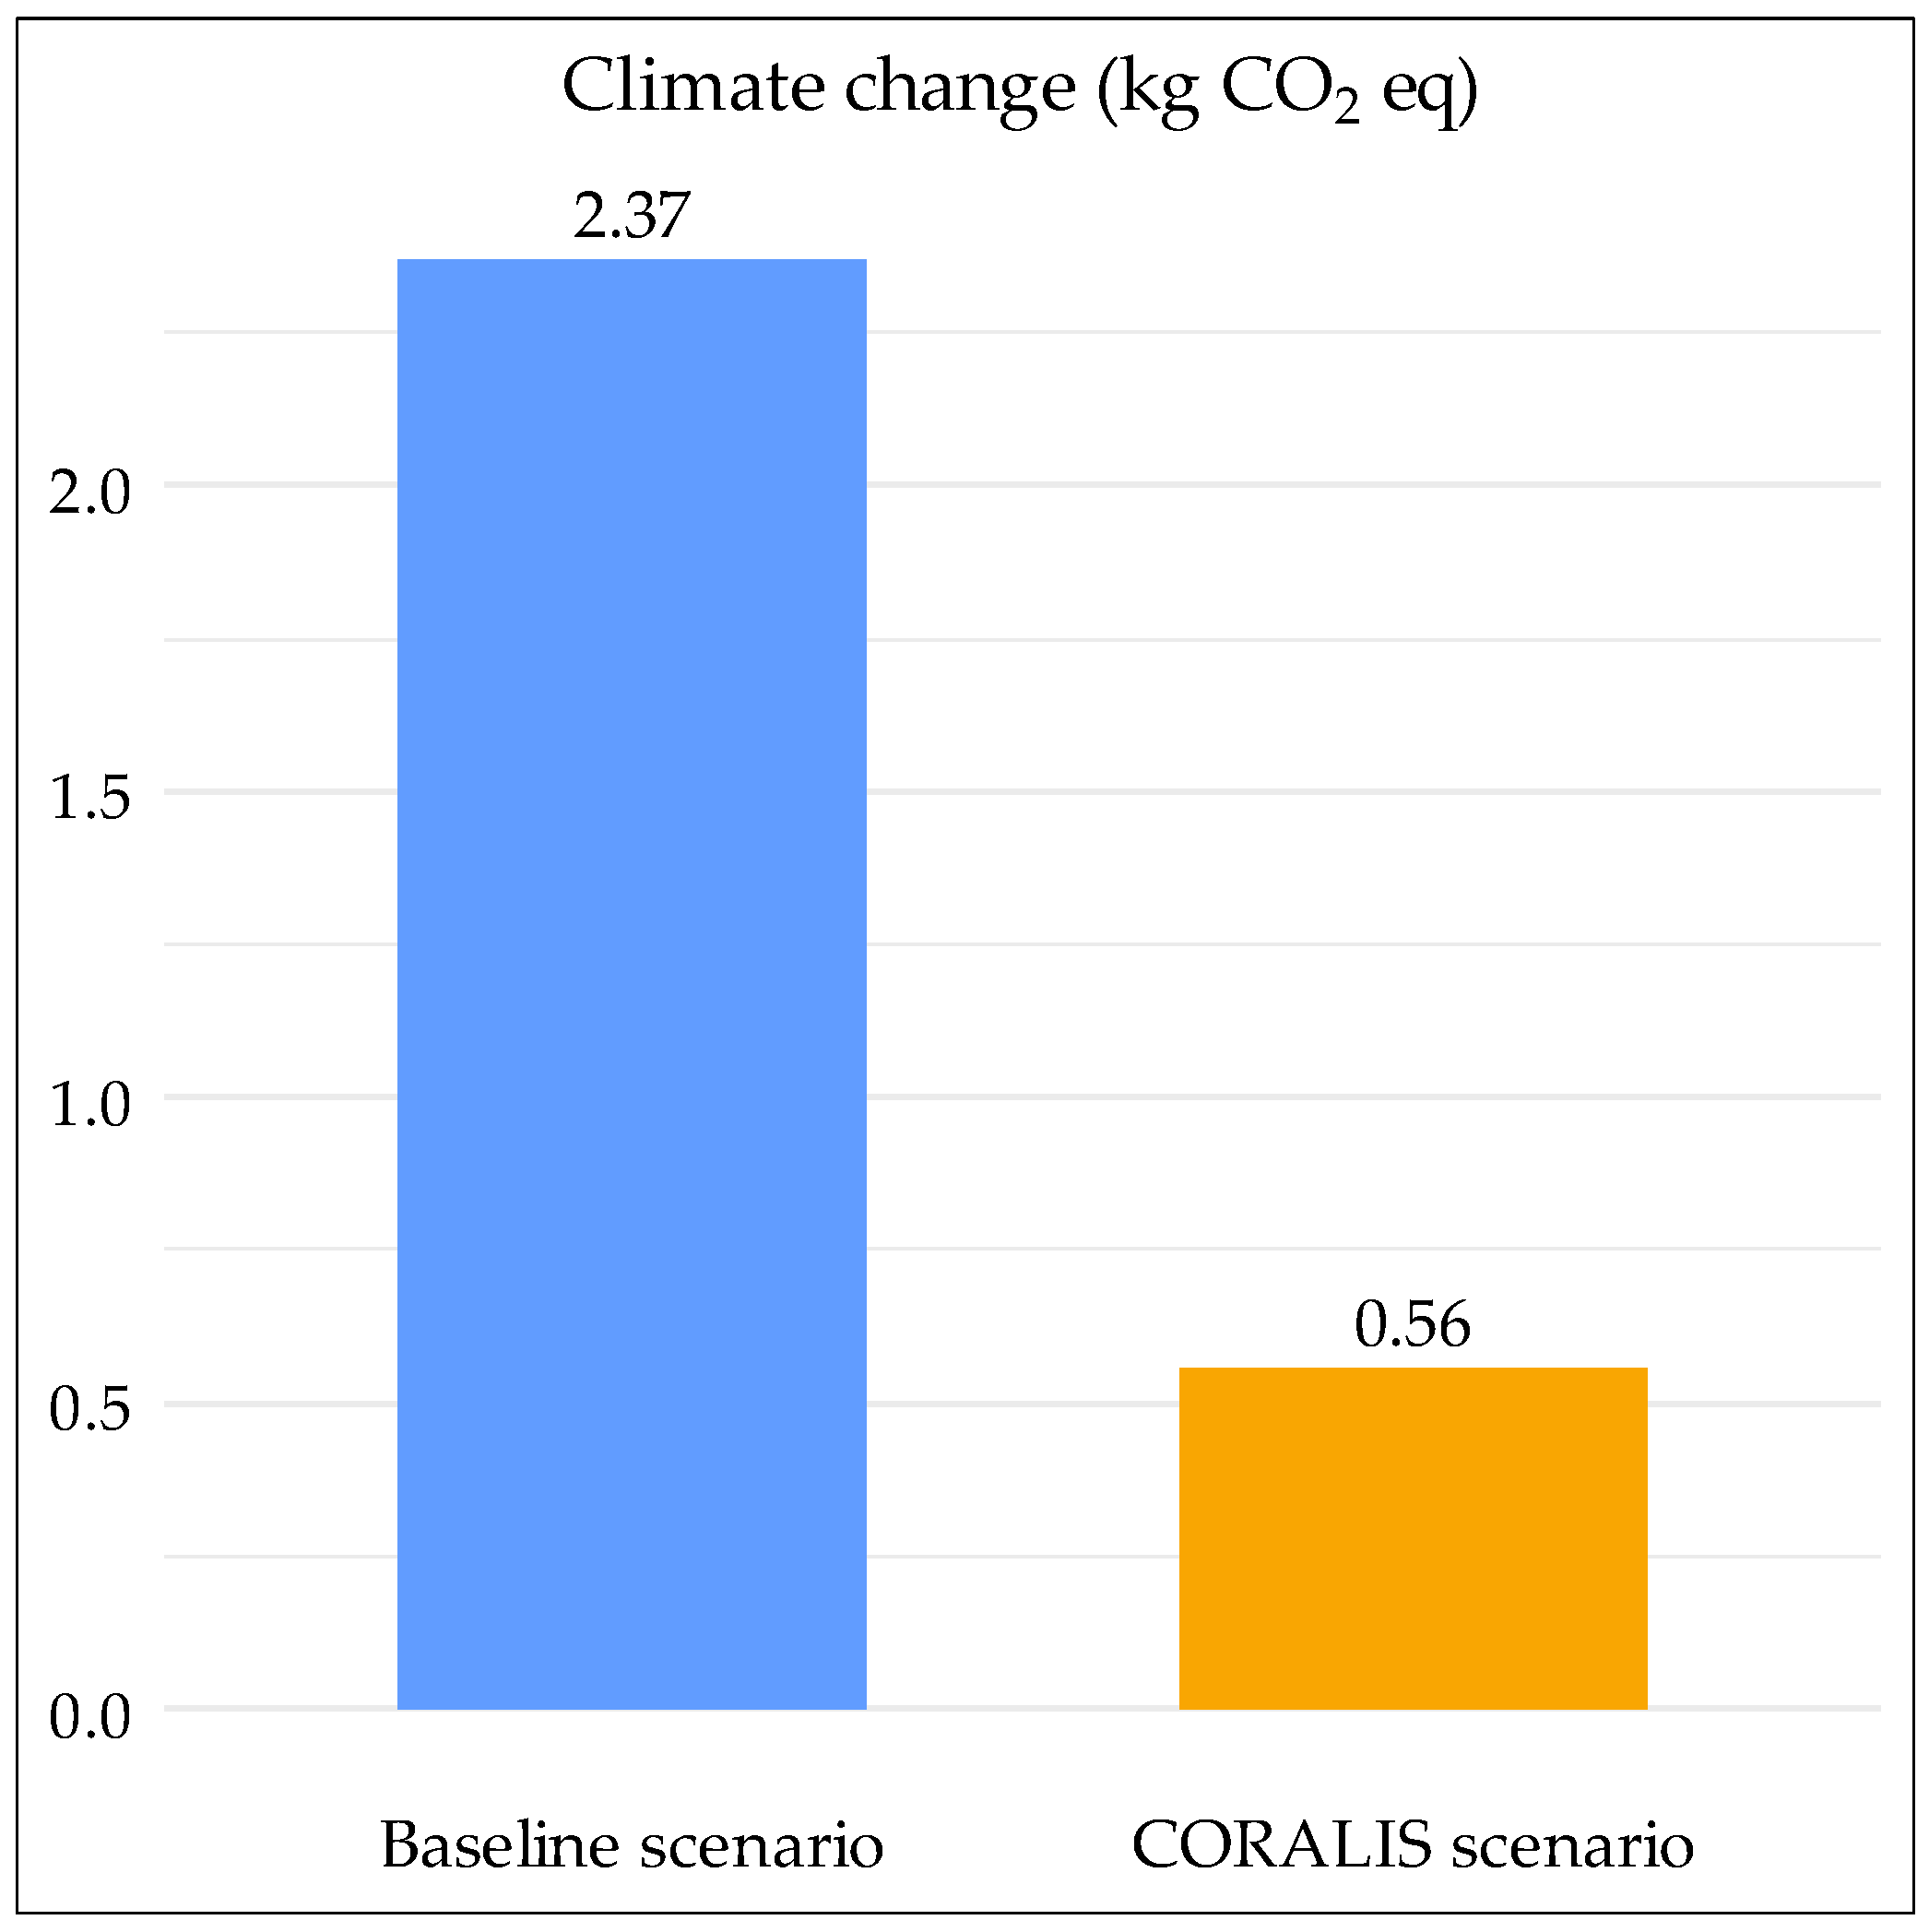
The GHG emissions reduction observed in the CORALIS scenario stems from a combination of process optimization, energy efficiency improvements, and reduced reliance on virgin raw materials. One of the most significant contributions to this reduction is the decreased dependency on fossil fuels, achieved through the optimization of material flows and the valorization of by-products. These strategies help mitigate both direct and indirect CO2 emissions, as they reduce the extraction, processing, and transportation of raw materials, which are traditionally among the largest contributors to the carbon footprint of KNO3 production.
Another key factor in lowering climate impact is the implementation of high-efficiency ion-exchange technologies in the CORALIS scenario. These technologies not only enhance process performance and product purity but also reduce the energy intensity of KNO3 synthesis. By integrating heat recovery systems and minimizing process losses, the system achieves a lower overall energy demand, directly translating into a reduced carbon footprint associated with electricity and thermal energy consumption.
These combined effects lead to a significant reduction in the carbon intensity of KNO3 production, reinforcing the strategic role of industrial symbiosis in industrial climate action plans and demonstrating its potential for scaling up sustainable solutions in the chemical sector.
A visualization is provided in
Figure 7, which focuses exclusively on climate change (kg CO
2 eq) to emphasize the absolute impact difference between the baseline and CORALIS scenarios.
This representation is crucial for understanding how process redesign and IS integration drive tangible climate benefits, complementing the holistic perspective of sustainability assessed in this study.
The findings in this study align with prior research highlighting the advantages of integrating IS strategies into chemical manufacturing systems. For example, studies reported significant environmental improvements in industrial symbiosis networks, particularly reductions in climate change impact and fossil resource depletion due to resource sharing, waste valorization, and process integration [
15,
38]. These findings are in line with the 76.5% reduction in climate change impacts achieved in the CORALIS scenario, which falls within the range of 50–80% reported in established IS clusters across Europe and Asia [
8].
The observed reductions in raw material use and water consumption in this study also align with previous IS case studies in fertilizer and chemical industries, where symbiotic exchanges reduced reliance on virgin inputs and improved water circularity. For instance, ref. [
4] demonstrated improved resource efficiency through process intensification in potassium nitrate synthesis, although their scope did not include systematic IS strategies or life cycle perspectives.
4.2. Life Cycle Cost Analysis
The economic performance of the redesigned KNO3 production process was analyzed through a LCC framework, comparing a conventional and a symbiosis-based scenario. The analysis was carried out from a cradle-to-gate perspective, incorporating CAPEX, OPEX, maintenance, labor, and IS-related cost savings, with all values annualized and discounted over a 30-year operational period.
4.2.1. Capital Expenditures
CAPEX includes infrastructure, equipment, installation, and engineering costs for both scenarios (
Table 4). The new reactor requires a higher initial investment due to advanced process technology but is expected to yield long-term benefits. The total CAPEX for the baseline scenario amounts to 789,354.58 €, whereas the CORALIS scenario presents a significantly higher investment of 2,643,571.45 €. This increase is primarily attributed to the acquisition of high-performance equipment, advanced instrumentation, and the adaptation of existing infrastructure to accommodate the new technology.
The integration of instrumentation and control in the baseline scenario was estimated proportionally based on the Equipment Procurement costs in both scenarios.
A comparative visualization of CAPEX distribution between both scenarios is presented in
Figure 8, highlighting the key cost differences.
4.2.2. Operational Expenditures
OPEX was estimated considering the costs associated with raw materials, utilities (electricity, water, steam, and gas), and labor. The baseline scenario relies on a traditional KNO3 production process, which exhibits high material and energy consumption but does not generate valuable co-products. In contrast, the CORALIS scenario incorporates process improvements that enhance efficiency, reduce energy use, and introduce a secondary product (HCl), which can be utilized within the industrial symbiosis framework.
As shown in
Table 5, the implementation of the CORALIS scenario leads to a drastic reduction in KCl consumption due to improved reaction efficiency. The new configuration also eliminates the need for NH
4NO
3, which significantly reduces material expenses. However, this is partially offset by the introduction of new reactants such as KOH and HNO
3.
Furthermore, utilities consumption changes considerably between both scenarios. Steam and electricity requirements are significantly reduced in CORALIS due to optimized reaction conditions and heat recovery strategies. Additionally, process water demand is significantly lower in the new scenario, contributing to water conservation efforts. However, due to process modifications, natural gas consumption is no longer required.
The overall OPEX in the CORALIS scenario is considerably lower, amounting to approximately 10 million euros over 30 years, compared to 437 million euros in the baseline scenario. This drastic reduction highlights the potential economic advantages of implementing industrial symbiosis strategies.
Potential Cost Savings:
The most significant savings are associated with the reduced demand for raw materials, particularly KCl and NH4NO3, which constitute the major cost drivers in the baseline scenario.
Energy efficiency improvements contribute to additional savings, with reductions in steam and electricity consumption.
The introduction of HNO3 and KOH incurs additional costs in the CORALIS scenario, but these are outweighed by the overall efficiency gains and process integration benefits.
These results emphasize that industrial symbiosis strategies not only enhance environmental sustainability but also lead to substantial cost reductions, making them economically viable for long-term industrial operations.
4.2.3. Externality Costs
To complement the LCC analysis, an environmental life cycle costing (eLCC) approach was applied to monetize the environmental externalities associated with KNO3 production in both scenarios. This methodology enables the integration of non-market environmental damages—such as greenhouse gas emissions, resource depletion, and water use—into the economic assessment, providing a more holistic view of the system’s long-term sustainability.
Table 6 presents the external costs calculated for three key impact categories: climate change (GWP), fossil resource scarcity (FFP), and water consumption (WCP). Unitary externality factors were taken from the European Commission’s Environmental Footprint recommendations: 0.13 €/kg CO
2-eq for climate change, 0.028 €/kg oil-eq for fossil resource use, and 0.407 €/m
3 for water consumption.
As observed, the CORALIS scenario yields significantly lower external costs—reducing climate-related damages by over 76%, fossil resource-related impacts by 78%, and water consumption impacts by 82%. These results reinforce the environmental benefits of the IS-based process redesign, demonstrating that beyond economic savings, the new configuration contributes substantially to minimizing environmental burdens. Incorporating these values into the broader LCC framework strengthens the case for industrial symbiosis as a strategy aligned with circular economy principles and climate mitigation goals.
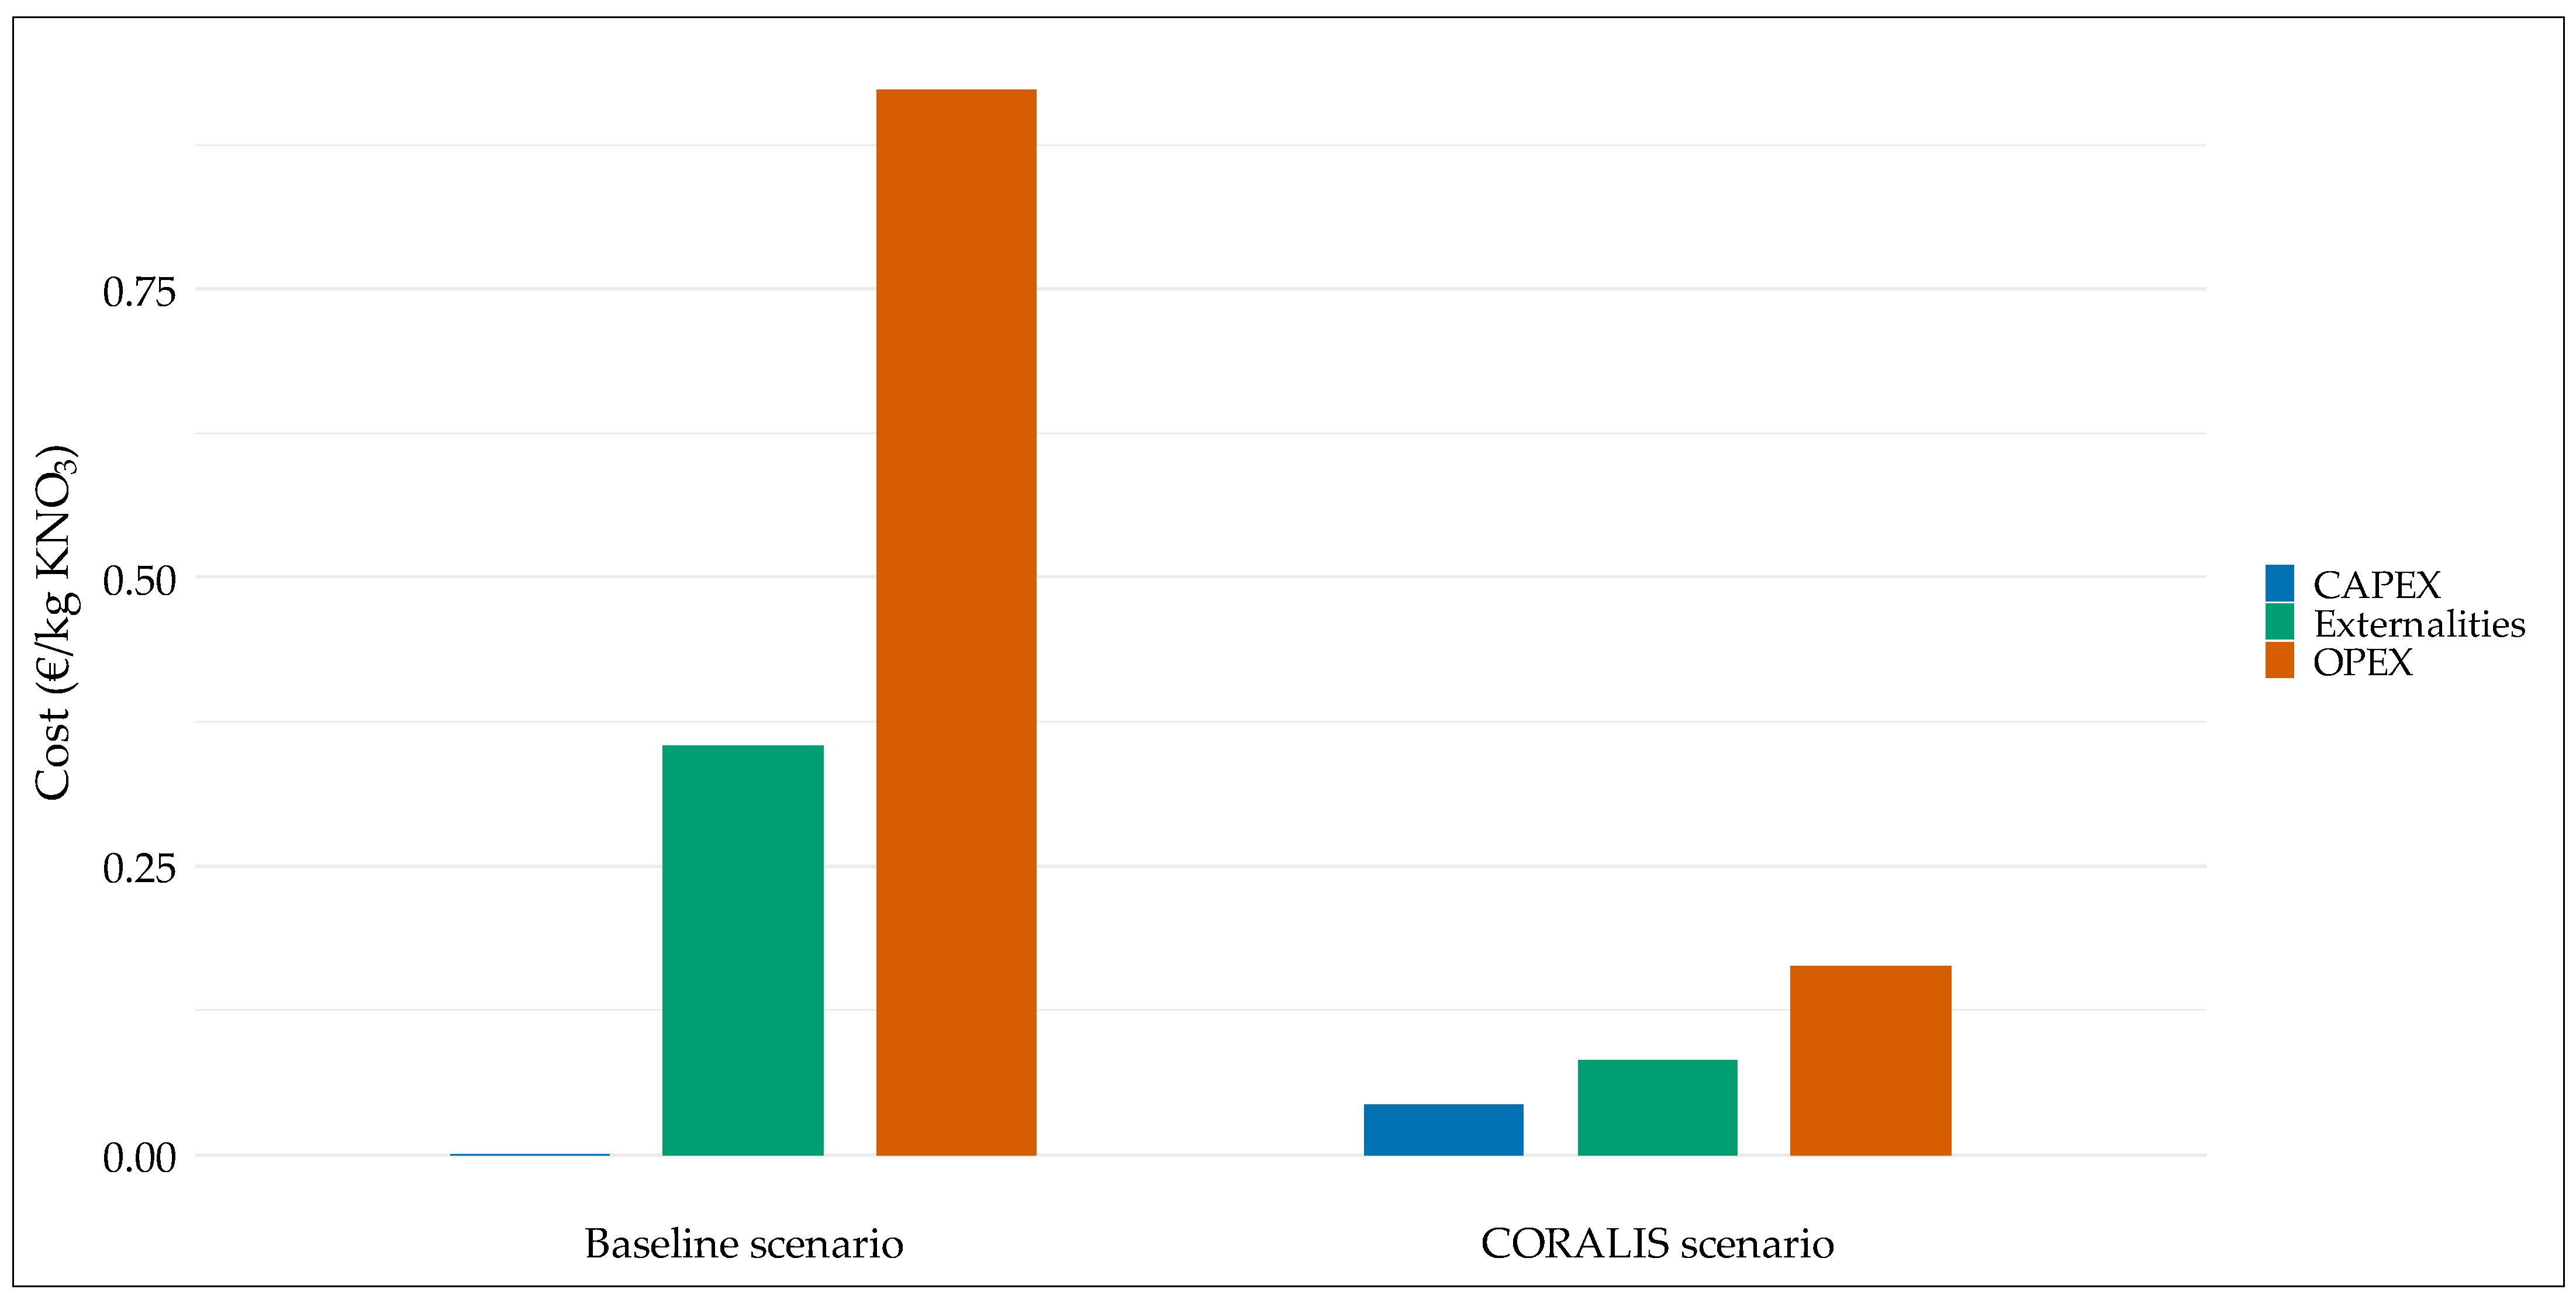
4.2.4. Comparison of Scenarios per Functional Unit
To enable a fair comparison between the two scenarios, both the CAPEX, OPEX, and environmental externalities were normalized per the functional unit, defined as 1 kg of KNO3 produced over the 30-year project lifetime.
The total production across the lifetime of the plant was calculated for each case. In the baseline scenario, with an annual output of 15,804 tons, the total production over 30 years is 474,120 tons. In the CORALIS scenario, the annual output is 2055.6 tons, resulting in a lifetime production of 61,668 tons.
Based on this, the CAPEX, OPEX, and external costs were normalized per kg of KNO
3 and summarized in
Table 7 and
Figure 9.
Despite the higher initial investment in the CORALIS scenario (+3192%), the significant reduction in operational expenditures (−82%) and environmental externalities (−76.9%) leads to a substantially lower total cost per kilogram of KNO3. When environmental externalities are considered, the total eLCC is reduced by 77.5%, reinforcing the benefits of the CORALIS configuration.
This result highlights the techno-economic and environmental feasibility of implementing IS strategies in fertilizer production processes. Integrating externalities into cost assessments ensures a more comprehensive evaluation, aligning industrial decision-making with circular economy principles and climate policy objectives.
In terms of economic performance, the 77.7% reduction in total production cost per kg of KNO
3 achieved under the CORALIS configuration supports existing prior evidence that IS can contribute to long-term cost-effectiveness. Similar results have been reported in LCC-based analyses of cement and basic chemical clusters where symbiotic exchanges led to stabilized energy costs and reduced raw material dependency [
32].
Unlike most previous studies, which focus either on environmental performance or on economic indicators alone, our integrated LCA–LCC approach provides a dual perspective. The monetization of environmental externalities through eLCC further strengthens the analysis and aligns with recent methodological advances in sustainability assessment [
25].
The integration of IS into potassium nitrate production yields clear advantages across environmental and economic dimensions. While the CORALIS configuration involves significantly higher initial investment costs—primarily due to advanced reactor technology and instrumentation—these are offset by long-term reductions in operational expenses and environmental externalities. The monetized environmental externalities further reinforce the robustness of the proposed approach [
25,
32], demonstrating a 77.5% reduction in total eLCC.
4.3. Implications, Limitations and Future Work
From a policy perspective, these results underscore the potential of IS as a tool to support circular economy transitions and compliance with European Green Deal and Science-Based Targets (SBTi) [
39,
40,
41]. The alignment of eLCC results with environmental impact reductions provides a strong case for integrating IS into industrial policy instruments, subsidies, and decarbonization strategies.
Despite the promising results, certain limitations must be acknowledged. First, the current analysis does not include sensitivity or uncertainty analyses, which could help assess the robustness of the conclusions under varying economic and technological assumptions. Second, this study focuses on a single symbiotic configuration and does not explore alternative valorization pathways for by-products such as HCl.
Additionally, the proposed system relies on technologies that, while innovative, may still be in the early stages of maturity (low to medium TRL). This introduces a degree of technological uncertainty regarding long-term performance, scalability, and reliability, which should be addressed in future demonstrations or pilot projects.
Another important consideration is the dependency on specific industrial partners for the exchange of resources. Although the symbiotic configuration shows clear advantages under current conditions, the continuity and resilience of such systems may be affected if one or more partners cease operations, modify their production processes, or are unable to maintain the required by-product flows. Future research should explore fallback supply scenarios, redundancy strategies, or decentralized symbiosis models to mitigate these risks.
Furthermore, the exclusion of decommissioning and end-of-life costs in the CAPEX estimation, while justified by the scope, could lead to underestimation in full life cycle evaluations. Future studies should expand the system boundary to include reuse, recycling, or dismantling phases [
42], especially in integrated industrial parks.
Finally, broader system-level impacts, such as job creation, supply chain resilience, and regional economic stimulation, were not assessed. Including socio-economic metrics in future studies would enrich the sustainability assessment and strengthen stakeholder engagement and policy relevance [
43].
5. Conclusions
This study conducted a comprehensive LCA, LCC, and eLCC to compare a conventional KNO3 production process (baseline scenario) with an improved configuration integrating IS strategies (CORALIS scenario). The findings highlight the substantial environmental and economic benefits derived from implementing IS in chemical manufacturing.
From an environmental standpoint, the CORALIS scenario achieved significant reductions in the three main impact categories: climate change (−76.5%), fossil resource scarcity (−77.9%), and water consumption (−82.6%). These improvements are primarily attributed to enhanced resource efficiency, substitution of raw materials, energy optimization, and the valorization of by-products such as HCl, which would otherwise require virgin resources to be produced.
Economically, the CORALIS configuration demonstrated a markedly lower total LCC despite requiring a higher initial capital investment (+3192%). The normalized OPEX was reduced by 82%, yielding an overall cost reduction of 77.7% per kg of KNO3. When environmental externalities were monetized and included in the assessment, the total eLCC showed a 77.5% reduction compared to the baseline. This reinforces the financial viability of IS when broader sustainability criteria are considered.
The integration of external cost factors, such as the social cost of carbon emissions, fossil fuel depletion, and water use, adds an important layer of completeness to traditional economic evaluations. The eLCC approach used in this study provides decision-makers with a more realistic perspective on the long-term sustainability and profitability of cleaner production strategies.
While this study is based on specific pilot implementation, its methodological contributions and systemic perspective offer broader applicability. The integration of LCA, LCC, and eLCC in evaluating industrial symbiosis strategies provides a replicable framework that can support decision-making in other industrial settings. Moreover, the insights gained from the valorization of by-products, reduction of environmental burdens, and economic benefits can inform similar strategies in fertilizer and chemical clusters, contributing to the long-term goal of industrial decarbonization and circular economy transitions.
In conclusion, the CORALIS approach proves to be a viable and replicable model for sustainable industrial transformation, particularly in resource- and energy-intensive sectors like the chemical industry. The results underscore the relevance of IS in supporting the transition toward circular economy practices and aligning industrial operations with climate mitigation goals. Future research should further explore the integration of IS with renewable energy systems and broader supply chain dynamics to enhance systemic sustainability across industrial networks.


 ,
, 


