2. System Configuration and Design
The hybrid energy system comprises four basic components: solar PV systems, wind energy conversion systems (WECSs), battery storage systems (BSSs), and microturbine (MT). This section relates to the complete design of the system, its connection, and mathematical modeling in conjunction with how effectively it is able to control energy in different operational conditions. This hybrid energy system conducts nonstop power generation and delivery by incorporating different types of technologies. It has a 15 kw solar PV system that has been designed to be reliable enough and efficient under different solar irradiance conditions. It consists of an additional part, which is a 15-kilowatt wind energy conversion system designed to efficiently harness wind energy for different wind speed runs. The energy-storing component of this system is the 100 amp hour battery, which is meant to stabilize the load. Power outages are avoided through the backup supplied by the 30 kw microturbine, which is operational when the load is high or renewable energy production is inadequate. An intricate Energy Management System (EMS) manages the entire centralized DC bus within those components. Benefits extend to improving the overall efficiency and reliability of the system, with reduced energy losses, while ensuring the effective control of loads. The overall basic structure of the hybrid energy management standalone system is shown in
Figure 2.
2.1. Solar PV System
The solar PV system converts solar irradiance into electrical energy [
35,
36]. The output power of a PV module is governed by its characteristic equation, as given in Equation (1):
where:
: photo-generated current (A).
: saturation current of the diode (A).
: electron charge (1.6 × 10⁻¹⁹ C).
: output voltage of the module (V).
: series resistance (Ω).
: shunt resistance (Ω).
: diode ideality factor.
: Boltzmann constant (1.38 × 10⁻²³ J/K).
: temperature of the module (K).
Information about the solar PV system is provided in
Table 2. The maximum power point is tracked using MPPT techniques like Perturb and Observe (P&O) and Incremental Conductance (INC) to optimize efficiency under varying irradiance conditions. The total power output of the PV array is given by Equation (2):
Implementation of Maximum Power Point Tracking (MPPT) for Solar PV
The maximum power point tracking (MPPT) technique is implemented in the solar PV system to ensure that the system operates at its maximum power point (MPP) under varying solar irradiance and temperature conditions. The MPPT algorithm continuously adjusts the operating voltage of the PV array to maximize power output.
The Perturb and Observe (P&O) method is used for MPPT in this study. The P&O algorithm works by periodically perturbing (increasing or decreasing) the PV array voltage and observing the resulting change in power output. If the power output increases, the algorithm continues to perturb the voltage in the same direction. If the power output decreases, the algorithm reverses the direction of the perturbation. This process continues until the MPP is reached.
The mathematical representation of the P&O algorithm is as follows:
Measure the current voltage and current of the PV array.
Calculate the power
Compare with the previous power .
If , continue perturbing the voltage in the same direction.
If , reverse the direction of the voltage perturbation.
This method ensures that the PV system operates at its maximum efficiency, even under rapidly changing environmental conditions.
2.2. Wind Energy Conversion System (WECS)
The WECS captures wind energy and converts it into electrical energy [
37,
38]. The mechanical power output of the wind turbine is expressed in Equation (3):
where:
: air density (1.225 kg/m3).
: rotor swept area (m2).
: power coefficient, function of tip-speed ratio and pitch angle .
: wind speed (m/s).
Implementation of Tip-Speed Ratio (λ) Optimization for WECS
The tip-speed ratio optimization is implemented in the wind energy conversion system (WECS) to maximize the power output of the wind turbine. The tip-speed ratio is defined as the ratio of the speed of the rotor blades to the speed of the wind. It is a critical parameter that determines the efficiency of the wind turbine.
The tip-speed ratio
is calculated as in Equation (4):
where:
: angular velocity of the rotor
: radius of the turbine blades .
: wind speed .
To optimize , the WECS uses a Perturb and Observe (P&O) method similar to the one used in the solar PV system. The algorithm adjusts the rotor speed to maintain the optimal tip-speed ratio, ensuring maximum power extraction from the wind.
The steps for optimization are as follows:
Measure the current wind speed and rotor speed .
Calculate the current tip-speed ratio .
Compare with the optimal tip-speed ratio .
If , increase the rotor speed.
If , decrease the rotor speed.
This optimization ensures that the wind turbine operates at its maximum efficiency, regardless of variations in wind speed.
Table 3 presents the specification of WECS.
2.3. Battery Storage System (BSS)
The BSS smooths power fluctuations and stores surplus energy [
20,
29]. The state of charge (SOC) of the battery is modeled as in Equation (5):
where:
: battery state of charge at time t.
: charging and discharging efficiency.
: charging and discharging power (W).
: battery energy capacity (Wh).
: time interval (h).
The battery operates between
and
to avoid overcharging or deep discharge.
Table 4 provides information on specifications used in the battery storage system.
2.4. Microturbine
The MT serves as a backup energy provider whenever renewable power generation cannot meet the demand [
21,
22].
Table 5 shows a detailed specification list for the microturbine system. The microturbine output power depends on its input fuel energy and operational efficiency according to Equation (6):
where
is the efficiency of the microturbine and
is the fuel power input.
2.5. Boost Converter Configuration
The boost converter plays a crucial role in the hybrid energy system by stepping up the voltage from lower levels generated by the renewable energy sources (Solar PV and WECS) to the desired DC bus voltage [
30,
31]. This ensures efficient integration and compatibility of the sources within the hybrid system. The output voltage of the boost converter is given by Equation (7):
where:
: output voltage.
: input voltage from the PV or WECS.
: duty cycle of the switching signal (0 < < 1).
2.6. Bidirectional Converter
The bidirectional converter is integral to the battery storage system (BSS), enabling energy flow in both directions to charge and discharge the battery depending on the system requirements [
32,
33]. It facilitates energy management and stabilizes the DC bus voltage during dynamic load and generation conditions.
Boost Mode (Discharging): The converter steps up the battery voltage to match the DC bus voltage during discharging, as given in Equation (8):
Buck Mode (Charging): The converter steps down the DC bus voltage to charge the battery efficiently, as given in Equation (9):
where:
: DC bus voltage.
: battery voltage.
2.7. Energy Management System (EMS)
The hybrid energy system integrates solar PV, wind energy conversion system (WECS), battery storage (BSS), and microturbine (MT) through a centralized Energy Management System (EMS). The EMS prioritizes renewable energy sources (solar and wind) to meet load demand, stores surplus energy in the battery, and activates the microturbine only when renewable sources and battery storage are insufficient. This integration ensures balanced power distribution, minimizes power losses, and maintains system reliability under varying environmental and load conditions.
The objective of the Energy Management System is to minimize power losses while ensuring system dependability by ensuring appropriate power distribution [
17,
34]. The power balance equation is given by Equation (10):
where:
: total load power (W).
: power losses in the system (W).
2.8. Simulation Parameter
For precise modeling and performance evaluation under actual operating conditions, the Energy Management System (EMS) simulation depends on accurately specified parameters. A summary of the main simulation parameters used in this study is given in
Table 6.
The system follows priority rules for energy dispatch: solar PV and wind energy are prioritized first to meet load demand, utilizing renewable sources. Surplus energy is stored in the battery, which is discharged during low renewable generation. The microturbine is activated only when renewable sources and battery storage are insufficient, ensuring minimal reliance on non-renewable energy and optimal resource utilization.
2.9. Load Parameter
By establishing a balance between the energy supply and the fluctuating needs of dynamic operating situations, the Energy Management System (EMS) efficiently controls both AC and DC load profiles [
40,
41]. The sample load parameters used to evaluate the system’s performance are listed in
Table 7.
The efficiency of different systems in the hybrid energy setup is as follows: the solar PV system operates at 22% efficiency, converting solar irradiance to electrical energy, while the wind energy conversion system (WECS) achieves 45% efficiency in harnessing wind power. The battery storage system (BSS) has a round-trip efficiency of 95% for charging and discharging, and the microturbine (MT) operates at 85% efficiency in converting fuel to electrical energy. The inverter efficiency ranges from 95% for DC to AC conversion, contributing to an overall system efficiency of 90%, accounting for all losses. These metrics ensure optimal performance and reliability of the hybrid energy system.
3. Methodology
Quantum-Inspired Multiverse Optimisation (QI-MVO) is a potent and sophisticated optimization tool based on unified physics and multiverse theory. This method has shown commendable results in the optimality of Energy Management Systems (EMS) in hybrid energy systems comprising renewable energy sources, energy storage devices, and turbine-based backup generators. The hybrid energy system under consideration for this study comprises a microturbine (MT), battery storage system (BSS), wind energy conversion system (WECS), and solar photovoltaic (PV) system. The objectives include minimizing power losses, achieving balanced power distribution and improving reliability, and optimizing the interaction of all these elements.
The Energy Management System (EMS) employs a rule-based control strategy to prioritize renewable energy sources (solar PV and wind) over non-renewable sources (microturbine) and utilizes battery storage to smooth power fluctuations. For scenarios with high uncertainty, the EMS incorporates fuzzy logic to make adaptive decisions based on real-time data, ensuring optimal energy dispatch and system stability under varying conditions. The system follows priority rules for energy dispatch: solar PV and wind energy are prioritized first to meet load demand, utilizing renewable sources. Surplus energy is stored in the battery, which is discharged during low renewable generation. The microturbine is activated only when renewable sources and battery storage are insufficient, ensuring minimal reliance on non-renewable energy and optimal resource utilization.
During peak demand, the battery storage system (BSS) and microturbine (MT) work together to ensure continuous power supply. The BSS discharges stored energy to meet the load demand, while the microturbine is activated if the battery’s state of charge (SOC) falls below a predefined threshold (i.e., 20%). This ensures that the system can handle high demand without interruptions.
3.1. QI-MVO Optimization Process
3.1.1. Initialization
The initial phase of the QI-MVO algorithm is to generate a population of potential solutions, or “universes”. Every universe represents a possible arrangement for the distribution of electricity among the four elements: microturbine, solar PV, wind, and battery storage. These universes’ starting locations are dispersed at random throughout the specified search space to make sure that the solutions are diverse. The initialization equation is given by Equation (11):
where:
: the position of the -th universe in the -th dimension.
: lower and upper bounds for the -th dimension (representing power values from solar, wind, battery, or microturbine).
: random number between 0 and 1.
3.1.2. Fitness Function
The fitness function evaluates the quality of each solution based on power loss and efficiency, as shown in Equation (12):
where:
are the power outputs from the solar, wind, battery, and microturbine at time .
is the total load demand at time .
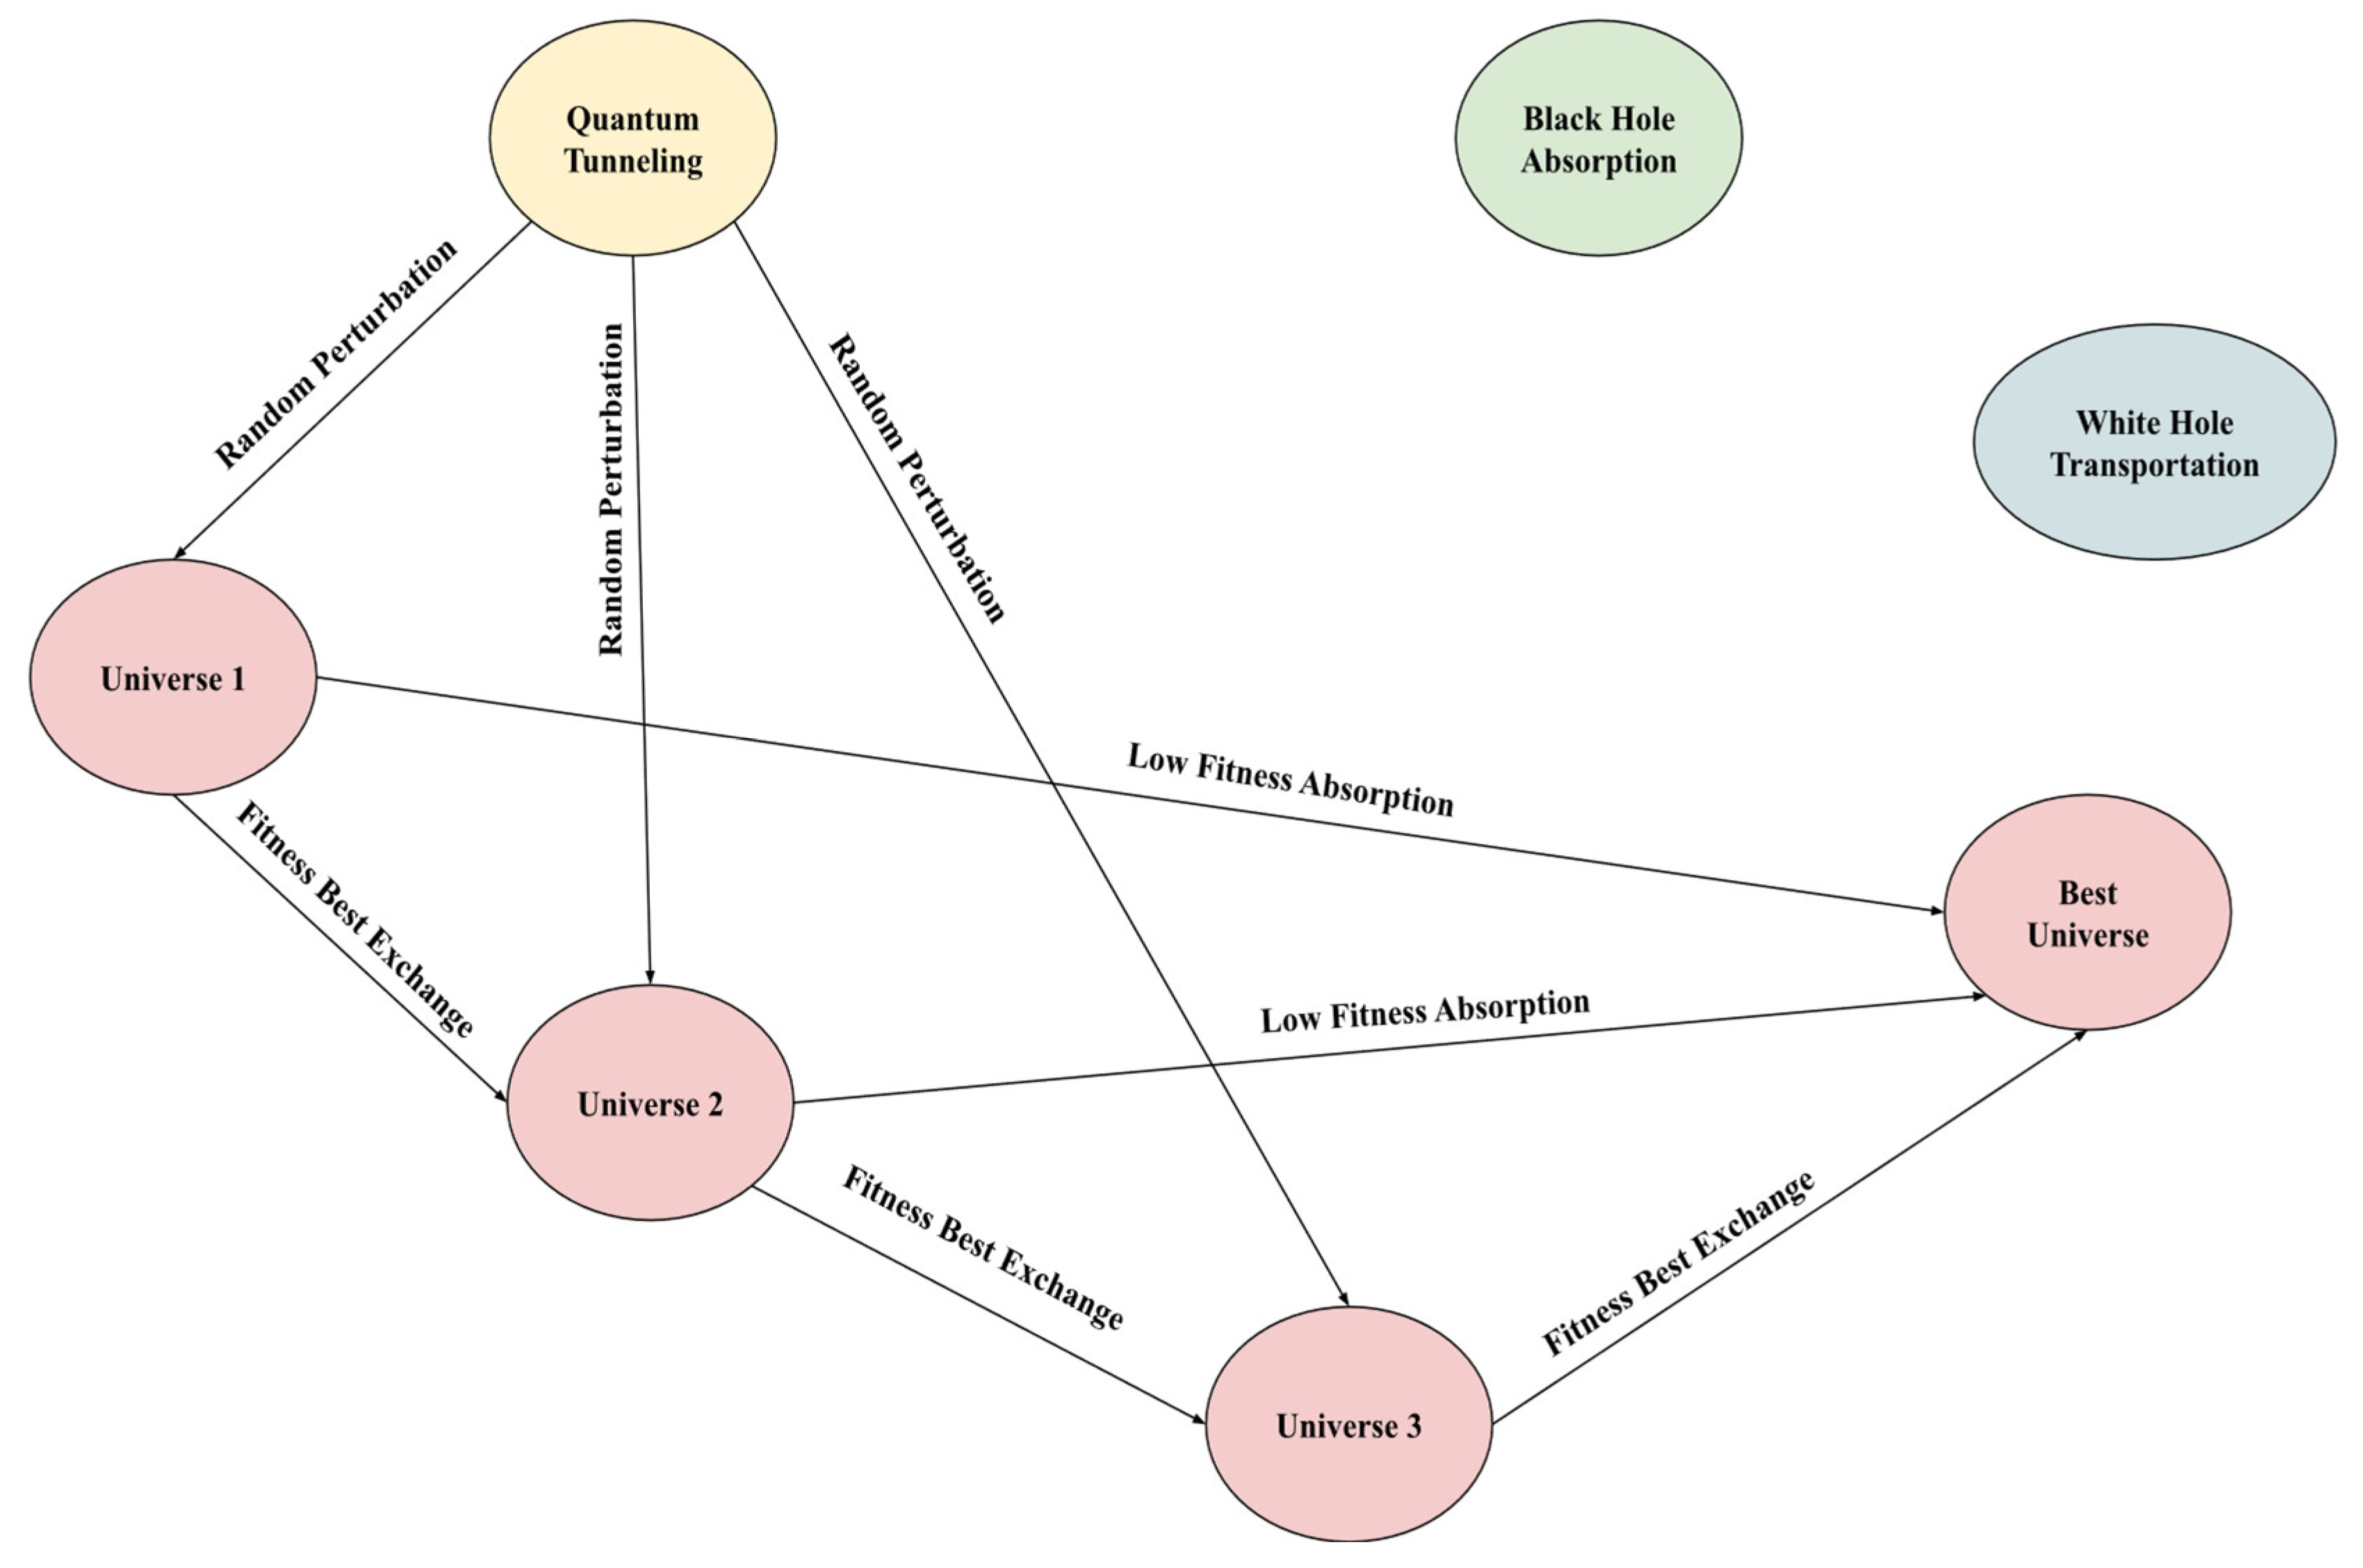
3.1.3. Multiverse Exploration
The core of the QI-MVO algorithm involves the multiverse exploration principle, which combines quantum and classical strategies for solution refinement [
23,
24].
Figure 3 illustrates the concept map of the QI-MVO algorithm phases:
White Hole Transport: Universes exchange solutions based on their fitness. Universes with better fitness (lower power loss) are used to update worse solutions, as shown in Equation (13):
where:
: the current position of the -th universe in the -th dimension.
: the position of a randomly chosen donor universe in the -th dimension.
: random number between 0 and 1.
: the probability of a white hole event, controlling the likelihood of replacing with .
Black Hole Absorption: Universes with poor solutions are absorbed by universes with better solutions, as given by Equation (14):
where:
: the current position of the -th universe in the -th dimension.
: the best-known position in the -th dimension (from the universe with the best fitness value).
: the fitness value of the -th universe, determined by the objective function.
This condition updates the position of with the position of when the fitness of is worse than the fitness of the current best solution.
Quantum Tunneling: To enhance diversity and exploration, Quantum Tunneling is applied by introducing small random perturbations to the solution positions, as described in Equation (15):
where:
is the quantum amplitude and generates random perturbations.
These perturbations help escape local optima and ensure better exploration of the solution space [
25,
26].
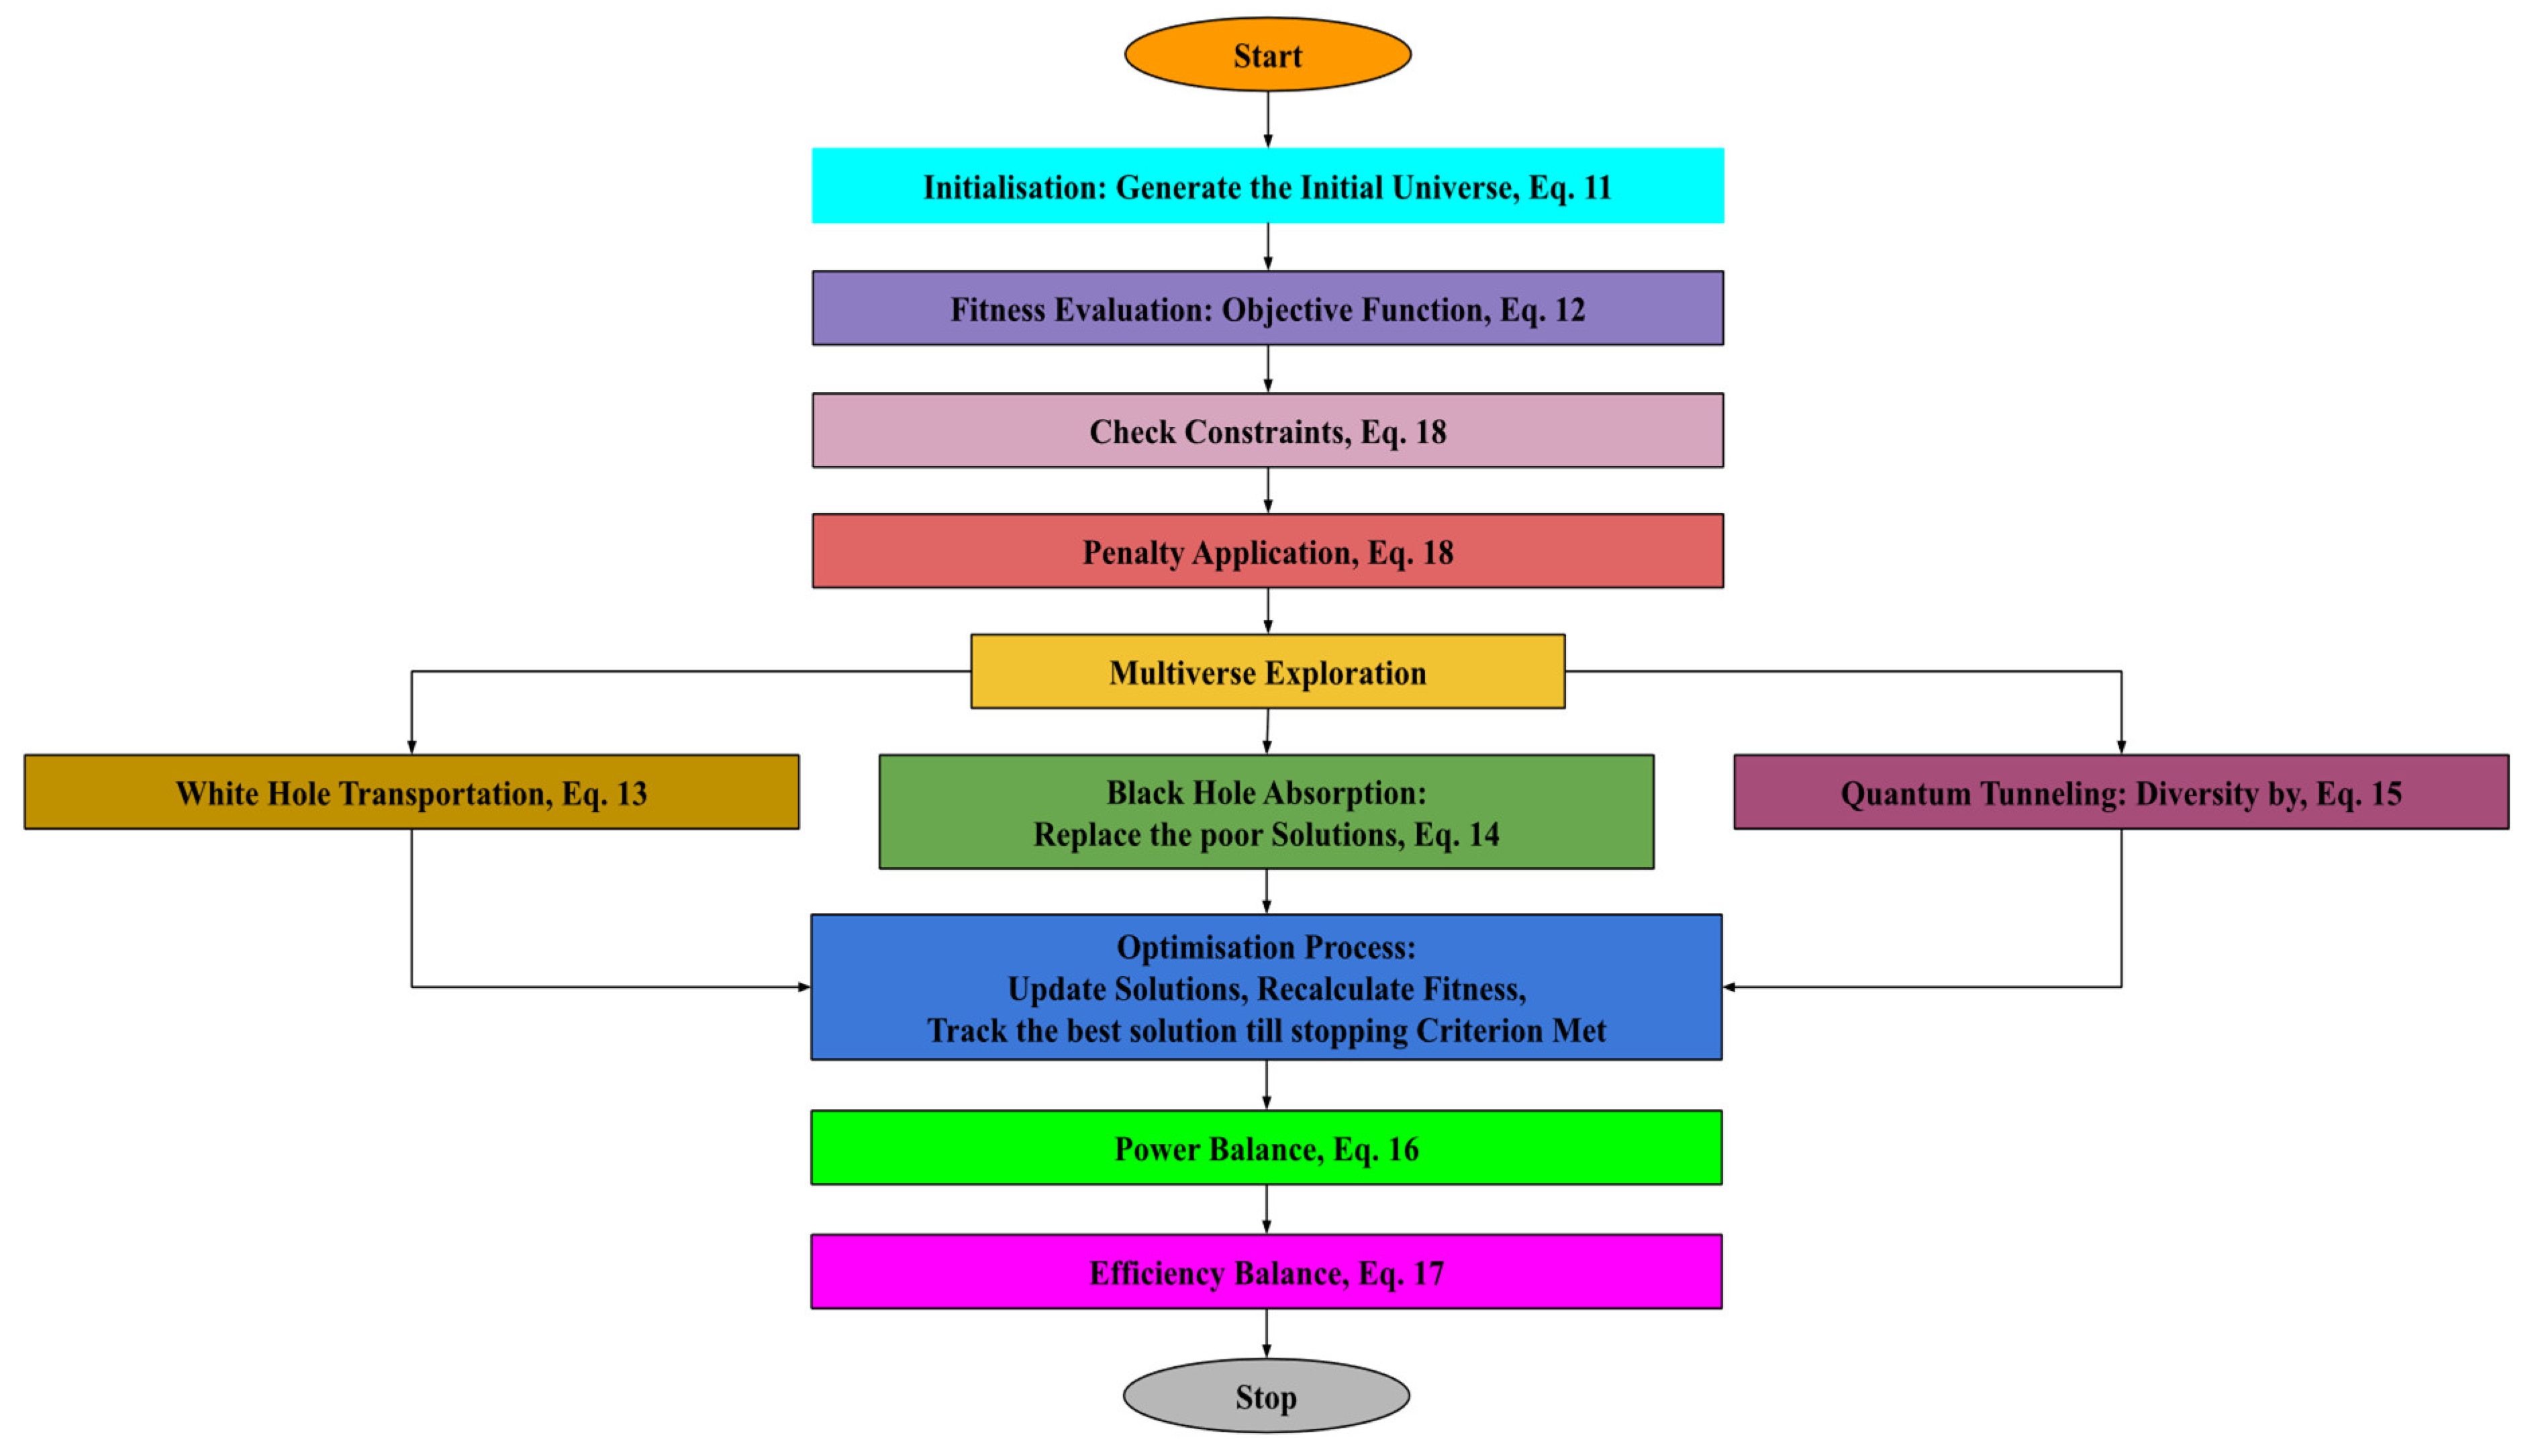
3.1.4. Optimization Process
At each iteration, the positions of all universes are updated based on the multiverse exploration principles. The fitness values are recalculated, and the best solution is tracked. The algorithm stops when the maximum number of iterations is reached or when no significant improvement is observed. A flowchart of the QI-MVO optimization process is shown in
Figure 4.
3.1.5. Power Balance and Efficiency
At each time step, the total power supplied by all energy sources must meet the load demand while minimizing losses, as expressed in Equation (16):
The system efficiency at each time step is determined using Equation (17):
where
is the system power loss at time
.
3.1.6. Penalty for Constraints Violation
When the optimum total power surpasses the predetermined operational limits, the Energy Management System (EMS) penalizes the fitness function. For dependable and effective energy distribution, this guarantees adherence to system restrictions [
18,
19]. If the total optimized power falls outside the specified bounds, a penalty is applied to the fitness function, as defined in Equation (18):
4. Results and Discussion
This study investigates the combinations along with the operating performance of a hybrid energy system that incorporates the microturbine system (MT), battery storage system (BSS), wind energy conversion system (WECS), and solar photovoltaic (PV) system. The hybrid system is supposed to ensure a reliable and efficient power supply against fluctuating climatic conditions and varying load demands.
The theoretical data and recent literature support the findings. This can be proved as the efficiency improvement attained by QI-MVO (up to 99.9%) is consistent with the work of [
7], which exhibits the effectiveness of quantum-inspired algorithms in solving the optimization problem of hybrid energy systems. The results reported in [
38] have shown that advanced optimization techniques are essential for minimizing energy waste, and this is consistent with the reduction in power losses (up to 40%). This is also validated by [
29], which also shows the need for dynamic energy management strategies for hybrid systems. Being a series of references, these serve as a strong theoretical basis for the results and control the potential bias in the interpretation.
The execution and integration evaluations of hybrid energy systems occurred through assessment simulations and optimized methodologies. Simulation with optimization of the system utilized MATLAB 2018a alongside Quantum-Inspired Multiverse Optimization (QI-MVO). QI-MVO represented the most appropriate advanced algorithm, which combined multiverse theory with quantum mechanics to handle the dynamic nonlinear energy flows observed in hybrid systems. The QI-MVO algorithm achieved optimal power loss reduction by precisely controlling energy generation and energy storage against energy consumption. The system accomplished its performance-based requirements by satisfying remarkable improvements in efficiency and reliability along with versatility enhancement.
4.1. Simulation Results
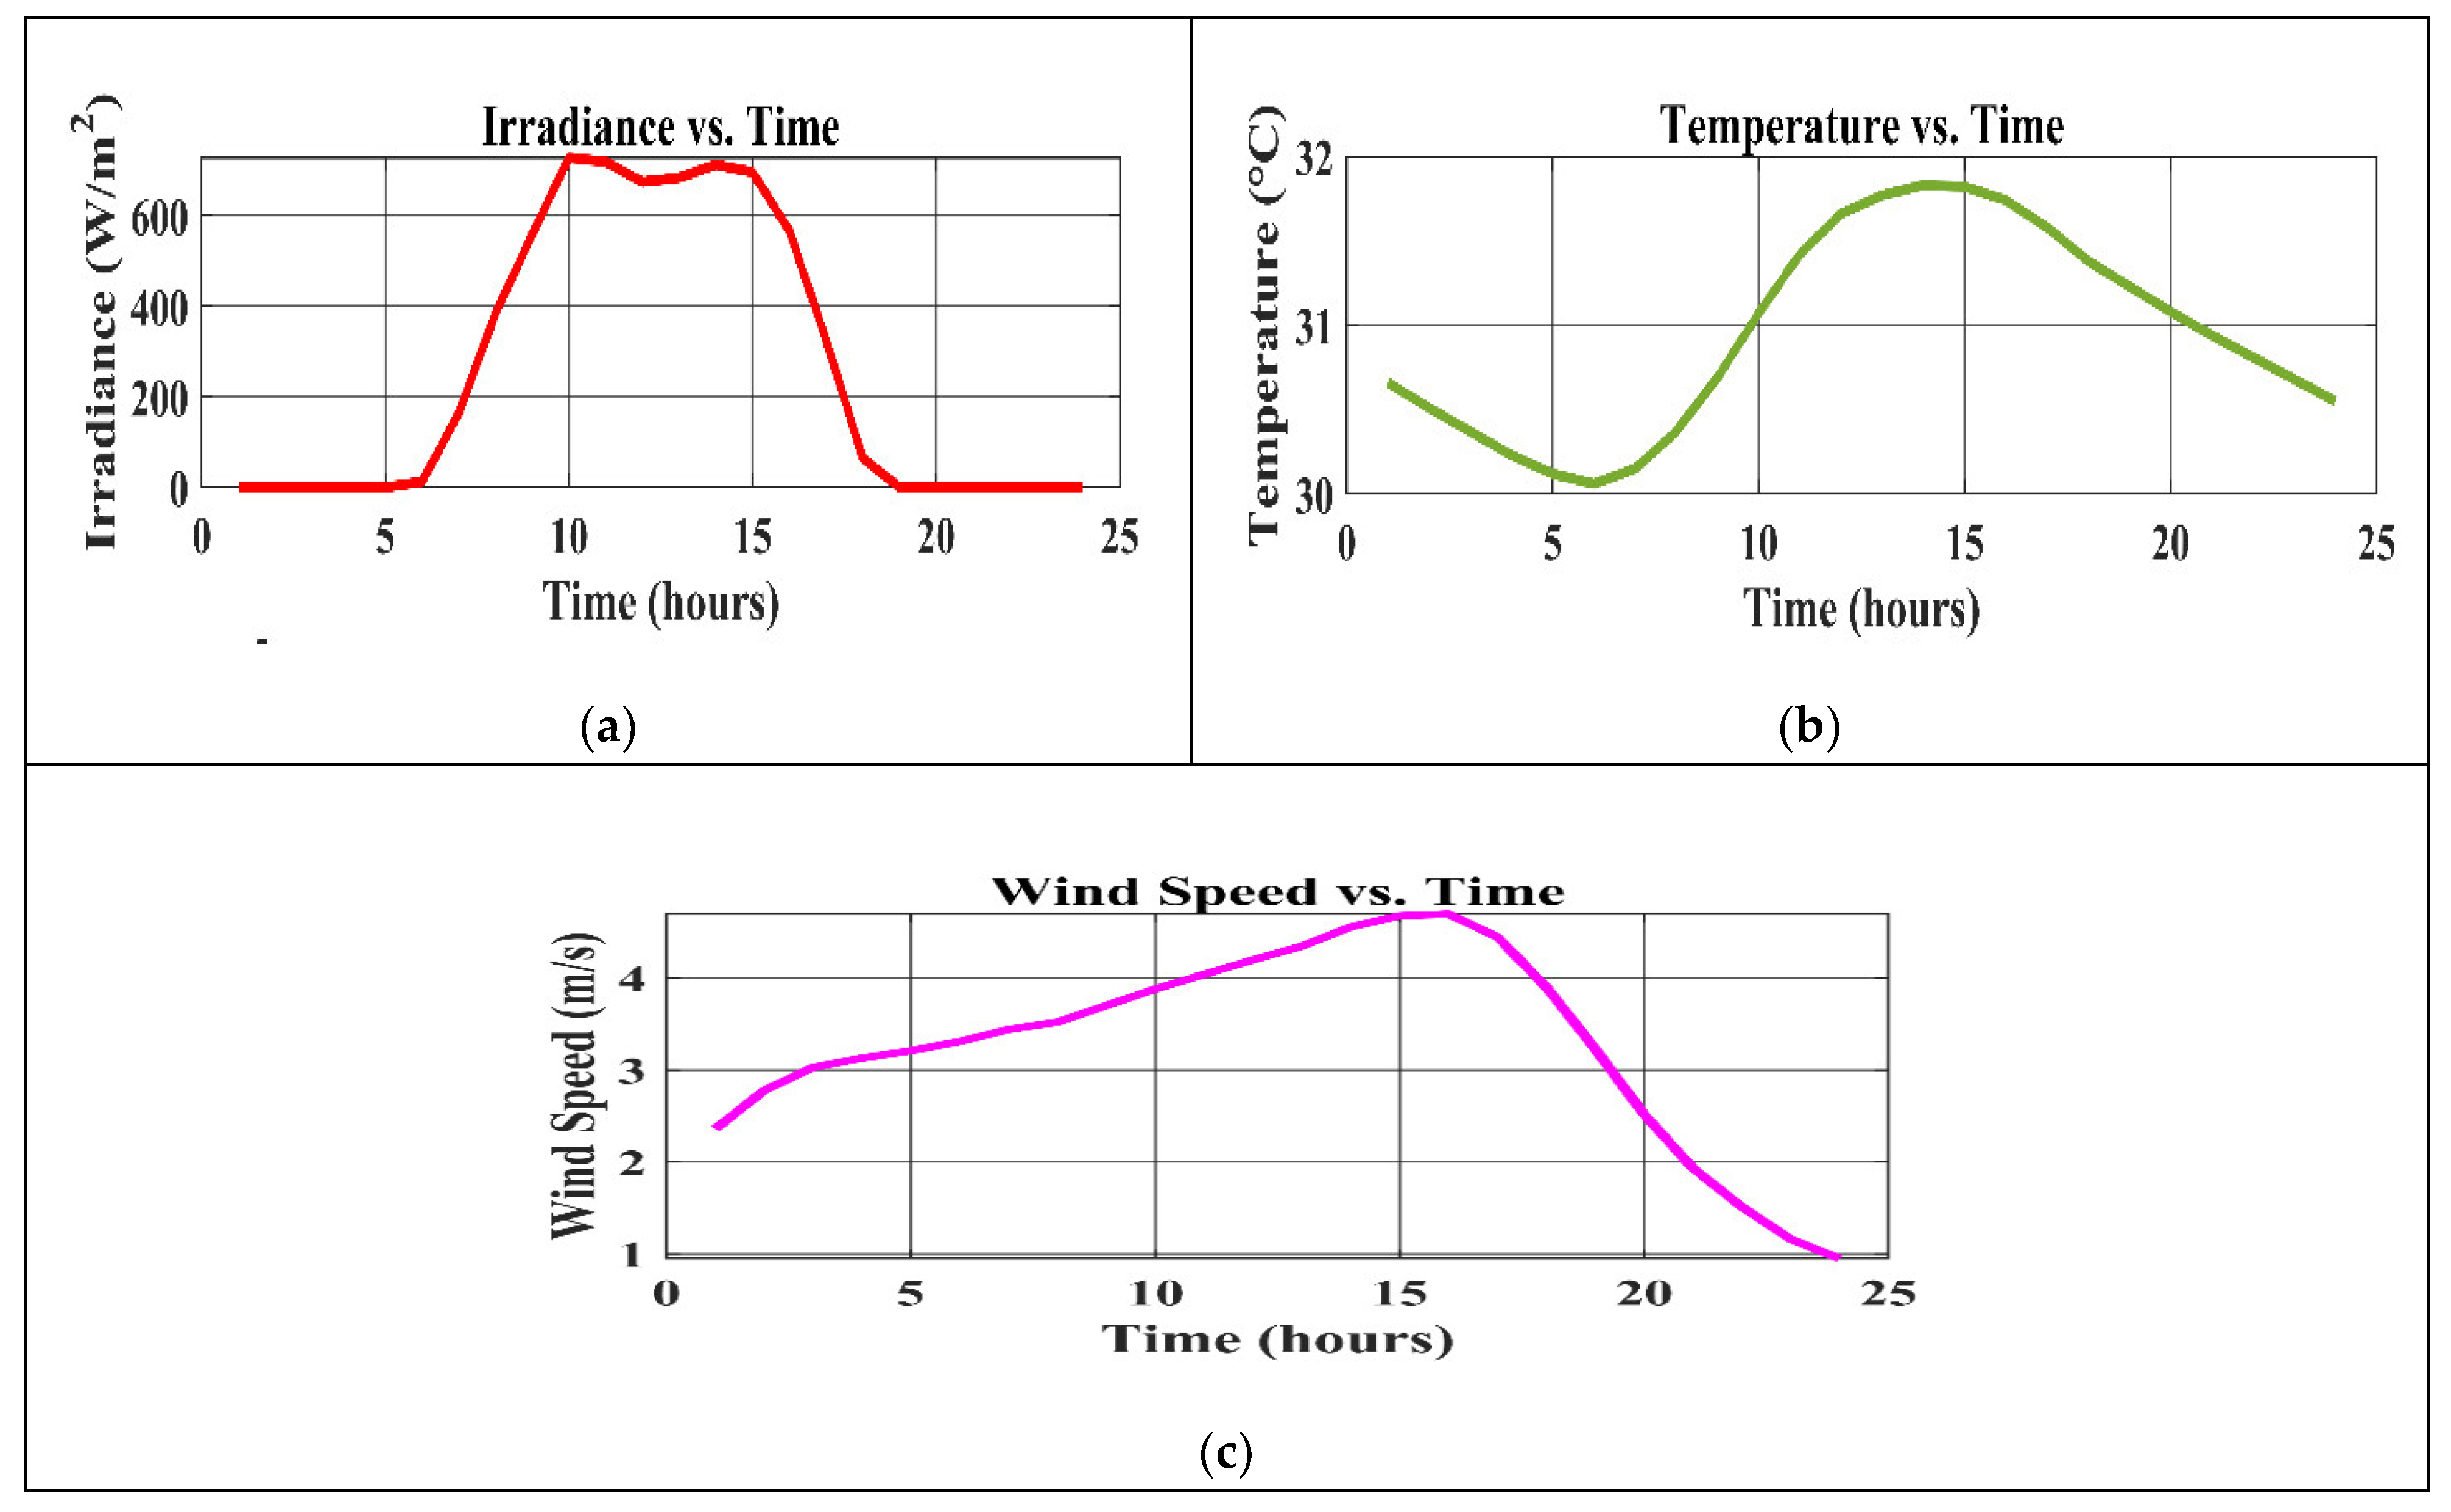
The investigation seeks the performance of a hybrid energy system over a 24 h operation study on 1 May 2024, at coordinates 11.8474° N, 92.6614° E, Havelock Island, India, using NASA/POWER CERES/MERRA2 Native Resolution Hourly Data. The multi-panel graph delineates significant aspects of energy consumption, meteorological conditions, and renewable generation.
The solar irradiance demonstrates a profound hourly cycle, with 0 W/m2 earlier in the dawn period, a high point of approximately 728.18 W/m2 about 10 a.m., and decreasing steadily to 0 W/m2 after sunset. This trend points out the stochasticity engendered in solar energy. Regarding attentive control of environmental temperature, 30.06 °C in the morning—with the highest afternoon temperature of 31.83 °C—is essential for the optimal functioning of photovoltaic modules. Finally, a moderate wind energy potential is illustrated by wind speeds throughout the day, peaking at 4.70 m/s at 4 p.m., decreasing to 0.95 m/s at midnight, and starting at 2.36 m/s at 1 a.m.
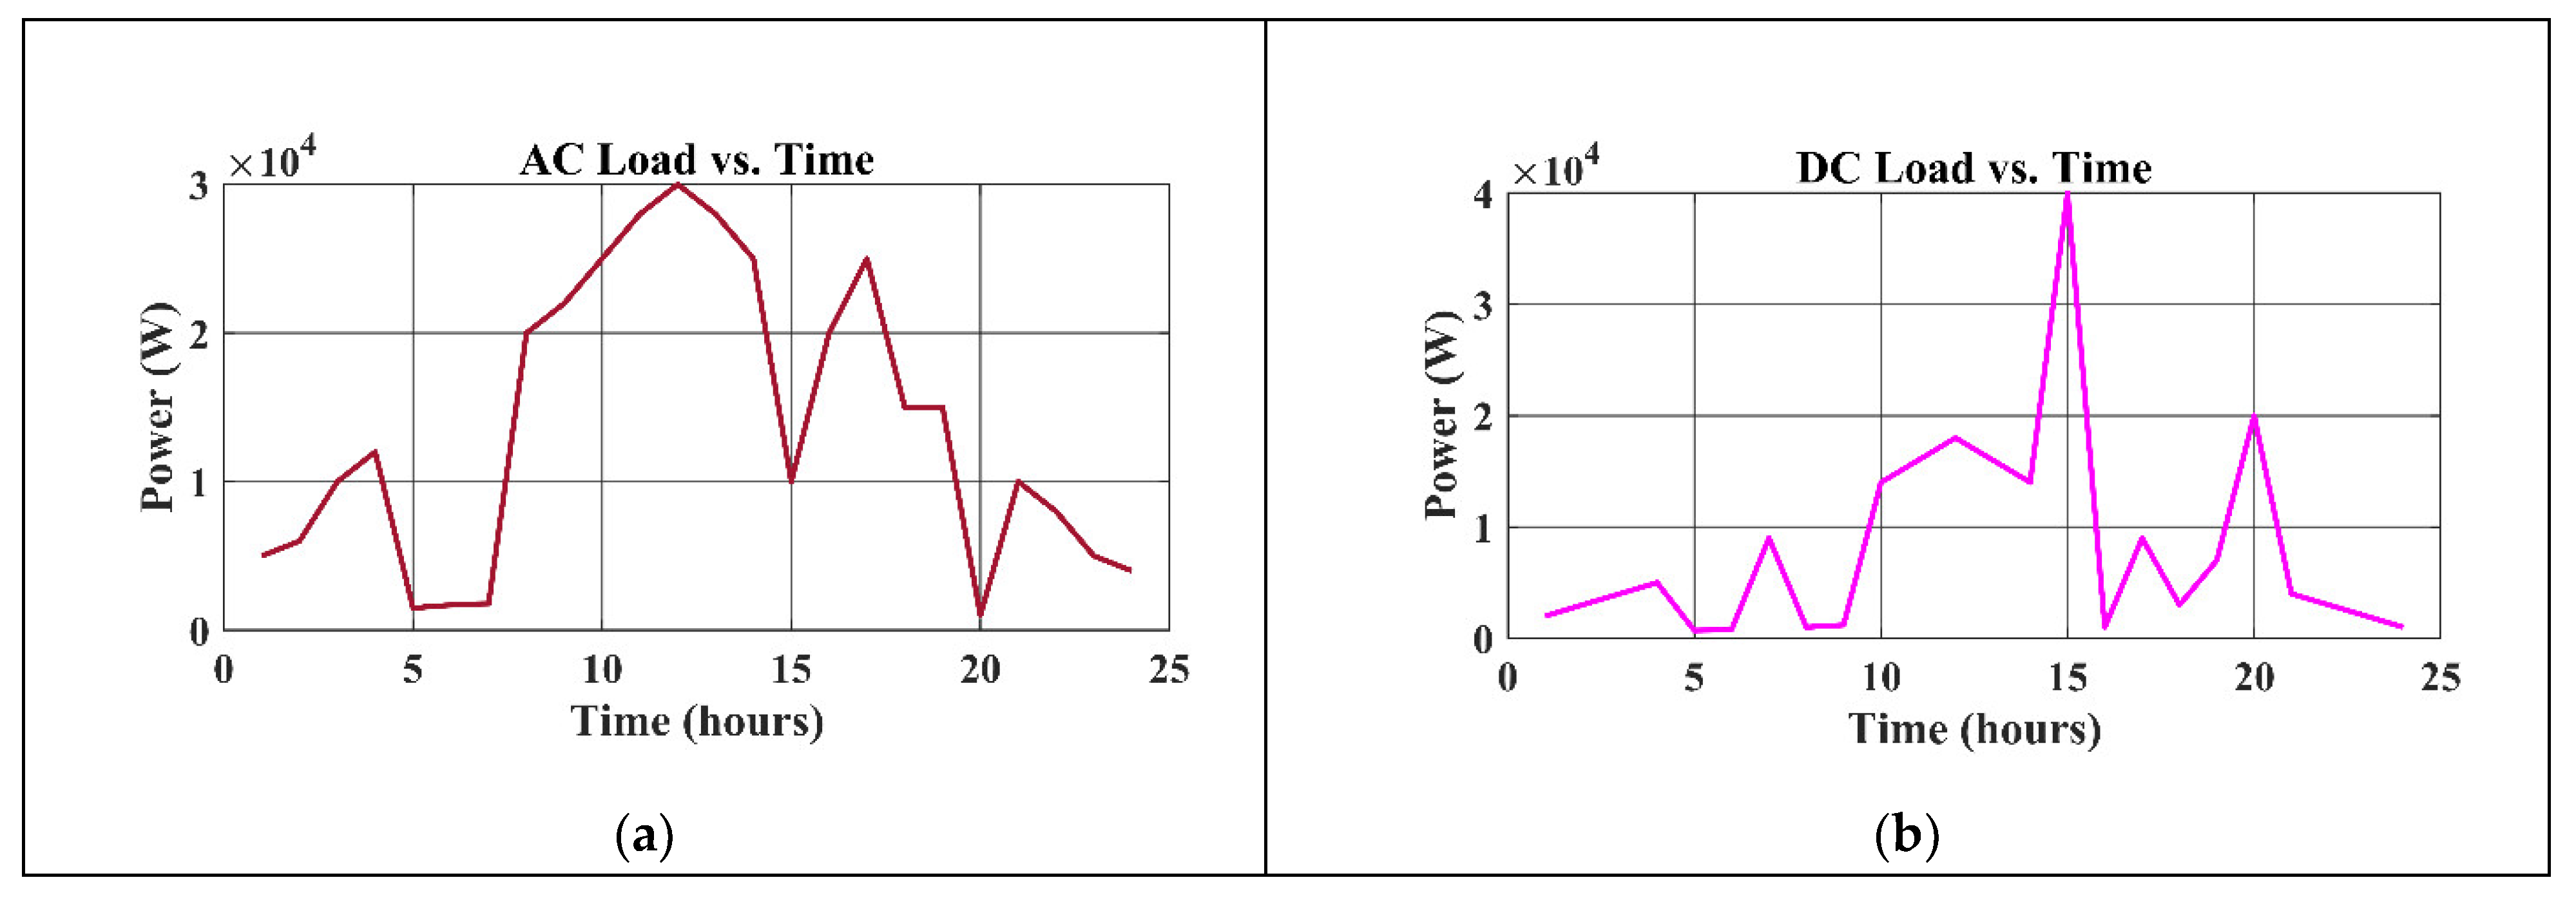
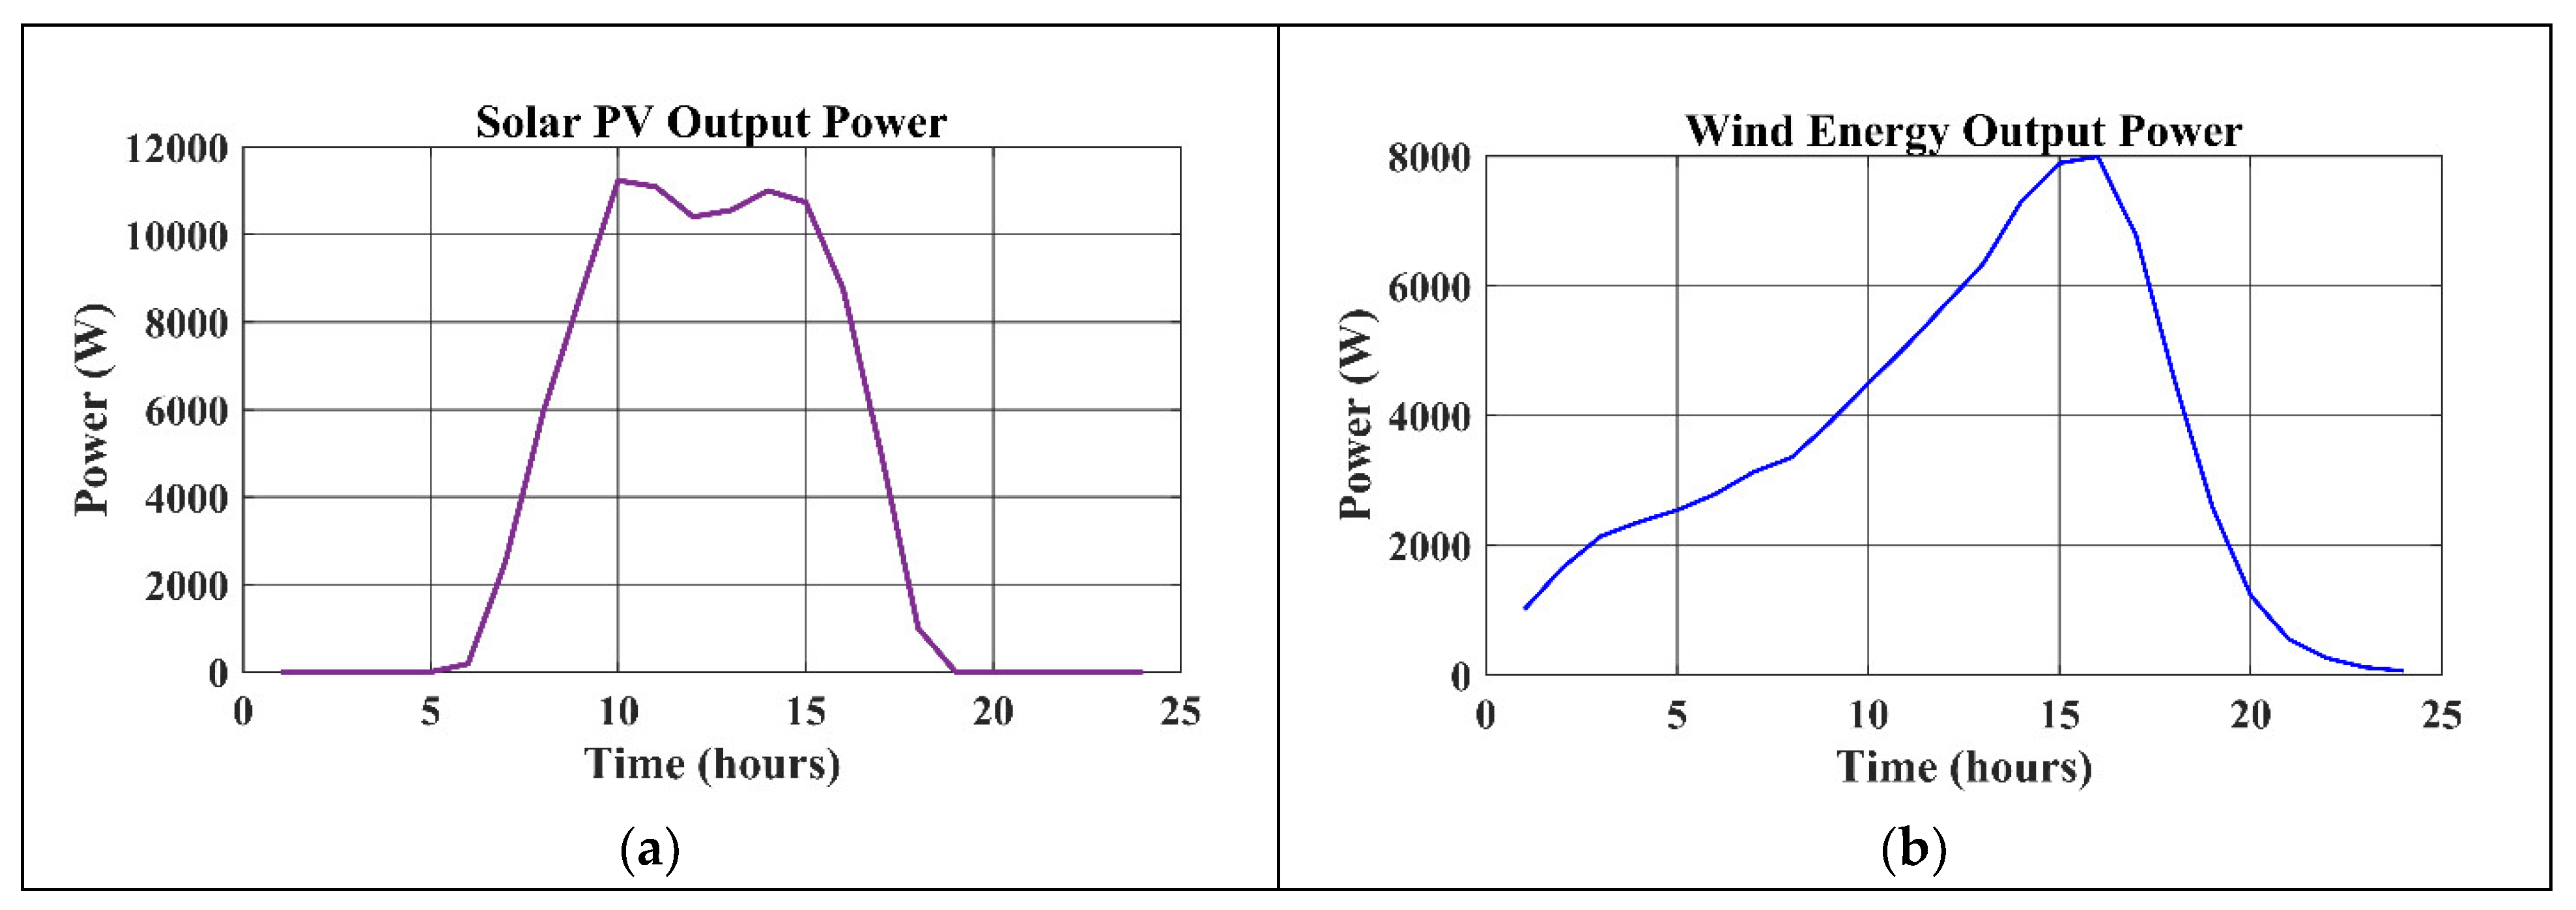
AC loads exhibit distinct patterns driven by cooling and residential demands, with a noon high of 30,000 W and a lower nighttime peak of 25,000 W. On the other hand, DC loads show significant variability, indicating specific equipment utilization spikes, with a range of 700 W to a maximum of 40,000 W at 3 PM. The solar PV system’s output, which peaks at 11,239 W at noon and closely resembles the solar irradiance curve, demonstrates how dependent it is on sunshine levels.
From 65.99 W at midnight to a maximum of 7298.11 W in the afternoon, wind energy maintains a steady contribution throughout the day, balancing the variation in solar energy output. The balance between solar and wind energy demonstrates the hybrid system’s ability to effectively manage the intermittent nature of individual renewable sources.
The analysis highlights the interdependence between renewable energy sources and load requirements. While solar energy provides a regular 24 h cycle, wind energy ensures a steady output, preventing changes in solar generation. Since the consumption patterns of AC and DC loads differ, customized energy management strategies are needed. The research highlights the necessity of integrating energy storage and backup systems to manage the sporadic nature of renewable energy sources and offers a reliable power source for both AC and DC applications.
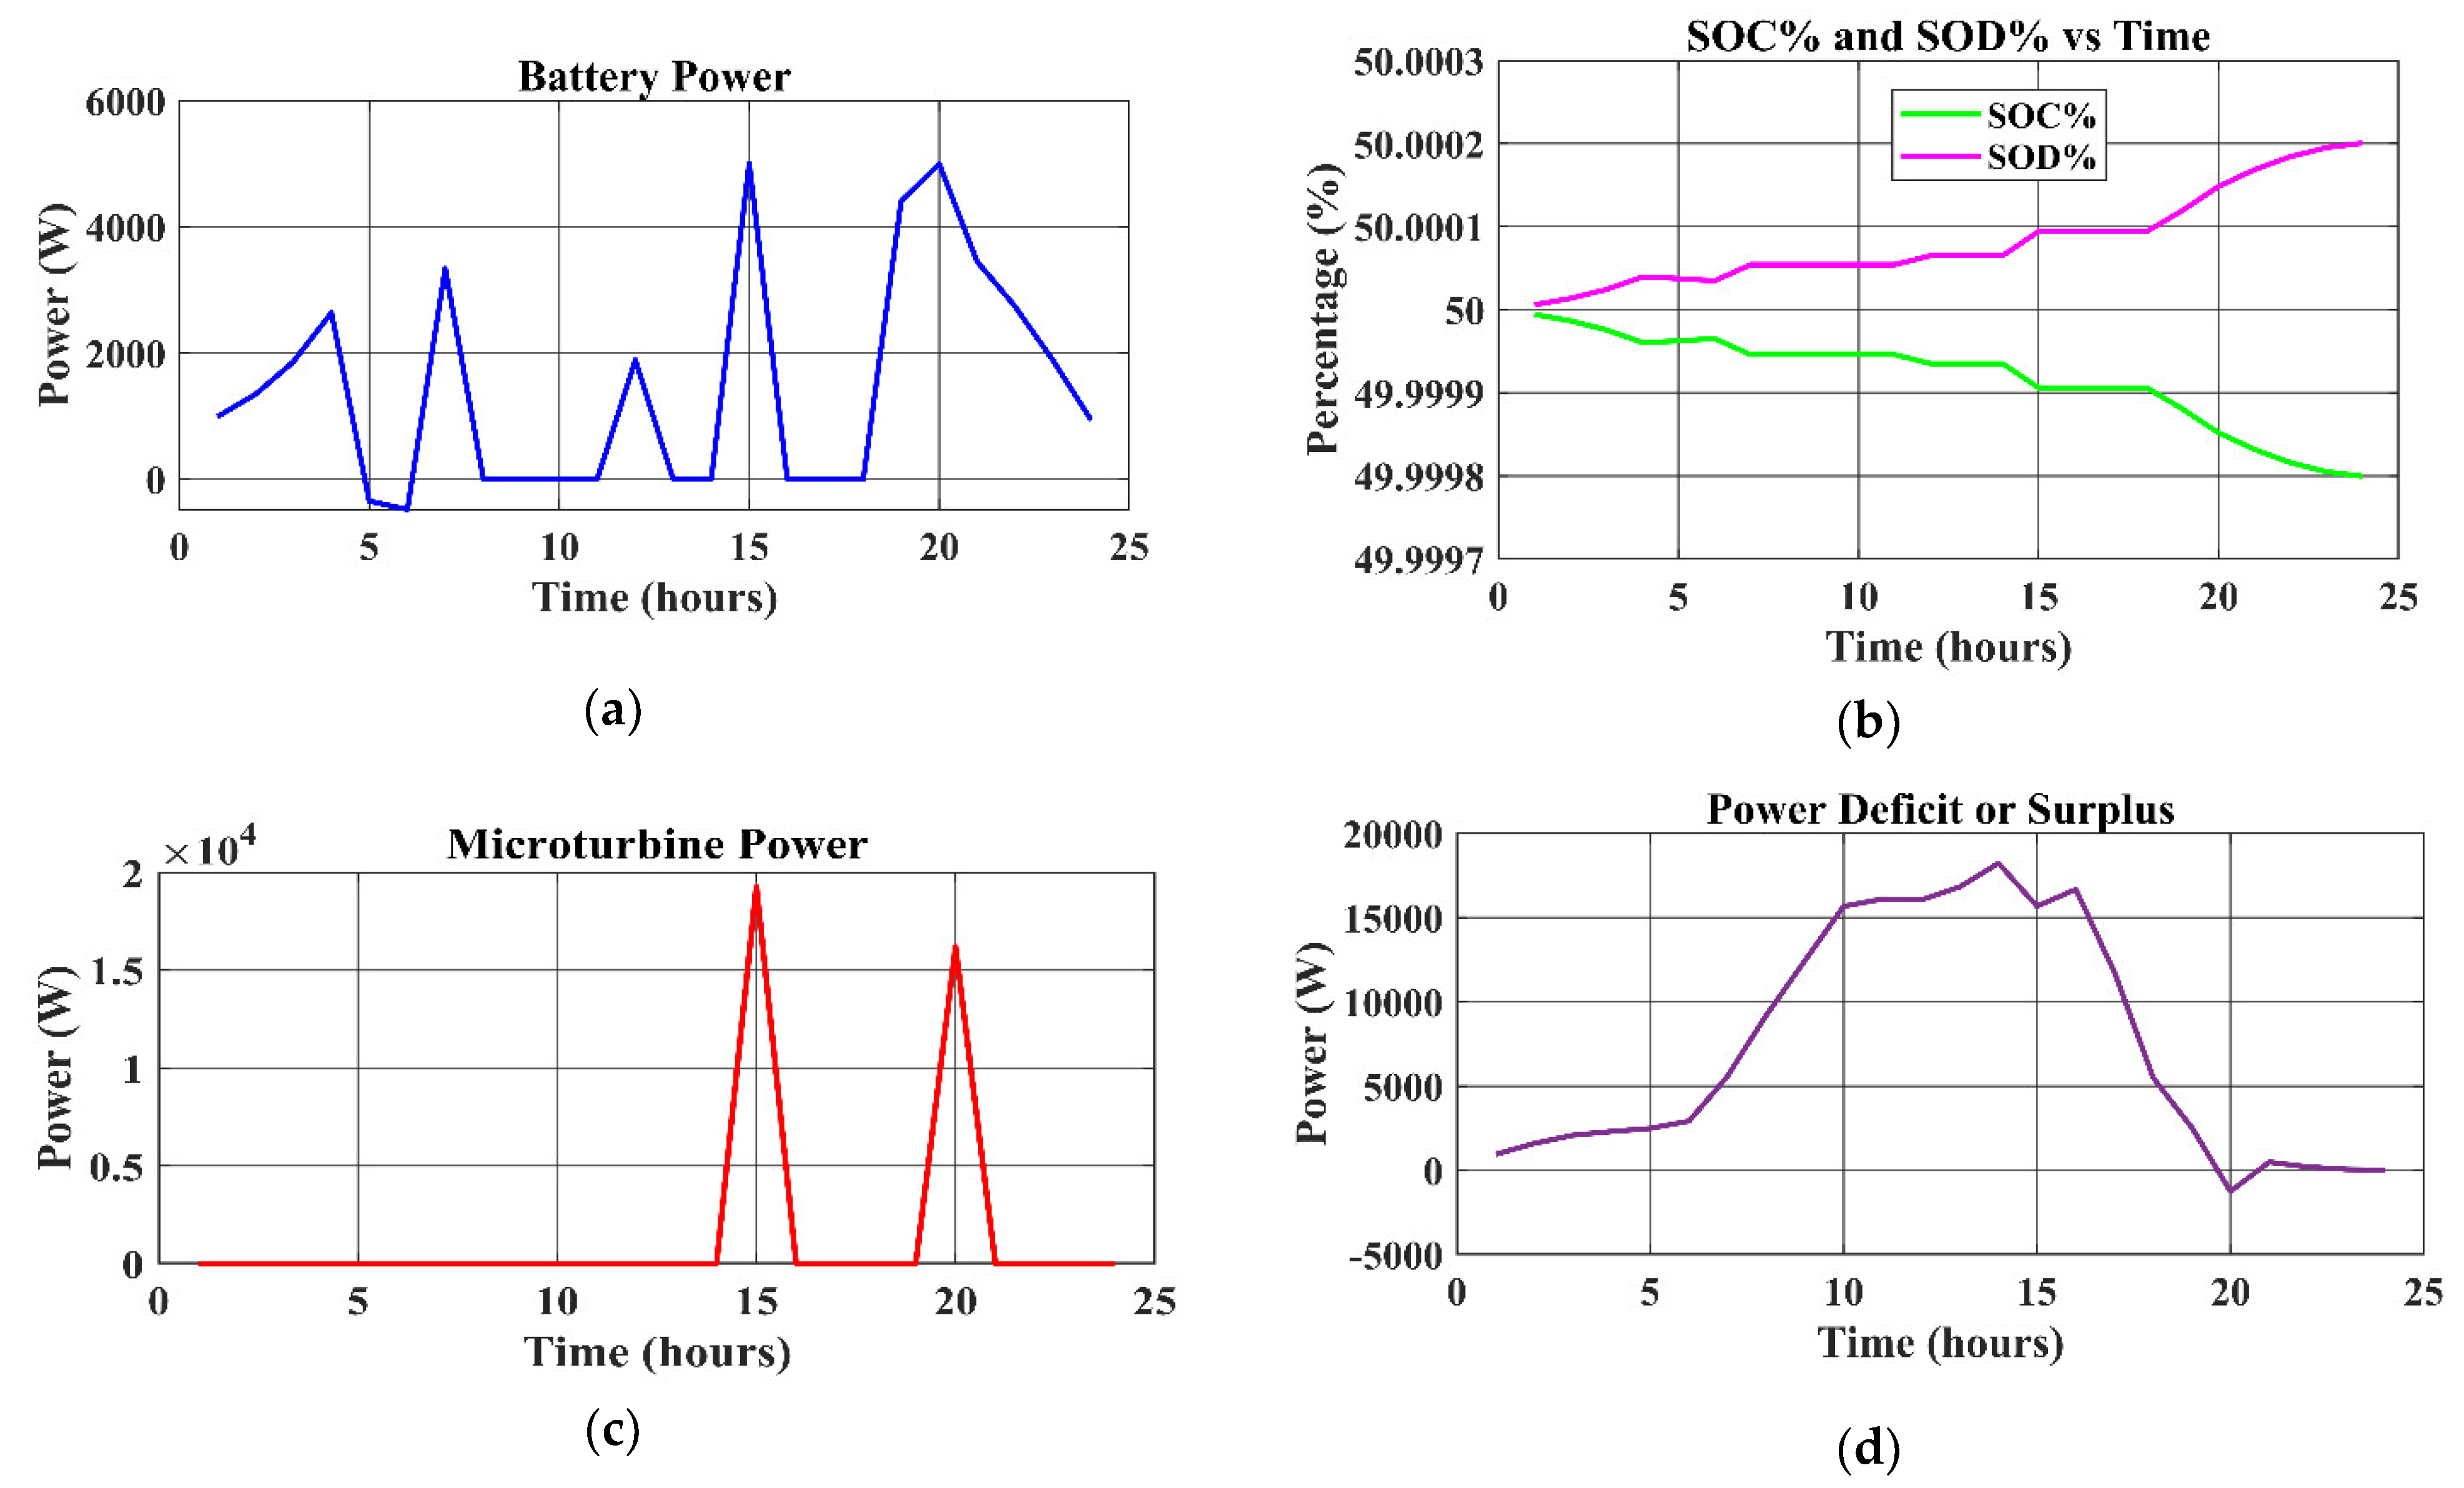
The battery system likewise maintains a more stable and even SOC and SOD from approximately 50% to 49.9998% throughout the day. This averts needless variations in its input and output, which defines its ability to allow changing energy demands while ensuring a relatively stable output of power must be demonstrated. Coupled with energy production peaks, such as when the battery exports 5000 W between hours 15 and 20, the system demonstrates the ability to deal with energy shortages occurring as demands peak. In those cases, the microturbine effectively plays a backup role by generating 19,259.15 W at hour 15 and 16,197.96 W at hour 20. While it demonstrates how the microturbine fulfills these outputs capably and acts to make up shortfalls of energy when only renewable generation is inadequate for energy balance, this, once again, underpins the important role of the microturbine.
Only small power surpluses or deficits indicate the system’s ability to balance generation and load needs throughout most of the day. Nonetheless, heavy reliance on the microturbine at times of high demand, for example, in hour 15, warrants a more efficient contingency plan and careful energy storage management of the latter. The three major components, battery, microturbine, and renewable sources, act cooperatively in this case to balance their surpluses and shortages and provide a steady supply of electricity.
Though the SOC and SOD characters remain uniform all through, the system considers the efficiency of storage and backup to enhance flexibility toward meeting energy demands. This ensures longer operational life for the system, maximizes the efficiency of operations, reduces dependency on external power, and ensures great reliability of the system. The system is well-optimized and contains the ability to maintain energy balance along a vast realm of functionalities, as expressed by the stable SOC and SOD values.
Figure 5,
Figure 6,
Figure 7 and
Figure 8 show the performance of the system.
Figure 5 illustrates input parameters with time, including wind speed (m/s), ambient temperature (°C), and solar irradiation (W/m
2), which demonstrates that the trend shows solar irradiance peaking at noon, temperature rising in the afternoon, and wind speed fluctuating moderately. These trends reflect typical daily environmental variations, validating the system’s ability to handle real-world conditions.
Figure 6 shows how load varies throughout the day by showing AC and DC load powers (Watt), which represents AC load peaks during the day, while DC load shows variability, reflecting typical energy consumption patterns. This supports the system’s adaptability to varying load demands.
Figure 7 presents the power generation trends of solar PV and wind energy conversion systems (Watt) as time progresses, alongside the outputs of the major control system. The solar PV output follows irradiance levels, while wind energy provides steady output, which demonstrates the system’s ability to balance intermittent renewable sources.
Figure 8 focuses on the outputs of backup control and presents the trends in battery power (Watt), microturbine power (Watt), SOC and SOD percent, and Watt trends in surpluses or deficits with time. The battery SOC remains stable, and the microturbine activates during peak demand, showing effective backup management. These results validate the EMS’s ability to maintain power balance and ensure system reliability. Together, these figures provide the reader with a complete view of the hybrid energy system’s operational conditions and capture interconnections among all its various components.
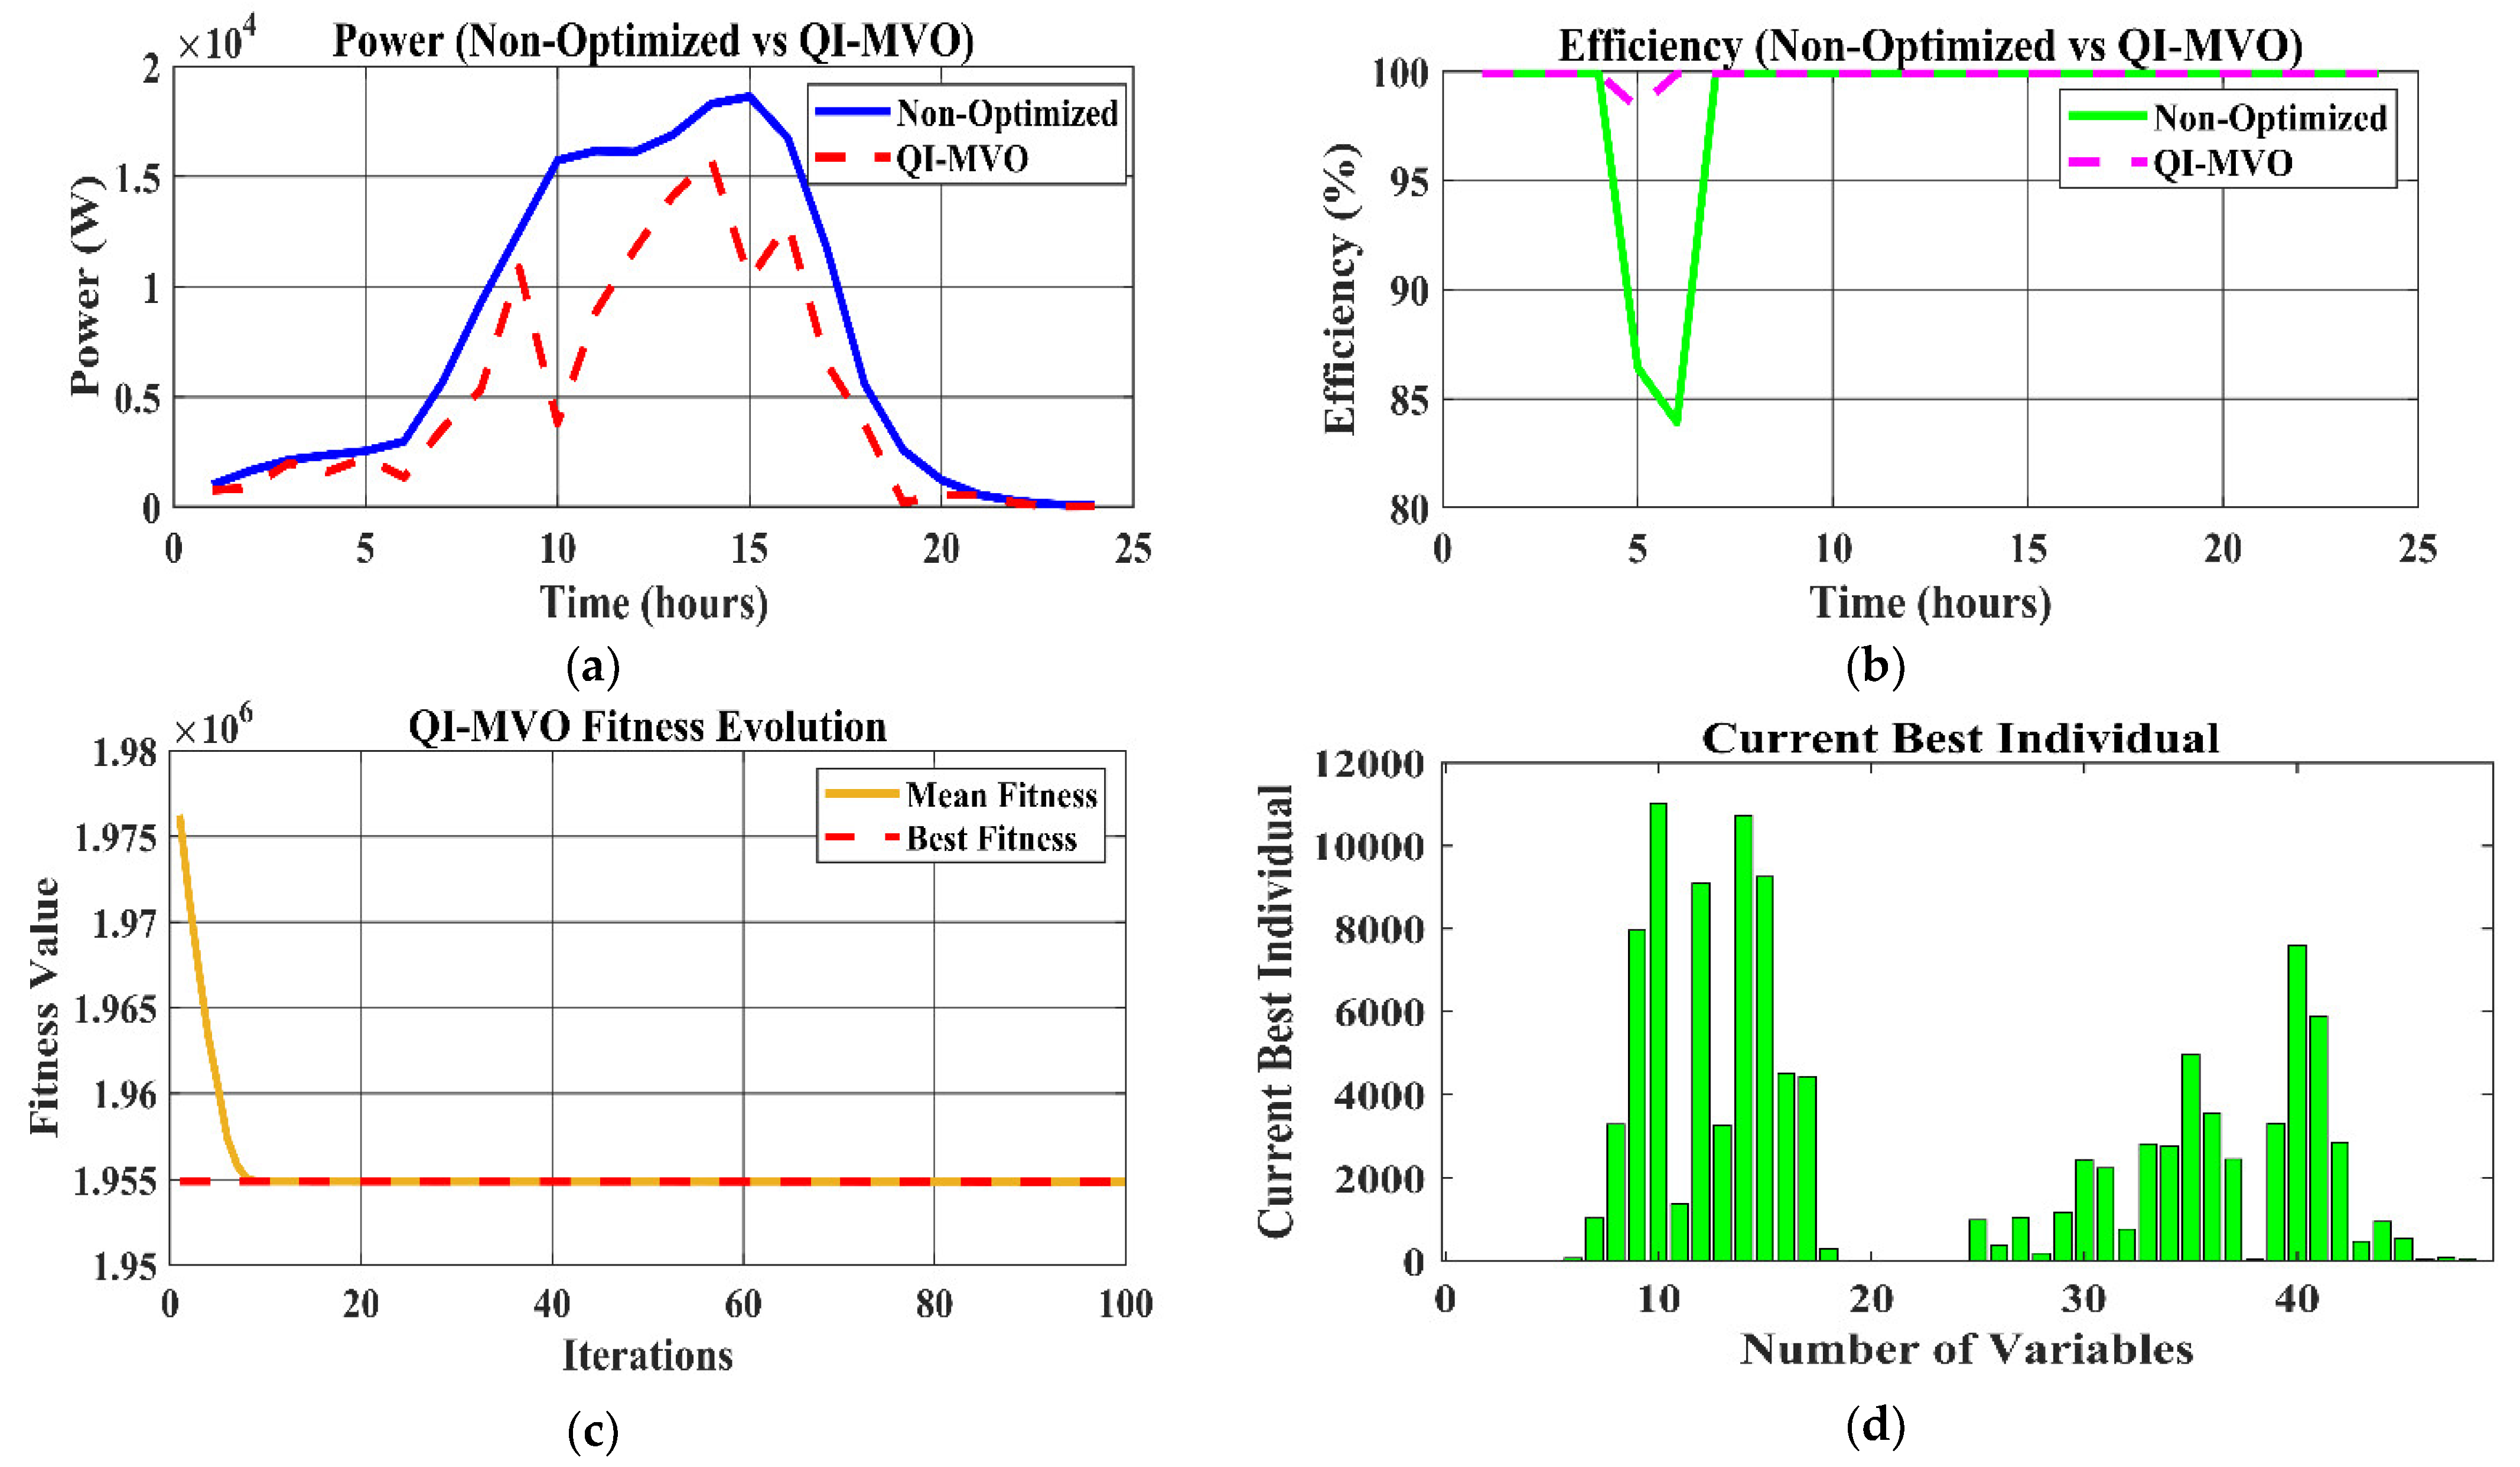
4.2. Comparative Model: Non-Optimized vs. GA vs. PSO vs. QI-MVO-Based Energy Management System
In a comparative evaluation of Energy Management Systems (EMS) applying Quantum-Inspired Multiverse Optimisation (QI-MVO), Particle Swarm Optimisation (PSO), Genetic Algorithm (GA), and non-optimized methods, some marked optimization-driven advantages concerning stability, energy management, and efficiency should be realized. In this section, the different techniques are examined for their effectiveness based on crucial features of power output, system efficiency, evolution of fitness, and load-handling capacities.
Figure 9,
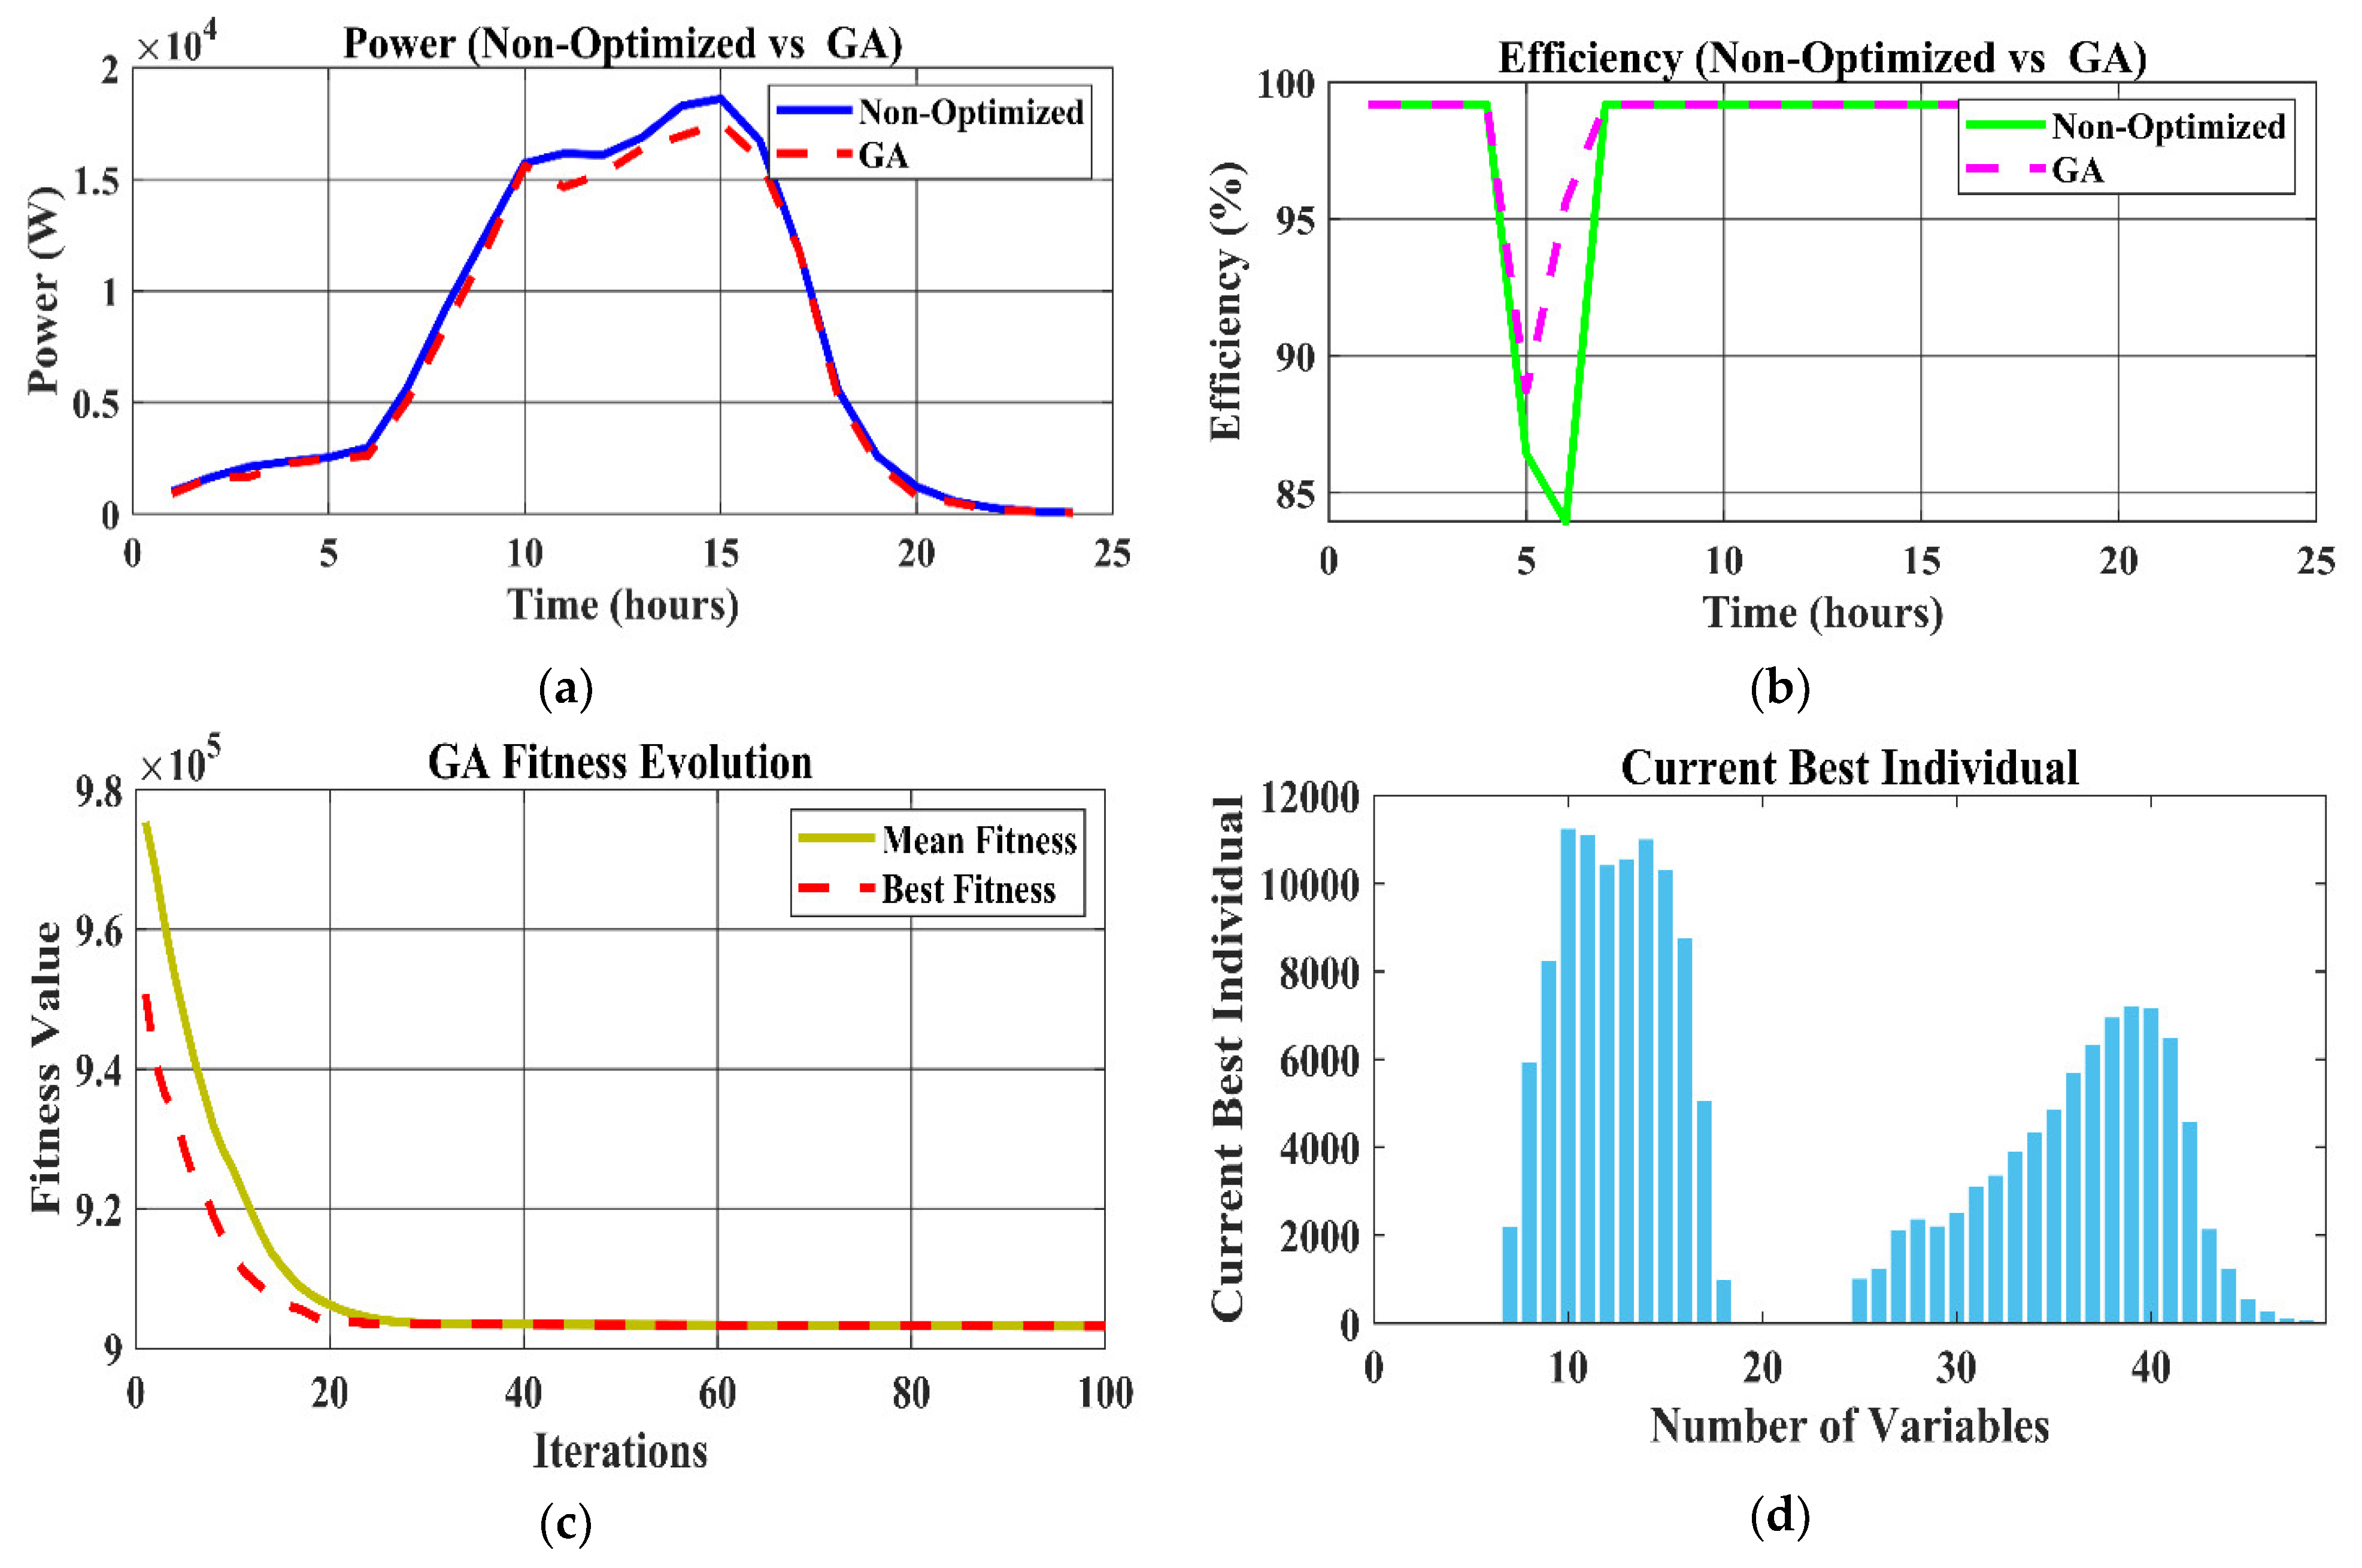
Figure 10 and
Figure 11 display the performance results for each of GA, PSO, and QI-MVO. GA gives good power management, a higher efficiency feature, and convergence of the fitness property. The subfigures show the improvements seen by the technique concerning power management, efficiency, and individual performance indices. However, PSO shows that with rapid convergence, constant efficiency, and good power control, it depicts the potential of energy optimization. The most compelling power stability, impressive efficiency improvements, and blemish-free optimization, even when tackling complex and difficult problems, are presented by QI-MVO, which absolutely pulverizes both methods.
A numerical representation of comparative simulation results of the non-optimized, GA, PSO, and QI-MVO techniques is given in
Table 8. Based on its superior convergence, high efficiency, and stability, QI-MVO gives the most consistent results of the four. In many instances, GA is seen to perform a good optimization, whereas PSO is seen to show better results than the non-optimized method in terms of speed of convergence.
The EMS efficiency study shows significant differences across the methods. The non-optimized EMS achieves efficiency levels between 83.4% and 95.7%, resulting in large energy losses because static control systems cannot adapt to changing loads and environmental conditions. GA can boost efficiency by 88% to 99.2% because of its capacity to dynamically adjust system settings and cut down on energy waste. With a range of 90% to 99.4%, PSO’s real-time optimization capabilities, which ensure effective resource utilization, greatly boost efficiency. With values between 99.2% and 99.9%, QI-MVO provides the highest efficiency due to its precise optimization, which minimizes energy losses and maximizes utilization.
The results of all optimization approaches, including GA, PSO, and QI-MVO, are obtained using 100 iterations in order to fairly compare convergence characteristics and computation efficiency. It takes 12 s for the EMS that is not optimized to converge. GA reduces this time to 3.67 s, but it is still slower than other methods. PSO drastically cuts the convergence time to 0.18 s by utilizing its efficient swarm-based search techniques and streamlined computational environment. Using quantum-inspired principles that enable efficient solution space search and exploitation, QI-MVO outperforms all other methods with a convergence time of only 0.07 s.
Fitness values offer more proof that optimization techniques work. Fitness measures have no value because the non-optimized EMS does not apply any algorithms. GA shows its ability to enhance performance with a mean of 908,734.32 and a highest fitness value of 903,227.62. The best fitness value of 1,904,026.98 and mean of 1,906,129.46 show that PSO performs better than GA, proving that it can identify better solutions with less variability. QI-MVO achieves the highest fitness with a mean of 1,963,291.94 and a best value of 1,954,885.85, demonstrating its ability to consistently discover optimal solutions with little deviations.
The parameter settings for GA, PSO, and QI-MVO are now clearly detailed to ensure reproducibility and facilitate comparison. For GA, the population size is set to 50, with 100 iterations, a crossover rate of 0.8, and a mutation rate of 0.01. For PSO, the population size is also 50, with 100 iterations, an inertia weight of 0.7, and cognitive and social coefficients of 1.5. For QI-MVO, the population size is 50, with 100 iterations, a white hole probability (WHprob) of 0.2, and a quantum amplitude (Aq) of 0.1. These standardized settings allow readers to replicate the experiments and validate the results effectively.
The non-optimized EMS has trouble managing peak loads and reducing power loss, which leads to frequent decreases in efficiency and significant power losses. GA has greater power losses than PSO and QI-MVO, but it enhances load control through adaptive changes. PSO successfully balances load demands by reducing power losses by 25% as compared to the non-optimized system. The most efficient technology is QI-MVO, which reduces power losses by 40% and has excellent load-matching capabilities that guarantee stable and dependable operation in a variety of scenarios.
A number of significant findings are highlighted in this investigation. QI-MVO performs close to optimally and outperforms non-optimized and general analysis frameworks by a large margin. QI-MVO has unparalleled computing power, alongside the rapid convergence era and the highest fitness beliefs. It is scheduled to be the superior option due to its exceptional optimization capacity and flexibility in managing the complex development of hybrid energy structures. QI-MVO consistently exceeds the unoptimized structure in all prosody, while GA and PSO provide significant additions.
The conclusions above show how, through optimization, hybrid renewable energy systems could revolutionize. QI-MVO consistently outperforms them, thanks to its excellent performance, rapid convergence, and high efficiency despite the significant developments in GA and PSO. The above findings show QI-MVO’s commitment to a new approach to improving EMS performance and provide a solid basis for future studies that aim to expand their use to more and more sophisticated energy relationships.
5. Conclusions
This examination addresses the impediment to delivering reliable and productive control sources by carefully inspecting a hybrid energy control system integrating solar PV, wind turbine, battery storage, and microturbine. Therefore, in order to improve organizational performance, we shall use a powerful optimization method to improve organizational performance. Quantum-Inspirated Multiverse Optimisation (QI-MVO), Particle Swarm Optimisation (PSO), and Heritable Algorithm (GA) show that QI-MVO is better suited to requirements concerning authority loss, convergence speed, and organizational effectiveness.
The conclusions show the QI-MVO algorithm’s ability to maximize energy use within the hybrid energy structure, achieving a maximum efficiency of 99.9%. Moreover, compared with GA and PSO, QI-MVO achieves a remarkable 40% decrease in influence losses, demonstrating its efficiency in improving overall structural performance. One’s extraordinary computational productivity, which converges in just 0.07 s with the same number of iterations, demonstrates the resilience and speed of the algorithm. Moreover, the improved hybrid energy standalone governance framework successfully responds to changing load conditions and exhibits outstanding stability and reliability.
The results indicate the importance of advanced optimization techniques for the establishment of hybrid energy structures, together with QI-MVO, which promises promising future functions. This aims to promote the development of efficient and green energy structures by opening the way for the expansion of the hybrid energy administration framework capabilities to larger relationships. In order to extend QI-MVO’s use in multidisciplinary environments, upcoming investigations may focus on the real-time implementation of QI-MVO in the smart grid and the use of adaptive control strategies.


