
The Impacts of Quality Management on Green Material Utilization: A Small- and Medium-Sized Chinese Enterprises’ Perspective


Abstract
1. Introduction
2. Literature Review and Research Hypotheses
2.1. Green Materials
2.2. Quality Management
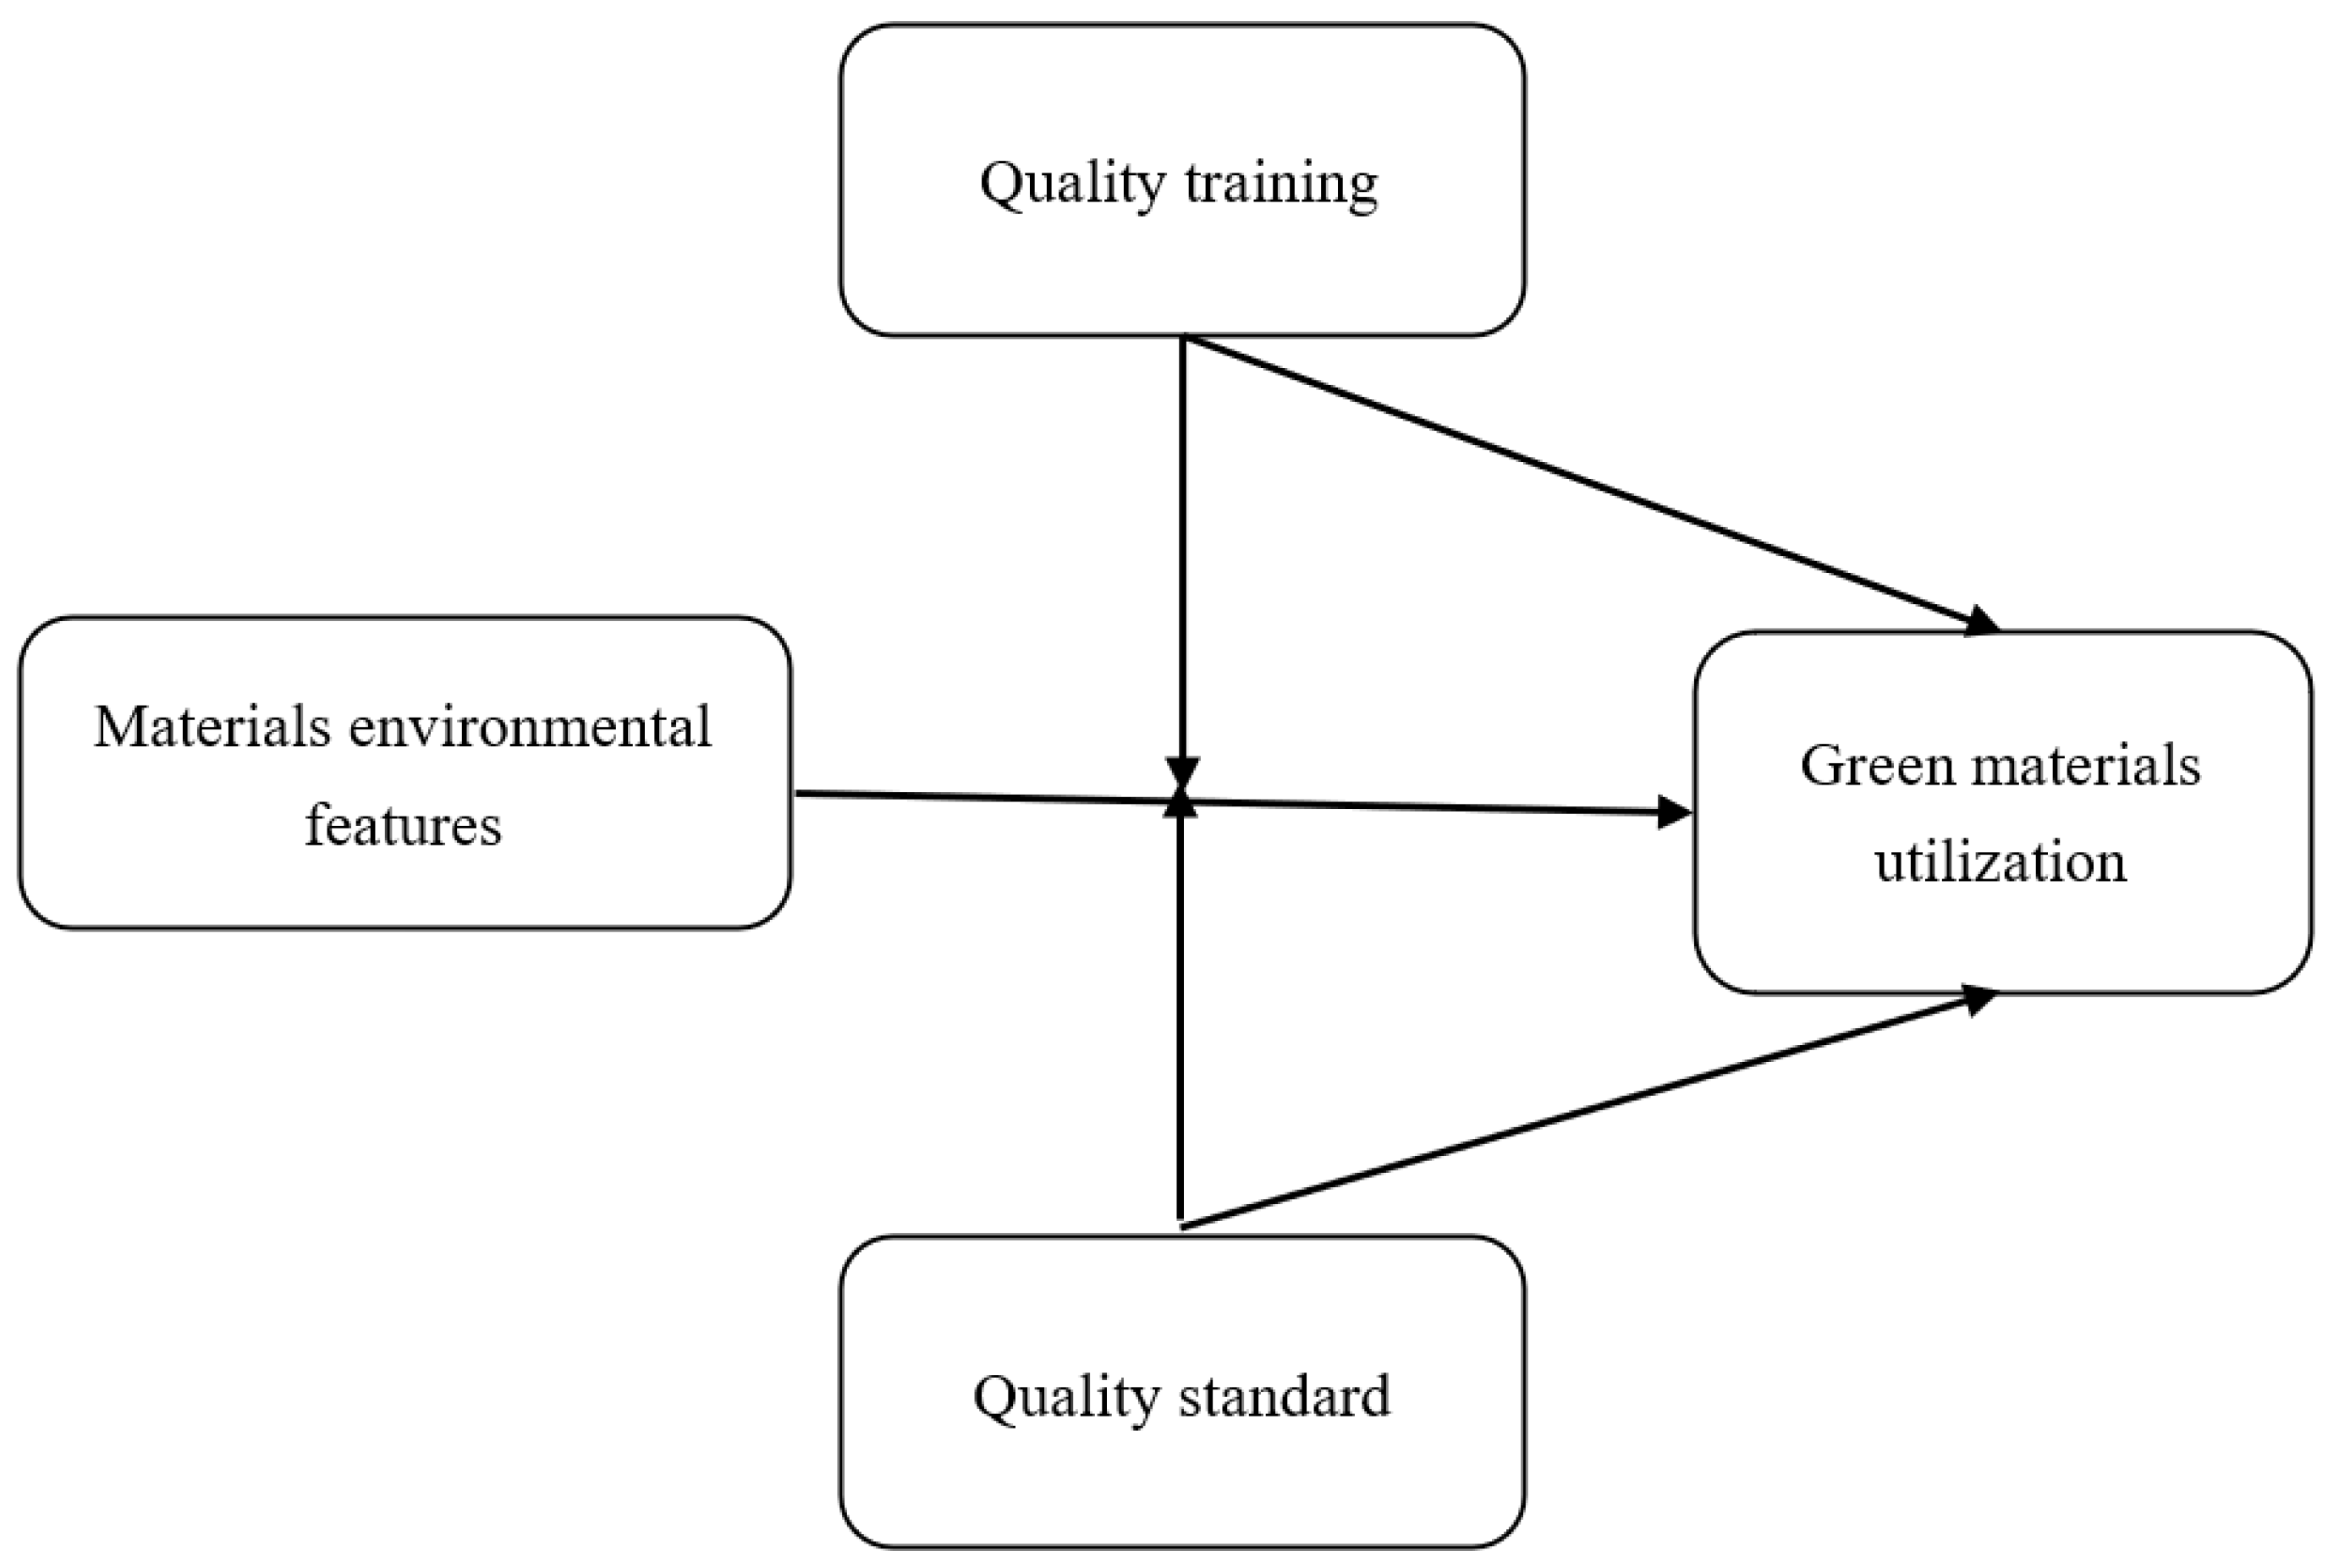
2.3. Research Hypotheses
2.3.1. The Effect of Quality Training on Green Material Utilization
2.3.2. The Effect of Quality Standards on Green Material Utilization
2.3.3. The Moderating Role of Quality Management
3. Research Methods
3.1. Identify Attributes and Measure Variables
3.1.1. Price
3.1.2. Weakened Product Performance
3.1.3. Heavy Metal Toxicity Reduction
3.1.4. Recycling Rate
3.1.5. Sewage Reduction
3.1.6. Waste Gas Reduction
3.2. Specify Attribute Level
3.2.1. Price
3.2.2. Weakened Performance, Toxicity, and Sewage Reduction
3.2.3. Recycling Rate
3.3. Questionnaire Design
3.4. Survey Administration
3.5. Estimation of the Choice Model
4. Empirical Results
5. Discussion
5.1. Research Implications
5.2. Managerial Implications
6. Conclusions
Author Contributions
Funding
Institutional Review Board Statement
Informed Consent Statement
Data Availability Statement
Conflicts of Interest
Appendix A. Description of the Cases

| Description | |
|---|---|
| Firm A | Firm A’s main product is silicone, and its main market is China. Firm A’s annual sales are CNY 2,000,000, and it has 10 employees. The main harmful substances during silicone production are dust in the cutting stage and volatile organic compounds (VOCs) during the curing stage. The water used in the silicone production process is only for cooling the products and cleaning the molds. Firm A is equipped with activated carbon adsorption units and dust removal equipment. It also installed primary sedimentation tanks, which are essential sewage purification equipment. |
| Firm B | Firm B’s main product is the circuit board; its main markets are Europe and China. Its annual sales are CNY 20,000,000, and it has 30 employees. The main pollution is sewage, which contains various polluted substances such as heavy metals, acid and alkali sewage, organic pollutants, and suspended solid particles. Firm B has implemented activated carbon adsorption units. It also installed a comprehensive sewage control system, including primary sedimentation tanks, secondary biological treatment and tertiary treatment, and pollution discharge pipelines. |
| Firm C | Firm C’s main product is electrical motors; its main markets are the Middle East and China. Its annual sales are CNY 60,000,000, and it has 80 employees. Firm C has many large machines, most of which produce gaseous waste and a lot of noise during operation. For example, the shot blasting machine produces a lot of dust. The welding machine is necessary for production. However, it is malodorous and produces sulfide gas, greenhouse gas, and VOCs. Firm C has implemented dust removal equipment, desulfurization and denitrification equipment, and activated carbon adsorption units. Additionally, firm C installed solid pollutant collection equipment, such as scrap metal collection equipment, to sort and recycle scrap metal, and noise control equipment, such as silencers and sound barriers, to reduce the noise level. |
| Firm D | Firm D’s main product is the rotor, and its main market is China. Its annual sales are CNY 30,000,000, and it has 25 employees. The forging of rotors requires high temperatures and a significant amount of oil, and the production process generates a large amount of dust and oil mist. Firm D uses water for cooling, so the main components of the sewage are oil and dust. Firm D has implemented industrial oil mist purification equipment, dust removal equipment, and activated carbon adsorption units. Firm D also installed sewage purification equipment, which comprises primary sedimentation tanks. |
Appendix B. Semi-Structured Interview Protocol
- Please introduce your product, material using, market and supply chain.
- Have you adopted green practices in your operation? if yes, could some example?
- Have you adopted green materials? if yes, could you description the essential information and environmental functionality of green materials.
- How do you make decision about green materials utilization? When you consider green materials utilization, which is the important factors for you when you consider the green materials utilization?
- Could you describe the scenario in which you choose green materials?
- Do you have quality trainings and quality standard in daily operation, if yes could described the details of quality trainings and quality standard?
- Whether quality trainings have impact when you make decision about green materials utilization?
- When you make decision about green materials utilization will you consider the quality standard?
Appendix C. Coding Scheme for Attributes
| Items | Evidence |
|---|---|
| Price | “When we decided whether to select green materials, we need to consider its price, as we need to long-term use this material, which maybe significant impact of our cost” “In fact if the price of green materials are much higher than tradition materials, we are unable to accept… but there are limited difference, we are willing to utilize green materials”. “If we used green materials in some important parts… we will think more about price difference between green materials and traditional materials… as it impacts our cost… even relates to attract customers… that is why we focus on it”. “When we select materials, price is the most important part… it relate to our cost and product price… if price is high… it is difficult to attract customer… even it is green materials”. |
| Weakened product per-formance | “Comparing with traditional rubber… Silicone also have good durability… so it does not weak our product performance” “Some traditional materials have good improvement effect… for example, normally, we used Polyvinyl Chlo-ride (PVC) casing and fiberglass with halogen… which has Good fire resistance… if we used green materials which does not have halogen… its performance of fire resistance will become weaker… so we need to consid-er” “Now we used Eco-friendly solders, it is difficult to weld, and it also weaken our product performance such as rotational speed… it is troubling to us” “We tend to utilize green material cautiously, especially in some core part… as we don’t know how its impact product performance… it is the essential factors of attracting customers…” |
| Heavy metal toxicity re-duction | “Many materials contain heavy metals, such as welding rods, in order to achieve better performance… but heavy metals enter the environment through various waste gases and wastewater during manufacturing process… cause environment pollution and harm body” “We need to use a solder… and employees’ skin always touch it… many heavy metals can be absorbed into the skin… harm health” “We used a large number of paints… if will be absorbed into the body when we use it… in addition, when paints are wearied… when paint is frayed or chipped… it also has possibility to take toxicity” |
| Recycling rate | “Recycle rate is a critical attributes when we select materials… especially packaging materials… it related to circular economy and pollution” “We select silicone can be recycled easily… unlike rubber… we can recycle old products with silicone and renew or remanufacturing it… it can reduce our cost… we also have services to recycle silicone” “Now we prefer select package materials which can be recycled easily… for example… we limited to use sin-gle-use plastic bags to package products… and we prefer to use carton… can reduce waste”. “All of our package are easily to be recycled and reused… such as cardboard box package, and plastic turn over box… reduce waste and pollution” “If customer is closed to our firm and we frequently send product to them… we tend to select turn over box although it is plastic… we can 100% recycle these boxes which will not cause waste and solid pollution caused by non-degradable plastics”. |
| Sewage re-duction | “Our sewage mainly comes from washing and spitting processes… so we used environmentally friendly silicone surface treatment adhesive for reduce organic matter in sewage”. “Our main pollution is sewage, so our most green materials utilization aims to reduce sewage. For example, one aim we selected environmentally friendly solder and heavy metal free PCB ink is to avoid produce sewage with heavy metal after following cleaning process. In addition, we used halogen-free solvent as we want to reduce halogenated organic pollutants in sewage”. “We use clean paints and cleaning agents because they come into contact with water and can easily cause water pollution” “We used a pickling agent which has less impact on environment and not be harmful to personal health such as oxalic acid to replace traditional cleaning agent such as vitriol. as we have a great number of sewages during manufacturing process… pickling agent can reduce sewage” |
| Waste gas reduction | “Traditional silicone surface treatment adhesive produces a great number of waste gas, and the main pollutant in waste gas is VOCs… thus, now we utilized green silicone surface treatment adhesive which is low or no VOC solvents… it can reduce air pollution” “We have a large number of welding processes… so there are a lot of waste gas produced during welding processes… and it contains heavy metal particles”. “Traditional paints have pungent smell… and it has various Chemical substance such as formaldehyde… not only harm body health… but also cause air pollution”. “Paints cause serious air pollution… and environmentally friendly paints can reduce the air pollution caused… as they limit pollutant content including VOCs, particulate matter, heavy metal particles…” “We pay attention to air pollution, and our main source of air pollution is paints… so we selected environ-mental friendly paints… they does not contain a lot of pollutant” |
Appendix D. A Version of the Questionnaire
| Green Material Attributes | Green Material 1 | Green Material 2 | Green Material 3 | |
|---|---|---|---|---|
| Price | 12 | 5 | 8 | |
| Weaken performance | Negative | No | No | |
| Toxicity of heavy metal reduction | Low | High | Medium | |
| Recycle rate | 70% | 50% | 100% | |
| Sewage reduction | High | Medium | Low | |
| Waste gas reduction | Low | High | Medium | |
| ☐ | ☐ | ☐ | ||
| Please choose the one you are most satisfied with | ☐ | ☐ | ☐ | |
- 1.
- What is the company’s target pass rate?
- 2.
- How frequently does the company record defect rates?
- 3.
- What is the severity of penalties for not meeting defective product targets?
- 4.
- How much emphasis does the company place on operational skills training for general employees?
- 5.
- How much emphasis does the company place on quality supervision training for supervisors?
- 6.
- How much emphasis does the company place on quality philosophy training for all employees?
- 7.
- How much emphasis does the company place on training employees’ ability to solve production problems?
- 8.
- How much emphasis does the company place on training employees’ skills to reduce material waste?
References
- Cheng, L.; Wu, L. Firms’ Position in the Supply Chain Network, R&D Input, and Innovation Output: Striving for the Top or Settling in the Corner? Implications for Sustainable Growth and Adaptive Capacity. Sustainability 2025, 17, 1729. [Google Scholar] [CrossRef]
- Kiani, A.; Bullini Orlandi, L.; Chen, Q. Greening the path to disruptive innovation: The roles of CEOs characteristics, green organizational identity, and green product competitiveness. Bus. Strategy Environ. 2024, 33, 6139–6155. [Google Scholar] [CrossRef]
- Čater, T.; Čater, B. Product and relationship quality influence on customer commitment and loyalty in B2B manufacturing relationships. Ind. Mark. Manag. 2010, 39, 1321–1333. [Google Scholar] [CrossRef]
- Chen, J.; Liu, L. Customer participation, and green product innovation in SMEs: The mediating role of opportunity recognition and exploitation. J. Bus. Res. 2020, 119, 151–162. [Google Scholar] [CrossRef]
- Duan, F.; Yang, F.; Mu, B.; Zhu, Y.; Wang, A. Production of functional materials from clay minerals and plants for natural resource utilization and sustainable development. J. Clean. Prod. 2024, 474, 143586. [Google Scholar] [CrossRef]
- Saleh, T.A. Protocols for synthesis of nanomaterials, polymers, and green materials as adsorbents for water treatment technologies. Environ. Technol. Innov. 2021, 24, 101821. [Google Scholar] [CrossRef]
- Dicker, M.P.; Duckworth, P.F.; Baker, A.B.; Francois, G.; Hazzard, M.K.; Weaver, P.M. Green composites: A review of material attributes and complementary applications. Compos. Part A Appl. Sci. Manuf. 2014, 56, 280–289. [Google Scholar] [CrossRef]
- Sapuan, S.M.; Mansor, M.R. Design for Sustainability: Green Materials and Processes; Elsevier: Amsterdam, Netherland, 2021; pp. 57–80. [Google Scholar]
- Zeng, J.; Phan, C.A.; Matsui, Y. The impact of hard and soft quality management on quality and innovation performance: An empirical study. Int. J. Prod. Econ. 2015, 162, 216–226. [Google Scholar] [CrossRef]
- Addis, S. An exploration of quality management practices in the manufacturing industry of Ethiopia. TQM J. 2020, 32, 127–142. [Google Scholar] [CrossRef]
- Lim, W.M.; Ciasullo, M.V.; Douglas, A.; Kumar, S. Environmental social governance (ESG) and total quality management (TQM): A multi-study meta-systematic review. Total Qual. Manag. Bus. Excell. 2022; ahead-of-print. 1–23. [Google Scholar] [CrossRef]
- Makhlouf, H.; Chatti, N.; Lakhal, L. The impact of TQM and green innovation on corporate sustainability: The mediating role of green supply chain management. Int. J. Qual. Reliab. Manag. 2023, 40, 2592–2611. [Google Scholar] [CrossRef]
- Abbas, J. Impact of total quality management on corporate green performance through the mediating role of corporate social responsibility. J. Clean. Prod. 2020, 242, 118458. [Google Scholar] [CrossRef]
- Ali, K.; Johl, S.K.; Muneer, A.; Alwadain, A.; Ali, R.F. Soft and hard total quality management practices promote industry 4.0 readiness: A SEM-neural network approach. Sustainability 2022, 14, 11917. [Google Scholar] [CrossRef]
- Wilkinson, A. The other side of quality: ‘soft’ issues and the human resource dimension. Total Qual. Manag. 1992, 3, 323–330. [Google Scholar] [CrossRef]
- Babatunde, O.K. Mapping the implications and competencies for Industry 4.0 to hard and soft total quality management. TQM J. 2021, 33, 896–914. [Google Scholar] [CrossRef]
- Chen, J.K. Identifying critical success factors of total quality management via comprehensive assessment of soft and hard factors. TQM J. 2024, 36, 679–701. [Google Scholar] [CrossRef]
- Gutierrez-Gutierrez, L.J.; Barrales-Molina, V.; Kaynak, H. The role of human resource-related quality management practices in new product development: A dynamic capability perspective. Int. J. Oper. Prod. Manag. 2018, 38, 43–66. [Google Scholar] [CrossRef]
- El Manzani, Y.; El Idrissi, M.; Chouchane, R.; Sony, M.; Antony, J. A meta-analysis of the relationship between quality management and innovation in small and medium-sized enterprises. Prod. Plan. Control. 2024, 1–20. [Google Scholar] [CrossRef]
- Al-Dhaafri, H.S.; Al-Swidi, A.K.; Yusoff, R.Z.B. The mediating role of total quality management between the entrepreneurial orientation and the organizational performance. TQM J. 2016, 28, 89–111. [Google Scholar] [CrossRef]
- Khan, S.A.R.; Yu, Z.; Farooq, K. Green capabilities, green purchasing, and triple bottom line performance: Leading toward environmental sustainability. Bus. Strategy Environ. 2023, 32, 2022–2034. [Google Scholar] [CrossRef]
- Hadjadj, R.; Deák, C.; Palotás, Á.B.; Mizsey, P.; Viskolcz, B. Renewable energy and raw materials–The thermodynamic support. J. Clean. Prod. 2019, 241, 118221. [Google Scholar] [CrossRef]
- Kazancoglu, I.; Kazancoglu, Y.; Yarimoglu, E.; Kahraman, A. A conceptual framework for barriers of circular supply chains for sustainability in the textile industry. Sustain. Dev. 2020, 28, 1477–1492. [Google Scholar] [CrossRef]
- Escrig-Tena, A.B.; Segarra-Ciprés, M.; García-Juan, B.; Beltrán-Martín, I. The impact of hard and soft quality management and proactive behaviour in determining innovation performance. Int. J. Prod. Econ. 2018, 200, 1–14. [Google Scholar] [CrossRef]
- Dangelico, R.M. Green product innovation: Where we are and where we are going. Bus. Strategy Environ. 2016, 25, 560–576. [Google Scholar] [CrossRef]
- Hallam, C.; Contreras, C. Integrating lean and green management. Manag. Decis. 2016, 54, 2157–2187. [Google Scholar] [CrossRef]
- Glew, D.; Stringer, L.C.; Acquaye, A.A.; McQueen-Mason, S. How do end of life scenarios influence the environmental impact of product supply chains? Comparing biomaterial and petrochemical products. J. Clean. Prod. 2012, 29, 122–131. [Google Scholar] [CrossRef]
- Kabir, E.; Kaur, R.; Lee, J.; Kim, K.H.; Kwon, E.E. Prospects of biopolymer technology as an alternative option for non-degradable plastics and sustainable management of plastic wastes. J. Clean. Prod. 2020, 258, 120536. [Google Scholar] [CrossRef]
- Dangelico, R.M.; Pontrandolfo, P. From green product definitions and classifications to the Green Option Matrix. J. Clean. Prod. 2010, 18, 1608–1628. [Google Scholar] [CrossRef]
- Tanksale, A.N.; Das, D.; Verma, P.; Tiwari, M.K. Unpacking the role of primary packaging material in designing green supply chains: An integrated approach. Int. J. Prod. Econ. 2021, 236, 108133. [Google Scholar] [CrossRef]
- Zhou, C.; Qi, S.; Li, Y. Environmental policy uncertainty and green transformation dilemma of Chinese enterprises. J. Environ. Manag. 2024, 370, 122891. [Google Scholar] [CrossRef]
- Gursel, A.P.; Maryman, H.; Ostertag, C. A life-cycle approach to environmental, mechanical, and durability properties of “green” concrete mixes with rice husk ash. J. Clean. Prod. 2016, 112, 823–836. [Google Scholar] [CrossRef]
- Hong, Z.; Guo, X. Green product supply chain contracts considering environmental responsibilities. Omega 2019, 83, 155–166. [Google Scholar] [CrossRef]
- Naqi, A.; Jang, J.G. Recent progress in green cement technology utilizing low-carbon emission fuels and raw materials: A review. Sustainability 2019, 11, 537. [Google Scholar] [CrossRef]
- Aftab, J.; Abid, N.; Cucari, N.; Savastano, M. Green human resource management and environmental performance: The role of green innovation and environmental strategy in a developing country. Bus. Strategy Environ. 2023, 32, 1782–1798. [Google Scholar] [CrossRef]
- Tansel, B. Increasing gaps between materials demand and materials recycling rates: A historical perspective for evolution of consumer products and waste quantities. J. Environ. Manag. 2020, 276, 111196. [Google Scholar] [CrossRef]
- Rustam, A.; Wang, Y.; Zameer, H. Environmental awareness, firm sustainability exposure and green consumption behaviors. J. Clean. Prod. 2020, 268, 122016. [Google Scholar] [CrossRef]
- Huang, Y.C.; Chen, C.T. Institutional pressure, firm’s green resources and green product innovation: Evidence from Taiwan’s electrical and electronics sector. Eur. J. Innov. Manag. 2023, 26, 636–664. [Google Scholar] [CrossRef]
- Flynn, B.B.; Schroeder, R.G.; Sakakibara, S. A framework for quality management research and an associated measurement instrument. J. Oper. Manag. 1994, 11, 339–366. [Google Scholar] [CrossRef]
- Lameijer, B.A.; Boer, H.; Antony, J.; Does, R.J.M.M. Continuous improvement implementation models: A reconciliation and holistic metamodel. Prod. Plan. Control 2023, 34, 1062–1081. [Google Scholar] [CrossRef]
- Phan, A.C.; Nguyen, H.A.; Trieu, P.D.; Nguyen, H.T.; Matsui, Y. Impact of supply chain quality management practices on operational performance: Empirical evidence from manufacturing companies in Vietnam. Supply Chain. Manag. An. Int. J. 2019, 24, 855–871. [Google Scholar] [CrossRef]
- Pimonenko, T.; Bilan, Y.; Horák, J.; Starchenko, L.; Gajda, W. Green brand of companies and greenwashing under sustainable development goals. Sustainability 2020, 12, 1679. [Google Scholar] [CrossRef]
- El Manzani, Y.; El Idrissi, M.; Lissaneddine, Z. Soft quality management practices and product innovation ambidexterity: The mediating role of market orientation ambidexterity. Eur. J. Innov. Manag. 2023, 26, 1333–1364. [Google Scholar] [CrossRef]
- Zeng, J.; Zhang, W.; Matsui, Y.; Zhao, X. The impact of organizational context on hard and soft quality management and innovation performance. Int. J. Prod. Econ. 2017, 185, 240–251. [Google Scholar] [CrossRef]
- Rahman, S.U.; Bullock, P. Soft TQM, hard TQM, and organizational performance relationships: An empirical investigation. Omega 2005, 33, 73–83. [Google Scholar] [CrossRef]
- Carnerud, D.; Mårtensson, A.; Ahlin, K.; Slumpi, T.P. On the inclusion of sustainability and digitalization in quality management–an overview from past to present. Total Qual. Manag. Bus. Excell. 2025, 36, 199–221. [Google Scholar] [CrossRef]
- Fok, L.; Morgan, Y.C.; Zee, S.; Mock, V.E. The impact of organizational culture and total quality management on the relationship between green practices and sustainability performance. Int. J. Qual. Reliab. Manag. 2023, 40, 1564–1586. [Google Scholar] [CrossRef]
- Georgiev, S.; Ohtaki, S. Critical success factors for TQM implementation among manufacturing SMEs: Evidence from Japan. Benchmarking An. Int. J. 2020, 27, 473–498. [Google Scholar] [CrossRef]
- Teoman, S.; Ulengin, F. The impact of management leadership on quality performance throughout a supply chain: An empirical study. Total Qual. Manag. Bus. Excell. 2018, 29, 1427–1451. [Google Scholar] [CrossRef]
- Valmohammadi, C.; Roshanzamir, S. The guidelines of improvement: Relations among organizational culture, TQM and performance. Int. J. Prod. Econ. 2015, 164, 167–178. [Google Scholar] [CrossRef]
- Gadenne, D.; Sharma, B. An investigation of the hard and soft quality management factors of Australian SMEs and their association with firm performance. Int. J. Qual. Reliab. Manag. 2009, 26, 865–880. [Google Scholar] [CrossRef]
- Ghobadian, A.; Gallear, D.N. Total quality management in SMEs. Omega 1996, 24, 83–106. [Google Scholar] [CrossRef]
- Yang, C.C. The effectiveness analysis of the practices in five quality management stages for SMEs. Total Qual. Manag. Bus. Excell. 2020, 31, 955–977. [Google Scholar] [CrossRef]
- Sadikoglu, E.; Zehir, C. Investigating the effects of innovation and employee performance on the relationship between total quality management practices and firm performance: An empirical study of Turkish firms. Int. J. Prod. Econ. 2010, 127, 13–26. [Google Scholar] [CrossRef]
- Shahzad, M.; Qu, Y.; Zafar, A.U.; Appolloni, A. Does the interaction between the knowledge management process and sustainable development practices boost corporate green innovation? Bus. Strategy Environ. 2021, 30, 4206–4222. [Google Scholar] [CrossRef]
- Wang, M.; Liu, Q.; Yu, J.; Liu, M. Study on the Influencing Factors of Green Quality Management System in Manufacturing Enterprises. Ind. Eng. Innov. Manag. 2023, 6, 59–65. [Google Scholar]
- Wei, L.Q.; Liu, J.; Herndon, N.C. SHRM and product innovation: Testing the moderating effects of organizational culture and structure in Chinese firms. Int. J. Human. Resour. Manag. 2011, 22, 19–33. [Google Scholar] [CrossRef]
- Tuan, L.T. Fostering green product innovation through green entrepreneurial orientation: The roles of employee green creativity, green role identity, and organizational transactive memory system. Bus. Strategy Environ. 2023, 32, 639–653. [Google Scholar] [CrossRef]
- Singh, R.K.; Kumar Mangla, S.; Bhatia, M.S.; Luthra, S. Integration of green and lean practices for sustainable business management. Bus. Strategy Environ. 2022, 31, 353–370. [Google Scholar] [CrossRef]
- Iwao, S.; Marinov, M. Linking continuous improvement to manufacturing performance. Benchmarking An. Int. J. 2018, 25, 1319–1332. [Google Scholar] [CrossRef]
- Tseng, M.L.; Wang, R.; Chiu, A.S.; Geng, Y.; Lin, Y.H. Improving performance of green innovation practices under uncertainty. J. Clean. Prod. 2013, 40, 71–82. [Google Scholar] [CrossRef]
- Iqbal, A.; Asrar-ul-Haq, M. Establishing relationship between TQM practices and employee performance: The mediating role of change readiness. Int. J. Prod. Econ. 2018, 203, 62–68. [Google Scholar] [CrossRef]
- Abdullah, M.; Zailani, S.; Iranmanesh, M.; Jayaraman, K. Barriers to green innovation initiatives among manufacturers: The Malaysian case. Rev. Manag. Sci. 2016, 10, 683–709. [Google Scholar] [CrossRef]
- Zhu, Q.; Sarkis, J.; Geng, Y. Green supply chain management in China: Pressures, practices and performance. Int. J. Oper. Prod. Manag. 2005, 25, 449–468. [Google Scholar] [CrossRef]
- Song, M.; Wang, S. Market competition, green technology progress and comparative advantages in China. Manag. Decis. 2018, 56, 188–203. [Google Scholar] [CrossRef]
- Hensher, D.A.; Johnson, L.W. Applied Discrete-Choice Modelling; Routledge: Oxfordshire, UK, 2018; pp. 23–60. [Google Scholar]
- Hensher, D.A.; Rose, J.; Greene, W.H. The implications on willingness to pay of respondents ignoring specific attributes. Transportation 2005, 32, 203–222. [Google Scholar] [CrossRef]
- Victorino, L.; Verma, R.; Plaschka, G.; Dev, C. Service innovation and customer choices in the hospitality industry. Manag. Serv. Qual. An. Int. J. 2005, 15, 555–576. [Google Scholar] [CrossRef]
- Yin, R.K. Case Study Research and Applications: Design and Methods; Sage Publications: Thousand Oaks, CA, USA, 2018; pp. 181–257. [Google Scholar]
- Lehmann, N.; Sloot, D.; Ardone, A.; Fichtner, W. The limited potential of regional electricity marketing–Results from two discrete choice experiments in Germany. Energy Econ. 2021, 100, 105351. [Google Scholar] [CrossRef]
- Hassan, A.S.; Jaaron, A.A. Total quality management for enhancing organizational performance: The mediating role of green manufacturing practices. J. Clean. Prod. 2021, 308, 127366. [Google Scholar] [CrossRef]
- Coca-Cola and Nestle Accused of Misleading Eco Claims. Available online: https://www.bbc.com/news/business-67343893 (accessed on 7 November 2023).
- Keiningham, T.; Aksoy, L.; Bruce, H.L.; Cadet, F.; Clennell, N.; Hodgkinson, I.R.; Kearney, T. Customer experience driven business model innovation. J. Bus. Res. 2020, 116, 431–440. [Google Scholar] [CrossRef]
- Gunasekaran, A.; Subramanian, N.; Ngai, W.T.E. Quality management in the 21st century enterprises: Research pathway towards Industry 4.0. Int. J. Prod. Econ. 2019, 207, 125–129. [Google Scholar] [CrossRef]
- Prajogo, D.; Toy, J.; Bhattacharya, A.; Oke, A.; Cheng, T.C.E. The relationships between information management, process management and operational performance: Internal and external contexts. Int. J. Prod. Econ. 2018, 199, 95–103. [Google Scholar] [CrossRef]
- Wei, Y.M.; Chen, K.; Kang, J.N.; Chen, W.; Wang, X.Y.; Zhang, X. Policy and management of carbon peaking and carbon neutrality: A literature review. Engineering 2022, 14, 52–63. [Google Scholar] [CrossRef]
- An, Q.; Zhu, K.; Xiong, B.; Shen, Z. Carbon resource reallocation with emission quota in carbon emission trading system. J. Environ. Manag. 2023, 327, 116837. [Google Scholar] [CrossRef]
- Graham, S.; Cadden, T.; Treacy, R. Examining the influence of employee engagement in supporting the implementation of green supply chain management practices: A green human resource management perspective. Bus. Strategy Environ. 2023, 32, 4750–4766. [Google Scholar] [CrossRef]
| Attribute | No. of Levels | Levels |
|---|---|---|
| Price | 3 | 5, 8, 10 (CNY 10,000) |
| Weakened performance | 3 | Positive, None, Negative |
| Heavy metal toxicity reduction | 3 | Low, Medium, High |
| Recycling rate | 3 | 50%, 70%, 100% |
| Sewage reduction | 3 | Low, Medium, High |
| Waste gas reduction | 3 | Low, Medium, High |
| Firm Characteristics | Frequency | Percentage | |
|---|---|---|---|
| Annual sales (CNY) | Less than 10 million | 40 | 12.88% |
| 10–50 million | 133 | 42.39% | |
| 50–100 million | 97 | 30.99% | |
| More than 100 million | 43 | 13.74% | |
| Number of employees | Less than 50 employees | 31 | 9.92% |
| 50–100 employees | 134 | 22.04% | |
| 100–150 employees | 55 | 17.57% | |
| 150–200 employees | 65 | 20.76% | |
| 200–250 employees | 92 | 29.71% | |
| The ratio of foreign customers | Lower than 10% | 116 | 37.06% |
| 10–20% | 91 | 29.07% | |
| 20–30% | 66 | 21.09% | |
| 30–40% | 28 | 8.95% | |
| More than 40% | 12 | 3.83% | |
| Industry | Electronic and electrical | 76 | 24.29% |
| Mechanical manufacturing | 75 | 23.96% | |
| Food | 18 | 5.75% | |
| Raw material manufacturing | 27 | 8.63% | |
| Textile | 21 | 6.71% | |
| Auto | 24 | 7.67% | |
| Chemical engineering | 21 | 6.71% | |
| Medical | 18 | 5.74% | |
| Home decoration | 33 | 10.54% |
| Province | Number of Surveys | Percentage |
|---|---|---|
| Zhejiang | 38 | 12.15% |
| Guangdong | 36 | 11.50% |
| Shanghai | 25 | 7.99% |
| Beijing | 24 | 7.67% |
| Jiangsu | 19 | 6.07% |
| Hebei | 18 | 5.75% |
| Henan | 17 | 5.43% |
| Sichuan | 17 | 5.43% |
| Hubei | 15 | 4.79% |
| Anhui | 14 | 4.47% |
| Guangxi | 14 | 4.47% |
| Shandong | 14 | 4.47% |
| Hunan | 13 | 4.15% |
| Fujian | 10 | 3.19% |
| Shaanxi | 10 | 3.19% |
| Liaoning | 8 | 2.56% |
| Chongqing | 8 | 2.56% |
| Heilongjiang | 2 | 0.64% |
| Jilin | 2 | 0.64% |
| Neimenggu | 2 | 0.64% |
| Shanxi | 2 | 0.64% |
| Yunnan | 2 | 0.64% |
| Jiangxi | 1 | 0.32% |
| Qinghai | 1 | 0.32% |
| Tianjin | 1 | 0.32% |
| Variable | Explanation | Coefficient |
|---|---|---|
| Pprice | Material attribute: price | βpr1, βpr2, βpr3 |
| Ptox | Material attribute: heavy metal toxicity reduction | βtox1, βtox2, βtox3 |
| Pweak | Material attribute: weakened performance | βweak1, βweak2, βweak3 |
| Precy | Material attribute: recycling rate | βrecy1, βrecy2, βrecy3 |
| Psew | Material attribute: sewage reduction | βsew1, βsew2, βsew3 |
| Pgas | Material attribute: gaseous waste reduction | βgas1, βgas2, βgas3 |
| Ztrain | Quality management attribute: quality training | βtrain |
| Zstand | Quality management attribute: quality standards | βstand |
| ZtrainPtox | Interaction term between quality training and heavy metal toxicity reduction | βtrtox1, βtrtox2, βtrtox3 |
| ZtrainPrecy | Interaction term between quality training and recycling rate | βtrrecy1, βtrrecy2, βtrrecy3 |
| ZtrainPsew | Interaction term between quality training and sewage reduction | βtrsew1, βtrsew2, βtrsew3 |
| ZtrainPgas | Interaction term between quality training and waste gas reduction | βtrgas1, βtrgas2, βtrgas3 |
| ZstandPtox | Interaction term between quality standards and heavy metal toxicity reduction | βsttox1, βsttox2, βsttox2 |
| ZstandPrecy | Interaction term between quality standards and recycling rate | βstrecy1, βstrecy2, βstrecy3 |
| ZstandPsew | Interaction term between quality standards and sewage reduction | βstsew1, βstsew2, βstsew3 |
| ZstandPgas | Interaction term between quality standards and waste gas reduction | βstgas1, βstgas2, βstgas3 |
| Attributes | Model 1 | Model 2 | Model 3 | Model 4 | Model 5 | Model 6 | Model 7 | Model 8 | Model 9 |
|---|---|---|---|---|---|---|---|---|---|
| Price | 0.022 | 0.030 | 0.017 | 0.022 | 0.072 | 0.027 | 0.017 | 0.025 | 0.043 |
| Weakened performance | –0.292 *** | −0.319 *** | −0.296 *** | −0.292 *** | −2.187 ** | −0.313 *** | −0.294 *** | −0.304 *** | −1.816 *** |
| Heavy metal toxicity reduction | 0.224 *** | −1.005 * | 0.212 *** | 0.225 *** | 1.154 ** | −0.950 * | 0.210 *** | 0.246 ** | 0.963 ** |
| Recycling rate | 2.749 *** | 2.946 *** | 1.481 ** | 2.759 *** | 14.67 *** | 2.910 *** | 1.407 ** | 2.916 *** | 12.96 *** |
| Sewage reduction | 0.262 *** | 0.270 *** | 0.258 *** | −0.263 *** | −12.964 *** | 0.273 *** | 0.257 *** | 0.286 *** | 13.409 *** |
| Waste gas reduction | 0.368 *** | 0.389 *** | 0.358 *** | 0.458 | 2.033. | 0.389 *** | 0.360 *** | 1.123 | 1.944 *** |
| Quality training | 2.056 *** | 2.135 *** | 1.997 *** | 2.069 *** | 15.377 ** | 2.110 *** | 1.949 *** | 2.216 | 13.083 *** |
| Quality standards | −1.533 *** | −1.598 *** | −1.489 *** | −1.542 *** | −11.347 ** | −1.582 *** | −1.456 *** | −1.652 | −9.733 *** |
| Quality training * heavy metal toxicity reduction | 0.319 ** | ||||||||
| Quality training * recycling rate | 0.324 * | ||||||||
| Quality training * waste gas reduction | −0.022 | ||||||||
| Quality training * sewage reduction | 3.718 *** | ||||||||
| Quality standards * heavy metal toxicity reduction | 0.300 *** | ||||||||
| Quality standards * recycling rate | 0.335 ** | ||||||||
| Quality standards * waste gas reduction | −0.185 | ||||||||
| Quality standards * sewage reduction | −2.915 *** | ||||||||
| Log-likelihood | −1031.125 | −1025.217 | −1016.438 | −1025.263 | −1016.835 | −1028.753 | −1027.552 | −1030.585 | −1013.320 |
| Attributes | Model 1 | Model 2 | Model 3 | Model 4 | Model 5 | Model 6 | Model 7 | Model 8 | Model 9 |
|---|---|---|---|---|---|---|---|---|---|
| Price | 0.025 | 0.029 | 0.020 | 0.024 | 0.048 | 0.026 | 0.019 | 0.027 | 0.043 |
| Weakened performance | −0.306 *** | −0.305 *** | −0.302 *** | −0.296 *** | −1.099 ** | −0.300 *** | −0.300 *** | −0.304 *** | −1.271 *** |
| Heavy metal toxicity reduction | 0.221 *** | −0.781 * | 0.205 *** | 0.216 *** | 0.551 ** | −0.719 | 0.202 *** | 0.234 *** | 0.733 *** |
| Recycling rate | 2.776 *** | 2.887 *** | 1.428 *** | 2.767 *** | 7.924 *** | 2.853 *** | 1.361 ** | 2.909 *** | 9.434 ** |
| Sewage reduction | 0.261 *** | 0.263 *** | 0.252 *** | 0.254 *** | −6.672 ** | 0.265 *** | 0.251 *** | 0.276 *** | 9.271 |
| Waste gas reduction | 0.366 *** | 0.381 *** | 0.356 *** | 0.295 | 1.058 *** | 0.381 *** | 0.358 *** | 1.046 *** | 1.343 *** |
| Quality training | 2.264 *** | 2.007 *** | 2.011 *** | 2.032 *** | 6.669 ** | 1.988 *** | 1.971 *** | 2.155 *** | 9.528 * |
| Quality standards | −1.687 *** | −1.501 *** | −1.498 *** | −1.514 *** | −4.987 ** | −1.489 *** | −1.472 *** | −1.604 | −6.989 *** |
| Quality training * heavy metal toxicity reduction | 0.257 ** | ||||||||
| Quality training * recycling rate | 0.345 ** | ||||||||
| Quality training * waste gas reduction | 0.017 | ||||||||
| Quality training * sewage reduction | 1.905 ** | ||||||||
| Quality standards * heavy metal toxicity reduction | 0.236 ** | ||||||||
| Quality standards * recycling rate | 0.355 *** | ||||||||
| Quality standards * waste gas reduction | −0.167 | ||||||||
| Quality standards * sewage reduction | −2.029 *** | ||||||||
| Log-likelihood | −1028.139 | −1031.203 | −1029.280 | −1032.869 | −1019.350 | −1031.456 | −1028.963 | −1032.425 | −1024.033 |
Disclaimer/Publisher’s Note: The statements, opinions and data contained in all publications are solely those of the individual author(s) and contributor(s) and not of MDPI and/or the editor(s). MDPI and/or the editor(s) disclaim responsibility for any injury to people or property resulting from any ideas, methods, instructions or products referred to in the content. |
© 2025 by the authors. Licensee MDPI, Basel, Switzerland. This article is an open access article distributed under the terms and conditions of the Creative Commons Attribution (CC BY) license (https://creativecommons.org/licenses/by/4.0/).
Share and Cite
Wang, L.; Zhang, M.; Cao, H.; Teng, T. The Impacts of Quality Management on Green Material Utilization: A Small- and Medium-Sized Chinese Enterprises’ Perspective. Sustainability 2025, 17, 3688. https://doi.org/10.3390/su17083688
Wang L, Zhang M, Cao H, Teng T. The Impacts of Quality Management on Green Material Utilization: A Small- and Medium-Sized Chinese Enterprises’ Perspective. Sustainability. 2025; 17(8):3688. https://doi.org/10.3390/su17083688
Chicago/Turabian StyleWang, Liecheng, Min Zhang, Hongwei Cao, and Teng Teng. 2025. "The Impacts of Quality Management on Green Material Utilization: A Small- and Medium-Sized Chinese Enterprises’ Perspective" Sustainability 17, no. 8: 3688. https://doi.org/10.3390/su17083688
APA StyleWang, L., Zhang, M., Cao, H., & Teng, T. (2025). The Impacts of Quality Management on Green Material Utilization: A Small- and Medium-Sized Chinese Enterprises’ Perspective. Sustainability, 17(8), 3688. https://doi.org/10.3390/su17083688