Article

Optimization of the Green Products Selection for Express Packaging—Based on the Improved TOPSIS

1
College of Transportation and Civil Engineering, Fujian Agriculture and Forestry University, Fuzhou 350108, China
2
Jinshan College, Fujian Agriculture and Forestry University, Fuzhou 350002, China
3
College of Economics and Management, Fujian Agriculture and Forestry University, Fuzhou 350002, China
*
Author to whom correspondence should be addressed.
Sustainability 2025, 17(8), 3672; https://doi.org/10.3390/su17083672
Submission received: 26 February 2025 / Revised: 11 April 2025 / Accepted: 12 April 2025 / Published: 18 April 2025

Abstract

:
By researching how to select green products for express packaging, this study provides a scientific decision-making basis and methodology for logistics enterprises, encouraging them to accelerate green transformation and meet consumer demands. This article proposes a method for logistics companies to evaluate green products using specific indicators. First, triangular fuzzy numbers and their α-levels are incorporated into the calculation process. Second, when determining the weights of each indicator, both the priority and its relative degree are considered, enhancing the evaluation in relevant scenarios. Finally, an improved approach for calculating positive and negative ideal solutions in the TOPSIS method is presented. Through numerical examples, we demonstrate that the value of α in the improved fuzzy TOPSIS method proposed in this study critically influences logistics enterprises’ selection of container bag suppliers.

1. Introduction

With the rapid development of the global economy, the traditional development model has led to severe environmental and resource challenges, including climate change, ecological degradation, and energy shortages. These issues not only threaten the survival and development of humanity but also significantly constrain sustainable economic growth. Simultaneously, public expectations for quality of life continue to rise, while the demand for a healthy ecological environment has grown increasingly urgent. The concept of green development has gradually been integrated into various industries.
In the logistics sector, express packaging has garnered significant attention. As the primary users of express packaging, logistics enterprises are obligated to take action to mitigate its environmental impact. The State Post Bureau of China has issued the Technical Requirements for Evaluation of Green Products for Express Packaging, which establishes green criteria for the express packaging industry and outlines specific requirements for evaluating green products. This document serves as a critical reference for logistics enterprises when selecting environmentally friendly packaging solutions. Modern consumers are placing growing emphasis on environmental protection concerns. They increasingly prefer services offered by enterprises committed to sustainable development. Utilizing green packaging products can strengthen a company’s image in terms of consumer perception and foster brand loyalty. In the long term, the sustainable growth of logistics enterprises is closely tied to proactive environmental stewardship. Adopting eco-friendly packaging solutions not only reduces corporate environmental risks but also enhances resource efficiency, thereby bolstering an enterprise’s capacity for sustainable development. Green express packaging products involve multiple evaluation indicators. Logistics companies must select manufacturers that meet their specific requirements. These manufacturers should be chosen from the available pool of green packaging suppliers. This selection process constitutes the core focus of the present study.
This study is structured around five core modules that systematically present the research logic and innovative pathways. The first section clarifies the research background by focusing on the decision-making challenges in selecting optimal green packaging suppliers within the context of green logistics transformation, revealing both theoretical gaps and practical demands. The second section conducts a comprehensive literature analysis, identifying limitations in existing methods for addressing non-compensatory indicators and dynamic priority requirements through a systematic review of recent studies, thereby establishing the theoretical breakthroughs of this research. The third section innovatively constructs a dual-dimensional methodology that details the improved approaches, parametric definitions, and workflow visualizations to ensure reproducibility. The fourth section applies the enhanced model to green packaging supplier selection scenarios, demonstrating its effectiveness through quantifiable performance metrics. Finally, the conclusion and prospects section not only summarizes methodological innovations but also explores the model’s extended applications in circular economy policy evaluation and cross-industry sustainability assessments, proposing adaptive implementation frameworks for diverse contexts.

2. Literature Review

With the exponential growth of China’s express delivery industry and the deepening advancement of the “dual carbon” goals, academic research on green packaging transformation has emerged as a critical issue in the field of sustainable development. Current studies demonstrate a multidimensional and in-depth developmental trajectory: Guo et al. [1] established a scientometric model to reveal the green transformation pathways of China’s express packaging, with their proposed multi-stakeholder collaborative governance framework laying a methodological foundation for subsequent research. Zhou et al. [2] innovatively integrated rough set theory with the TOPSIS method to construct a dynamic weight model encompassing environmental, resource, energy, economic, and social dimensions, significantly enhancing packaging design optimization through its visualized ranking function. Shi and Ruan [3] combined the ISM-ANP-gray fuzzy evaluation system, providing practical evidence for applying interdisciplinary theories to assess packaging sustainability. In applied technology research addressing industry challenges, Ke et al. [4] resolved material adhesion issues through structural innovation, while Xu et al. [5] employed AHP-fuzzy comprehensive evaluation to identify bottlenecks such as non-recyclable material dominance and standardization gaps, establishing new paradigms through their full lifecycle R&D-design-recovery solution. As research extends into behavioral science, Sun and Li [6] developed a psychological–behavioral benefit model revealing government-enterprise game equilibrium mechanisms, findings that resonate with Gonzalo et al.’s [7] multinational studies in validating nonlinear relationships between green cost allocation and consumer willingness. Building on this foundation, Jia et al. [8] quantitatively confirmed consumers’ environmental payment intentions, and Wu et al. [9] advanced a complex network evolutionary game model using multi-agent simulations to elucidate policy–network topology coupling mechanisms, creating an innovative framework for dual carbon-oriented technology diffusion.
While existing research has addressed multiple dimensions of green express packaging, a critical gap remains in enterprise-level product optimization strategies. Current literature predominantly focuses on macro-level evaluation systems, yet rarely explores dynamic decision-making models tailored to logistics enterprises’ operational needs based on packaging attributes. Bridging this gap requires methodological innovations to align theoretical frameworks with industry-specific challenges.
As the methodological cornerstone of green packaging evaluation systems, the research evolution of Multi-Attribute Decision Making (MADM) and its core technique TOPSIS has established universal frameworks for cross-domain optimization. Rooted in operations research, MADM emphasizes systematic trade-offs among criteria to achieve optimal selection, with TOPSIS emerging as a focal innovation due to its theoretical rigor and practical adaptability. The foundational TOPSIS model proposed by Hwang and Yoon [10] in 1981, based on the dual distance minimization principle [11] that simultaneously approximates positive ideal solutions and distances from negative ones, laid the groundwork for geometric spatial analysis for multidimensional decision-making. Building on this framework, Li et al. [12] innovatively integrated entropy-weighted TOPSIS with prefix tree caching technology.
As applications expanded, TOPSIS demonstrated robust domain adaptability. In energy infrastructure, Ning et al. [13] enhanced safety assessments for battery storage stations using modified AHP, while Geng et al. [14] developed a mechanical–electrical–chemical multi-feature index system for transformer insulation aging evaluation through combined subjective–objective weighting and Euclidean–gray correlation composite metrics. Addressing traditional limitations, scholars advanced methodological innovations—Rawat et al. [15] optimized TOPSIS normalization via multi-indicator screening to overcome constraints in cement composite optimization, and Li et al. [16] resolved interval number challenges through dynamic modeling. Notably, TOPSIS-based collaborative innovations excel in complex risk management. Chen et al. [17] assessed shield tunneling risks using fuzzy AHP-interval TOPSIS, and Ji et al. [18] evaluated algal bloom risks with improved fuzzy AHP-entropy-game theory. Theoretically, Xie et al. [19] advanced intuitionistic fuzzy TOPSIS for unknown weight scenarios. Empirical studies [20,21,22,23,24,25,26] confirm that these enhanced models effectively address domain-specific challenges. Contemporary MADM research systematically transcends domain constraints through combinatorial innovation, validating TOPSIS’s scalable derivative mechanisms and providing dynamic methodological support for complex decision-making scenarios, including green packaging optimization.
As a critical complement to the TOPSIS methodological framework, the advancement of fuzzy decision theory has effectively addressed the dual challenges of incomplete information and path uncertainty in real-world decision-making. The foundational work by Evangelos and Tun [27] pioneered a linguistic multi-criteria decision framework, characterizing fuzzy information through linguistic variables and innovating triangular fuzzy number distance calculations via the vertex method, thereby establishing mathematical foundations for fuzzy TOPSIS. Subsequent research established a progressive system. Chen [28] extended TOPSIS to fuzzy environments by employing triangular fuzzy numbers to represent linguistic term-based alternative ratings and criterion weights, designing vertex-based distance computations. Chen and Tzeng [29] further integrated fuzzy AHP with gray relational modeling to construct a comprehensive decision-making chain. Notably, methodological innovations remain closely aligned with practical demands, exemplified by Ayyildiz and Erdogan [30], who combined SWARA weighting with enhanced TOPSIS under Fermatean fuzzy sets to resolve smart city parking challenges. Theoretically, Wang and Elhag [31] developed α-level set-based nonlinear programming, optimizing fuzzy TOPSIS computations while establishing method-selection criteria by revealing intrinsic connections with fuzzy weighted averaging. This symbiotic relationship between theoretical exploration and practical implementation is comprehensively validated across studies [32,33,34,35].
The multi-criteria evaluation of green express packaging faces three key challenges: firstly, existing green packaging studies predominantly focus on macro-level policies and consumer behavior while neglecting enterprise-level dynamic decision-making needs, resulting in disconnected evaluation frameworks. Secondly, the application of the TOPSIS method in logistics scenarios remains constrained by the absence of dynamic models adaptable to real-time packaging selection changes. Thirdly, current approaches inadequately address interactions between packaging material evaluation metrics, relying on static weighting mechanisms that fail to dynamically capture core parameter weight shifts across diverse transportation contexts. Furthermore, despite theoretical advancements in TOPSIS for handling fuzzy environments, its practical implementation in green packaging evaluation remains restricted by conventional frameworks, lacking effective integration of multidimensional uncertainty modeling, which undermines operational feasibility in complex decision-making scenarios.

3. Improved TOPSIS Method

3.1. Triangular Fuzzy Numbers and Their Related Concepts

3.1.1. Triangular Fuzzy Number

Let a ˜ = ( a l , a m , a r ) be denoted as a triangular fuzzy number, and a l a m a r . Let a l , a m and a r be called the lower limit value, mean value, and upper limit value of the triangular fuzzy number, respectively. Among them, the mean value represents the most likely value, and the lower limit value and the upper limit value represent the minimum possible value and the maximum possible value, respectively. The membership function of the triangular fuzzy number is given as shown in Equation (1). It can be known from Equation (1) that when a l = a m = a r , the triangular fuzzy number degenerates into a real number. That is to say, any real number can be expressed in the form of a triangular fuzzy number.
Since the evaluation values studied in this paper are non-negative, only triangular fuzzy numbers in the non-negative case are considered, that is a l 0 .
μ a ˜ ( x ) = x a l a m a l , x [ a l , a m ) 1 , x = a m a r x a r a m , x ( a m , a r ] 0 ,   x ( , a l ) ( a r , + )
Suppose a ˜ = ( a l , a m , a r ) and b ˜ = ( b l , b m , b r ) are any two triangular fuzzy numbers, and the related operation rules are as follows:
a ˜ + b ˜ = ( a l + b l , a m + b m , a r + b r ) a ˜ b ˜ = ( a l b r , a m b m , a r b l ) a ˜ b ˜ = ( a l b l , a m b m , a r b r ) a ˜ b ˜ = ( a l b r , a m b m , a r b l )
when λ 0 and λ R , then λ a ˜ = ( λ a l , λ a m , λ a r ) ; when λ < 0 , λ a ˜ = ( λ a r , λ a m , λ a l ) .

3.1.2. The α Level of Triangular Fuzzy Numbers

Let a ˜ ( α ) = { x | μ a ˜ x α } be the α level set of the triangular fuzzy number a ˜ = ( a l , a m , a r ) where, combined with Equation (1), it can be known that any α level of the triangular fuzzy number is an interval number, denoted as a ˜ ( α ) = [ a L ( α ) , a R ( α ) ] , where a L ( α ) = α a m + ( 1 α ) a l , a R ( α ) = α a m + ( 1 α ) a r . In particular, when α = 0 , a ˜ ( 0 ) = [ a L ( 0 ) , a R ( 0 ) ] = [ a l , a r ] ; α = 1 , a ¯ ( 1 ) = [ a L ( 1 ) , a R ( 1 ) ] = [ a m , a m ] = a m . The α level of any triangular fuzzy number a is shown in Figure 1 below.
The α level of the fuzzy numbers a ˜ and b ˜ are given, respectively, as a ˜ ( α ) = [ a L ( α ) , a R ( α ) ] and b ˜ ( α ) = [ b L ( α ) , b R ( α ) ] , and the main operation rules between them are as follows:
a ˜ ( α ) + b ˜ ( α ) = [ a L ( α ) + b L ( α ) , a R ( α ) + b R ( α ) ] a ˜ ( α ) b ˜ ( α ) = [ a L ( α ) b L ( α ) , a R ( α ) b R ( α ) ] a ˜ ( α ) b ˜ ( α ) = [ a L ( α ) b L ( α ) , a R ( α ) b R ( α ) ] γ a ˜ ( α ) = [ γ a L ( α ) , γ a R ( α ) ] ( γ > 0 ) [ γ a R ( α ) , γ a L ( α ) ]   ( γ > 0 )  

3.2. TOPSIS Method

  • Normalize the evaluation value decision matrix X = ( x i j ) n × m , which can be expressed as
    p i j = x i j i = 1 n x i j 2 , i = 1 , , n ;   j = 1 , , m
2.
Calculate the weight-normalized decision matrix after increasing the weights, which can be expressed as
q i j = w j c i j , i = 1 , , n ;   j = 1 , , m
where w j represents the weight of attribute j , and i = 1 m w j = 1 .
3.
Determine the positive ideal solution and the negative ideal solution
A + = q 1 + , q 2 + , , q m + = ( max q i j j | j J 1 ) , ( min q i j j | j J 2 ) A = q 1 , q 2 , , q m = ( min q i j j | j J 1 ) , ( max q i j j | j J 2 )
4.
Calculate the Euclidean distance of each attribute to the positive ideal solution and the negative ideal solution, respectively.
E i + = j = 1 m ( q i j q j + ) 2 , i = 1 , 2 , , n E i = j = 1 m ( q i j q j ) 2 , i = 1 , 2 , , n
5.
Calculate the relative closeness coefficient of each alternative. The relative closeness coefficient of alternative A i can be expressed as
R C i = E i E i + + E i , i = 1 , 2 , , n
6.
The optimal alternative is the closest to the ideal solution. After calculating the R C i of each solution, find the R C i with the largest value. The corresponding alternative A i is the optimal alternative.

3.3. The Proposed Improved TOPSIS Method

In complex decision-making scenarios, multi-attribute evaluation systems typically exhibit two distinct characteristics: conventional weighting methods effectively achieve equitable decisions when moderate compensation exists between attributes, yet they reveal systemic limitations in problems with pronounced priority structures. The core features of such priority-driven problems lie in (1) the non-compensability among evaluation criteria and (2) the significant impact of priority differences on comprehensive scoring outcomes. A case in point is aviation safety decision-making, where any model attempting to offset safety risks with economic compensation leads to biased conclusions when safety attributes conflict with economic indicators. This demonstrates the failure mechanism of fixed-weight methods in priority-dominated decisions—their equilibrium compensation property obscures the decisive influence of critical attributes.
To address these theoretical challenges, scholars have systematically explored priority-sensitive decision frameworks. In their logistics enterprise rating study, Zhao et al. [36] developed a dual-assessment model that not only identifies attribute priority sequences but also innovatively introduces a “priority intensity” dimension. Their empirical findings reveal that when the membership degree of the highest-priority attribute (e.g., service quality) falls below critical thresholds, excellent performance in other attributes generates non-compensable veto effects—a phenomenon unrepresentable through traditional weighting models, thus highlighting the necessity of simultaneous priority-intensity consideration. Building on this foundation, this study proposes an enhanced weighting framework that inherits priority sequence modeling while enabling dynamic weight allocation through intensity regulation factors. Drawing from logistics case studies, we construct a three-dimensional regulation mechanism comprising attribute hierarchy positioning coefficients, priority intensity decay functions, and cross-level compensation constraints, generating composite weights to replace traditional TOPSIS static systems. This improvement preserves algorithmic advantages while enabling gradient-based reflection of priority structure impacts through dynamic weight vectors.
  • Fuzzy Evaluation Representation: Let x i j f denote the fuzzy rating value, capturing Company A i ’s linguistic assessment of indicator o j . To mathematically operationalize evaluation fuzziness, triangular fuzzy number x i j f = ( a i j l , a i j m , a i j r ) are employed, where the triple explicitly models vagueness in decision judgments.
  • Fuzzy Matrix Normalization: The raw fuzzy matrix X f = ( x i j f ) n × m requires normalization to ensure dimensional homogeneity. For benefit-type indicators ( Ω b ) and cost-type indicators ( Ω c ), distinct normalization operators are applied:
    x ˜ i j f = ( a i j l t j + , a i j m t j + , a i j r t j + ) , i = 1 , , n ; j Ω b ( t j a i j r , t j a i j m , t j a i j l ) , i = 1 , , n ; j Ω c
    t j + = max a i j r i , j Ω b t j = min a i j l i , j Ω c
    This preserves the triangular structure of normalized values X f = ( x ˜ i j f ) n × m .
  • Priority-Intensity Weighting: Suppose the priority of m evaluation indicators is P 1 , , P m , and it satisfies P 1 > > P m . M i j is considered as an intermediate variable of a triangular fuzzy number. Define M i 1 = ( 1 , 1 , 1 ) ( i = 1 , , n ) , and M i j = s = 2 j p i ( s 1 ) = p i 1 p i 2 p i ( s 1 ) . The degree of priority of each evaluation indicator is L 1 , , L m , which is represented by a triangular fuzzy number as L j ( j = 1 , , m ) . The following treatment is made to the degree of priority L j = L j j = 1 m L j . The obtained L j is still a triangular fuzzy number. Introduce N j as an intermediate variable of a triangular fuzzy number. Define N 1 = ( 1 , 1 , 1 ) and N j = s = 2 j L j ( s 1 ) = N 1 N 2 N ( s 1 ) . When considering both priority and degree of priority, the intermediate variable is M i j . Define M i 1 = ( 1 , 1 , 1 ) and M i j = s = 2 j p i ( s 1 ) N s 1 ( i = 1 , , n ) . At this time, the weight w i j = M i j s = 1 m M i s of considering both x ˜ i j f ( α ) = [ x ˜ i j f L ( α ) , x ˜ i j f R ( α ) ] priority and degree of priority of evaluation indicators can be obtained.
  • α-cut Operationalization: At a prescribed confidence level α, normalized fuzzy evaluations x ˜ i j f and weights w i j are projected into interval-valued forms:
    w i j ( α ) = [ w i j L ( α ) , w i j R ( α ) ]
    The weighted fuzzy matrix V = [ v i j ( α ) ] n × m then becomes:
    v i j ( α ) = [ v i j L ( α ) , v i j R ( α ) ] = [ w i j L ( α ) x ˜ i j f L ( α ) , w i j R ( α ) x ˜ i j f R ( α ) ]
    Establishing interval-valued comparability across alter natives.
  • Ideal Reference Definition: The positive ideal solution A j + and negative ideal solution A j are constructed as:
    A + = { max i v i 1 ( α ) , , max i v i m ( α ) } = { p 1 + , p 2 + , , p m + } A = { min i v i 1 ( α ) , , min i v i m ( α ) } = { p 1 , p 2 , , p m }
  • Enhanced Distance Measurement: Employing the entropy-weighted (EW) distance metric [37], the separation between alternative A i and ideal references is quantified as:
    d i + = j = 1 n d E W ( v i j ( α ) , p j + ) = 1 n j = 1 n | E ( v i j ( α ) ) E ( p j + ) | p + 1 3 | W ( v i j ( α ) ) W ( p j + ) | p p , ( i = 1 , , n )
    d i = j = 1 n d E W ( v i j ( α ) , p j ) = 1 n j = 1 n | E ( v i j ( α ) ) E ( p j ) | p + 1 3 | W ( v i j ( α ) ) W ( p j ) | p p , ( i = 1 , , n )
    where E and W denote interval expected value and width, respectively. This dual-perspective metric captures both central tendency divergence and uncertainty spread.
  • Relative Closeness Computation: The proximity of each alternative to the optimized is measured by:
    R C i = d i + d i + + d i
    where R C i [ 0 , 1 ] , with higher values indicating superior overall performance.
  • Decision Ranking: Alternatives are ranked by descending R C i values, formalized as A o p t = arg max A i A R C i . Thereby identifying the Pareto-efficient solution under fuzzy-probabilistic constraints.
Figure 2 shows a flow chart of the improved topsis method, which can be more intuitive and clear to understand this process.

4. Model Application

4.1. Numerical Examples

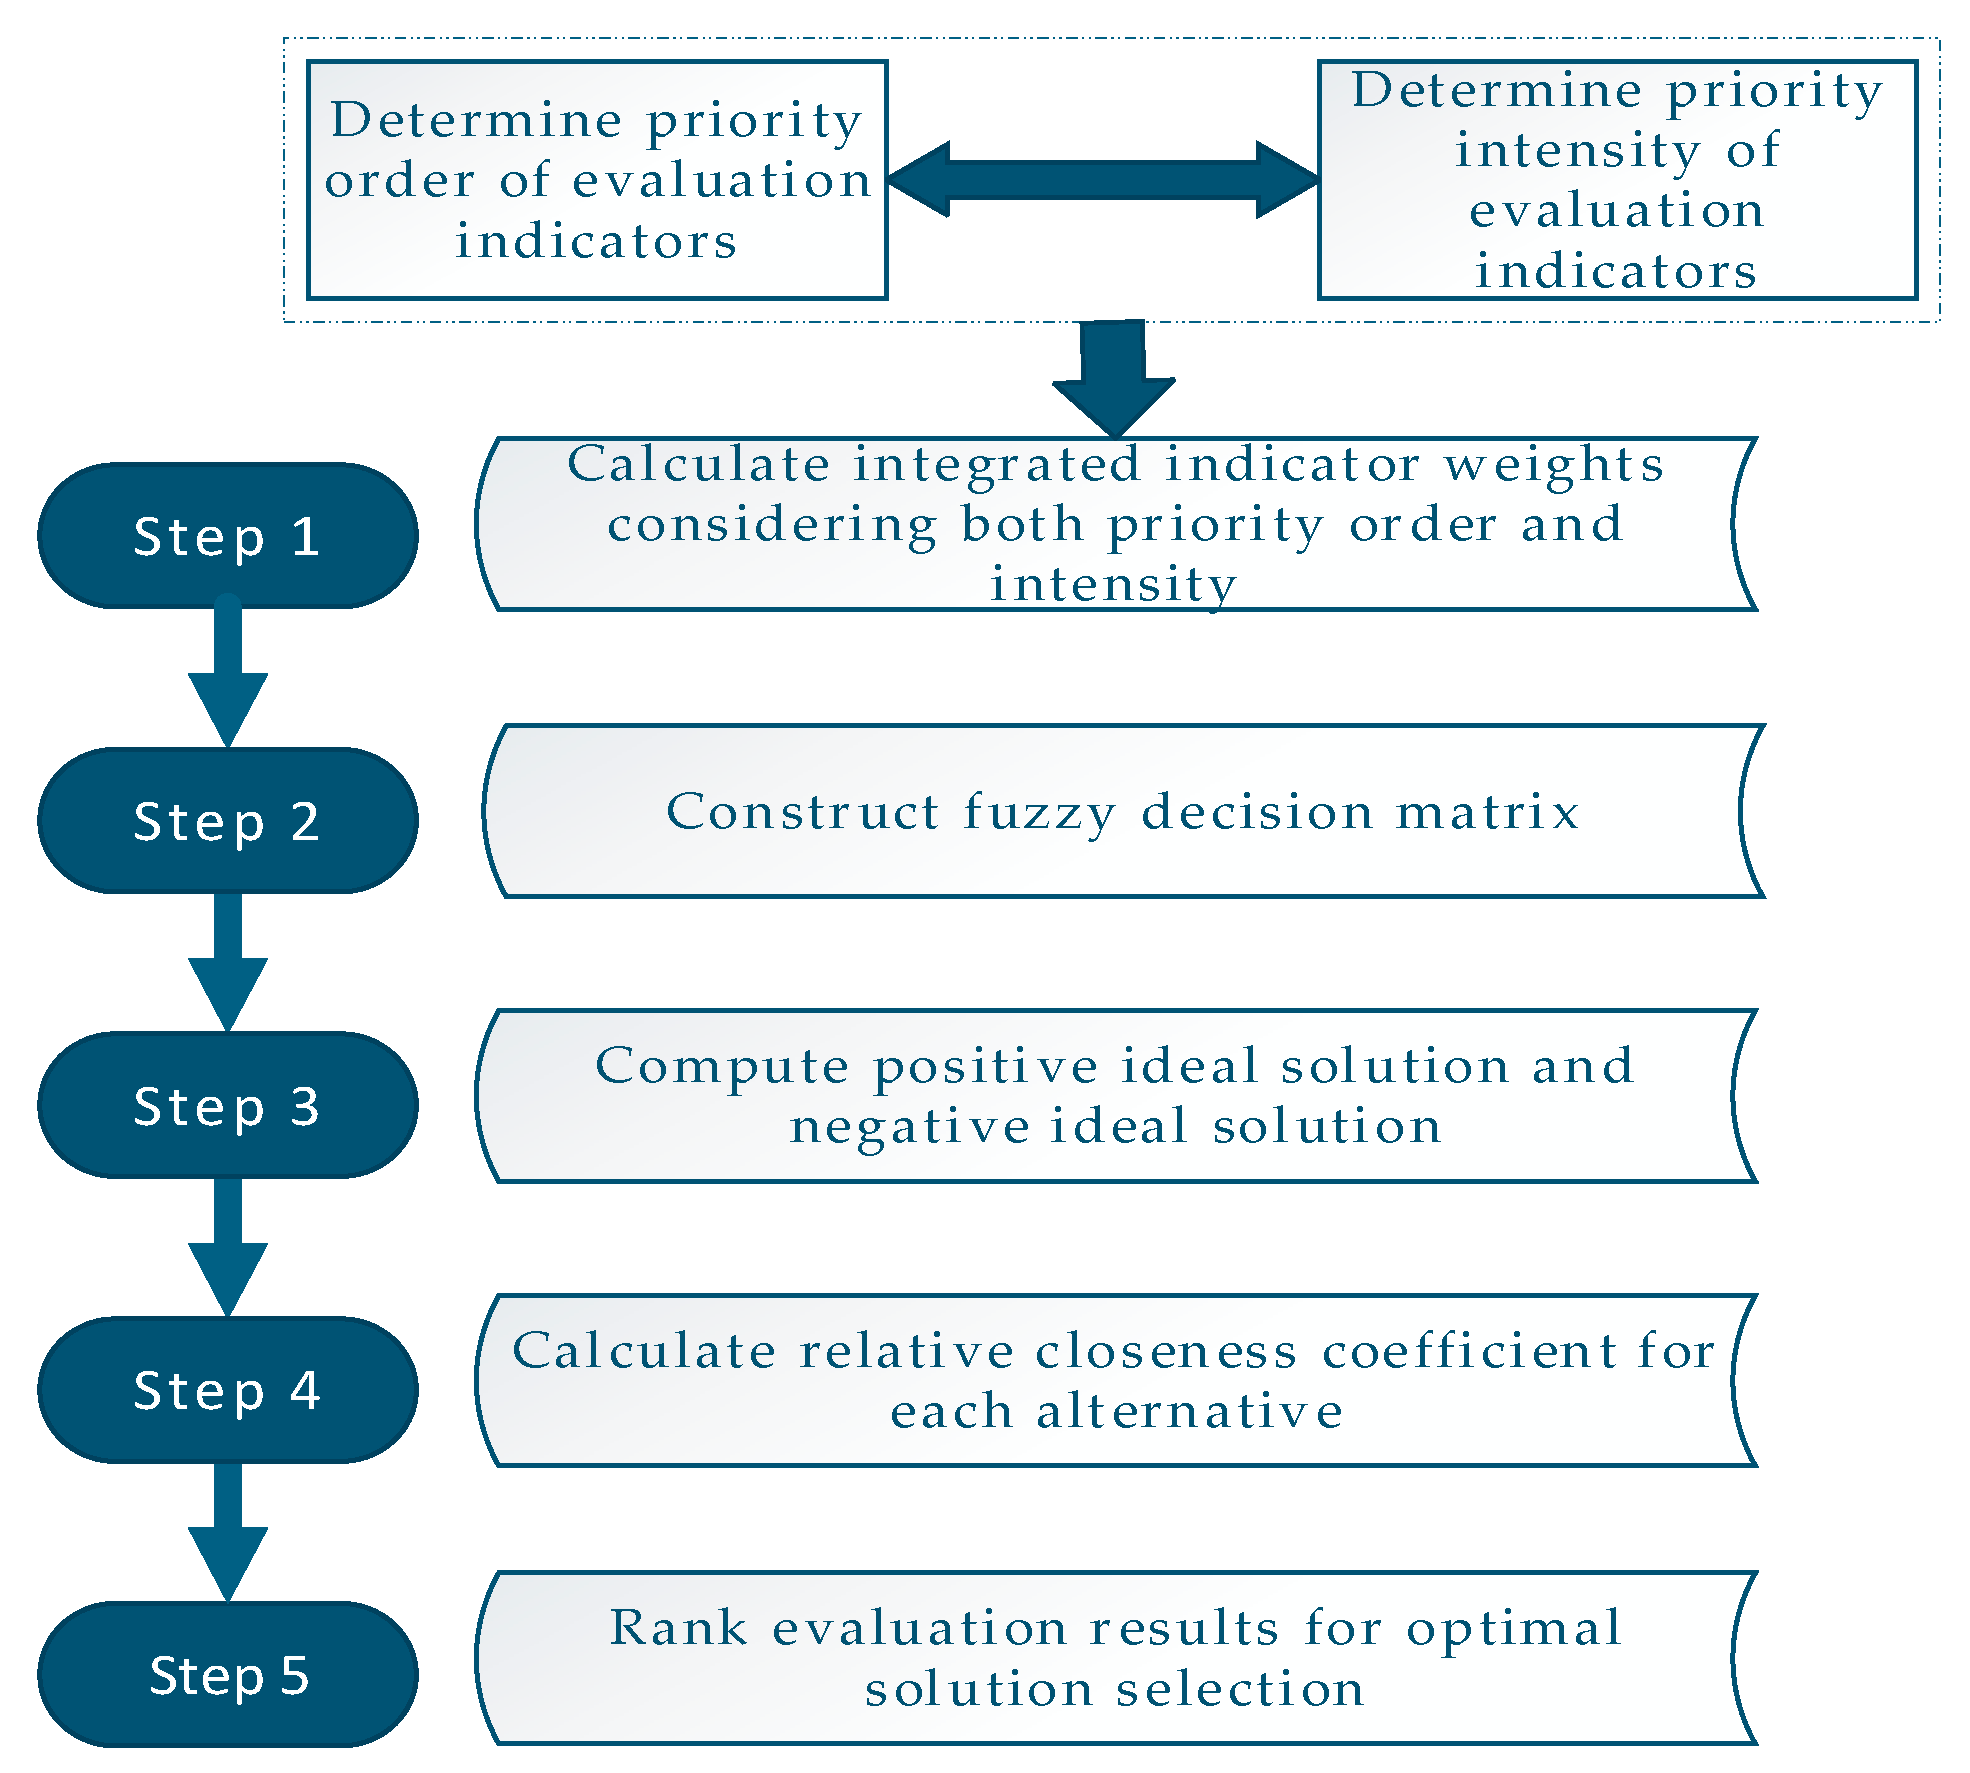
Under the goal of sustainable development and in response to pressing global challenges such as climate change, environmental pollution, and resource depletion, the logistics industry has prioritized green transformation as a core strategy. Among these efforts, promoting environmentally friendly packaging solutions has emerged as a critical pathway to aligning industrial practices with ecological preservation. Against this backdrop, China has implemented comprehensive policies, including the Technical Requirements for Evaluation of Green Products for Express Packaging issued by the State Post Bureau, establishing standardized frameworks to guide enterprises in adopting sustainable practices. Many manufacturers now produce green packaging products. This creates a challenge for logistics companies. They must objectively evaluate and select the best options. These solutions need to meet both regulatory standards and operational requirements. To solve this problem, our study uses a systematic decision-making approach. We applied it to a real-world case involving container bag selection by a logistics company. This demonstrates how theoretical models can connect policy implementation with actual industry practices. The process unfolds through the following interconnected steps:
Step 1: Establish Evaluation Indicators. Drawing from China’s national standard document, six scientifically validated evaluation criteria for container bags are identified: base material composition, water reuse rate, heavy metal content, abrasion resistance, odor characteristics, and recyclability. These indicators collectively address environmental impact (through material and recyclability metrics), operational durability (via abrasion resistance), and health safety (via odor and toxicity parameters).
Step 2: Prioritize Evaluation Dimensions. Building on the foundational indicators, the relative importance of each criterion is determined through a hybrid approach combining policy-mandated weightings from the State Post Bureau and expert evaluations. This dual validation ensures alignment with both regulatory expectations and practical industry insights.
Step 3: Hierarchical Ranking. The identified criteria are systematically ordered from highest to lowest priority based on their aggregated weightings. This hierarchical arrangement establishes a decision-making scaffold, ensuring critical environmental factors like base material and recyclability receive appropriate emphasis over secondary operational considerations.
Step 4: Weight Quantification. Employing mathematical normalization techniques, precise numerical weights are assigned to each indicator. These quantifiable values reflect both the categorical prioritization from Step 3 and the nuanced priority degrees identified through expert scoring, creating a multidimensional evaluation metric.
Step 5: Construct Weighted Decision Matrix. A fuzzy decision matrix is formulated, integrating both qualitative expert assessments and quantitative measurement data from manufacturers. Each container bag option is numerically represented across all six criteria, with weightings applied to reflect their predetermined importance.
Step 6: Define Benchmark Solutions. Two theoretical benchmarks are established:
Positive Ideal Solution: Represents optimal performance across all criteria.
Negative Ideal Solution: Embodies minimum acceptable thresholds.
These benchmarks create an evaluative spectrum against which all real-world options can be measured.
Step 7: Distance Measurement and Final Evaluation. Using Entropy Weighted (EW) distance calculations, each manufacturer’s container bag solution is analyzed for its proximity to the ideal benchmarks. This final computational phase transforms abstract metrics into actionable insights, enabling objective comparison of alternatives through a sustainability-focused lens.
This structured approach demonstrates how policy frameworks can be operationalized into practical decision-making tools. By systematically progressing from regulatory analysis to mathematical modeling, the methodology ensures environmental objectives are quantitatively integrated into corporate procurement processes. Such implementation not only enhances compliance with national sustainability goals but also drives market competition toward greener innovation, ultimately creating a positive feedback loop between policy effectiveness and industrial advancement.
Table 1 presents the evaluation criteria for green packaging container bags in express delivery, with standards selected from the Technical Requirements for Green Product Evaluation of Express Packaging (GB/T 39084). Table 2 extends Saaty’s [38] classical 1–9 scale from precise numbers to triangular fuzzy numbers, a form better aligned with the uncertainty characteristics of this study. These triangular fuzzy scales are employed to describe varying priority levels between attributes.
Table 3 gives the evaluation language classification of the evaluation indicators of green product packaging bags and their corresponding triangular fuzzy numbers.
Table 4 ranks the six evaluation criteria for flexible intermediate bulk containers in the priority order 04 > 06 > 06 > 01 > 02 > 05, with the final column specifying the priority degree of each criterion. Subsequently, experts evaluated Companies A, B, and C across these criteria using the fuzzy linguistic evaluation categories defined in Table 3.
The evaluation experts assigned assessment values to each indicator for Companies A, B, and C using the triangular fuzzy number scale detailed in Table 3, with the results presented in Table 4. After determining the evaluation values, normalization was applied to unify all indicators to a consistent scale, facilitating comprehensive analysis. The normalized outcomes are summarized in Table 5. Building on this foundation, parameter M is calculated. Subsequently, by applying the weight calculation formula, we derive the final index weights that simultaneously incorporate both priority order and priority intensity.
In calculating the intermediate variable M i j , the top-ranked criterion is initially assigned as M i 1 = ( 1 , 1 , 1 ) ( i = 1 , 2 , 3 ) . Formula M i j = s = 2 j p i ( s 1 ) = p i 1 p i 2 p i ( s 1 ) is then applied to compute the M i j values for the evaluation criteria of Companies A, B, and C, with the final results presented in Table 6. The table demonstrates a clear inverse correlation: as the priority ranking of criteria decreases, the corresponding M i j values systematically diminish.
The intermediate variables M i j and L j are determined as shown in Table 6 and Table 7, respectively. Subsequently, an additional intermediate variable M i j was derived as the foundational parameter for weight calculation. Distinct from M i j and L j , this variable integrates both the priority order and intensity of evaluation indicators, serving as the basis for subsequent weight determination.
Using the intermediate variable from Table 8, which integrates both the priority order and intensity of the indicators, the weights of evaluation indicators for Companies A, B, and C were calculated and presented in Table 9. Table 9 reveals that top-priority criteria dominate weight distribution. A non-compensatory scoring system effectively prevents high-performing attributes from overshadowing others. This framework offers logistics companies dual advantages: (1) threshold control for critical attributes (e.g., wear resistance) and (2) flexible supplier selection aligned with operational scenario variations.
Since the evaluation values of indicators obtained in Table 5 are triangular fuzzy numbers, we introduced α-level sets to convert them into interval numbers for computational convenience, as shown in Table 10. After defuzzifying the evaluation values, the corresponding weights from Table 9 were also defuzzified and presented in Table 11. In addition to these defuzzified values, Table 10 and Table 11 provide interval numbers under six α values, facilitating the examination of their impact on the overall results.
After obtaining the interval numbers of evaluation values and weights, these are combined to derive weighted evaluation values that incorporate both priority order and intensity. The weighted evaluation value is shown in Table 12. Subsequently, the analysis proceeds to the next computational stage.
It is evident that the normalized index evaluation values are confined within the interval [0, 1] based on the standardized scoring criteria. Consequently, the positive ideal solution can be formally defined as the vector comprising the maximum attainable values across all evaluation indices. Conversely, the negative ideal solution is correspondingly defined as the vector of minimum feasible values for each index. Subsequently, the separation degrees ( d i + and d i ) between each candidate alternative and the ideal/non-ideal solutions will be quantified. Specifically, by setting the parameter p = 2, the calculation degenerates to the Euclidean distance formula:
d i + = j = 1 n d E W ( v i j ( α ) , p j + ) = 1 n j = 1 n | E ( v i j ( α ) ) E ( p j + ) | 2 + 1 3 | W ( v i j ( α ) ) W ( p j + ) | 2 , ( i = 1 , , n ) d i = j = 1 n d E W ( v i j ( α ) , p j ) = 1 n j = 1 n | E ( v i j ( α ) ) E ( p j ) | 2 + 1 3 | W ( v i j ( α ) ) W ( p j ) | 2 , ( i = 1 , , n )
This configuration ensures geometric interpretability while maintaining computational tractability for multi-criteria decision analysis.
Through calculations, d + , d and R C i values of A, B, and C under different α values are obtained. These values are presented in Table 13. Next, we analyze and compare the calculation results.

4.2. Results Analysis

According to the calculation results in Table 13, we observe the following patterns: when α = 0 and 0.2, the ranking of RC values is Company C > Company A > Company B. In this scenario, if a logistics enterprise faces the choice of Companies A, B, and C for producing green product container bags, Company C is the optimal choice. When α = 0.4, 0.6, 0.8, and 1, the ranking shifts to Company A > Company C > Company B. Here, Company A becomes the optimal choice under the same conditions.
Regardless of the value of α (where α ∈ [0,1]), Company B consistently ranks last, while the order between Companies A and C varies with α. This indicates that the parameter α does not influence Company B’s position but critically determines the priority between Companies A and C.
As systematically illustrated in Figure 3, the dominance hierarchy among the evaluated entities exhibits remarkable stability across the full spectrum of robustness coefficients (α ∈ [0,1]). Specifically, Companies A and C maintain a Pareto optimal position relative to Company B, demonstrating consistent superiority across all parameter configurations. This hierarchical relationship underscores the strategic necessity for logistics enterprises to prioritize either Company A or Company C based on varying values of α, as their operational models synergize with circular economy principles and multi-stakeholder sustainability benchmarks. The decision-support framework proposed in this study—tailored for green logistics packaging container bag selection—provides a generalized methodology for resolving supplier prioritization dilemmas under environmental uncertainty. By integrating fuzzy parametric analysis with lifecycle assessment criteria, this approach ensures adaptability to heterogeneous decision contexts while maintaining analytical rigor in ecological-efficiency tradeoff evaluations.
For logistics enterprises navigating the complexities of green transition, this advanced decision-support system provides several strategic benefits. It enables organizations to transparently reconcile short-term economic pressures with long-term environmental responsibilities—a persistent challenge in sustainable operations. The framework’s inherent capacity to process incomplete or conflicting data ensures robust decision-making in emerging circular economy markets characterized by information gaps. As corporations face increasing stakeholder pressure to demonstrate authentic environmental stewardship, the ability to systematically justify green procurement choices becomes crucial. This methodology transforms abstract sustainability commitments into traceable decision pathways, supporting auditability and stakeholder communication. Additionally, the system’s structured approach to priority weighting facilitates organizational learning, allowing companies to refine their sustainability strategies based on historical decision patterns and evolving industry benchmarks. While developed specifically for container bag selection, the underlying principles of this approach hold transferable value across green logistics domains.

5. Conclusions

5.1. Summary of Findings

The TOPSIS method, a widely recognized multi-criteria decision-making framework, operates on the principle of evaluating alternatives through their relative proximity to idealized benchmarks. By defining both a “positive ideal solution” representing optimal performance across all criteria and a “negative ideal solution” reflecting the worst-case scenario, this method systematically ranks options based on their geometric distances from these theoretical extremes. In the context of selecting green product container bags for logistics operations, TOPSIS offers a structured approach to balance multifaceted sustainability requirements. In practical applications, many phenomena and concepts are often difficult to accurately describe with precise numerical values. When evaluating green product container bags, it is difficult to measure their evaluation indicators with an absolutely precise numerical value. Fuzzy numbers can better reflect this uncertainty and fuzziness, making the evaluation results more in line with the actual situation. This paper introduces triangular fuzzy numbers to represent the evaluation index values and the weights of evaluation indicators and combines the α level for calculation. In addition, when calculating the weights, this paper does not directly give the weights of each evaluation indicator. Instead, the priority and degree of priority of evaluation indicators are taken into consideration. The degree of priority of evaluation indicators has a significant impact on the evaluation results of multi-attribute decision-making problems. This reduces the influence of subjective factors and provides more reliable evaluation results. When calculating the separation degree from the positive and negative ideal solutions, the EW distance is applied, which not only considers the difference between the expected values of two interval numbers but also the difference in their widths. This makes the distance characterization of interval numbers more comprehensive and detailed, greatly improves the utilization rate of information, and makes the final result more reasonable.
Compared to previous studies, there is limited research on the optimal selection of green packaging products for express delivery. This study addresses this gap by employing an improved TOPSIS method. Existing weight adjustment approaches in fuzzy environments, such as fuzzy AHP, fuzzy entropy weighting, intuitionistic fuzzy entropy, and combined weighting methods, often overlook the prioritization of evaluation criteria. In contrast, this study determines weights by simultaneously considering the priority and priority degree of indicators, effectively differentiating their importance to avoid overcompensation in comprehensive scores caused by high ratings in single indicators. This approach enables logistics companies to flexibly adjust priority considerations for packaging criteria based on specific scenarios. Additionally, the EW distance method is adopted to calculate distances between alternatives and positive/negative ideal solutions, significantly enhancing the decision resolution of distance measurement.

5.2. Managerial Implications

The enhanced TOPSIS framework proposed in this study provides a systematic, practical pathway for green packaging decision-making in logistics enterprises. By integrating evaluation tools embedded with triangular fuzzy numbers and the EW distance algorithm, enterprises can dynamically adjust parameters to align with risk preferences, transforming ambiguous perceptions into actionable supplier classification criteria while amplifying the decision-making impact of high-priority indicators. Government agencies should design tiered incentive policies based on indicator priority hierarchies, establishing differentiated subsidy mechanisms for core green attributes and implementing dynamic adjustment cycles to adapt to industry-wide technological advancements. At the industrial level, stakeholders must collaboratively develop risk platforms that monitor supply chain deviations from thresholds using distance-based algorithms, mitigating sustainability risks through multi-party audits and emergency response protocols. This methodology bridges technical models with commercial realities by translating mathematical parameters into managerial variables, enabling enterprises to balance long-term ecological goals with short-term operational efficiency under multi-dimensional constraints, thereby offering flexible yet robust decision support for green transformation.

5.3. Limitations and Future Research

Despite the advantages described, this study shows some methodological limitations. Firstly, the predefined criteria for container bag evaluation may require dynamic adjustment as economic development drives evolution in indicator typologies and benchmarking standards. Future research should focus on adaptive decision-making frameworks that align with evolving enterprise expectations. Additionally, the current weight determination method integrating priority order and intensity retains subjective elements; subsequent investigations could implement more objective weighting techniques to enhance the robustness of priority-coupled weight calculations.

Author Contributions

Conceptualization, J.L. and R.F.; methodology, J.L. and R.F.; software, R.F.; validation, J.L. and R.F.; formal analysis, R.F.; investigation, R.F.; resources, Q.L.; data curation, R.F.; writing—original draft preparation, J.L. and R.F.; writing—review and editing, J.L., R.F. and Q.L.; visualization, J.L., R.F. and Q.L.; supervision, J.L.; project administration, J.L., R.F. and Q.L.; funding acquisition, J.L. and Q.L. All authors have read and agreed to the published version of the manuscript.

Funding

This work was supported by the National Social Science Foundation of China (22BGL005), the Guiding Project of Fujian Science and Technology Program (2021N0007), the Post-funded General Project of the Ministry of Education in the Philosophy and Social Science (23JHQ095), the Research Project of the Philosophy and Social Science of the Education System in Fujian Province (JAS24213), and the Open Project of Xi Jinping Thought on Ecological Civilization Research Institute of Fujian Agriculture and Forestry University (STWMSX23-15).

Institutional Review Board Statement

Not applicable.

Informed Consent Statement

Not applicable.

Data Availability Statement

Data are contained within the article.

Conflicts of Interest

The authors declare no conflicts of interest.

References

  1. Guo, X.; Lu, S.; Du, H.Z. Development Status and Trend of Reusable Express Packaging in China. Packag. Eng. 2023, 44, 238–247. [Google Scholar]
  2. Zhou, K.; Sun, H.Y.; Jiang, H.; Yi, J.J. The Evaluation Method of Green Packaging Based on Rough Set Theory and TOPSIS. Packag. Eng. 2018, 39, 142–146. [Google Scholar]
  3. Shi, Q.; Ruan, R. Research on grey evaluation model of green packaging based on ISM-ANP. Packag. Eng. 2023, 44, 201–207. [Google Scholar]
  4. Ke, S.H.; Zhang, Y.L.; Yang, Z.J. Research and Practice on the Design of “Non Adhesive” Express Packaging Under the Background of Plastic Restriction. Zhuangshi 2023, 100–105. [Google Scholar] [CrossRef]
  5. Xu, L.; Wang, X.Y.; Guan, X.S.; Zhu, N.F.; Xu, C.Y.; Li, D.G. Application of Fuzzy Comprehensive Evaluation in Green Express Packaging. Packag. Eng. 2019, 40, 180–188. [Google Scholar]
  6. Sun, H.X.; Li, J.L. Behavioural choice of governments, enterprises and consumers on recyclable green logistics packaging. Sustain. Prod. Consum. 2021, 28, 459–471. [Google Scholar] [CrossRef]
  7. Wandosell, G.; Parra-Meroño, M.C.; Alcayde, A.; Baños, R. Green Packaging from Consumer and Business Perspectives. Sustainability 2021, 13, 1356. [Google Scholar] [CrossRef]
  8. Jia, Y.J.; Li, Y.B.; Lan, Y.L. Research on consumers’ willingness to use and pay for express green packaging in express delivery. J. Arid Land Resour. Environ. 2025, 39, 27–37. [Google Scholar] [CrossRef]
  9. Wu, X.P.; Shu, E.; Ye, D.D.; Zhou, S.; Sun, H.Y. Study on green packaging diffusion in logistics enterprise clusters based on complex network evolutionary game. J. Clean. Prod. 2025, 499, 145166. [Google Scholar] [CrossRef]
  10. Hwang, C.L.; Yoon, K.P. Multiple Attribute Decision Making: Methods and Applications; Springer: Berlin/Heidelberg, Germany, 1981. [Google Scholar] [CrossRef]
  11. Lai, Y.J.; Liu, T.Y.; Hwang, C.L. TOPSIS for MODM. Eur. J. Oper. Res. 1994, 76, 486–500. [Google Scholar] [CrossRef]
  12. Li, J.; Liu, K.; Zhang, L.; Yin, X.Y.; Jia, H.N. Geohash coding location privacy protection scheme based on entropy weight TOPSIS. J. Supercomput. 2024, 81, 85. [Google Scholar]
  13. Ning, X.F.; Zhang, H.Z.; Xu, J.Z. Comprehensive safety evaluation of energy storage power stations based on improved AHP-TOPSIS. Acta Energiae Solaris Sin. 2024, 45, 251–259. [Google Scholar]
  14. Geng, J.H.; Zhu, J.H.; Yao, J.X.; Wang, P.; Wang, X.Y.; Gao, S.G.; Yu, H. Aging state evaluation of transformer insulating paper using integrated weighting and enhanced TOPSIS. Insul. Mater. 2025, 58, 1–10. [Google Scholar] [CrossRef]
  15. Rawat, S.; Cui, H.W.; Xie, Y.K.; Guo, Y.Y.; Lee, C.K.; Zhang, Y.X. An improved framework for multi-objective optimization of cementitious composites using Taguchi-TOPSIS approach. Expert Syst. Appl. 2025, 272, 126732. [Google Scholar] [CrossRef]
  16. Li, M.J.; Pang, Y.X.; Xu, L.M.; Lu, J.C. Improved Dynamic TOPSIS Evaluation Method of Interval Numbers. J. Syst. Sci. Math. Sci. 2021, 41, 1891–1904. [Google Scholar]
  17. Chen, R.P.; Wang, Z.T.; Wu, H.N.; Liu, Y.; Meng, F.Y. Risk Assessment for Shield Tunneling Beneath Buildings Based on Interval Improved TOPSIS Method and FAHP Method. J. Shanghai Jiaotong Univ. 2022, 56, 1710–1719. [Google Scholar]
  18. Ji, S.Y.; Xia, J.H.; Wang, Y.; Zu, J.Y.; Xu, K.J.; Liu, Z.W.; Wang, Q.H.; Lin, G.F. Adaptive Simplified Calculation of Algal Bloom Risk Index for Reservoir-Type Drinking Water Sources Based on Improved TOPSIS and Identification of Risk Areas. Water 2025, 17, 267. [Google Scholar] [CrossRef]
  19. Xie, X.J.; Ma, H.; Xue, S.F.; Luo, Q.; Long, C.Y. Research on Multi-Attribute Decision-Making Model Based on Interval-Valued Intuitionistic Fuzzy and Its Application in Investment Project Evaluation. Math. Pract. Theory 2025, 1–11. [Google Scholar] [CrossRef]
  20. Shanian, A.; Savadogo, O. TOPSIS multiple-criteria decision support analysis for material selection of metallic bipolar plates for polymer electrolyte fuel cell. J. Power Sources 2005, 159, 1095–1104. [Google Scholar] [CrossRef]
  21. Montanari, R. Environmental efficiency analysis for enel thermo-power plants. J. Clean. Prod. 2004, 12, 403–414. [Google Scholar] [CrossRef]
  22. İç, Y.T. An experimental design approach using TOPSIS method for the selection of computer-integrated manufacturing technologies. Robot. Comput. Integr. Manuf. 2011, 28, 245–256. [Google Scholar] [CrossRef]
  23. Li, Y.; Liu, X.D.; Chen, Y. Selection of logistics center location using Axiomatic Fuzzy Set and TOPSIS methodology in logistics management. Expert Syst. Appl. 2011, 38, 7901–7908. [Google Scholar] [CrossRef]
  24. Li, H.; Adeli, H.; Sun, J.; Han, J.G. Hybridizing principles of TOPSIS with case-based reasoning for business failure prediction. Comput. Oper. Res. 2011, 38, 409–419. [Google Scholar] [CrossRef]
  25. Agarwal, V.; Hameed, A.Z.; Malhotra, S.; Mathiyazhagan, K.; Alathur, S.; Appolloni, A. Role of Industry 4.0 in agile manufacturing to achieve sustainable development. Bus. Strategy Environ. 2022, 32, 3671–3688. [Google Scholar] [CrossRef]
  26. Khan, H.U.; Abbas, M.; Alruwaili, O.; Nazir, S.; Siddiqi, M.H.; Alanazi, S. Selection of a smart and secure education school system based on the internet of things using entropy and TOPSIS approaches. Comput. Hum. Behav. 2024, 159, 108346. [Google Scholar] [CrossRef]
  27. Evangelos, T.; Tun, L.C. Development and evaluation of five fuzzy multiattribute decision-making methods. Int. J. Approx. Reason. 1996, 14, 281–310. [Google Scholar]
  28. Chen, C.T. Extensions of the TOPSIS for group decision-making under fuzzy environment. Fuzzy Sets Syst. 2000, 114, 1–9. [Google Scholar] [CrossRef]
  29. Chen, M.F.; Tzeng, G.H. Combining grey relation and TOPSIS concepts for selecting an expatriate host country. Math. Comput. Model. 2004, 40, 1473–1490. [Google Scholar] [CrossRef]
  30. Ayyildiz, E.; Erdogan, M. A fermatean fuzzy SWARA-TOPSIS methodology based on SCOR model for autonomous vehicle parking lot selection. Appl. Soft Comput. 2024, 166, 112198. [Google Scholar] [CrossRef]
  31. Wang, Y.M.; Elhag, T.M.S. Fuzzy TOPSIS method based on alpha level sets with an application to bridge risk assessment. Expert Syst. Appl. 2005, 31, 309–319. [Google Scholar] [CrossRef]
  32. Afshar, A.; Mariño, M.A.; Saadatpour, M.; Afshar, A. Fuzzy TOPSIS Multi-Criteria Decision Analysis Applied to Karun Reservoirs System. Water Resour. Manag. 2011, 25, 545–563. [Google Scholar] [CrossRef]
  33. Wang, X.J.; Chan, H.K. A hierarchical fuzzy TOPSIS approach to assess improvement areas when implementing green supply chain initiatives. Int. J. Prod. Res. 2013, 51, 3117–3130. [Google Scholar] [CrossRef]
  34. Ye, X.; Ying, L. Cohesion of Agricultural Crowdfunding Risk Prevention under Sustainable Development Based on Gray–Rough Set and FAHP-TOPSIS. Sustainability 2022, 14, 12709. [Google Scholar] [CrossRef]
  35. Nalan, B.Ö.; Hafize, D.N.; Esra, T. A novel interval-valued intuitionistic fuzzy CRITIC-TOPSIS methodology: An application for transportation mode selection problem for a glass production company. Expert Syst. Appl. 2024, 235, 121134. [Google Scholar]
  36. Zhao, W.J.; Liu, J.C.; Li, Z.H. A Comprehensive Evaluation Method of Logistics Level Considering the Prioritization and Importance Degre. J. East China Jiaotong Univ. 2018, 35, 134–141. [Google Scholar]
  37. Bao, Y.E.; Peng, X.Q.; Zhao, B. The Interval Number Distance and Completeness Based on the Expectation and Width. Fuzzy Syst. Math. 2013, 27, 133–139. [Google Scholar]
  38. Saaty, T.L. Decision making with the analytic hierarchy process. Int. J. Serv. Sci. 2008, 1, 83–98. [Google Scholar] [CrossRef]
Figure 1. Arbitrary triangular fuzzy number and its α cut set.
Sustainability 17 03672 g001
Figure 2. Flowchart of the improved TOPSIS method.
Sustainability 17 03672 g002
Figure 3. The R C i under different α values.
Sustainability 17 03672 g003
Table 1. Evaluation indicators of container bags in green express packaging products.
NumberIndicator NameUnitEvaluation Basis
01Base material--
02Reuse rate of water%GB/T 7119
03Heavy metal contentmg/kg-
04Wear resistancetimeGB/T 21196.2
05OdorlevelGB/T 35773
06RecyclabilitytimeYZ/T 0167
Table 2. Different prioritized degrees and implications.
Linguistic VariableEqualA Little PrioritizedObviously PrioritizedStrongly PrioritizedExtremely Prioritized
Number(0, 1, 1)(1, 2, 3)(3, 4, 5)(5, 6, 7)(7, 8, 9)
Table 3. Linguistic classification for the evaluation of green product container bags and their corresponding triangular fuzzy numbers.
Linguistic VariableTriangular Fuzzy Number
Definitely poor(0, 0, 1)
Strongly poor(0, 1, 2)
Very poor(1, 2, 3)
Poor(2, 3, 4)
Medium poor(3, 4, 5)
Fair(4, 5, 6)
Medium good(5, 6, 7)
Good(6, 7, 8)
Very good(7, 8, 9)
Strongly good(8, 9, 10)
Absolutely good(9, 10, 10)
Table 4. The evaluated values of indicators arranged in order of priority and the degree of priority of indicators.
Number040603010205
Indicator NameWear ResistanceRecyclabilityHeavy Metal ContentBase MaterialReuse Rate of WaterOdor
Indicator evaluation valueCompany A(5, 6, 7)(3, 4, 5)(4, 5, 6)(3, 4, 5)(8, 9, 10)(4, 5, 6)
Company B(8, 9, 10)(7, 8, 9)(2, 3, 4)(1, 2, 3)(6, 7, 8)(3, 4, 5)
Company C(6, 7, 8)(4, 5, 6)(1, 2, 3)(2, 3, 4)(9, 10, 10)(1, 2, 3)
Prioritized degree(7.4, 8.8, 9)(7.1, 8.3, 9)(5.4, 6.3, 6.9)(3.5, 4.8, 5)(1.5, 2.6, 3)(1.4, 2.5, 3)
Table 5. The evaluation value of the normalized index.
Number040603010205
Indicator NameWear ResistanceRecyclabilityHeavy Metal ContentBase MaterialReuse Rate of WaterOdor
Indicator evaluation valueCompany A(0.5, 0.6, 0.7)(0.3, 0.4, 0.5)(0.17, 0.2, 0.25)(0.2, 0.25, 0.33)(0.8, 0.9, 1)(0.17, 0.2, 0.25)
Company B(0.8, 0.9, 1)(0.7, 0.8, 0.9)(0.25, 0.33, 0.5)(0.33, 0.5, 1)(0.6, 0.7, 0.8)(0.2, 0.25, 0.33)
Company C(0.6, 0.7, 0.8)(0.4, 0.5, 0.6)(0.33, 0.5, 1)(0.25, 0.33, 0.5)(0.9, 1, 1)(0.33, 0.5, 1)
Table 6. The “ M i j ” value of each evaluation indicator for each company.
Number040603010205
Indicator NameWear ResistanceRecyclabilityHeavy Metal ContentBase MaterialReuse Rate of WaterOdor
M i j Company A(1, 1, 1)(0.5, 0.6, 0.7)(0.15, 0.24, 0.35)(0.03, 0.05, 0.09)(0.01, 0.01, 0.02)(0.01, 0.01, 0.02)
Company B(1, 1, 1)(0.8, 0.9, 1)(0.56, 0.78, 0.9)(0.14, 0.26, 0.45)(0.05, 0.13, 0.45)(0.03, 0.09, 0.36)
Company C(1, 1, 1)(0.6, 0.7, 0.8)(0.24, 0.35, 0.48)(0.08, 0.18, 0.48)(0.02, 0.06, 0, 24)(0.02, 0.06, 0.24)
Table 7. The “ L j ” value of each evaluation indicator for each company.
Indicator NameWear ResistanceRecyclabilityHeavy Metal ContentBase MaterialReuse Rate of WaterOdor
L j (0.21, 0.26, 0.34)(0.2, 0.25, 0.34)(0.15, 0.19, 0.26)(0.1, 0.14, 0.19)(0.04, 0.08, 0.11)(0.04, 0.07, 0.11)
Table 8. Intermediate variable M i j when considering both priority and precedence simultaneously.
Number040603010205
Indicator NameWear ResistanceRecyclabilityHeavy Metal ContentBase MaterialReuse Rate of WaterOdor
M i j Company A(1, 1, 1)(0.5, 0.6, 0.7)(0.15, 0.24, 0.35)(0, 0, 0)(0, 0, 0)(0, 0, 0)
Company B(1, 1, 1)(0.17, 0.23, 0.34)(0.02, 0.06, 0.11)(0, 0, 0)(0, 0, 0)(0, 0, 0)
Company C(1, 1, 1)(0.13, 0.18, 0.27)(0.01, 0.03, 0.06)(0, 0, 0)(0, 0, 0)(0, 0, 0)
Table 9. The “ w i j ” value of each evaluation indicator for each company.
Number040603010205
Indicator NameWear ResistanceRecyclabilityHeavy Metal ContentBase MaterialReuse Rate of WaterOdor
w i j Company A(0.78, 0.85, 0.89)(0.09, 0.14, 0.21)(0.01, 0.02, 0.04)(0, 0, 0)(0, 0, 0)(0, 0, 0)
Company B(0.69, 0.78, 0.84)(0.12, 0.18, 0.29)(0.01, 0.05, 0.09)(0, 0, 0)(0, 0, 0)(0, 0, 0)
Company C(0.75, 0.83, 0.88)(0.1, 0.15, 0.24)(0.01, 0.03, 0.05)(0, 0, 0)(0, 0, 0)(0, 0, 0)
Table 10. The α level of the normalized evaluation index value.
α Wear ResistanceRecyclabilityHeavy Metal ContentBase MaterialReuse Rate of WaterOdor
0Company A(0.5, 0.7)(0.3, 0.5)(0.17, 0.25)(0.2, 0.33)(0.8, 1)(0.17, 0.25)
Company B(0.8, 1)(0.7, 0.9)(0.25, 0.5)(0.33, 1)(0.6, 0.8)(0.2, 0.33)
Company C(0.6, 0.8)(0.4, 0.6)(0.33, 1)(0.25, 0.5)(0.9, 1)(0.33, 1)
0.2Company A(0.52, 0.68)(0.32, 0.48)(0.18, 0.24)(0.21, 0.31)(0.82, 0.98)(0.18, 0.24)
Company B(0.82, 0.98)(0.72.0.88)(0.27, 0.47)(0.36, 0.9)(0.62, 0.78)(0.21, 0.31)
Company C(0.62, 0.78)(0.42, 0.58)(0.36, 0.9)(0.27, 0.47)(0.9, 0.98)(0.36, 0.9)
0.4Company A(0.54, 0.66)(0.34, 0.46)(0.18, 0.23)(0.22, 0.3)(0.84, 0.96)(0.18, 0.23)
Company B(0.84, 0.96)(0.74, 0.86)(0.28, 0.43)(0.4, 0.8)(0.64, 0.76)(0.22, 0.3)
Company C(0.64, 0.76)(0.44, 0.56)(0.4, 0.8)(0.28, 0.43)(0.94, 1)(0.4, 0.8)
0.6Company A(0.56, 0.64)(0.36, 0.44)(0.19, 0.22)(0.23, 0.28)(0.86, 0.94)(0.19, 0.22)
Company B(0.86, 0.94)(0.76, 0.84)(0.3, 0.4)(0.43, 0.7)(0.66, 0.74)(0.23, 0.28)
Company C(0.66, 0.74)(0.46, 0.54)(0.43, 0.7)(0.3, 0.4)(0.96, 1)(0.43, 0.7)
0.8Company A(0.58, 0.62)(0.38, 0.42)(0.19, 0.21)(0.24, 0.27)(0.88, 0.92)(0.19, 0.21)
Company B(0.88, 0.92)(0.78, 0.82)(0.31, 0.36)(0.47, 0.6)(0.68, 0.72)(0.24, 0.27)
Company C(0.68, 0.72)(0.48, 0.52)(0.47, 0.6)(0.31, 0.36)(0.98, 1)(0.47, 0.6)
1Company A(0.6, 0.6)(0.4, 0.4)(0.2, 0.2)(0.25, 0.25)(0.9, 0.9)(0.2, 0.2)
Company B(0.9, 0.9)(0.8, 0.8)(0.33, 0.33)(0.5, 0.5)(0.7, 0.7)(0.25, 0.25)
Company C(0.7, 0.7)(0.5, 0.5)(0.5, 0.5)(0.33, 0.33)(1, 1)(0.5, 0.5)
Table 11. The α level of weights.
α Wear ResistanceRecyclabilityHeavy Metal ContentBase MaterialReuse Rate of WaterOdor
0Company A(0.78, 0.89)(0.09, 0.21)(0.01, 0.04)(0, 0)(0, 0)(0, 0)
Company B(0.69, 0.84)(0.12, 0.29)(0.01, 0.09)(0, 0)(0, 0)(0, 0)
Company C(0.75, 0.88)(0.1, 0.24)(0.01, 0.05)(0, 0)(0, 0)(0, 0)
0.2Company A(0.79, 0.88)(0.1, 0.2)(0.01, 0.04)(0, 0)(0, 0)(0, 0)
Company B(0.71, 0.83)(0.13, 0.27)(0.02, 0.08)(0, 0)(0, 0)(0, 0)
Company C(0.77, 0.87)(0.11, 0.22)(0.01, 0.05)(0, 0)(0, 0)(0, 0)
0.4Company A(0.81, 0.87)(0.11, 0.18)(0.01, 0.03)(0, 0)(0, 0)(0, 0)
Company B(0.73, 0.82)(0.14, 0.25)(0.03, 0.07)(0, 0)(0, 0)(0, 0)
Company C(0.78, 0.86)(0.12, 0.2)(0.02, 0.04)(0, 0)(0, 0)(0, 0)
0.6Company A(0.82, 0.87)(0.12, 0.17)(0.02, 0.03)(0, 0)(0, 0)(0, 0)
Company B(0.74, 0.8)(0.16, 0.22)(0.03, 0.07)(0, 0)(0, 0)(0, 0)
Company C(0.8, 0.85)(0.13, 0.19)(0.02, 0.04)(0, 0)(0, 0)(0, 0)
0.8Company A(0.84, 0.86)(0.13, 0.15)(0.02, 0.02)(0, 0)(0, 0)(0, 0)
Company B(0.76, 0.79)(0.17, 0.2)(0.04, 0.06)(0, 0)(0, 0)(0, 0)
Company C(0.81, 0.84)(0.14, 0.17)(0.03, 0.03)(0, 0)(0, 0)(0, 0)
1Company A(0.85, 0.85)(0.14, 0.14)(0.02, 0.02)(0, 0)(0, 0)(0, 0)
Company B(0.78, 0.78)(0.18, 0.18)(0.05, 0.05)(0, 0)(0, 0)(0, 0)
Company C(0.83, 0.83)(0.15, 0.15)(0.03, 0.03)(0, 0)(0, 0)(0, 0)
Table 12. The weighted index evaluation value.
α Wear ResistanceRecyclabilityHeavy Metal ContentBase MaterialReuse Rate of WaterOdor
0Company A(0.39, 0.62)(0.03, 0.11)(0, 0.01)(0, 0)(0, 0)(0, 0)
Company B(0.55, 0.84)(0.08, 0.26)(0, 0.05)(0, 0)(0, 0)(0, 0)
Company C(0.45, 0.7)(0.04, 0.14)(0, 0.05)(0, 0)(0, 0)(0, 0)
0.2Company A(0.41, 0.6)(0.03, 0.1)(0, 0.01)(0, 0)(0, 0)(0, 0)
Company B(0.58, 0.81)(0.09, 0.24)(0.01, 0.04)(0, 0)(0, 0)(0, 0)
Company C(0.48, 0.68)(0.05, 0.13)(0, 0.05)(0, 0)(0, 0)(0, 0)
0.4Company A(0.44, 0.57)(0.04, 0.08)(0, 0.01)(0, 0)(0, 0)(0, 0)
Company B(0.61, 0.79)(0.1, 0.22)(0.01, 0.03)(0, 0)(0, 0)(0, 0)
Company C(0.5, 0.65)(0.05, 0.11)(0.01, 0.03)(0, 0)(0, 0)(0, 0)
0.6Company A(0.46, 0.56)(0.04, 0.08)(0, 0.01)(0, 0)(0, 0)(0, 0)
Company B(0.64, 0.75)(0.12, 0.19)(0.01, 0.03)(0, 0)(0, 0)(0, 0)
Company C(0.53, 0.63)(0.06, 0.1)(0.01, 0.03)(0, 0)(0, 0)(0, 0)
0.8Company A(0.49, 0.53)(0.05, 0.06)(0, 0)(0, 0)(0, 0)(0, 0)
Company B(0.67, 0.82)(0.13, 0.16)(0.1, 0.02)(0, 0)(0, 0)(0, 0)
Company C(0.55, 0.61)(0.07, 0.09)(0.01, 0.02)(0, 0)(0, 0)(0, 0)
1Company A(0.51, 0.51)(0.06, 0.06)(0, 0)(0, 0)(0, 0)(0, 0)
Company B(0.7, 0.7)(0.14, 0.14)(0.01, 0.01)(0, 0)(0, 0)(0, 0)
Company C(0.58, 0.58)(0.08, 0.08)(0.01, 0.01)(0, 0)(0, 0)(0, 0)
Table 13. The values of d i + , d i , and R C i under different α values.
α d i + d i R C i
0Company A3.39 × 10−44.19 × 10−45.53 × 10−1
Company B4.19 × 10−43.39 × 10−44.47 × 10−1
Company C1.89 × 10−42.50 × 10−45.70 × 10−1
0.2Company A2.78 × 10−43.58 × 10−45.63 × 10−1
Company B3.58 × 10−42.78 × 10−44.37 × 10−1
Company C1.64 × 10−42.33 × 10−45.87 × 10−1
0.4Company A2.97 × 10−43.58 × 10−45.47 × 10−1
Company B3.58 × 10−42.97 × 10−44.53 × 10−1
Company C1.81 × 10−41.97 × 10−45.22 × 10−1
0.6Company A2.28 × 10−44.69 × 10−46.73 × 10−1
Company B4.69 × 10−42.28 × 10−43.27 × 10−1
Company C1.44 × 10−42.75 × 10−46.56 × 10−1
0.8Company A2.47 × 10−44.69 × 10−46.55 × 10−1
Company B4.69 × 10−42.47 × 10−43.45 × 10−1
Company C1.64 × 10−42.36 × 10−45.90 × 10−1
1Company A2.08 × 10−44.08 × 10−46.62 × 10−1
Company B4.08 × 10−42.08 × 10−43.38 × 10−1
Company C1.42 × 10−42.25 × 10−46.14 × 10−1
Disclaimer/Publisher’s Note: The statements, opinions and data contained in all publications are solely those of the individual author(s) and contributor(s) and not of MDPI and/or the editor(s). MDPI and/or the editor(s) disclaim responsibility for any injury to people or property resulting from any ideas, methods, instructions or products referred to in the content.

