
Uncovering the Mechanism of Elevating High-Tech Export Competitiveness in China’s Sustainable Economic Development: Force of Digital Economy


Abstract
1. Introduction
2. Mechanism Analysis
2.1. Direct Mechanism
2.2. Indirect Mechanism
2.2.1. Technological Innovation as a Mediator
2.2.2. Industrial Upgrading as a Mediator
3. Methodology and Data
3.1. Model Construction
3.2. Variable Selection
- (1)
- Dependent Variable: Export Competitiveness of High-Tech Products (Eci)
- (2)
- Core Explanatory Variable: Digital Economy Development Level (De)
- (3)
- Mediating Variables
- (4)
- Control Variables
3.3. Measurement Method
- 1.
- Standardization
- 2.
- Calculate the characteristic proportion :
- 3.
- Determine the entropy value for the j-th indicator:
- 4.
- Compute the information utility value for the j-th indicator:
- 5.
- Calculate the weight assigned to the j-th indicator:
- 6.
- Calculate the comprehensive evaluation index:
3.4. Data
4. Descriptive Analysis and Indicator Measurement
4.1. Descriptive Analysis
4.2. Measurement of Digital Economy Development Level
4.3. Measurement of Export Competitiveness
5. Empirical Study
5.1. Baseline Regression Analysis
5.2. Heterogeneity Analysis
5.3. Endogeneity Test
5.4. Robustness Test
5.5. Mediation Effect Test
5.6. Further Analysis
5.7. Discussion
6. Conclusions
6.1. Main Results
6.2. Theoretical Contributions
6.3. Managerial Implications
6.4. Limitations and Future Research
Author Contributions
Funding
Institutional Review Board Statement
Informed Consent Statement
Data Availability Statement
Conflicts of Interest
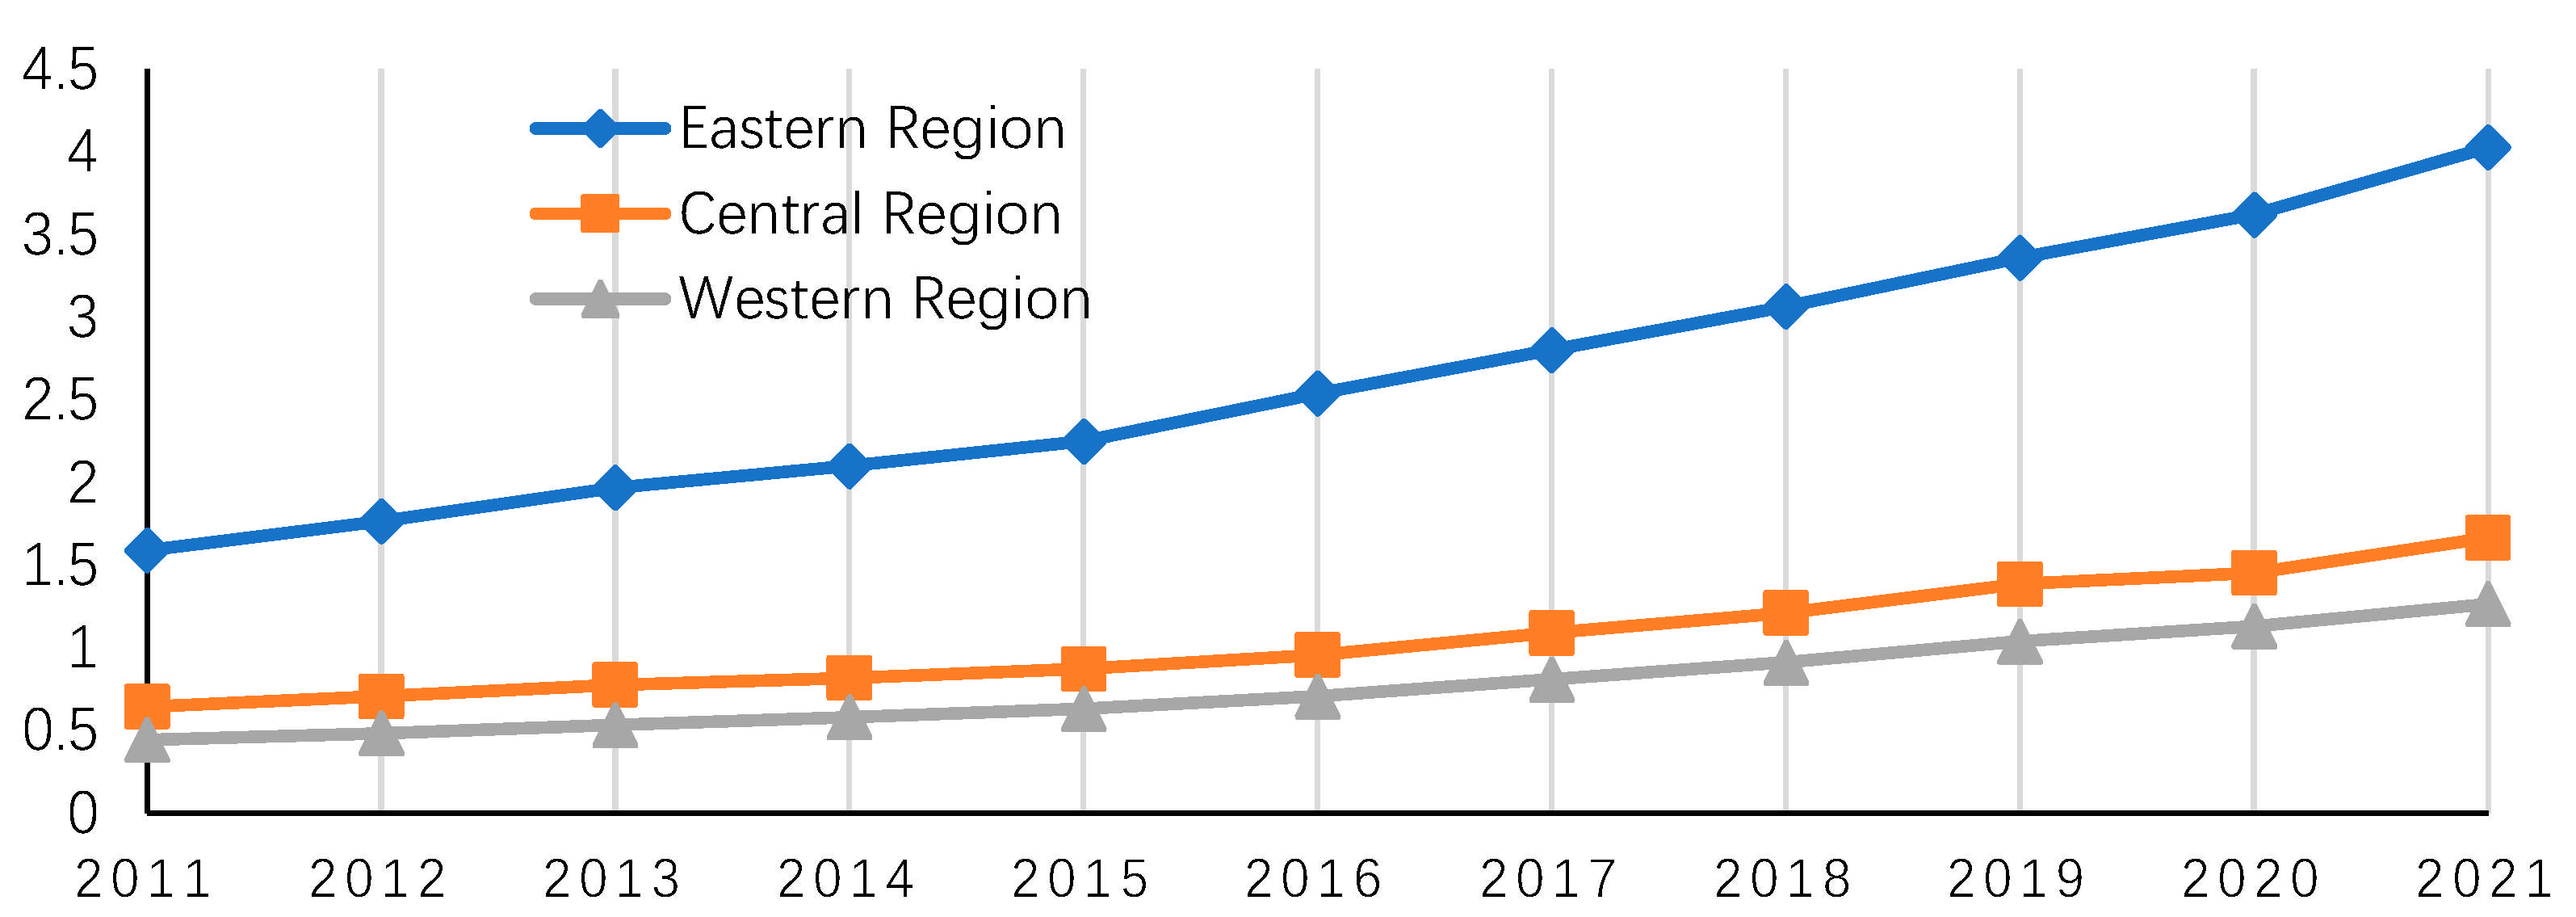
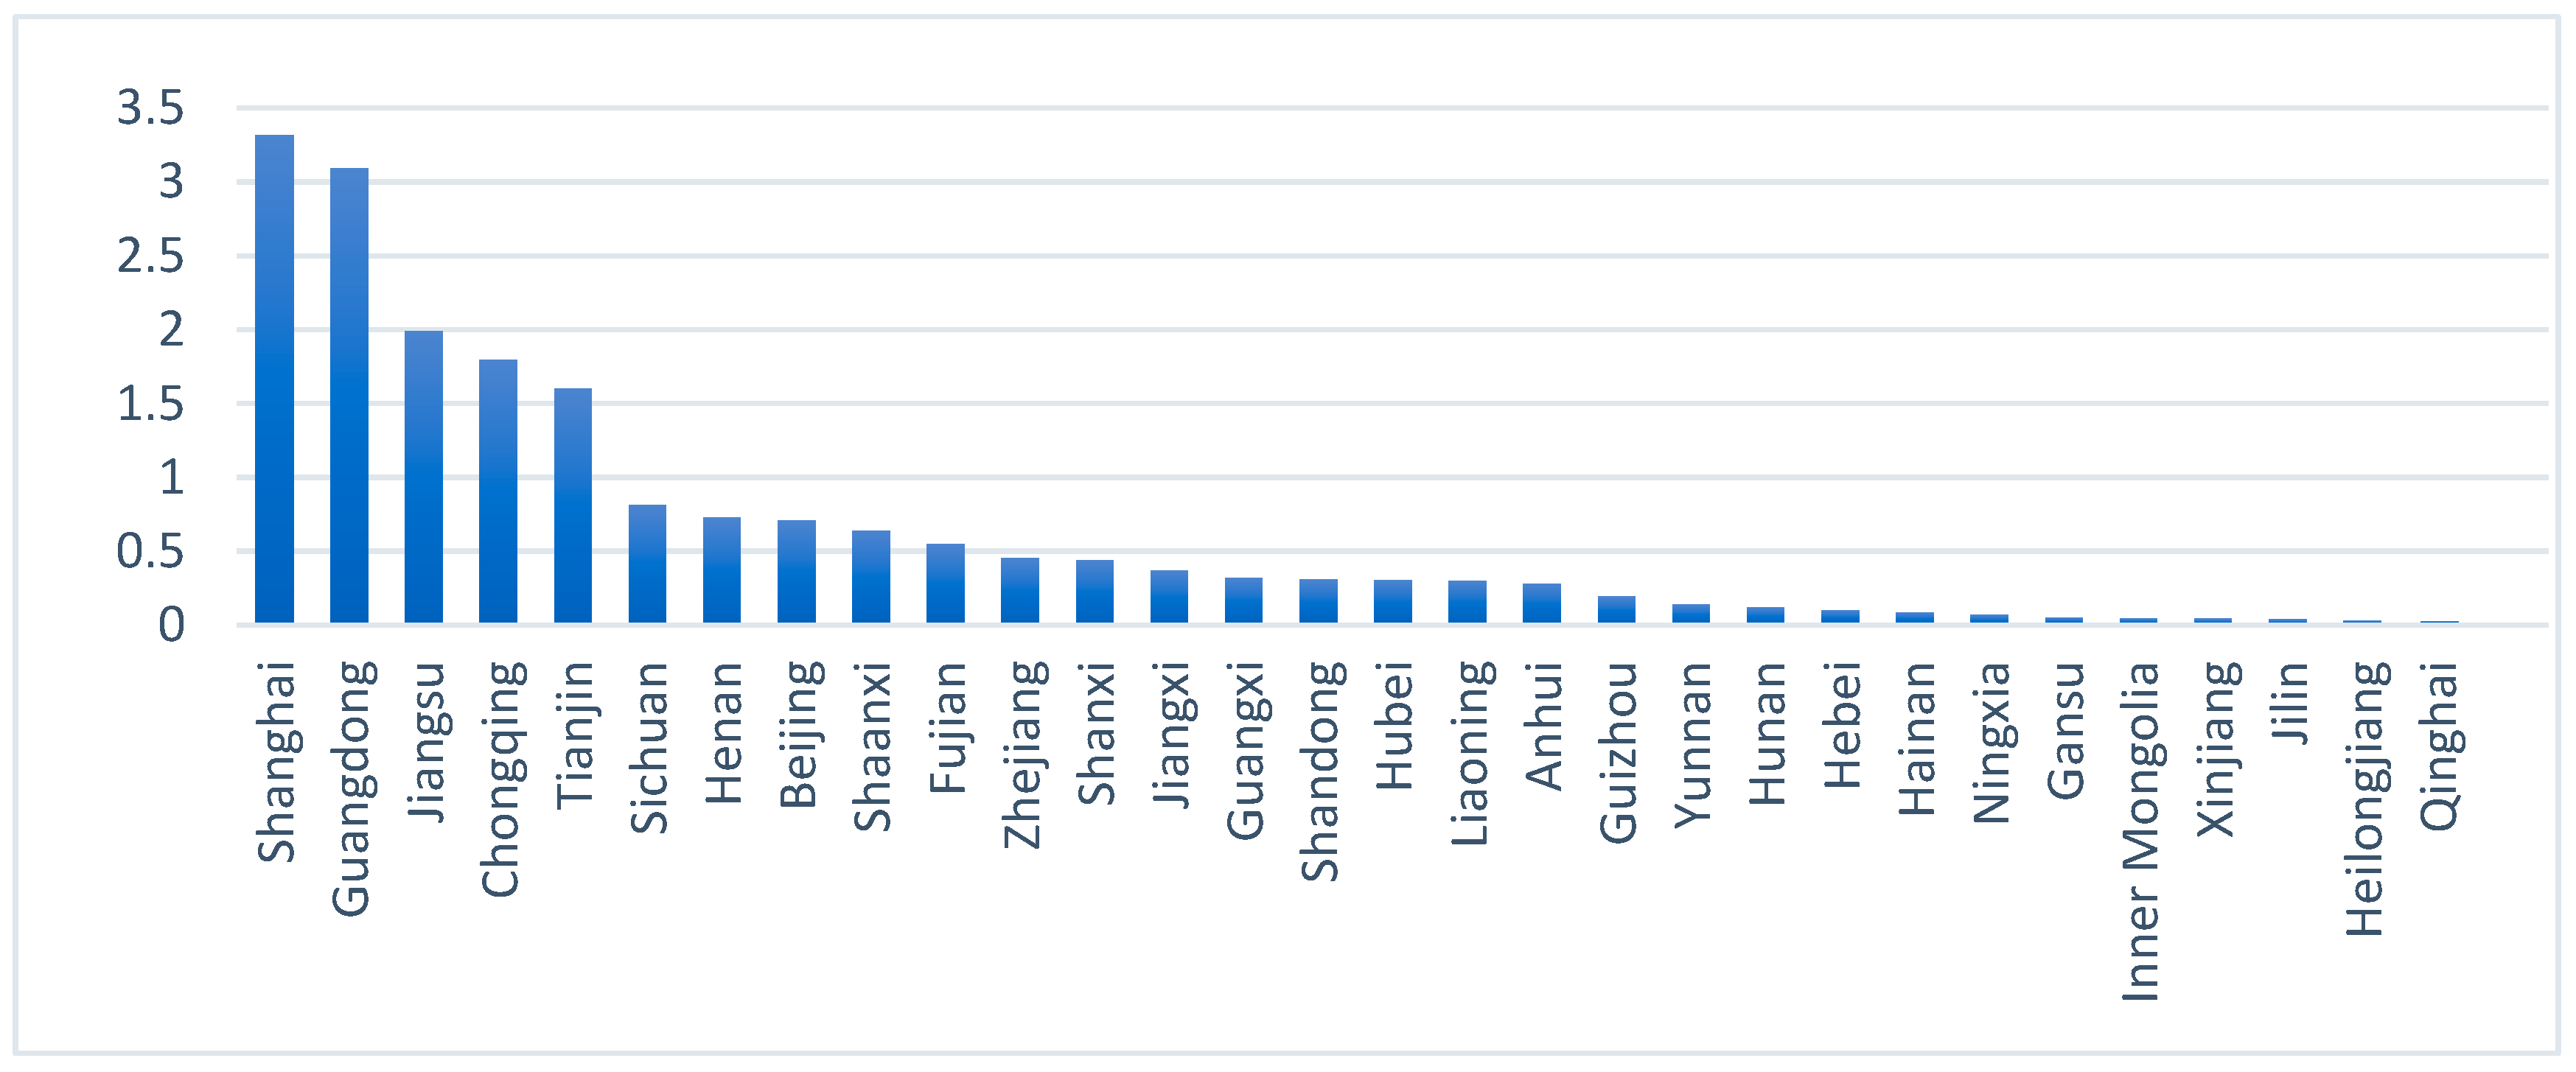
Appendix A. Regional Analysis of Digital Economy Development Level Measurement


Appendix B. Analysis of Trade Competitiveness Index (Tci)

| Year | CCT | LST | ET | CIMT | AT | OET | BT | MT | OT |
|---|---|---|---|---|---|---|---|---|---|
| 2011 | 0.5762 | 0.0609 | −0.4238 | −0.6799 | −0.6105 | −0.2559 | −0.0406 | −0.1143 | −0.3106 |
| 2012 | 0.5479 | 0.0376 | −0.4027 | −0.5726 | −0.6902 | −0.1942 | −0.0099 | −0.1372 | −0.2524 |
| 2013 | 0.5502 | 0.0152 | −0.3435 | −0.5064 | −0.7104 | −0.1929 | −0.1208 | −0.0189 | −0.1750 |
| 2015 | 0.5815 | −0.0413 | −0.3788 | −0.4827 | −0.6536 | −0.1603 | −0.2422 | 0.1294 | −0.0519 |
| 2016 | 0.5842 | −0.0675 | −0.4190 | −0.4646 | −0.6262 | −0.1565 | −0.3367 | 0.2177 | −0.0564 |
| 2017 | 0.6032 | −0.0825 | −0.4409 | −0.5177 | −0.6576 | −0.1467 | −0.4295 | 0.2662 | −0.1652 |
| 2018 | 0.6048 | −0.0550 | −0.4327 | −0.5610 | −0.6312 | −0.1637 | −0.4524 | 0.2153 | −0.0002 |
| 2019 | 0.6026 | −0.0339 | −0.3980 | −0.5222 | −0.5873 | −0.1363 | −0.5223 | 0.1860 | 0.0292 |
| 2020 | 0.6005 | −0.0165 | −0.3683 | −0.4841 | −0.5037 | −0.1047 | −0.5651 | 0.1567 | 0.0590 |
| 2021 | 0.5827 | 0.0927 | −0.3368 | −0.4732 | −0.5214 | −0.0131 | 0.4514 | 0.2254 | 0.3458 |
References
- Zhang, L.; Pham, T.D.; Li, R.; Do, T.T. Enhancing the Sustainable Development of the ASEAN’s Digital Trade: The Impact Mechanism of Innovation Capability. Sustainability 2025, 17, 1766. [Google Scholar] [CrossRef]
- Li, Y.; Cui, J. Research on the Export Quality Effect of Digital Economy. World Econ. Study. 2022, 3, 17–32+134. [Google Scholar]
- Yu, H.; Yin, F. Digitalization and Firms’ Export Product Diversification—A Research Based on the Technological Distance between Products. Int. Bus. 2023, 4, 1–19. [Google Scholar]
- Bunje, M.Y.; Abendin, S.; Wang, Y. The Multidimensional Effect of Financial Development on Trade in Africa: The Role of the Digital Economy. Telecommun. Policy. 2022, 46, S030859612200146X. [Google Scholar] [CrossRef]
- Guan, H.; Xu, X.; Zhang, M. Research on Industrial Classification for Digital Economy in China. Stat. Res. 2020, 37, 3–16. [Google Scholar]
- Duan, X.; Chen, L. The Spatial Spillover Effect of the Digital Economy on the Export Competitiveness of High tech Industries: Taking Yangtze River Economic Belt as an Example. J. Chongqing Technol. Bus. Univ. (Soc. Sci. Ed.) 2022, 39, 129–139. [Google Scholar]
- Yao, Z. The Influence and Threshold Effect of Digital Economy on China’s Manufacturing Export Competitiveness. Reform 2022, 2, 61–75. [Google Scholar]
- Zhang, H.; Pan, G. Cross-border E-commerce and Bilateral Trade Costs: An Empirical Analysis Based on Cross-border E-commerce Policy. Econ. Res. J. 2021, 56, 141–157. [Google Scholar]
- Klimakova, E.; Alireza, N. Prospects for the Development of Russian Export in the Context of Digitalization. Res. World Econ. 2020, 11, 114–122. [Google Scholar] [CrossRef]
- Erickson, R.A.; Hayward, D.J. Interstate Differences in Relative Export Performance: A Test of Factor Endowments Theory. Geogr. Anal. 1992, 24, 223–239. [Google Scholar] [CrossRef]
- Dinopoulos, E.; Oehmke, J.F.; Segerstrom, P.S. High-technology-industry Trade and Investment: The Role of Factor Endowments. J. Int. Econ. 1993, 34, 49–71. [Google Scholar] [CrossRef]
- Yang, L.; Yang, W.; Nan, L.; Gu, Y. The Impact of Digital Trade on the Export Competitiveness of Enterprises—An Empirical Analysis Based on Listed Companies in the Yangtze River Economic Belt. Systems 2024, 12, 580. [Google Scholar] [CrossRef]
- Li, H.; Han, J.; Xu, Y. The Effect of the Digital Economy on Services Exports Competitiveness and Ternary Margins. Telecommun. Policy. 2023, 47, 102596. [Google Scholar] [CrossRef]
- Wang, Q.; Wei, Y. Research on the Influence of Digital Economy on Technological Innovation: Evidence from Manufacturing Enterprises in China. Sustainability 2023, 15, 4995. [Google Scholar] [CrossRef]
- Soete, L.; Freeman, C. The Economics of Industrial Innovation; Routledge: London, UK, 2012. [Google Scholar]
- Brynjolfsson, E.; McAfee, A. The Second Machine Age: Work, Progress, and Prosperity in a Time of Brilliant Technologies; W. W. Norton & Company: New York, NY, USA, 2014. [Google Scholar]
- Goldfarb, A.; Tucker, C. Digital Economics. J. Econ. Lit. 2019, 57, 3–43. [Google Scholar] [CrossRef]
- Aral, S.; Brynjolfsson, E.; Wu, L. Three-way Complementarities: Performance Pay, Human Resource Analytics, and Information Technology. Manag. Sci. 2012, 58, 913–931. [Google Scholar] [CrossRef]
- Chen, W.; Los, B.; Timmer, M.P. Factor Incomes in Global Value Chains; University of Chicago Press: Chicago, IL, USA, 2021. [Google Scholar]
- Czarnitzki, D.; Delanote, J. Incorporating Innovation Subsidies in the CDM Framework: Empirical Evidence from Belgium. Econ. Innov. New Technol. 2017, 26, 78–92. [Google Scholar] [CrossRef]
- Grossman, G.M.; Helpman, E. Innovation and Growth in the Global Economy; MIT Press: Cambridge, MA, USA, 1993. [Google Scholar]
- Li, Q.; Zhao, S. The Impact of Digital Economy Development on Industrial Restructuring: Evidence from China. Sustainability 2023, 15, 10847. [Google Scholar] [CrossRef]
- Feng, S.; Li, W.; Li, Q.; Chen, M.; Su, Y.; Zhu, J. Global Value Chains, Digital Economy, and Upgrading of China’s Manufacturing Industry. Sustainability 2023, 15, 8003. [Google Scholar] [CrossRef]
- Zhang, R.; Di, D.; Li, G. Does Digital Transformation Promote Global Value Chain Upgrading? Evidence from Chinese Manufacturing Firms. Econ. Model. 2024, 139, 106810. [Google Scholar]
- Yu, J.; Xu, Y.; Zhou, J.; Chen, W. Digital Transformation, Total Factor Productivity, and Firm Innovation Investment. J. Innov. Knowl. 2024, 9, 100487. [Google Scholar] [CrossRef]
- Paunov, C.; Planes-Satorra, S. How are Digital Technologies Changing Innovation. OECD Sci. Technol. Ind. Policy 2019, 74, 53. [Google Scholar]
- Han, X.; Li, J.; Xu, J. The Dynamic Moderating Effect of Green Technology Innovation to Promote Regional Industrial Upgrading: A New Perspective Based on the Constraint of Economic Growth Targets. Sci. Technol. Prog. Policy 2023, 40, 44–53. [Google Scholar]
- Brouwer, E.; Kleinknecht, A. Innovative Output, and a Firm’s Propensity to Patent: An Exploration of CIS Micro Data. Res. Policy 1999, 28, 615–624. [Google Scholar] [CrossRef]
- Zhao, T.; Zhang, Z.; Liang, S. Digital Economy, Entrepreneurship, and High-Quality Economic Development: Empirical Evidence from Urban China. Manag. World 2020, 36, 65–76. [Google Scholar]
- Hansen, B.E. Threshold Effects in Non-dynamic Panels: Estimation, Testing, and Inference. J. Econom. 1999, 93, 345–368. [Google Scholar] [CrossRef]
- Nucci, F.; Puccioni, C.; Ricchi, O. Digital Technologies and Productivity: A Firm-level Investigation. Econ. Model. 2023, 128, 106524. [Google Scholar] [CrossRef]
- Zhang, H.; Zhang, K.; Yan, T.; Cao, X. The Impact of Digital Infrastructure on Regional Green Innovation Efficiency through Industrial Agglomeration and Diversification. Humanit. Soc. Sci. Commun. 2025, 12, 220. [Google Scholar] [CrossRef]
- Liu, H.; Wang, X.; Wang, Z.; Cheng, Y. Does Digitalization Mitigate Regional Inequalities? Evidence from China. Geogr. Sustain. 2024, 5, 52–63. [Google Scholar] [CrossRef]
- Zhou, Q.; Cheng, C.; Fang, Z.; Zhang, H.; Xu, Y. How does the development of the digital economy affect innovation output? Exploring mechanisms from the perspective of regional innovation systems. Struct. Change Econ. Dyn. 2024, 70, 1–17. [Google Scholar] [CrossRef]
- Liu, L.; Xin, Y.; Liu, B.; Pang, Y.; Kong, W. The Panel Threshold Analysis of Digitalization on Manufacturing Industry’s Green Total Factor Productivity. Sci. Rep. 2025, 15, 4336. [Google Scholar] [CrossRef] [PubMed]
- Kan, D.; Lyu, L.; Huang, W.; Yao, W. Digital Economy and the Upgrading of the Global Value Chain of China’s Service Industry. J. Theor. Appl. Electron. Commer. Res. 2022, 17, 1279–1296. [Google Scholar] [CrossRef]
- Zhang, J.; Zhao, W.; Cheng, B.; Li, A.; Wang, Y.; Yang, N.; Tian, Y. The Impact of Digital Economy on the Economic Growth and the Development Strategies in the Post-COVID-19 Era: Evidence from Countries along the “Belt and Road”. Front. Public Health 2022, 10, 856142. [Google Scholar] [CrossRef] [PubMed]
- Bai, T.; Qi, Y.; Li, Z.; Xu, D. Digital Economy, Industrial Transformation and Upgrading, and Spatial Transfer of Carbon Emissions: The Paths for Low-carbon Transformation of Chinese Cities. J. Environ. Manag. 2023, 344, 118528. [Google Scholar] [CrossRef]
- Su, J.; Su, K.; Wang, S. Does the Digital Economy Promote Industrial Structural Upgrading?—A Test of Mediating Effects based on Heterogeneous Technological Innovation. Sustainability 2021, 13, 10105. [Google Scholar] [CrossRef]
- Gray, J.; Rumpe, B. Models for the Digital Transformation. Softw. Syst. Model. 2017, 16, 307–308. [Google Scholar] [CrossRef]
- Iscaro, V.; Castaldi, L.; Maresca, P.; Mazzoni, C. Digital Transformation in the Economics of Complexity: The Role of Predictive Models in Strategic Management. J. Strategy Manag. 2022, 15, 450–467. [Google Scholar] [CrossRef]
| Variable Type | Variable Name | Sample Size | Mean | Standard Deviation | Minimum | Maximum | Median |
|---|---|---|---|---|---|---|---|
| Dependent Variable | Eci | 330 | 0.632 | 0.878 | 0.001 | 4.165 | 0.294 |
| Core Explanatory Variable | De | 330 | 0.130 | 0.131 | 0.004 | 0.880 | 0.092 |
| Control Variables | Edu | 330 | 17.748 | 1.229 | 13.98 | 22.7 | 17.79 |
| Open | 330 | 0.265 | 0.291 | 0.008 | 1.548 | 0.142 | |
| Fdi | 330 | 8.381 | 8.092 | 0.003 | 35.760 | 5.815 | |
| Fin | 330 | 3.380 | 1.085 | 1.678 | 7.578 | 3.146 | |
| Mediating Variables | Ti | 330 | 15.879 | 33.550 | 0.002 | 245.918 | 4.093 |
| Upgra | 330 | 5.347 | 3.443 | 0.101 | 32.405 | 4.567 |
| Primary Indicator (Weight) | Secondary Indicator (Weight) | Tertiary Indicators | Unit | Weight |
|---|---|---|---|---|
| Industrial Digitalization (0.4002) | Industry (0.1826) | Industrial changed value | CYN hundred million | 0.0330 |
| Expenditure on technological transformation | CYN ten thousand | 0.0340 | ||
| New product sales revenue from large industrial enterprises | CYN ten thousand | 0.0583 | ||
| Full-time equivalent of R&D personnel in large industrial enterprises | Person-years | 0.0573 | ||
| Agriculture (0.0679) | Changed value in agriculture, forestry, animal husbandry, and fisheries | CYN hundred million | 0.0246 | |
| Number of rural broadband access users | Ten thousand households | 0.0433 | ||
| Tertiary Industry (0.1497) | Changed value of tertiary industry | CYN hundred million | 0.0312 | |
| Original insurance premium income | CYN hundred million | 0.0292 | ||
| Express business revenue | CYN ten thousand | 0.0893 | ||
| Digital Industrialization (0.3792) | Infrastructure (0.0936) | Internet broadband access ports | Ten thousand locations | 0.0268 |
| Postal service outlets | Locations | 0.0284 | ||
| Year-end total of mobile phone users | Ten thousand households | 0.0219 | ||
| Length of long-distance optical fiber cables | Ten thousand kilometers | 0.0165 | ||
| ICT Industry (0.2756) | Main business revenue of computer industry | CYN hundred million | 0.0895 | |
| Telecom business volume | CYN hundred million | 0.0548 | ||
| Software business revenue | CYN ten thousand | 0.0818 | ||
| Urban employment in information transmission, software, and IT services | Ten thousand people | 0.0495 | ||
| Digital Development Environment (0.2304) | Digital Talent Cultivation (0.0371) | Number of students in regular higher education | Ten thousand people | 0.0173 |
| Local government education expenditure | CYN hundred million | 0.0198 | ||
| Innovation Environment (0.1933) | Internal expenditure on R&D in high-tech industries | CYN ten thousand | 0.0815 | |
| Number of domestic patent applications granted | Items | 0.0642 | ||
| Local government spending on science and technology | CYN hundred million | 0.0476 |
| Division | Region | 2011 | 2012 | 2013 | 2014 | 2015 | 2016 | 2017 | 2018 | 2019 | 2020 | 2021 | Mean Value |
|---|---|---|---|---|---|---|---|---|---|---|---|---|---|
| North China | Beijing | 0.0994 | 0.1101 | 0.1224 | 0.1365 | 0.1488 | 0.1627 | 0.1810 | 0.2019 | 0.2202 | 0.2467 | 0.2755 | 0.1732 |
| Tianjin | 0.0355 | 0.0433 | 0.0488 | 0.0518 | 0.0569 | 0.0582 | 0.0574 | 0.0630 | 0.0676 | 0.0759 | 0.0808 | 0.0581 | |
| Hebei | 0.0796 | 0.0802 | 0.1006 | 0.1062 | 0.1138 | 0.1283 | 0.1423 | 0.1612 | 0.1841 | 0.2046 | 0.1988 | 0.1371 | |
| Shanxi | 0.0400 | 0.0458 | 0.0503 | 0.0492 | 0.0527 | 0.0534 | 0.0627 | 0.0688 | 0.0771 | 0.0880 | 0.0960 | 0.0622 | |
| Inner Mongolia | 0.0363 | 0.0385 | 0.0428 | 0.0452 | 0.0485 | 0.0514 | 0.0552 | 0.0596 | 0.0646 | 0.0700 | 0.0684 | 0.0528 | |
| Northeast China | Liaoning | 0.0784 | 0.0843 | 0.0956 | 0.1009 | 0.0992 | 0.0960 | 0.1006 | 0.1088 | 0.1136 | 0.1215 | 0.1223 | 0.1090 |
| Jilin | 0.0339 | 0.0372 | 0.0387 | 0.0445 | 0.0448 | 0.0486 | 0.0523 | 0.0540 | 0.0754 | 0.0619 | 0.0608 | 0.0502 | |
| Heilongjiang | 0.0447 | 0.0493 | 0.0534 | 0.0565 | 0.0588 | 0.0626 | 0.0694 | 0.0727 | 0.0797 | 0.0816 | 0.0777 | 0.0642 | |
| East China | Shanghai | 0.0944 | 0.1042 | 0.1182 | 0.1320 | 0.1413 | 0.1628 | 0.1871 | 0.1958 | 0.2215 | 0.2432 | 0.2643 | 0.1695 |
| Jiangsu | 0.2514 | 0.2932 | 0.3228 | 0.3443 | 0.3784 | 0.4073 | 0.4367 | 0.4682 | 0.5126 | 0.5765 | 0.6160 | 0.4189 | |
| Zhejiang | 0.1436 | 0.1663 | 0.1915 | 0.2037 | 0.2383 | 0.2528 | 0.2900 | 0.3409 | 0.3843 | 0.4207 | 0.4438 | 0.2796 | |
| Anhui | 0.0681 | 0.0755 | 0.0846 | 0.0924 | 0.1088 | 0.1231 | 0.1415 | 0.1668 | 0.1904 | 0.2149 | 0.2279 | 0.1358 | |
| Fujian | 0.0712 | 0.0826 | 0.0932 | 0.1020 | 0.1139 | 0.1272 | 0.1439 | 0.1669 | 0.1830 | 0.1861 | 0.1994 | 0.1336 | |
| Jiangxi | 0.0403 | 0.0454 | 0.0537 | 0.0600 | 0.0697 | 0.0781 | 0.0921 | 0.1085 | 0.1281 | 0.1465 | 0.1511 | 0.0885 | |
| Shandong | 0.1601 | 0.1821 | 0.2073 | 0.2174 | 0.2428 | 0.2606 | 0.2827 | 0.3003 | 0.3206 | 0.3545 | 0.3946 | 0.2657 | |
| Central China | Henan | 0.0948 | 0.1059 | 0.1240 | 0.1330 | 0.1490 | 0.1649 | 0.1850 | 0.2129 | 0.2363 | 0.2653 | 0.2690 | 0.1764 |
| Hubei | 0.0730 | 0.0846 | 0.0962 | 0.1072 | 0.1208 | 0.1345 | 0.1515 | 0.1744 | 0.1981 | 0.2095 | 0.2297 | 0.1436 | |
| Hunan | 0.0802 | 0.0918 | 0.1038 | 0.1033 | 0.1149 | 0.1227 | 0.1384 | 0.1517 | 0.1751 | 0.1961 | 0.1997 | 0.1344 | |
| South China | Guangdong | 0.2756 | 0.3161 | 0.3662 | 0.3868 | 0.4457 | 0.5062 | 0.5780 | 0.6878 | 0.7764 | 0.8514 | 0.8799 | 0.5518 |
| Guangxi | 0.0445 | 0.0510 | 0.0554 | 0.0577 | 0.0654 | 0.0718 | 0.0813 | 0.0968 | 0.1190 | 0.1343 | 0.1274 | 0.0822 | |
| Hainan | 0.0059 | 0.0075 | 0.0093 | 0.0099 | 0.0120 | 0.0139 | 0.0159 | 0.0190 | 0.0229 | 0.0255 | 0.0258 | 0.0152 | |
| Southwest China | Chongqing | 0.0367 | 0.0428 | 0.0511 | 0.0570 | 0.0659 | 0.0756 | 0.0856 | 0.0938 | 0.1082 | 0.1220 | 0.1278 | 0.0788 |
| Sichuan | 0.0961 | 0.1057 | 0.1244 | 0.1361 | 0.1535 | 0.1700 | 0.1949 | 0.2233 | 0.2586 | 0.2931 | 0.2965 | 0.1866 | |
| Guizhou | 0.0266 | 0.0325 | 0.0362 | 0.0412 | 0.0479 | 0.0534 | 0.0620 | 0.0735 | 0.0863 | 0.0968 | 0.0912 | 0.0589 | |
| Yunnan | 0.0358 | 0.0406 | 0.0467 | 0.0493 | 0.0555 | 0.0606 | 0.0701 | 0.0864 | 0.1033 | 0.1187 | 0.1075 | 0.0704 | |
| Northwest China | Shaanxi | 0.0500 | 0.0563 | 0.0563 | 0.0631 | 0.0693 | 0.0766 | 0.0868 | 0.0958 | 0.1090 | 0.1252 | 0.1368 | 0.0917 |
| Gansu | 0.0196 | 0.0248 | 0.0281 | 0.0298 | 0.0329 | 0.0352 | 0.0406 | 0.0477 | 0.0562 | 0.0621 | 0.0592 | 0.0397 | |
| Qinghai | 0.0043 | 0.0059 | 0.0064 | 0.0077 | 0.0088 | 0.0096 | 0.0110 | 0.0129 | 0.0148 | 0.0168 | 0.0142 | 0.0102 | |
| Ningxia | 0.0050 | 0.0050 | 0.0063 | 0.0087 | 0.0083 | 0.0093 | 0.0122 | 0.0162 | 0.0177 | 0.0194 | 0.0197 | 0.0116 | |
| Xinjiang | 0.0247 | 0.0278 | 0.0312 | 0.0337 | 0.0391 | 0.0406 | 0.0448 | 0.0520 | 0.0616 | 0.0676 | 0.0658 | 0.0444 |
Variable | (1) LnEci | (2) LnEci | (3) LnEci | (4) LnEci | (5) LnEci |
|---|---|---|---|---|---|
| LnDe | 0.728 *** (9.33) | 0.640 *** (7.71) | 0.836 *** (10.17) | 0.835 *** (10.11) | 0.656 *** (5.85) |
| LnEdu | 2.031 *** (2.82) | 1.471 ** (2.18) | 1.479 ** (2.14) | 1.640 ** (2.38) | |
| LnOpen | 0.813 *** (6.92) | 0.813 *** (6.86) | 0.814 *** (6.92) | ||
| LnFdi | 0.003 (0.05) | −0.003 (−0.05) | |||
| LnFin | 0.744 ** (2.35) | ||||
| cons | 0.348 * (1.79) | −5.705 *** (−2.64) | −2.160 (−1.04) | −2.195 (−1.01) | −3.951 * (−1.73) |
| Year | Yes | Yes | Yes | Yes | Yes |
| Province | Yes | Yes | Yes | Yes | Yes |
| N | 330 | 330 | 330 | 330 | 330 |
| R2 | 0.226 | 0.246 | 0.350 | 0.350 | 0.362 |
| Eastern Region | Central Region | Western Region | |
|---|---|---|---|
| Variable | LnEci | LnEci | LnEci |
| LnDe | 0.026 | 0.694 *** | 1.060 *** |
| (0.24) | (2.89) | (4.13) | |
| LnEdu | −0.375 | −0.002 | 1.437 |
| (−0.69) | (−0.00) | (0.89) | |
| LnOpen | 0.637 *** | 0.709 *** | 0.756 *** |
| (4.14) | (3.27) | (4.48) | |
| LnFdi | −0.029 | −0.200 ** | 0.192 ** |
| (−0.57) | (−2.31) | (2.06) | |
| LnFin | −0.369 | 1.458 *** | 1.822 ** |
| (−1.29) | (2.88) | (2.29) | |
| Cons | 1.769 | 0.837 | −3.770 |
| (1.05) | (0.23) | (−0.65) | |
| N | 121 | 88 | 121 |
| R2 | 0.310 | 0.666 | 0.525 |
| Province | Yes | Yes | Yes |
| Year | Yes | Yes | Yes |
Variable | (1) First Stage | (2) Second Stage |
|---|---|---|
| L.De | 0.976 *** (177.93) | |
| LnDe | 0.471 *** (5.77) | |
| LnEdu | −0.042 (−0.78) | 4.258 *** (5.51) |
| LnOpen | 0.018 *** (3.10) | 0.838 *** (9.98) |
| LnFdi | 0.001 (0.19) | 0.132 ** (2.54) |
| LnFin | −0.045 *** (−2.94) | 0.267 (1.21) |
| Cons | 0.245 (1.51) | −11.790 *** (−5.01) |
| N | 300 | 330 |
| R2 | 0.996 | 0.686 |
Variable | (1) LnRca | (2) LnRca | (3) LnRca | (4) LnRca | (5) LnRca |
|---|---|---|---|---|---|
| LnDe | 0.728 *** (9.50) | 0.600 *** (7.43) | 0.563 *** (6.56) | 0.572 *** (6.62) | 0.440 *** (3.68) |
| LnEdu | 2.836 *** (4.12) | 2.902 *** (4.20) | 2.734 *** (3.85) | 2.864 *** (4.02) | |
| LnOpen | −0.146 (−1.26) | −0.130 (−1.11) | −0.139 (−1.19) | ||
| LnFdi | −0.057 (−1.02) | −0.061 (−1.10) | |||
| LnFin | 0.530 (1.57) | ||||
| Cons | 1.157 *** (6.04) | −7.308 *** (−3.54) | −7.851 *** (−3.72) | −7.117 *** (−3.19) | −8.438 *** (−3.55) |
| Year | Yes | Yes | Yes | Yes | Yes |
| Province | Yes | Yes | Yes | Yes | Yes |
| N | 330 | 330 | 330 | 330 | 330 |
| R2 | 0.232 | 0.273 | 0.277 | 0.279 | 0.285 |
| (1) | (2) | (3) | (4) | (5) | |
|---|---|---|---|---|---|
| Variable | LnEci | LnEci | LnEci | LnEci | LnEci |
| LnDe | 0.515 *** | 0.429 *** | 0.493 *** | 0.472 *** | 0.363 *** |
| (3.57) | (3.08) | (3.62) | (3.41) | (2.85) | |
| LnEdu | 3.728 *** | 3.882 *** | 4.030 *** | 3.070 *** | |
| (5.16) | (5.52) | (5.57) | (4.56) | ||
| LnOpen | 0.521 *** | 0.508 *** | 0.681 *** | ||
| (4.35) | (4.20) | (6.04) | |||
| LnFdi | 0.054 | 0.019 | |||
| (0.87) | (0.34) | ||||
| LnFin | 1.874 *** | ||||
| (7.65) | |||||
| Cons | −0.618 *** | −11.472 *** | −10.878 *** | −11.552 *** | −10.736 *** |
| (−2.60) | (−5.42) | (−5.28) | (−5.24) | (−5.32) | |
| N | 330 | 330 | 330 | 330 | 330 |
| R2 | 0.041 | 0.119 | 0.172 | 0.174 | 0.311 |
| Province | Yes | Yes | Yes | Yes | Yes |
| Year | Yes | Yes | Yes | Yes | Yes |
Variable | (1) LnTi | (2) LnEci | (3) LnUpgra | (4) LnEci |
|---|---|---|---|---|
| LnDe | 1.357 *** (10.53) | 0.494 *** (3.64) | 0.815 *** (7.63) | 0.463 *** (3.70) |
| LnTi | 0.106 ** (2.04) | |||
| LnUpgra | 0.216 *** (3.47) | |||
| LnEdu | 0.648 (0.85) | 1.863 *** (2.70) | 1.935 *** (3.04) | 1.514** (2.19) |
| LnOpen | −0.214 * (−1.71) | 0.849 *** (7.51) | −0.151 (−1.45) | 0.859 *** (7.71) |
| LnFdi | −0.198 *** (−3.29) | 0.058 (1.05) | −0.041 (−0.83) | 0.045 (0.85) |
| LnFin | 0.719 ** (1.99) | 0.627 * (1.91) | 0.705 ** (2.35) | 0.551 * (1.70) |
| Cons | 6.819 *** (2.67) | −5.632 ** (−2.42) | −3.016 (−1.42) | −4.255 * (−1.87) |
| Year | Yes | Yes | Yes | Yes |
| Province | Yes | Yes | Yes | Yes |
| N | 330 | 330 | 330 | 330 |
| R2 | 0.591 | 0.367 | 0.498 | 0.383 |
| (1) | (2) | (3) | (4) | |
|---|---|---|---|---|
| Variable | LnTi | LnEci | LnUpgra | LnEci |
| LnDe | 0.390 ** | 0.289 ** | 0.327 *** | 0.268 ** |
| (2.46) | (2.30) | (2.68) | (2.16) | |
| LnTi | 0.191 *** | |||
| (4.19) | ||||
| LnUpgra | 0.290 *** | |||
| (4.96) | ||||
| LnEdu | 3.318 *** | 2.436 *** | 3.476 *** | 2.062 *** |
| (3.96) | (3.62) | (5.38) | (3.03) | |
| LnOpen | −0.556 *** | 0.787 *** | −0.348 *** | 0.782 *** |
| (−3.97) | (6.99) | (−3.22) | (7.08) | |
| LnFdi | −0.206 *** | 0.059 | −0.053 | 0.035 |
| (−2.92) | (1.04) | (−0.98) | (0.63) | |
| LnFin | 3.289 *** | 1.246 *** | 2.228 *** | 1.228 *** |
| (10.81) | (4.42) | (9.49) | (4.56) | |
| Cons | −7.172 *** | −9.366 *** | −11.025 *** | −7.539 *** |
| (−2.86) | (−4.70) | (−5.70) | (−3.68) | |
| Year | Yes | Yes | Yes | Yes |
| Province | Yes | Yes | Yes | Yes |
| N | 330 | 330 | 330 | 330 |
| R2 | 0.449 | 0.350 | 0.413 | 0.364 |
| Variable | Thresholds | Threshold Value | F Value | p Value | 10% Level | 5% Level | 1% Level |
|---|---|---|---|---|---|---|---|
| Digital Economy Development Level | Single Threshold | −3.107 | 55.81 | 0.013 | 30.370 | 35.389 | 56.081 |
| Double Threshold | −3.107 | 55.81 | 0.013 | 30.370 | 38.347 | 59.409 | |
| −4.616 | 30.90 | 0.060 | 26.585 | 33.407 | 41.730 |
| Variable Name | Variable Interval | Regression Coefficient | Standard Error | T Value |
|---|---|---|---|---|
| Digital Economy Development Level | <−4.616 | 0.786 *** | 0.202 | 3.89 |
| [−4.616,−2.663] | 0.972 *** | 0.229 | 4.24 | |
| >−2.663 | 0.750 *** | 0.193 | 3.88 |
| Empirical Stage | Objective | Methodology | Key Findings |
|---|---|---|---|
| Baseline Regression | Estimate direct effect of digital economy on high-tech export performance | Fixed-effects panel regression | Digital economy significantly boosts export competitiveness (p < 0.01); supports H1. |
| Heterogeneity Analysis | Explore regional differences | Stratified regression by region | Stronger effects in central and western regions; highlights inclusivity potential of digital transformation. |
| Endogeneity Test | Address potential reverse causality | 2SLS with lagged explanatory variable | Effect remains significant, confirming robustness and causality of the digital economy’s impact. |
| Robustness Tests | Test stability of results | Variable substitution (dependent and explanatory) | Findings hold under alternate metrics (RCA, digital finance index), reaffirming reliability. |
| Mediation Effect Analysis | Examine indirect pathways via innovation and upgrading | Stepwise regression + robustness checks | Technological innovation and industrial upgrading partially mediate the relationship; supports H2 and H3. |
| Threshold Effect Analysis | Identify nonlinear effects | Hansen’s threshold panel model | Double threshold effect found; impact follows an inverted U-shape—optimal at intermediate digital maturity. |
Disclaimer/Publisher’s Note: The statements, opinions and data contained in all publications are solely those of the individual author(s) and contributor(s) and not of MDPI and/or the editor(s). MDPI and/or the editor(s) disclaim responsibility for any injury to people or property resulting from any ideas, methods, instructions or products referred to in the content. |
© 2025 by the authors. Licensee MDPI, Basel, Switzerland. This article is an open access article distributed under the terms and conditions of the Creative Commons Attribution (CC BY) license (https://creativecommons.org/licenses/by/4.0/).
Share and Cite
Hu, G.; Zhang, X.; Yang, J.; Sun, W.; Zhu, T. Uncovering the Mechanism of Elevating High-Tech Export Competitiveness in China’s Sustainable Economic Development: Force of Digital Economy. Sustainability 2025, 17, 3667. https://doi.org/10.3390/su17083667
Hu G, Zhang X, Yang J, Sun W, Zhu T. Uncovering the Mechanism of Elevating High-Tech Export Competitiveness in China’s Sustainable Economic Development: Force of Digital Economy. Sustainability. 2025; 17(8):3667. https://doi.org/10.3390/su17083667
Chicago/Turabian StyleHu, Genhua, Xuejian Zhang, Jing Yang, Wenda Sun, and Tingting Zhu. 2025. "Uncovering the Mechanism of Elevating High-Tech Export Competitiveness in China’s Sustainable Economic Development: Force of Digital Economy" Sustainability 17, no. 8: 3667. https://doi.org/10.3390/su17083667
APA StyleHu, G., Zhang, X., Yang, J., Sun, W., & Zhu, T. (2025). Uncovering the Mechanism of Elevating High-Tech Export Competitiveness in China’s Sustainable Economic Development: Force of Digital Economy. Sustainability, 17(8), 3667. https://doi.org/10.3390/su17083667