3. Data and Methodology
This study analyzes the impact of the ERDF on the SDGs in EU member states during the period 2015–2023. To conduct this analysis, we compiled data from multiple official sources, ensuring a comprehensive and robust dataset. The primary sources include the European Commission’s Cohesion Data Platform [
40], which provides details on ERDF allocations and expenditures at the country level, and Eurostat [
41,
42,
43], which supplies indicators tracking progress toward SDGs.
To capture the heterogeneity of EU member states, we categorized them into two groups based on their Gross National Income (GNI) per capita relative to the EU average. Cluster A consists of 15 less developed member states with a GNI per capita below 90% of the EU average (Bulgaria, Croatia, Cyprus, Czech Republic, Estonia, Greece, Hungary, Latvia, Lithuania, Malta, Poland, Portugal, Romania, Slovakia, and Slovenia), while Cluster B includes 12 more developed member states exceeding this threshold (Austria, Belgium, Denmark, Finland, France, Germany, Ireland, Italy, Luxembourg, the Netherlands, Spain, and Sweden). This classification allowed for a comparative assessment of how ERDF funding influences SDGs progress in different economic contexts.
The dependent variables in this study are indicators representing the 17 SDGs, as reported by Eurostat and aligned with the UN 2030 Agenda. These indicators measure progress in various dimensions, including poverty reduction, economic growth, clean energy transition, social inclusion, and environmental sustainability. The primary independent variable is the total ERDF funds disbursed per member state over this study’s period.
To ensure the validity of our results and account for external factors influencing SDGs progress, we incorporated a set of control variables beyond ERDF funding. These control variables capture economic, institutional, and structural characteristics that may affect sustainable development. Specifically, we included Gross Domestic Product (GDP) per capita [
44] as a proxy for economic development, the unemployment rate to reflect labor market conditions [
38], and the government effectiveness index to account for institutional quality in fund allocation and policy implementation [
39].
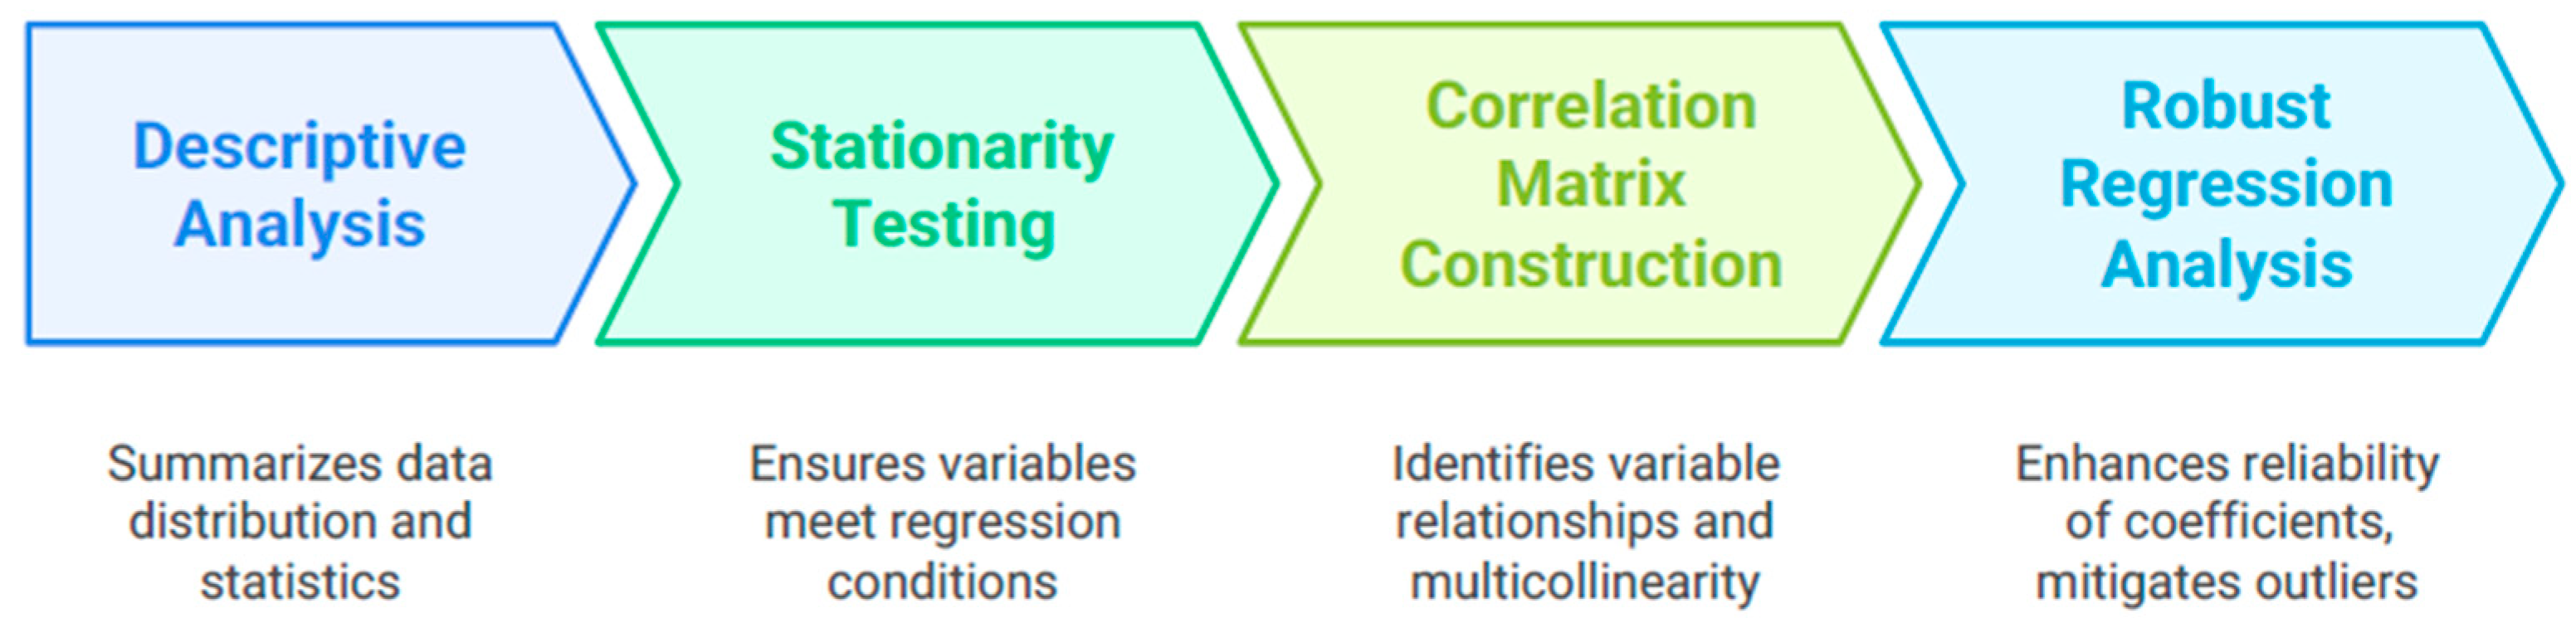
The methodological framework followed four key stages: (1) descriptive analysis, which summarized the data distribution and key statistical characteristics of each variable; (2) stationarity testing, which applyied the Im, Pesaran, and Shin (IPS) test and the Levin, Lin, and Chu (LLC) test to ensure that variables met the necessary conditions for regression modeling; (3) correlation matrix construction, which identifyied relationships between variables and assessed potential multicollinearity issues; and (4) robust regression analysis, which employed the M-estimator method to enhance the reliability of the estimated coefficients while mitigating the impact of outliers (
Figure 1).
Descriptive statistics provided the initial basis for this empirical study by offering comprehensive insights into the dataset. Key indicators, such as the mean, median, standard deviation, and range (minimum and maximum values), were computed to summarize the core attributes of the variables, facilitating an understanding of data variability and distribution [
45]. For instance, standard deviation revealed the degree of data dispersion from the mean, while the coefficient of variation measured the data’s uniformity. Visual tools, like histograms and boxplots, further enriched the analysis by identifying outliers or anomalies that could potentially impact subsequent analyses. This preliminary examination was essential for identifying potential data issues, such as skewness or extreme values, which could distort statistical estimates in later stages [
46].
Stationarity is a prerequisite for analyzing panel time-series data, as it helps to prevent spurious results and ensures the derivation of meaningful estimates [
46]. To verify stationarity, tests like the IPS [
47] and LLC [
47] were applied. The IPS test accounts for heterogeneity across panel series and uses an individual ADF (Augmented Dickey–Fuller) test for each series, making it suitable for heterogeneous data with high sensitivity. Conversely, the LLC test assumes homogeneity of autoregressive coefficients and is more applicable to homogeneous panels. These tests ascertain whether variables exhibit stationarity at their original levels or require differencing, which is a critical step before applying econometric models dependent on this property. Ignoring stationarity may lead to invalid results and misleading interpretations of variable relationships.
Potential multicollinearity was assessed through a preliminary correlation matrix, which enabled the identification of variables with strong intercorrelations. To address this, variables with high pairwise correlations were either excluded or carefully selected to avoid redundancy in the regression models. This step ensured that multicollinearity did not distort the robustness or interpretability of the regression coefficients. The correlation matrix evaluated the linear associations between model variables, employing Pearson’s correlation coefficient to measure the direction and strength of these relationships [
47]. This step served dual purposes: identifying significant correlations to support research hypothesis formulation and detecting multicollinearity issues that could compromise regression estimates’ reliability. By scrutinizing the correlation matrix, researchers ensured that independent variables were not overly correlated, mitigating the risk of misinterpreting regression coefficients.
In the final stage, robust regression was conducted using the M estimator to address the impact of outliers and anomalous data points [
47]. Unlike ordinary least squares regression, which minimizes squared residuals, robust regression minimizes a more adaptable loss function, denoted as
(
u), thereby limiting the influence of extreme residuals. This method is particularly effective for datasets with deviations from normality or issues such as heteroscedasticity [
47]. The M estimator assigns weights to observations based on their residual size, reducing the influence of outliers and yielding a model that is more resilient to data irregularities. This approach ensures more reliable coefficient estimates, enhancing the robustness of the regression analysis. The basic model starts from the linear regression equation for panel data:
where
yi is the dependent variable,
xi are the independent variables (predictors),
βn are the coefficients associated with the predictors, and
εi is the standard error.
In robust regression with M estimator, the
βn coefficients are estimated by minimizing the weighted sum of a robust function of the residuals:
where
ri is the residual for observation
i, σ is a robust estimate of the scale of the residuals, and
(u) is a robust loss function, which penalizes large residuals less than the quadratic function (in our study we opted for the Huber function).
Estimating β involves solving the score equations, obtained by deriving the objective function with respect to β:
where
ψ(u) is the influence function associated with
(u).The estimation algorithm for robust regression utilizing the M estimator employs an iterative process designed to minimize the impact of outliers and large residuals on the model coefficients. The procedure unfolds in several key steps. Initially, an estimate of the model coefficients (β) is calculated, often using classical approaches, such as ordinary least squares regression, or preliminary robust techniques, like weighted means or medians. This initial estimate serves as the foundation for subsequent iterations. During each iteration, residuals are computed by determining the differences between the observed values (yi) and those predicted by the model. These residuals indicate the degree to which the model aligns with the data.
To mitigate the influence of extreme observations, weights are assigned to each data point based on the size of their residuals. Observations with larger residuals receive lower weights, while those with smaller residuals are assigned higher weights, effectively diminishing the impact of outliers. A weighted regression is then performed, producing updated coefficient estimates (β) that reflect the adjusted influence of extreme values. Following this, a measure of residual scale, such as the median absolute deviation, is recalculated to refine the determination of what constitutes a “large” residual. These steps—calculating residuals, assigning weights, updating coefficients, and reevaluating residual scale—are repeated until the coefficient changes stabilize, indicating convergence and a robust, stable model.
This iterative process culminates in coefficient estimates that are less sensitive to data anomalies, ensuring a more accurate representation of the underlying relationships. The algorithm strikes a balance between achieving a good model fit and safeguarding against distortions caused by problematic data points, yielding reliable and robust results.
Within this framework, robust regression plays a vital role in investigating causal relationships by providing robust coefficient estimates, statistical significance levels, and measures of model fit. This approach ensures that findings are not only reliable but also generalizable, thereby strengthening the overall validity of this study’s conclusions. It is important to note that the present study does not claim strict causality between ERDF allocations and SDGs progress. The relationships explored are associative in nature and are interpreted with caution. While robust regression methods and control variables are employed to mitigate bias and enhance validity, the results should be viewed as indicative of patterns rather than definitive causal mechanisms.
4. Results
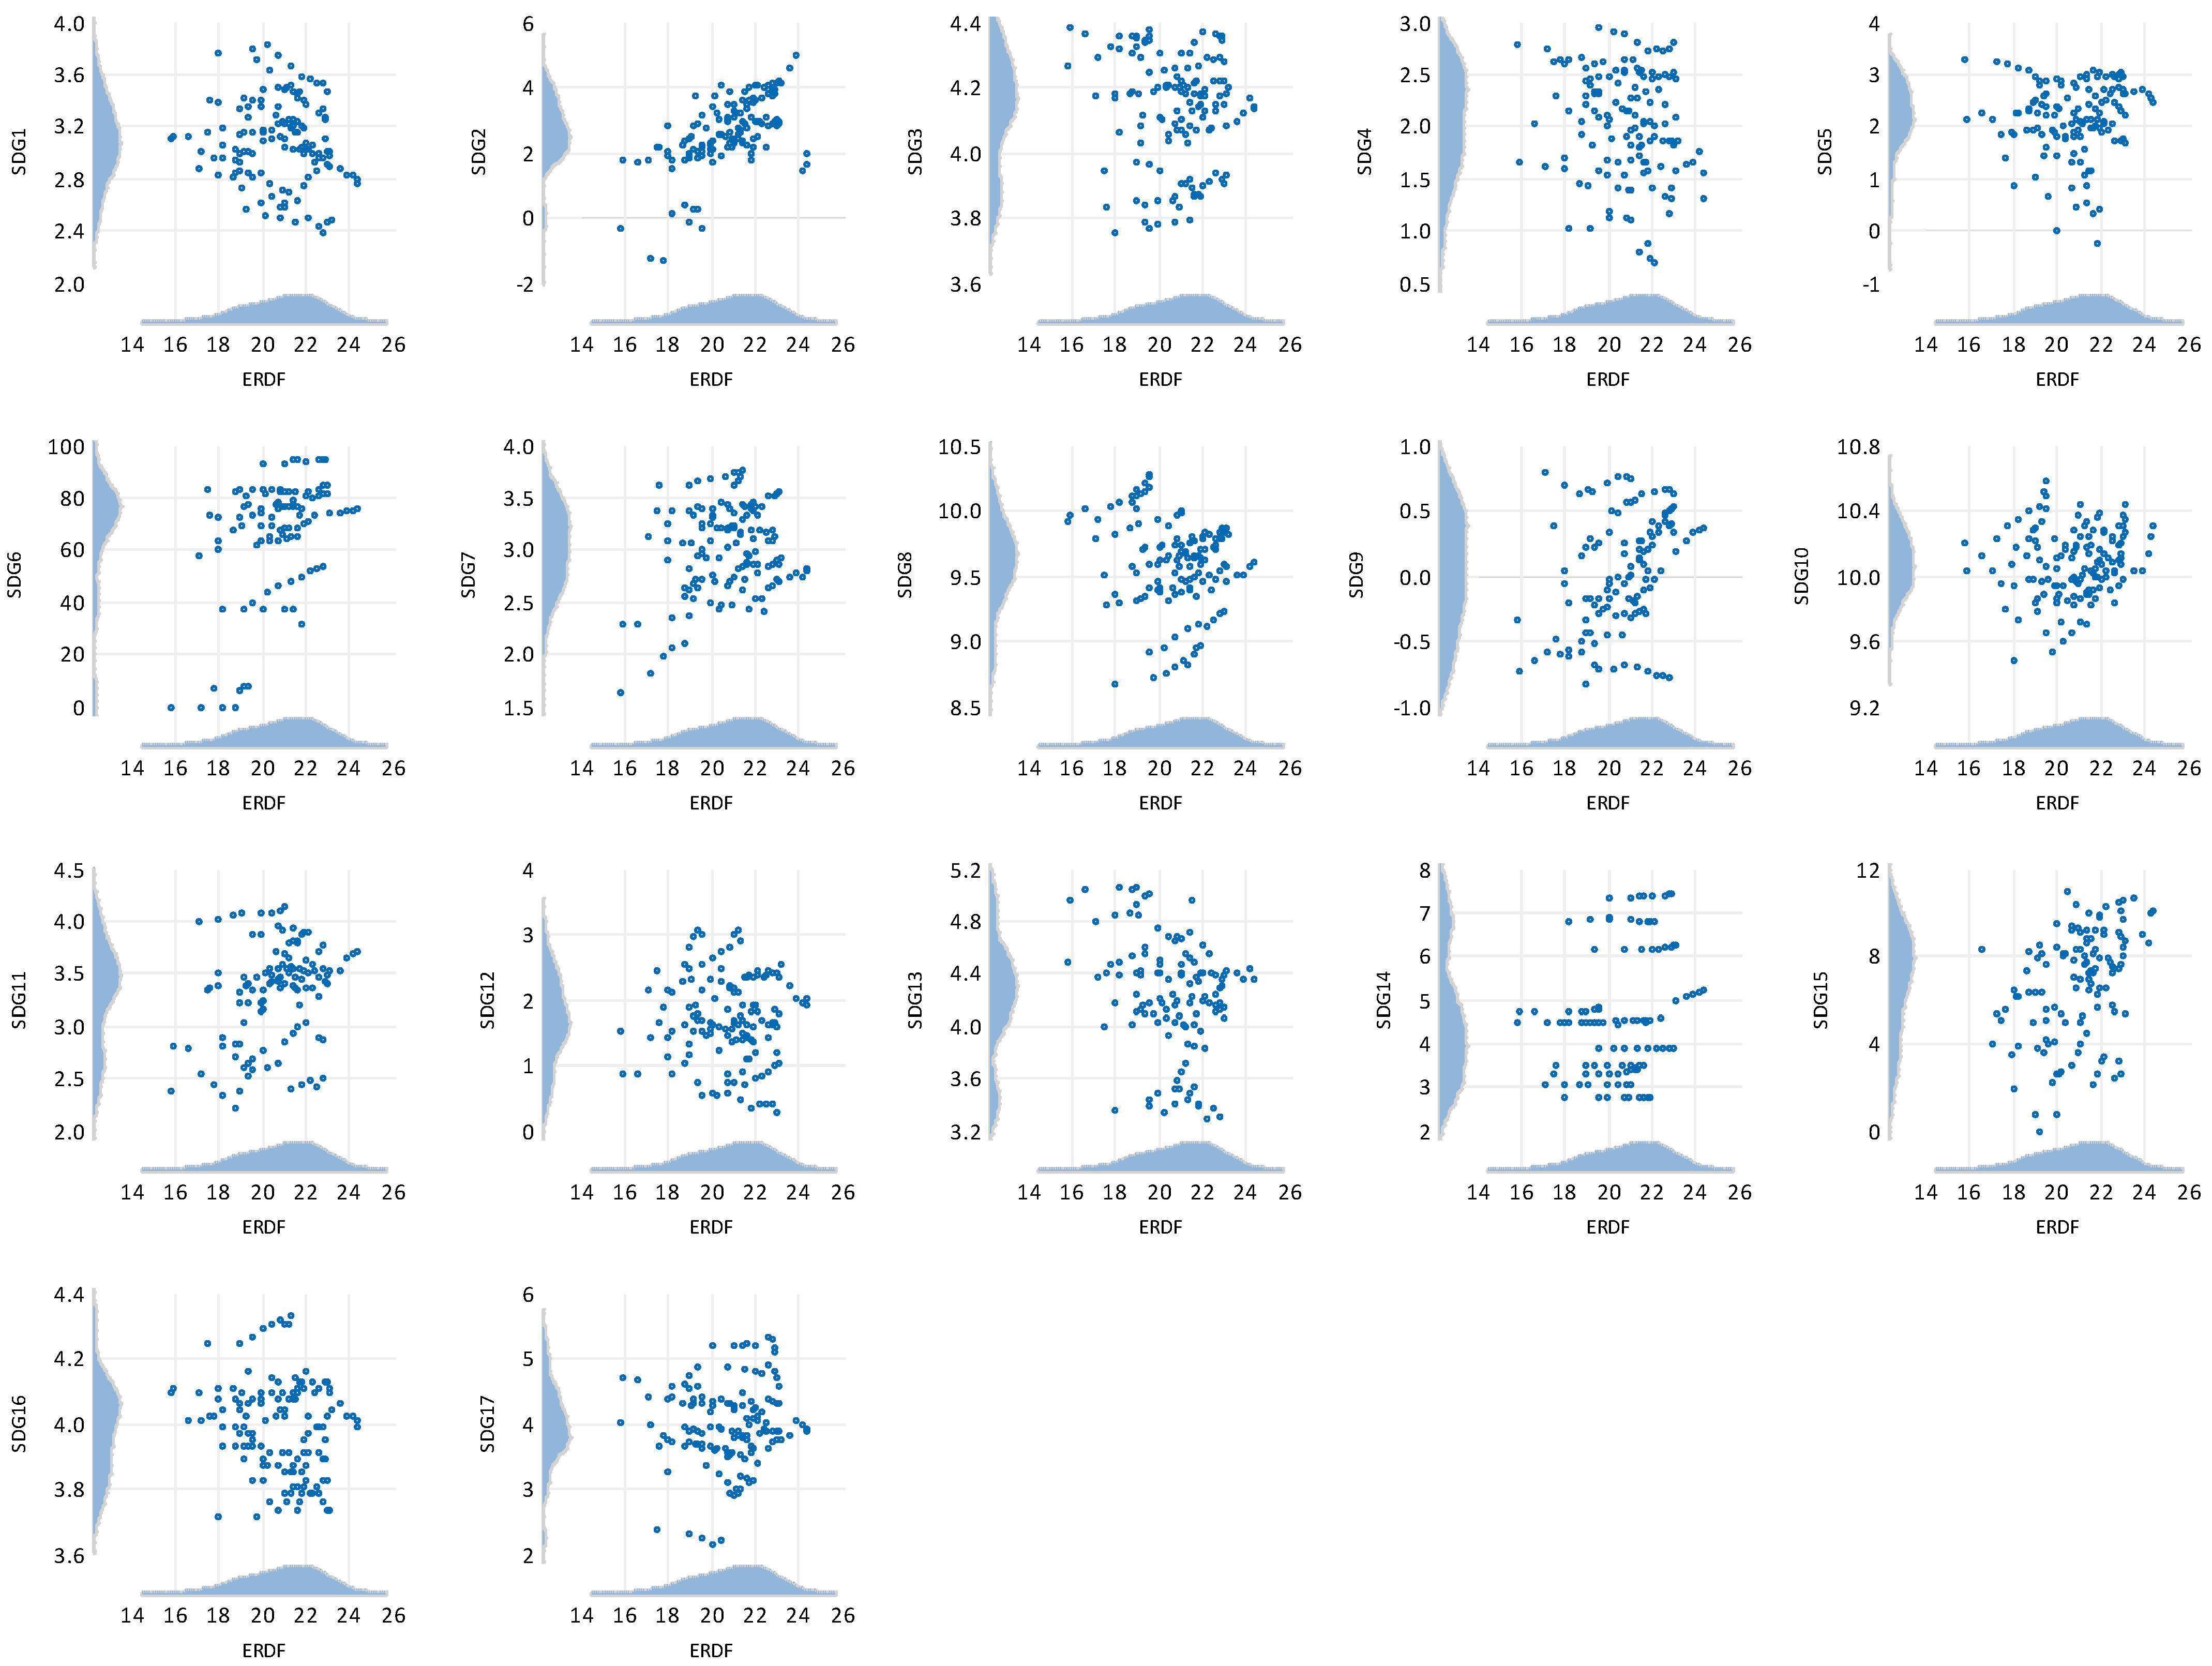
To enhance the interpretability of the empirical results and to respond to previous reviewer feedback,
Figure 2 presents a series of scatter plots illustrating the relationship between ERDF allocations and the 17 Sustainable Development Goals (SDGs) for Cluster A—comprising less developed EU member states. These visualizations aim to provide an intuitive perspective of how regional funding may influence or correlate with the progress in various sustainability dimensions, offering a complementary lens to the quantitative results presented later in this section. To address the heterogeneity in scale and to reduce the skewness in the data distribution, all the variables—including the ERDF disbursements and SDG indicators—were normalized using a natural logarithm transformation. As a result, the reported values no longer reflect absolute amounts (e.g., euro values or percentages), but represent the log-transformed scale of variation across the countries and time. For instance, a log-transformed ERDF value of 14 indicates a relatively low funding level, while a value of 26 corresponds to a higher allocation within the dataset. Similarly, the SDG scores reflect relative performance rather than original indicator units. This transformation improves the statistical properties of the data and ensures comparability across variables with differing original units.
The graphs highlight a notable heterogeneity in the strength and direction of the associations between ERDF funding levels and SDG indicators. Certain goals—such as SDG14 (Life Below Water) and SDG15 (Life on Land)—display a visibly positive association with ERDF allocations, suggesting that increased funding may contribute to improved outcomes in environmental conservation and biodiversity protection. These patterns are consistent with the statistically significant coefficients identified by the robust regression models, thus reinforcing the credibility of the analytical framework.
Conversely, for goals such as SDG11 (Sustainable Cities and Communities), the scatter plot reveals a less coherent or even negative trend, indicating that higher ERDF allocations do not necessarily translate into improved urban sustainability outcomes. This observation aligns with the regression results indicating a significant but negative coefficient, possibly attributable to structural barriers to project implementation, governance inefficiencies, or the lack of integrated urban strategies in less developed regions.
Furthermore, the graphical representation underscores the presence of nonlinear relationships and data dispersion, particularly for SDGs such as SDG2 (Zero Hunger), SDG5 (Gender Equality), and SDG6 (Clean Water and Sanitation). These irregular patterns further justify the application of robust regression techniques, which are designed to mitigate the influence of outliers and improve the stability of the coefficient estimates.
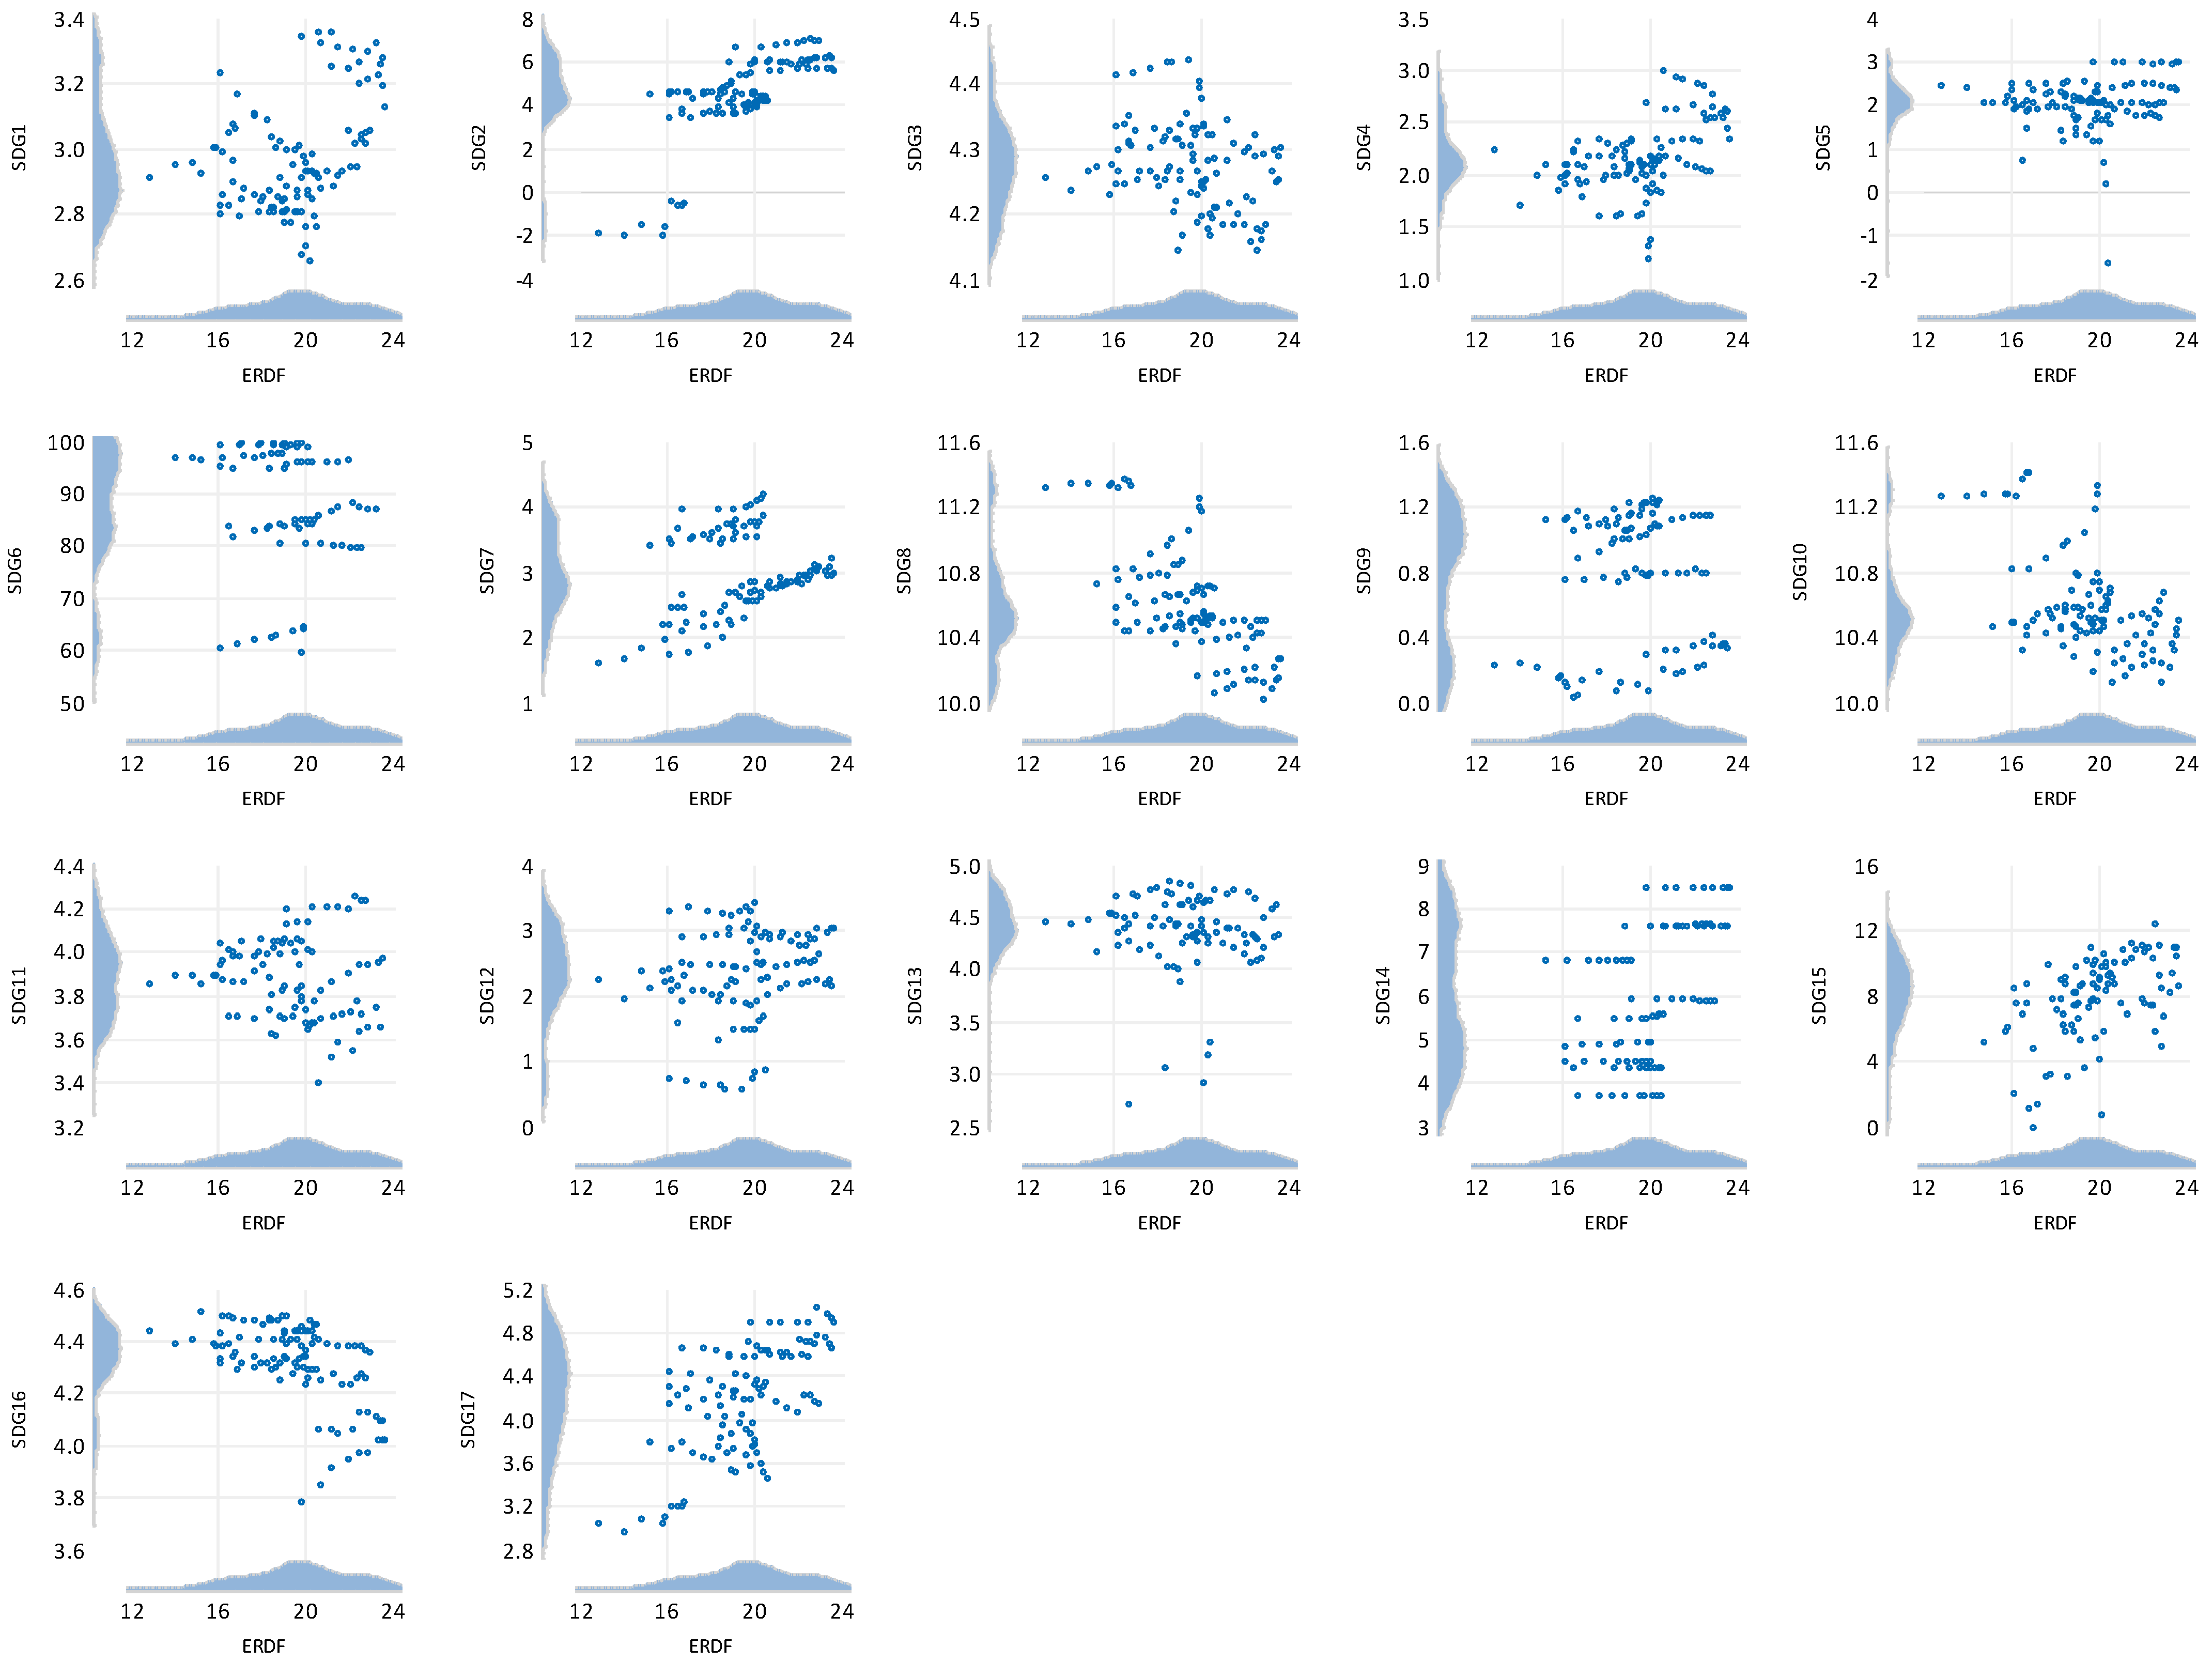
Building upon the graphical analysis for Cluster A,
Figure 3 provides a parallel visualization of the relationship between ERDF allocations and the 17 Sustainable Development Goals (SDGs) for Cluster B, which includes the more developed EU member states. These scatter plots serve not only as a comparative framework but also as a means of exploring the differentiated impacts of regional development funding in distinct socio-economic contexts.
The visual trends observed for Cluster B differ markedly from those for Cluster A, suggesting that the influence of ERDF funding is shaped by the structural maturity and absorptive capacities of these regions. Notably, goals such as SDG4 (Quality Education), SDG7 (Affordable and Clean Energy), and SDG9 (Industry, Innovation, and Infrastructure) display stronger and more consistent positive associations with ERDF allocations. These findings visually reinforce the regression results that identified statistically significant relationships between the ERDF and these SDGs, particularly in areas tied to technological development, energy transition, and innovation ecosystems.
Moreover, SDG1 (No Poverty) and SDG2 (Zero Hunger) also reveal positive linear trends in relation to ERDF funding, albeit with some dispersion. This may reflect the capacity of developed regions to more effectively translate regional investment into targeted social outcomes, especially when combined with national welfare and educational frameworks.
However, similar to Cluster A, SDG11 (Sustainable Cities and Communities) and SDG12 (Responsible Consumption and Production) exhibit weaker or even negative patterns, suggesting persistent challenges in aligning urban and environmental goals with ERDF-supported projects, even in more advanced economies. These inconsistencies underscore the complexity of sustainability transitions in urban contexts and the potential for trade-offs between economic growth, infrastructure expansion, and environmental responsibility. In addition, the more compact and linear distributions in several of the plots highlight the greater homogeneity among the developed regions, both in terms of funding levels and performance across the SDGs. This contrasts with the higher variability observed in Cluster A, and may reflect the more standardized governance and administrative frameworks in these regions, which can enhance project implementation and policy coherence.
Table 1 and
Table 2 provide the descriptive statistics for Cluster A (less developed EU member states) and Cluster B (more developed EU member states), respectively, offering a first layer of analysis to understand the distribution and variation in both the Sustainable Development Goals (SDGs) indicators and ERDF allocations across the European Union. These tables are essential for providing a clear understanding of the dataset’s characteristics, particularly in terms of data centralization, variability, and the nature of potential outliers.
The mean values presented in the tables serve as initial points of comparison between the two clusters, revealing important differences in both the ERDF allocations and SDGs performance. For example, Cluster B, which consists of economically advanced countries, generally shows higher mean scores for SDG indicators like SDG7 (Affordable and Clean Energy) and SDG9 (Industry, Innovation, and Infrastructure) compared to Cluster A. This suggests that more developed countries may be benefitting from advanced infrastructure and technology, potentially facilitated by previous ERDF investments. Conversely, Cluster A exhibits lower means for several SDGs, particularly SDG1 (No Poverty) and SDG3 (Good Health and Well-being), highlighting the greater socio-economic challenges in these regions, which may require more targeted interventions.
Beyond the central tendency of the data, these tables also illustrate the distributional properties of the variables. The skewness values for both clusters provide an indication of the symmetry of the data distribution. For instance, the negative skewness for several SDGs in Cluster A (e.g., SDG6—Clean Water and Sanitation) suggests that, while the majority of the data points are concentrated around the mean, there are some regions that significantly lag behind the average performance in terms of SDGs progress. In contrast, Cluster B tends to exhibit less skewness, reflecting a more uniform development across regions.
The kurtosis values in the tables offer insights into the tailedness of the distributions—a higher kurtosis suggests that the data points are more concentrated around the mean, with a few extreme outliers. The kurtosis values in both clusters, approaching three, suggest a normal-like distribution, though certain SDGs, such as SDG11 (Sustainable Cities and Communities) in Cluster A, show substantial deviations, as reflected by the significant negative kurtosis. This might indicate that while most of the data points are clustered around the mean, a few regions may be performing exceptionally well or poorly relative to the average.
The presence of outliers is also an important consideration when interpreting these tables. In Cluster A, certain SDG indicators, such as SDG15 (Life on Land) and SDG6, reveal pronounced variability, with some countries displaying significantly higher or lower SDG scores than the majority of the other nations. These outliers could suggest that exceptionally high or low ERDF allocations or context-specific policy actions in these regions have had an outsized impact on SDGs progress, either positively or negatively.
The comparative presentation of these descriptive statistics serves as a foundation for understanding the heterogeneity of SDGs performance and the distribution of ERDF funding across diverse economic and political contexts. The clear identification of disparities, particularly between the clusters, supports the empirical hypothesis that funding impacts SDGs outcomes differently across regions. This variability in the SDGs performance underscores the need for tailored strategies for ERDF allocation—strategies that take into account not only the amount of funding but also the unique socio-economic, political, and institutional conditions of each region.
The correlation matrix for Cluster A (
Table S1) reveals the relationships between the European Regional Development Fund (ERDF) and the 17 Sustainable Development Goals (SDGs), providing valuable insights into the synergies and potential trade-offs among these priorities. The matrix highlights both the strength and direction of the correlations, with the p-values indicating the statistical significance of these relationships.
The ERDF demonstrates notable positive correlations with a few SDGs, particularly SDG2 (Zero Hunger, 0.56, p < 0.01) and SDG6 (Clean Water and Sanitation, 0.27, p = 0.02). These findings suggest that regional development funding may significantly contribute to achieving these specific goals. However, the correlations between the ERDF and other SDGs appear weak or negligible, indicating that its influence may not be evenly distributed across all the SDGs.
Several strong positive correlations among the SDGs highlight areas of synergy. For instance, SDG5 (Gender Equality) and SDG3 (Good Health and Well-being) exhibit a particularly high correlation (0.84, p < 0.01), suggesting that progress in gender equality strongly complements improvements in health outcomes. Similarly, SDG9 (Industry, Innovation, and Infrastructure) correlates positively with SDG6 (0.39, p < 0.01), reflecting potential mutual benefits between sustainable water management and industrial innovation. Another noteworthy synergy exists between SDG14 (Life Below Water) and SDG5 (0.63, p < 0.01), emphasizing how gender equality efforts may also enhance marine conservation efforts.
Conversely, notable negative correlations among certain SDGs highlight the potential trade-offs or conflicting priorities. For instance, SDG1 (No Poverty) and SDG8 (Decent Work and Economic Growth) demonstrate a strong inverse relationship (−0.73, p < 0.01), indicating that initiatives aimed at fostering economic growth may not always align seamlessly with poverty alleviation efforts. Similarly, a tension is evident between SDG4 (Quality Education) and SDG7 (Affordable and Clean Energy), reflected by the negative correlation of −0.57 (p < 0.01), suggesting that expanding access to education and clean energy may require competing resource allocations. Furthermore, the relationship between SDG16 (Peace, Justice, and Strong Institutions) and SDG14 (Life Below Water), with a correlation of −0.54 (p < 0.01), underscores the challenges of harmonizing governance improvements with marine conservation efforts.
The findings also reveal patterns of interconnected SDGs that form clusters of mutual influence. For example, SDG6 (Clean Water and Sanitation), SDG7 (Affordable and Clean Energy), and SDG9 (Industry, Innovation, and Infrastructure) emerge as closely interrelated, reflecting their synergistic potential. This cluster points to the interconnectedness of sustainable water management, energy access, and industrial development, all of which are vital for holistic progress.
The correlation matrix for Cluster B (
Table S2) highlights both areas of synergy and potential trade-offs, shedding light on how funding priorities align with broader sustainability objectives. The ERDF exhibits moderate positive correlations with SDG2 (Zero Hunger, 0.62,
p < 0.01), SDG1 (No Poverty, 0.47,
p < 0.01), and SDG4 (Quality Education, 0.45,
p < 0.01). These correlations suggest that ERDF funding plays a significant role in alleviating poverty, reducing hunger, and improving educational access. Additionally, its strong correlation with SDG17 (Partnerships for the Goals, 0.58,
p < 0.01) underscores the importance of collaborative efforts in amplifying the fund’s impact. However, a notable negative correlation with SDG16 (Peace, Justice, and Strong Institutions, −0.57,
p < 0.01) indicates a potential misalignment between regional development funding and institutional strengthening, highlighting a critical area for policy consideration.
The matrix reveals strong positive correlations among certain SDGs, emphasizing their interconnected nature. For instance, the relationship between SDG1 (No Poverty) and SDG4 (Quality Education, 0.66, p < 0.01) underscores how poverty reduction efforts and improvements in education can mutually reinforce one another. Similarly, the strong correlation between SDG2 (Zero Hunger) and SDG14 (Life Below Water, 0.64, p < 0.01) highlights the potential for sustainable agricultural and marine conservation practices to drive progress in both areas. Another important synergy is observed between SDG9 (Industry, Innovation, and Infrastructure) and SDG8 (Decent Work and Economic Growth, 0.68, p < 0.01), reflecting the role of innovation in promoting inclusive economic development.
Despite these synergies, the matrix also highlights significant trade-offs between some SDGs, posing challenges for integrated development strategies. For example, SDG8 (Decent Work and Economic Growth) shows a strong negative correlation with SDG4 (−0.77, p < 0.01), suggesting potential conflicts between prioritizing economic growth and investing in quality education. Similarly, SDG7 (Affordable and Clean Energy) is negatively correlated with SDG5 (Gender Equality, −0.68, p < 0.01), indicating disparities between clean energy initiatives and gender equality efforts. Another key trade-off is seen between SDG13 (Climate Action) and SDG9 (−0.54, p < 0.01), reflecting the complexities of balancing technological advancements with environmental sustainability.
The analysis also highlights clusters of SDGs that exhibit interconnected relationships, revealing shared pathways for progress. Environmental goals, such as SDG6 (Clean Water and Sanitation), SDG13 (Climate Action), and SDG14 (Life Below Water), are closely linked, indicating that advancements in one area may influence progress in others. Similarly, economic and social goals, such as SDG8 (Decent Work and Economic Growth) and SDG10 (Reduced Inequalities) demonstrate interdependence, as economic growth can align with efforts to address inequality when effectively managed.
The results presented in
Table 3 reflect the influence of the European Regional Development Fund (ERDF) on the Sustainable Development Goals (SDGs) in the less developed member states of the European Union (Cluster A). The robust regression analysis highlights significant relationships between the included variables, emphasizing both the positive effects and potential constraints in the utilization of funds to achieve sustainability goals. A positive coefficient of 0.1626 for the relationship between the ERDF and SDG1 (No Poverty), with a significance level of
p = 0.0856, suggests that ERDF funds contribute to poverty reduction in less developed regions. However, the magnitude of the effect is relatively small, indicating that while regional investments have a positive contribution, they are not strong enough to generate major economic transformations in these areas. This positive and significant correlation suggests that ERDF funding supports economic and infrastructural development in less developed regions, which can contribute to poverty reduction, an observation that aligns with the conclusions of Medeiros and Rauhut [
39].
The ERDF provides support for investments in key areas, such as job creation, the improvement of local infrastructure, increased access to education and vocational training, as well as the development of social services and affordable housing. These types of investments help stimulate the local economy, creating new opportunities for disadvantaged communities and contributing to the reduction in economic vulnerability.
Although the ERDF has a beneficial association with poverty reduction, the coefficient of 0.1626 suggests a moderate effect, which can be explained by several factors. First, poverty is a multidimensional issue that cannot be addressed solely through economic and infrastructural investments. While local infrastructure development can improve access to economic opportunities, poverty is also influenced by other factors, such as access to education, poor health conditions, or social exclusion. Thus, the impact of the ERDF is limited if it is not complemented by additional measures, such as direct support for the economic inclusion of vulnerable groups.
Another factor explaining this moderate relationship is the differentiated influence of the ERDF in the short and long term. ERDF funds are designed to support sustainable economic development, which means their effects on poverty reduction may become visible in the long run through the creation of a more stable economic environment. However, in the absence of immediate social protection measures or direct incentives to increase the income of poor households, the effects of the ERDF may be less noticeable in the early years of implementation. Furthermore, the limited administrative capacity of less developed regions can also influence the impact of the ERDF on poverty reduction. In many of these regions, the absorption of European funds is hindered by bureaucratic challenges, a lack of technical expertise, and difficulties in project implementation. These constraints can lead to delays in fund utilization, poor-quality projects, or even the loss of funding opportunities. Additionally, the lack of an integrated strategy between the ERDF and other social policies, such as those funded through the European Social Fund (ESF), may limit the effectiveness of poverty reduction interventions.
Thus, while the ERDF plays an essential role in fostering economic development in less developed regions, its influence on poverty reduction remains constrained by various administrative, structural, and socio-economic factors. For a more effective reduction in poverty, it is crucial to improve fund management efficiency, align the ERDF with social protection policies, and ensure better coordination with other financial instruments aimed at enhancing social inclusion and reducing regional disparities.
Another important aspect is that the ERDF has a significant positive influence on SDG14 (Life Below Water), with a coefficient of 1.855 and a significance level of p < 0.01, indicating a strong correlation between European fund allocations and the improvement of aquatic ecosystem conditions. This relationship suggests that ERDF investments directly contribute to marine biodiversity conservation by funding projects aimed at protecting coastal and marine habitats, reducing water pollution, and promoting sustainable fishing practices. Such initiatives are essential for combating the degradation of marine ecosystems, which is driven by intensive economic activities, pollution, and climate change. Furthermore, this positive correlation reflects the commitment of regional policies to support European strategies for marine environmental protection, including the implementation of the Marine Strategy Framework Directive and the objectives established by the European Green Deal.
The ERDF plays a crucial role in supporting innovative projects, such as the creation of Marine Protected Areas (MPAs), the restoration of coastal habitats, and the development of water quality monitoring technologies. By supporting such initiatives, European funds facilitate both the protection of marine biodiversity and the development of sustainable economic models, such as the blue economy, which integrates economic growth with the protection of aquatic environments. Moreover, the ERDF can contribute to fostering partnerships between EU member states for the implementation of joint strategies for marine resource management, considering that marine environmental issues are often transboundary and require coordinated European-level actions.
In addition to the ERDF’s significant influence on marine ecosystems, the analysis also reveals its positive correlation with SDG15 (Life on Land), with a coefficient of 1.471 and a significance level of
p = 0.076, indicating the potential influence of the ERDF on biodiversity conservation and sustainable land management. This relationship suggests that ERDF funding supports reforestation measures, the conservation of natural habitats, and a reduction in human activity’s impact on terrestrial ecosystems, a finding that is confirmed by previous studies, such as the one conducted by Dax and Copus [
37]. Funded projects may include the restoration of degraded forests, the protection of land from desertification, and the promotion of sustainable agriculture, all of which are essential for maintaining ecological balance and preventing biodiversity loss.
Additionally, the ERDF facilitates the adoption of sustainable land management practices, such as the use of eco-friendly technologies in agriculture, the protection of wetlands, and a reduction in illegal deforestation. These measures contribute not only to the protection of flora and fauna but also to the improvement of soil quality and freshwater resources, having a long-term positive influence on food security and ecosystem resilience. Furthermore, the conservation and rehabilitation of terrestrial ecosystems are directly linked to climate change mitigation efforts, as forests and other natural habitats act as carbon sinks, helping reduce CO2 concentrations in the atmosphere.
The negative and significant association between the ERDF and SDG11 (Sustainable Cities and Communities), highlighted by a coefficient of −0.047 with a significance level of
p < 0.01, suggests that the allocated funds do not generally contribute to sustainable improvements in urban infrastructure. This finding is consistent with the outcomes of the study by Tulumello et al. [
35], which identified uneven development and increased urban pressures in Southern Europe due to ERDF investments, undermining sustainable urban goals. Furthermore, our results align with the ideas of Weckroth and Moisio [
36], who emphasized that ERDF funding can lead to unintended environmental degradation, such as elevated emissions and loss of green spaces, further complicating the achievement of SDG11. This underscores the need to reconsider funding allocation mechanisms, enhance local governance structures, and address implementation challenges at regional and local levels to mitigate these negative effects.
One explanation for this negative effect is the limited administrative capacity of less developed regions for managing and implementing complex urban infrastructure projects. In these regions, local administrations often face a lack of technical expertise, deficiencies in urban planning, and difficulties in accessing and absorbing European funds. These obstacles can lead to delays in project implementation, inefficient resource allocation, and even the abandonment of essential initiatives for sustainable urban development. Additionally, excessive bureaucracy, combined with a lack of coordination between central and local authorities, may contribute to the suboptimal use of ERDF funds.
Another essential factor explaining this result is the lack of an integrated vision for urban development. Although the ERDF provides financial support for infrastructure modernization, the effectiveness of these investments depends on the existence of coherent strategies adapted to the needs of each city. In many cases, the funded projects are not part of a long-term sustainable urban policy but are carried out as isolated actions, without adequate coordination between the different dimensions of urban development, such as public transport, energy efficiency of buildings, green spaces, and climate change adaptation. As a result, ERDF funds might be directed toward initiatives that do not generate a substantial impact on urban quality of life.
Additionally, the results suggest that ERDF funds fail to effectively support cities in increasing their resilience to climate change, a crucial aspect of achieving SDG11. Despite the availability of financial resources, many cities in less developed regions do not implement adequate measures to combat air pollution, reduce greenhouse gas emissions, or efficiently manage waste. For example, the lack of modern infrastructure for sustainable public transport, a high dependence on fossil fuels, and uncontrolled urban expansion contribute to worsening environmental problems in these regions. In this context, the negative influence of the ERDF on SDG11 may reflect inefficiencies in implementing sustainable urban mobility solutions or climate risk adaptation measures, such as flood prevention or heatwave mitigation. Another possible explanation for this negative relationship is the unequal distribution of funds between more developed and less developed regions. While cities in economically advanced regions benefit from a stronger institutional framework and highly skilled human resources, less developed regions face difficulties in attracting private investments to complement European funds. Consequently, the lack of public–private partnerships may limit the impact of ERDF funds on sustainable urban development.
To correct these deficiencies, it is essential that urban development policies financed through the ERDF are better aligned with the real needs of local communities and supported by additional measures to strengthen administrative capacity. A more effective strategy could include simplifying administrative procedures, supporting local authorities in developing integrated urban planning strategies, and strengthening monitoring and evaluation mechanisms for implemented projects. Additionally, the greater involvement of civil society and local stakeholders in decision-making processes could contribute to a more efficient and transparent use of ERDF resources.
Regarding SDG6 (Clean Water and Sanitation), the positive coefficient of 8.092 suggests a positive correlation between ERDF investments and improved access to water resources and sanitation services. However, the p-value of 0.101 indicates that the relationship is not statistically significant, suggesting that while there is a positive trend, the association is not robust enough to be considered generalizable. This result may be influenced by regional disparities in fund absorption and the lack of institutional capacity necessary for the effective implementation of infrastructure projects.
The remaining relationships between ERDF investments and other SDGs do not exhibit statistical significance, indicating that the influence of ERDF funding on these sustainability goals is either weak or inconsistent across regions. The lack of significant correlations suggests that, while the ERDF may contribute to broader economic and social development, its direct influence on specific SDG targets is not sufficiently strong to yield measurable effects within the analyzed period. This could be attributed to various factors, including differences in regional priorities, variations in fund allocation efficiency, and challenges in project implementation. Additionally, the complexity of sustainable development processes often requires complementary policies and long-term investments, which may dilute the immediate impact of ERDF funding on individual SDGs.
The results presented in
Table 4 reflect the association between the ERDF and the Sustainable Development Goals (SDGs) in more developed EU member states (Cluster B). One of the most notable findings is the positive and significant influence of the ERDF on SDG9 (Industry, Innovation, and Infrastructure), with a coefficient of 2.315 and a
p-value < 0.05. This result suggests that ERDF funding plays a crucial role in enhancing industrial development, fostering innovation, and improving infrastructure in more developed EU regions. These funds likely support technology adoption, research and development (R&D) activities, and investments in transport and digital infrastructure, which are essential for sustaining economic growth and industrial competitiveness. Given that developed regions already have a strong technological ecosystem and a higher absorptive capacity for technology and investment, the significant relationship between the ERDF and SDG9 underscores the effectiveness of these funds for driving economic transformation. This observation is supported by the findings of Cavalli et al. [
48] who, in their analysis of the European Cohesion Policy in Sardinia, demonstrated that ERDF funding effectively contributed to SDG9 by promoting industrial modernization and sustainable infrastructure, particularly in regions with existing technological capabilities. Furthermore, the ERDF’s impact on SDG9 aligns with EU priorities for strengthening the single market and promoting innovation-driven economies through smart specialization strategies. The alignment results indicate that ERDF funds may be efficiently utilized in these regions to support digital transformation and sustainable infrastructure development, reinforcing the goal of a more competitive and knowledge-based economy.
The positive and significant coefficient of 1.762 (p < 0.10) for SDG8 (Decent Work and Economic Growth) suggests that ERDF funding contributes to employment generation and economic growth in more developed EU member states. This result implies that investments in innovation, infrastructure, and business development—key areas supported by the ERDF—have a tangible effect on labor markets and economic expansion. Given that developed regions typically exhibit lower unemployment rates and higher economic productivity, the ERDF likely plays a reinforcing role in stimulating entrepreneurship, upskilling the workforce, and fostering sustainable economic expansion. However, the moderate coefficient indicates that while the ERDF has a positive impact on economic growth, other factors, such as market dynamics, national economic policies, and global trade conditions, may exert a stronger influence on employment and GDP growth in these regions. Thus, while ERDF investments complement economic development, their contribution may not be the primary driver of growth but rather an enhancing factor within a broader economic framework.
A significant positive coefficient of 1.428 (
p = 0.07%) for SDG7 (Affordable and Clean Energy) indicates that ERDF funds support the transition to clean and affordable energy in more developed regions, as supported by the findings of Pîrvu et al. [
13], who demonstrated the effects of the Cohesion Policy for the sustainable development of the European Union. This suggests that regions with a developed energy infrastructure and stronger policy frameworks are well positioned to implement sustainable technological innovations, making ERDF funding a critical enabler of a green transition. However, the moderate coefficient suggests that while ERDF investments are beneficial, the shift to sustainable energy requires additional policy interventions, such as regulatory incentives, carbon pricing mechanisms, and private sector engagement, to fully achieve energy sustainability goals. The results reinforce the importance of aligning ERDF-funded projects with national- and EU-level climate policies to maximize impact.
The regression results indicate that the ERDF does not have a statistically significant effect on SDG4 (Quality Education). This lack of significance suggests that while the ERDF supports education-related projects, its overall influence on education systems in more developed regions may be limited. Unlike less developed regions, where ERDF investments may be more critical for improving access to education, developed regions already have stronger educational infrastructures, well-established institutions, and greater national funding sources. As a result, the ERDF may play only a marginal role in directly influencing educational outcomes in these areas. The absence of a significant relationship could also indicate that other EU funding mechanisms, such as the Erasmus+ program or the European Social Fund (ESF), are more directly responsible for educational improvements, while the ERDF primarily focuses on physical infrastructure, i.e., tangible investments, such as buildings, transport systems, or equipment; innovation; and economic development.
Another notable finding is that the relationship between the ERDF and SDG13 (Climate Action) is not statistically significant. This suggests that while ERDF funds are directed toward sustainability-related projects, including energy efficiency and climate resilience, their direct effect on climate action in developed regions may not be strong enough to be measured through this regression analysis. One possible explanation is that climate action requires a combination of financial investments, policy regulations, and behavioral changes, meaning that ERDF funding alone may not be sufficient to produce significant measurable effects. Additionally, developed regions often have multiple funding sources for climate-related initiatives, including private investments, national green policies, and EU-level programs, such as the Just Transition Fund and Horizon Europe, which could dilute the visible impact of the ERDF alone.
5. Discussion
The results presented in
Table 4 and
Figure 2 are confirmed by the study conducted by Rodríguez-Pose and Garcilazo [
34], which highlighted the negative influence of the European Regional Development Fund (ERDF) on Sustainable Development Goal 9 (Industry, Innovation, and Infrastructure) in developed European Union countries, which was attributed to administrative inefficiencies and the focus of investments in traditional infrastructure rather than advanced technologies.
The significant correlation with industrial infrastructure, energy efficiency, and economic growth, driven by smart specialization, highlights the ERDF’s effectiveness at supporting innovation-driven economies. However, given the lack of alignment with social and environmental objectives, such as education and climate change mitigation, the policy may require a more targeted approach to ensure broader sustainability goals.
To enhance the effectiveness of the ERDF in more developed regions, policymakers should consider strengthening the synergies between the ERDF and other EU programs, such as the European Social Fund (ESF) for education and workforce development, and Horizon Europe for innovation and climate research. Additionally, expanding targeted investments in sustainability projects, particularly for climate resilience, urban sustainability, and carbon reduction initiatives, would ensure that the ERDF aligns more closely with SDG13. Encouraging greater private sector involvement, particularly in clean energy and industrial innovation, could help leverage ERDF funding for maximum impact. Moreover, ensuring policy coherence between national governments and EU-level strategies would ensure that ERDF-funded projects are strategically aligned with long-term sustainability goals.
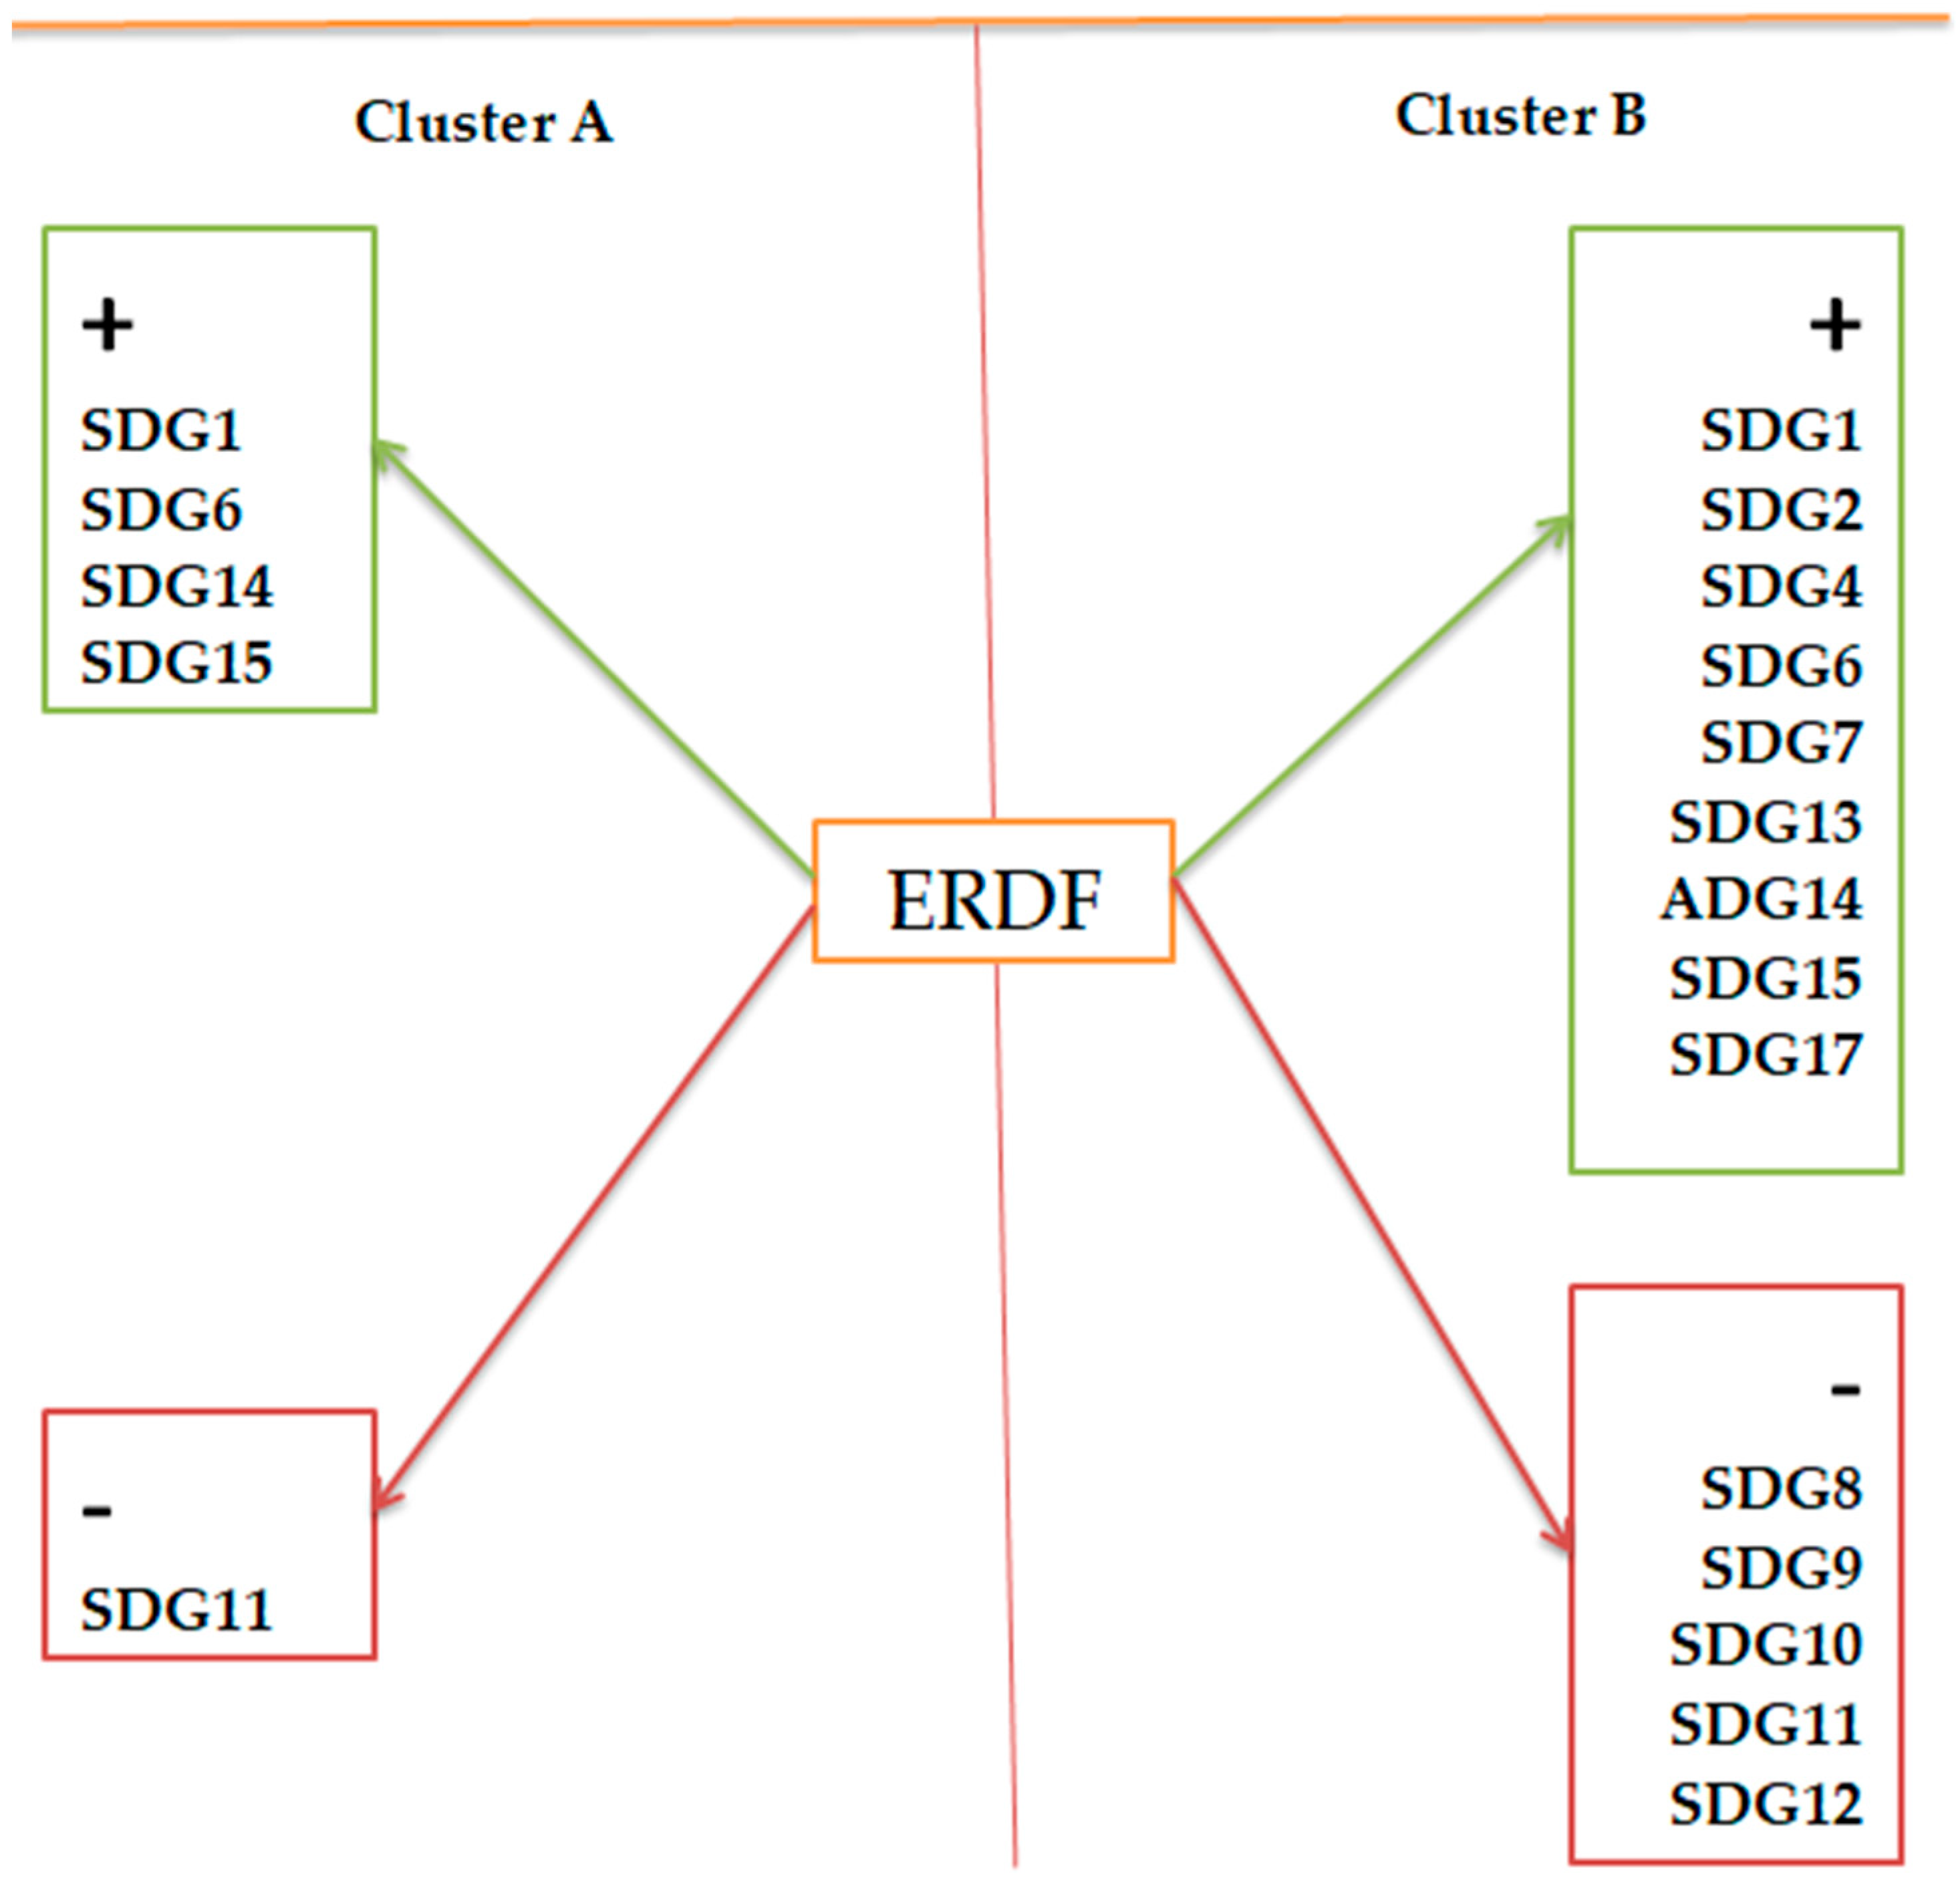
Figure 4 illustrates the differentiated associations between the ERDF and SDGs across the two clusters of EU member states. The diagram highlights the positive (+) and negative (−) associations between ERDF allocations and various SDGs within each cluster. The green arrows represent positive contributions, indicating areas where ERDF funding has a beneficial impact, while the red arrows denote negative effects, reflecting challenges or inefficiencies in fund utilization.
The figure clearly demonstrates that the influence of the ERDF varies significantly between the less developed (Cluster A) and more developed (Cluster B) regions, reflecting their structural, economic, and institutional differences. In Cluster A (less developed regions), ERDF funding positively influences SDG1 (No Poverty), SDG6 (Clean Water and Sanitation), SDG14 (Life Below Water), and SDG15 (Life on Land). This suggests that in these regions, the ERDF is effective at reducing socio-economic disparities and enhancing environmental sustainability. However, the negative association with SDG11 (Sustainable Cities and Communities) indicates that urban development projects in these regions may face implementation challenges, inefficiencies in fund allocation, or governance barriers.
Conversely, in Cluster B (more developed regions), the ERDF exhibits a broader positive association, supporting SDG1 (No Poverty), SDG2 (Zero Hunger), SDG4 (Quality Education), SDG6 (Clean Water and Sanitation), SDG7 (Affordable and Clean Energy), SDG13 (Climate Action), SDG14 (Life Below Water), SDG15 (Life on Land), and SDG17 (Partnerships for the Goals). This suggests that in economically advanced regions, the ERDF contributes more significantly to sustainability-driven development, innovation, and policy integration. However, its negative associations with SDG8 (Decent Work and Economic Growth), SDG9 (Industry, Innovation, and Infrastructure), SDG10 (Reduced Inequalities), SDG11 (Sustainable Cities and Communities), and SDG12 (Responsible Consumption and Production) highlight the challenges to ensuring that economic growth and urbanization align with sustainability principles. These results imply that even in developed regions, ERDF investments do not always translate into inclusive and environmentally conscious industrial or urban development.
Although this paper does not provide a full comparative study of national-level strategies, some indicative differences can be drawn from the existing literature. For instance, Romania and Poland have focused ERDF use on basic infrastructure and institutional capacity building [
13,
15], while Italy and Spain have increasingly aligned funding with innovation and environmental sustainability, though challenges in administrative coordination persist [
34,
35]. These differences in strategic orientation and absorptive capacity may partly explain the heterogeneous impact of the ERDF observed across the clusters, lending partial support to the premise of hypothesis H3.
While the primary objective of this study was to evaluate the contribution of the ERDF to SDGs across EU member states, it is essential to acknowledge that sustainable development outcomes are embedded within a broader and more complex landscape of financial and policy interventions. The ERDF functions as one of several instruments within the European Union’s cohesion policy architecture, and its impact is inherently interlinked with other structural and non-structural funding mechanisms [
8,
9].
Among the most prominent complementary sources is the European Social Fund, which focuses on employment, social inclusion, and education—domains that directly overlap with several SDGs, such as SDG4 (Quality Education), SDG8 (Decent Work and Economic Growth), and SDG10 (Reduced Inequalities) [
9,
39]. Furthermore, national-level public investments, funded through domestic budgets and EU-level recovery instruments (e.g., the Recovery and Resilience Facility), contribute significantly to infrastructure, innovation, and climate-related goals [
23]. Private sector investments are also playing a growing role, particularly in the areas of green technology and smart infrastructure, often mobilized through co-financing requirements linked to the ERDF and other structural funds [
24,
25].
Given this multifaceted funding environment, the attribution of observed improvements in SDG indicators solely to ERDF funding must be made with caution. Although this study includes economic and institutional control variables to reduce confounding effects, it does not disentangle the individual contribution of each funding stream. Future research could extend this work by employing disaggregated budgetary data or case-based comparative methods to more precisely trace the interactions between financial inputs and sustainability outcomes [
21,
26].
In addition, the regulatory and governance framework of each member state substantially affects ERDF implementation and performance. The administrative capacity to design, absorb, and monitor ERDF-funded projects varies considerably across countries and regions, impacting the efficiency and sustainability of the results [
13,
14]. National legal frameworks, procurement procedures, and planning instruments shape how funding is deployed, and can either facilitate or hinder the attainment of development objectives [
16,
34].
Moreover, external factors and structural asymmetries—including macroeconomic shocks, demographic trends, and crises, such as the COVID-19 pandemic—may distort the effectiveness of regional funding or delay the observable progress of sustainability indicators. As highlighted by Frone and Frone [
32] and Arbolino and Di Caro [
23], contextual disruptions can significantly affect SDG trajectories, particularly in health, education, and employment sectors.


 ,
, 
