Article

Ecological Network Optimization and Security Pattern Development for Kunming’s Main Urban Area Using the MSPA-MCR Model

1
Faculty of Land Resources Engineering, Kunming University of Science and Technology, Kunming 650093, China
2
Innovation Team of Natural Resources Spatial Information Integration and Application in Yunnan Universities, Kunming 650106, China
3
Institute of Technology, Kunming University of Science and Technology Oxbridge College, Kunming 650106, China
*
Author to whom correspondence should be addressed.
Sustainability 2025, 17(8), 3623; https://doi.org/10.3390/su17083623
Submission received: 20 February 2025 / Revised: 23 March 2025 / Accepted: 28 March 2025 / Published: 17 April 2025

Abstract

:
Rapid urbanization has greatly altered urban ecological spaces and habitat quality functions, threatening regional biodiversity and the sustainability of landscapes. Therefore, constructing a comprehensive ecological network and ecological safety patterns is crucial for ecosystem management and regional development. However, simple quantification of ecological networks fails to meet the construction needs of ecological safety patterns, and most studies focus solely on network quantification analysis, thus overlooking the importance of spatial analysis. This study proposes a method of ecological network quantification assessment combined with hotspot analysis and coupled with standard deviational ellipse spatial analysis, which not only satisfies quantitative analysis but also adds spatial analysis methods, facilitating a more comprehensive construction of safety patterns. Firstly, through morphological spatial pattern analysis (MSPA) and landscape connectivity indices, ecological source areas in the main urban area of Kunming were identified, integrating various resistance factors and corrective factors to construct an ecological resistance surface. The minimum cumulative resistance (MCR) model was used to identify potential ecological corridors, and their importance was evaluated using the gravity model, thus establishing an ecological network. Secondly, based on network structure indices, the ecological network was assessed and optimized. On this basis, combined with hotspot analysis coupled with standard deviational ellipse spatial analysis, an ecological safety pattern was constructed. The results show the following: the core area of the study region is 2402.28 km2, accounting for 52.07% of the total area; there are 13 ecological source areas, totaling 2102.89 km2, accounting for 45.58% of the total area; there are 178 potential ecological corridors, including 15 level-one ecological corridors and 19 level-two ecological corridors; and 103 ecological nodes, 70 “stepping stones”, and 48 ecological breakpoints were identified. In terms of ecological network optimization, six new ecological source areas were added, covering an area of 16.22 km2, and the potential ecological corridors increased to 324, including 11 new level two ecological corridors, 51 new ecological nodes, 15 “stepping stones”, and 24 major ecological breakpoints. After optimization, the network closure index (α), network connectivity index (β), and network connectivity rate index (γ) improved by 15.16%, 24.56%, and 17.79%, respectively. Based on the network structure quantitative analysis and hotspot analysis coupled with the standard deviational ellipse’s spatial analysis, a “one axis, two belts, five zones” ecological safety pattern was constructed.

1. Introduction

As the pace of urbanization accelerates, profound changes have occurred in land-use patterns, leading to a range of ecological security issues such as land degradation, loss of biodiversity, decline in ecosystem services, and increased environmental health risks. These challenges not only threaten human living environments but also pose significant obstacles to the sustainable development of socioeconomic systems [1,2]. The incessant increase in human activities has led to a consistent reduction and high fragmentation of urban ecological landscapes, thereby diminishing landscape connectivity and the stability of ecosystems. Consequently, ensuring regional ecological security has become a pressing issue in contemporary sustainable development discourse. The construction of ecological networks forms the foundation for establishing a secure ecological framework. Developing ecological corridors and biodiversity conservation networks enhances the stability of ecosystem services and improves habitat quality [3,4]. Extensive research on ecological networks and security patterns, including “ecological corridors” [5], “construction of ecological networks” [6], “ecological security assessment” [7], “ecological footprint” [8], “PSR model” [9], and the “Minimum Cumulative Resistance (MCR) model” [10], provides theoretical support for the construction and assessment of ecological security patterns. This is particularly relevant for ecological security assessments at different regional scales, such as the Yellow River Basin, the Beijing-Tianjin-Hebei region, the Jiaozhou Peninsula, Wenchuan County, and the Three Gorges Reservoir area [11,12,13,14,15]. However, research on the ecological security of plateau mountain cities is relatively scarce. The rapid development of these high-altitude urban areas has significantly impacted ecological networks, habitat quality, landscape patterns, and biodiversity, thereby severely threatening both the ecosystem services and human populations.
As awareness of environmental protection and sustainable development increases, the construction of ecological networks and the formulation of ecological security patterns are garnering growing attention [16,17]. Among the principal methodologies for establishing ecological security patterns is the “source identification-resistance surface construction-corridor extraction” approach. The construction of ecological networks and ecological security patterns primarily employs methods such as morphological spatial pattern analysis (MSPA) [18], least-cost path (LCP) [19], circuit theory (CT) [20], niche modeling [21], and graph theory analysis [22]. The MSPA model is instrumental in identifying and quantifying core areas in landscapes along with their edges and bridges, thereby deepening the understanding of landscape functional structures. LCP and CT involve significant computational efforts and complexity, whereas MSPA, based on mathematical morphological methods, offers faster computation speeds, enabling rapid identification of ecological core areas and connectivity zones, making it suitable for large-scale landscape pattern analysis. Niche modeling requires extensive species data, whereas MSPA can directly analyze based on remote sensing imagery or land use data without relying on biological data. Graph theory analysis focuses on connectivity calculations and struggles to meet the needs of holistic landscape structure optimization. In contrast, MSPA can quickly identify landscape breakpoints and areas requiring restoration, making it suitable for comprehensive planning of ecological security patterns [23]. The MCR model simulates optimal flow paths for species or resources, reflecting the resistance characteristics of ecological corridors. LCP can identify single paths, whereas circuit theory emphasizes local connectivity and is suitable for identifying key corridors. MCR, however, can identify multiple potential paths for ecological flow, making it applicable to broader ecological pattern analysis and providing a global ecological security framework. Graph theory analysis often overlooks factors such as terrain and ecological resistance, but MCR considers the spatial heterogeneity of ecological resistance effectively, identifying optimal paths for ecological corridors and integrating factors like topography, vegetation, and human disturbances, thus closely mirroring real ecological processes [24]. The integration of MSPA and MCR allows for a comprehensive analysis of the spatial structure and function of ecological networks. MSPA provides a structural basis for identifying core areas and potential corridors, while MCR enhances corridor design and path calculation, further refining the connectivity structures identified by MSPA [15,25]. Ultimately, by integrating the results of MSPA and MCR, a comprehensive ecological network and ecological security pattern are constructed, ensuring the sustainability of ecosystems and regional ecological security.
However, while a substantial body of research has concentrated on the quantification of networks, there has been less thorough investigation into the spatial characteristics integral to the construction of ecological security, which may lead to misinformed decision-making or suboptimal outcomes in ecological conservation [26]. Traditional methods of quantifying ecological networks, such as LCP and graph theory analysis, are capable of identifying critical ecological corridors and nodes. However, relying solely on network topology does not adequately reflect the true spatial features of ecosystems. Consequently, this study proposes the integration of spatial analysis for constructing secure ecological patterns. Spatial analysis can reveal the spatial distribution characteristics, interrelationships, and dynamic changes of ecological elements, making it a vital tool for optimizing ecological security models [27]. The principal methods of spatial analysis include Moran’s I statistic [28], spatial lag models [29], kernel density estimation [30], hotspot analysis (HSA), and standard deviational ellipse (SDE), among others. HSA and SDE, as important tools of spatial analysis, can effectively identify the spatial distribution characteristics, clustering tendencies, and directional features of ecological elements [31]. While Moran’s I is primarily used for analyzing global spatial autocorrelation and is less effective in localized analyses, HSA, on the other hand, can detect local hotspots and cold spots, making it more suitable for identifying specific spatial units’ clustering situations. Spatial lag models and kernel density estimation are computationally intensive and complex, only capable of determining whether data exhibit spatial autocorrelation without providing directional information. In contrast, HSA requires less computational effort and is suitable for large-scale data analysis. The SDE visually displays the directionality, deviation trends, and dispersion of point data, making it useful for analyzing the main directions of spatial distribution [32].
The habitat quality module in the InVEST model is an essential tool for research on ecological security patterns, as it quantifies both the quality of habitats and their levels of threat [33]. However, the results generated by InVEST are typically raster data, which lack fine spatial pattern recognition and directional analysis. By integrating HSA and SDE, the accuracy of habitat quality assessments can be further enhanced. Ecological resistance measures the spatial impediments to biological migration or ecological element flow and is a core parameter in constructing ecological networks and ecological security patterns [34]. Traditional methods such as Moran’s I statistic and spatial lag models struggle to accurately identify the overall spatial patterns and directional characteristics of both. Therefore, this research proposes the combination of HSA and SDE to enhance the spatial analysis capabilities of habitat quality and ecological resistance.
Kunming, a pivotal plateau city in Southwest China, serves as a central hub connecting South Asia and Southeast Asia. Its main urban area is critical to the development of both Kunming and the entire Yunnan Province. However, the expansion of construction land in Kunming’s main urban area has encroached substantially on ecological land, leading to landscape fragmentation and a decline in ecosystem services. This urban development poses challenges, including reductions in urban green spaces and biodiversity. Therefore, the construction of an ecological network and the establishment of ecological security patterns in Kunming’s main urban area have become urgent tasks [35]. With increasing global and national emphasis on environmental protection and biodiversity, Kunming’s efforts in this regard are particularly notable. In October 2021, Kunming hosted the 15th Conference of the Parties (COP15) to the Convention on Biological Diversity, resulting in the adoption of the “Kunming Declaration,” which calls for international actions to enhance biodiversity governance and promote ecological conservation and sustainable development [36]. Additionally, since 15 April 2021, China has implemented the “Biosecurity Law of the People’s Republic of China,” aimed at addressing biosecurity risks, protecting biological resources, and safeguarding the ecological environment [37]. This study introduces a species distribution distance factor to revise the ecological resistance surface, thereby creating a more comprehensive ecological network that supports species migration and exchange as well as environmental conservation. The main objectives of this research are as follows: (1) to identify ecological source areas and extract ecological corridors using the MSPA-MCR model and gravity model, construct an ecological network, and optimize it via a network structure index model; (2) to integrate HSA and the SDE model for spatial analysis of ecological resistance and habitat quality; and (3) to develop and optimize the ecological security patterns of Kunming’s main urban area. This study provides reliable recommendations for the ecological protection and sustainable development of Kunming’s main urban area, offering significant theoretical and practical implications.

2. Data and Methodology
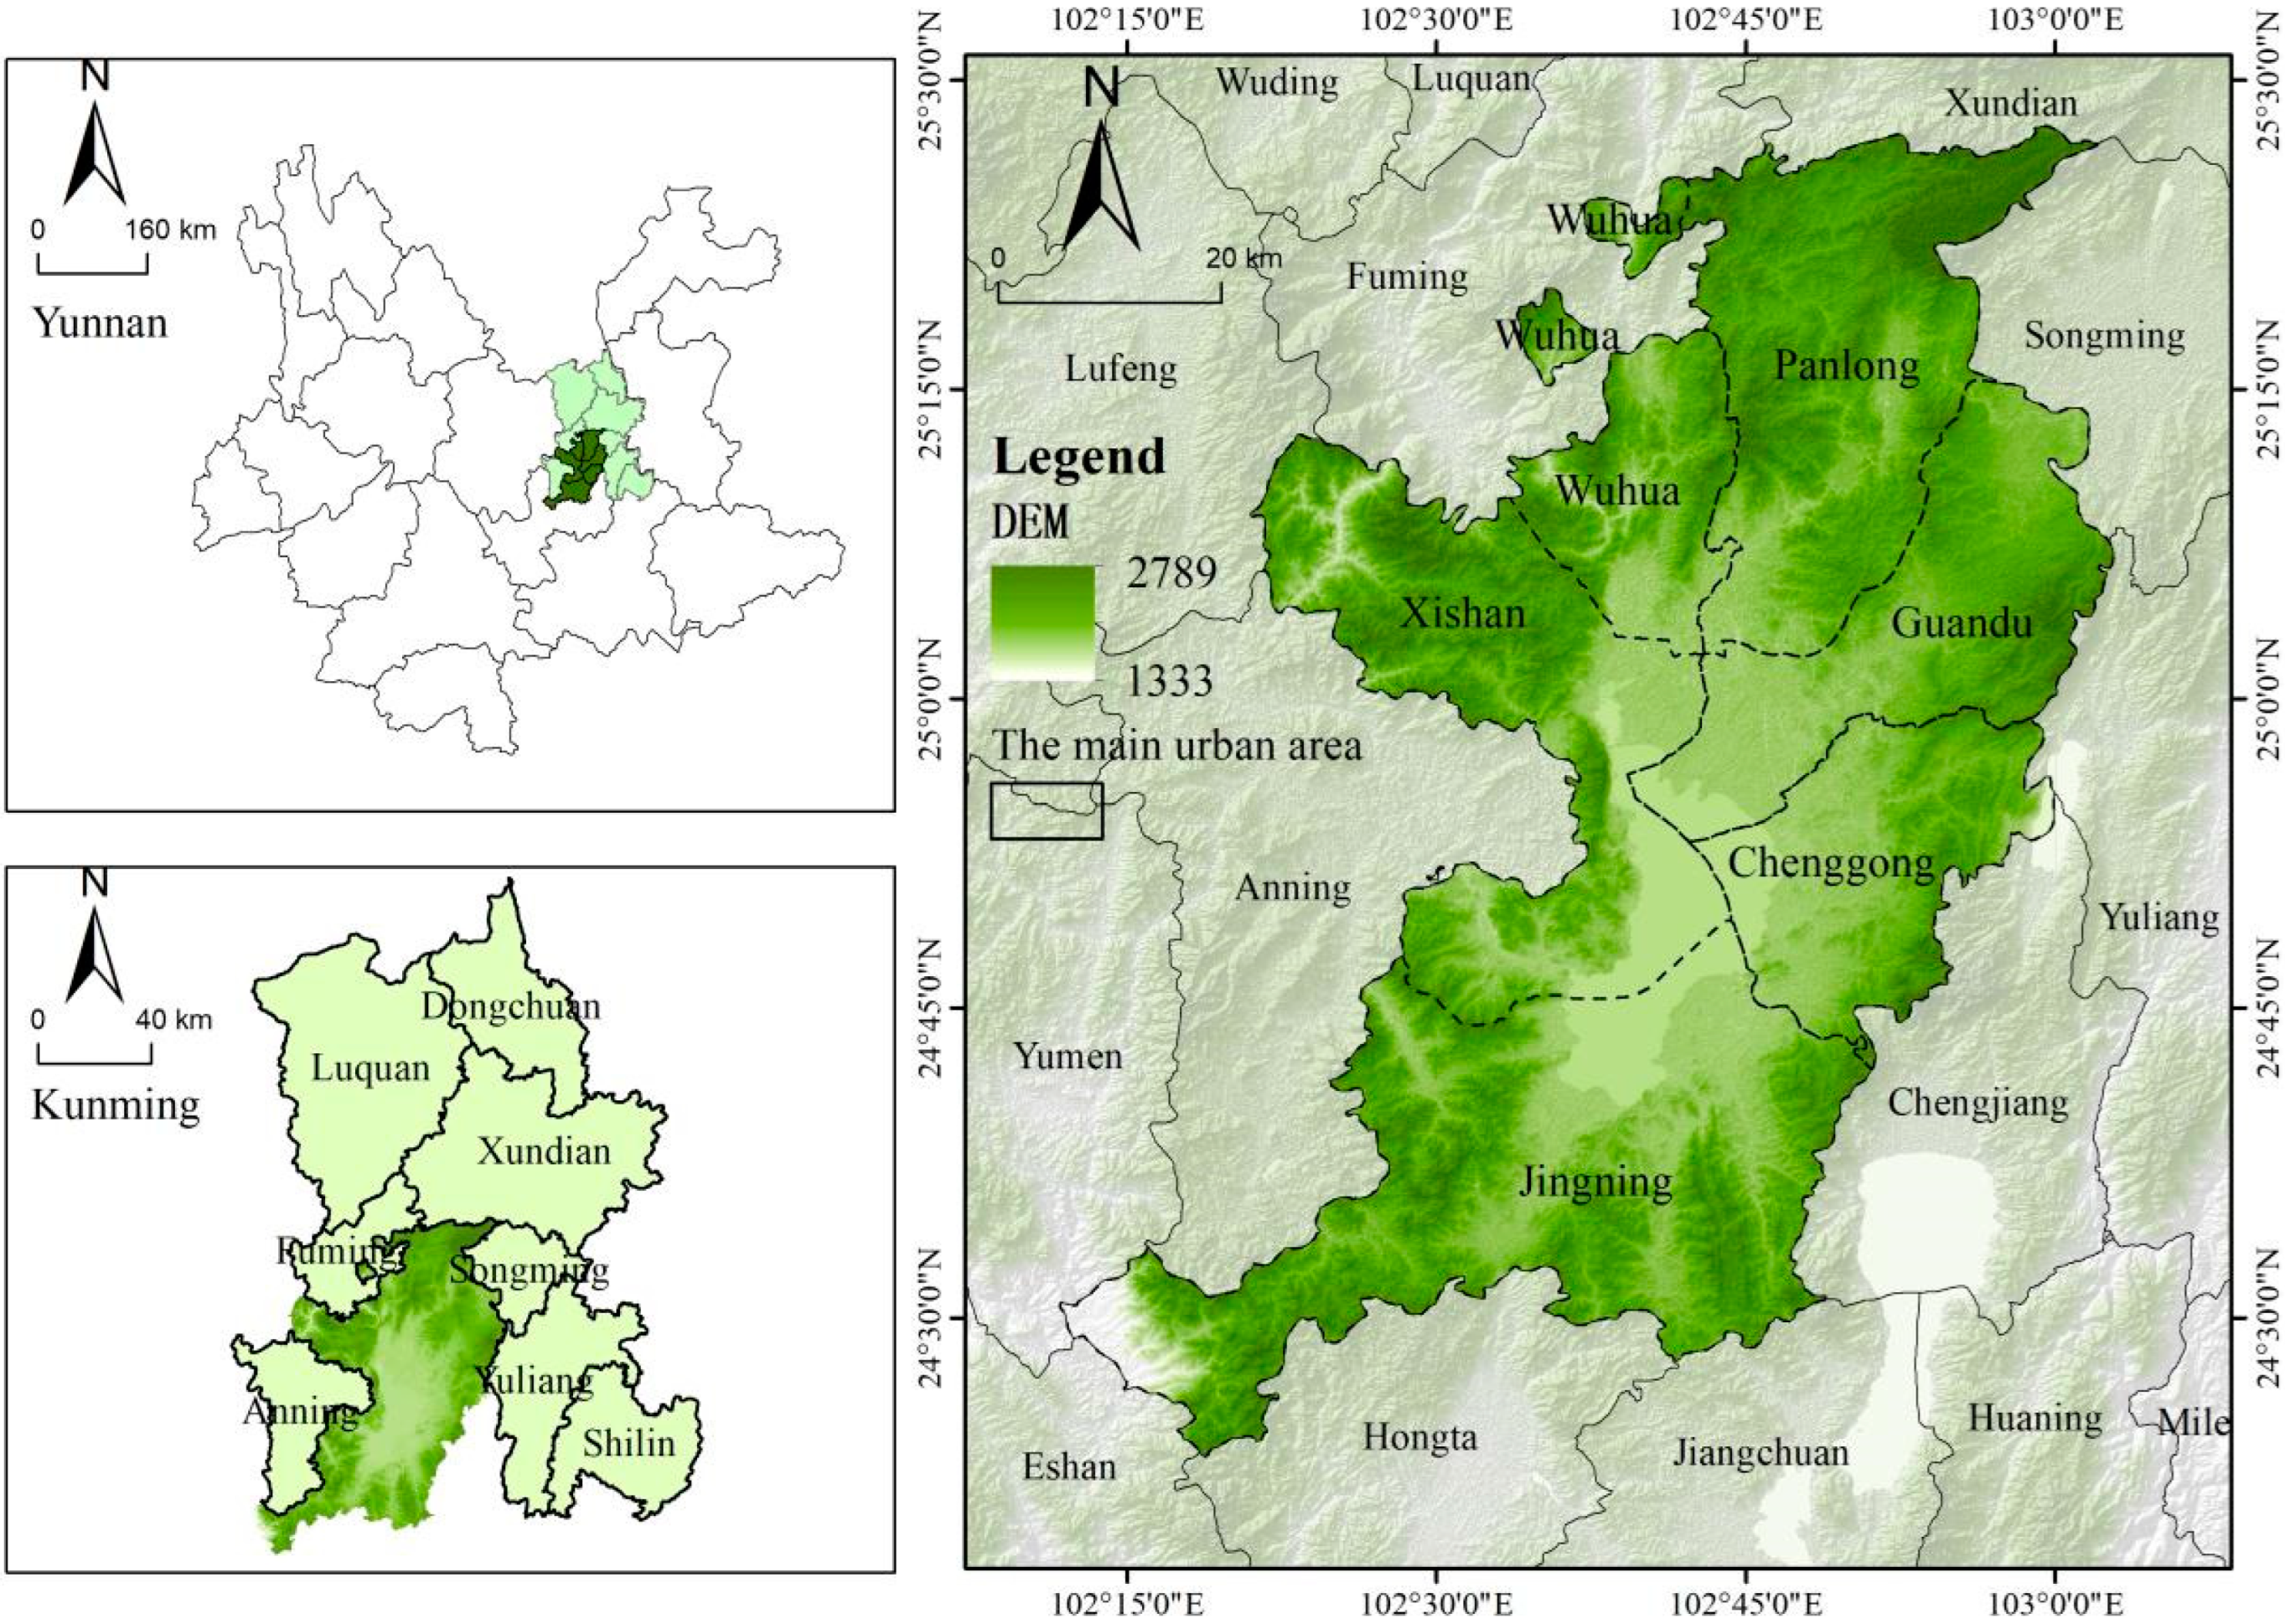
2.1. Study Area

The main urban area of Kunming is located in the central part of the Yunnan-Guizhou Plateau in southwest China (102°19′ E—103°04′ E, 24°38′ N—25°46′ N). It serves as the core region of Kunming City in Yunnan Province. As China’s gateway to Southeast Asia and South Asia, the main urban area is not only the economic center of Yunnan Province but also plays a pivotal role in serving as a hub that influences the surrounding regions (Figure 1). The area includes the districts of Wuhua, Panlong, Guandu, Xishan, Chenggong, and Jinning, covering a total area of 4614 km2, which accounts for approximately 21.5% of Kunming’s total area. By the end of 2022, the total population was approximately 5.8285 million, constituting 67.8% of the city’s total population. The urbanization rate stood at 93.58%, and the GDP reached 598.62 billion yuan, representing 76.12% of the total GDP of Kunming City, thus marking it as the economic powerhouse of Yunnan Province. The main urban area is connected domestically and internationally through Kunming Changshui International Airport and Kunming South Station, supported by a dense network of railways and highways, which are crucial in facilitating transportation to the western, southern, and northeastern regions of Yunnan. The climate in Kunming is pleasant, with the smallest annual temperature variation nationwide. The vegetation primarily consists of subtropical evergreen broadleaf forests and shrublands, serving as an important ecological barrier in the region. The area is rich in biological resources, possessing significant ecological value.

2.2. Data Sources

The land cover data used in this study, including arable land, forest land, and grassland, as well as river and species distribution data, were obtained from the Institute of Geographic Sciences and Natural Resources Research, Chinese Academy of Sciences (https://www.resdc.cn/, accessed on 5 January 2025), with a resolution of 30 m. Road data (highways and railways) were sourced from OpenStreetMap (http://www.openstreetmap.org, accessed on 5 January 2025), and Digital Elevation Model (DEM) data were acquired from Geospatial Data Cloud (http://www.gscloud.cn, accessed on 5 January 2025). Slope data were generated by processing DEM raster data using ArcGIS 10.8 software. Additionally, the fractional vegetation cover (FVC) data were procured through the Google Earth Engine (GEE) platform, where data preprocessing steps such as cloud removal and geometric corrections were performed to ensure data accuracy and consistency. Similarly, the Impervious Building Index (IBI) data were calculated using Sentinel-2 satellite imagery, specifically using the red (B4) and near-infrared (B8) bands. All spatial data were processed using ArcGIS 10.8 software for projection transformation, clipping, and masking to conform to the administrative divisions and projection coordinate system of 2020, ensuring uniform spatial resolution at 30 m (Table 1).

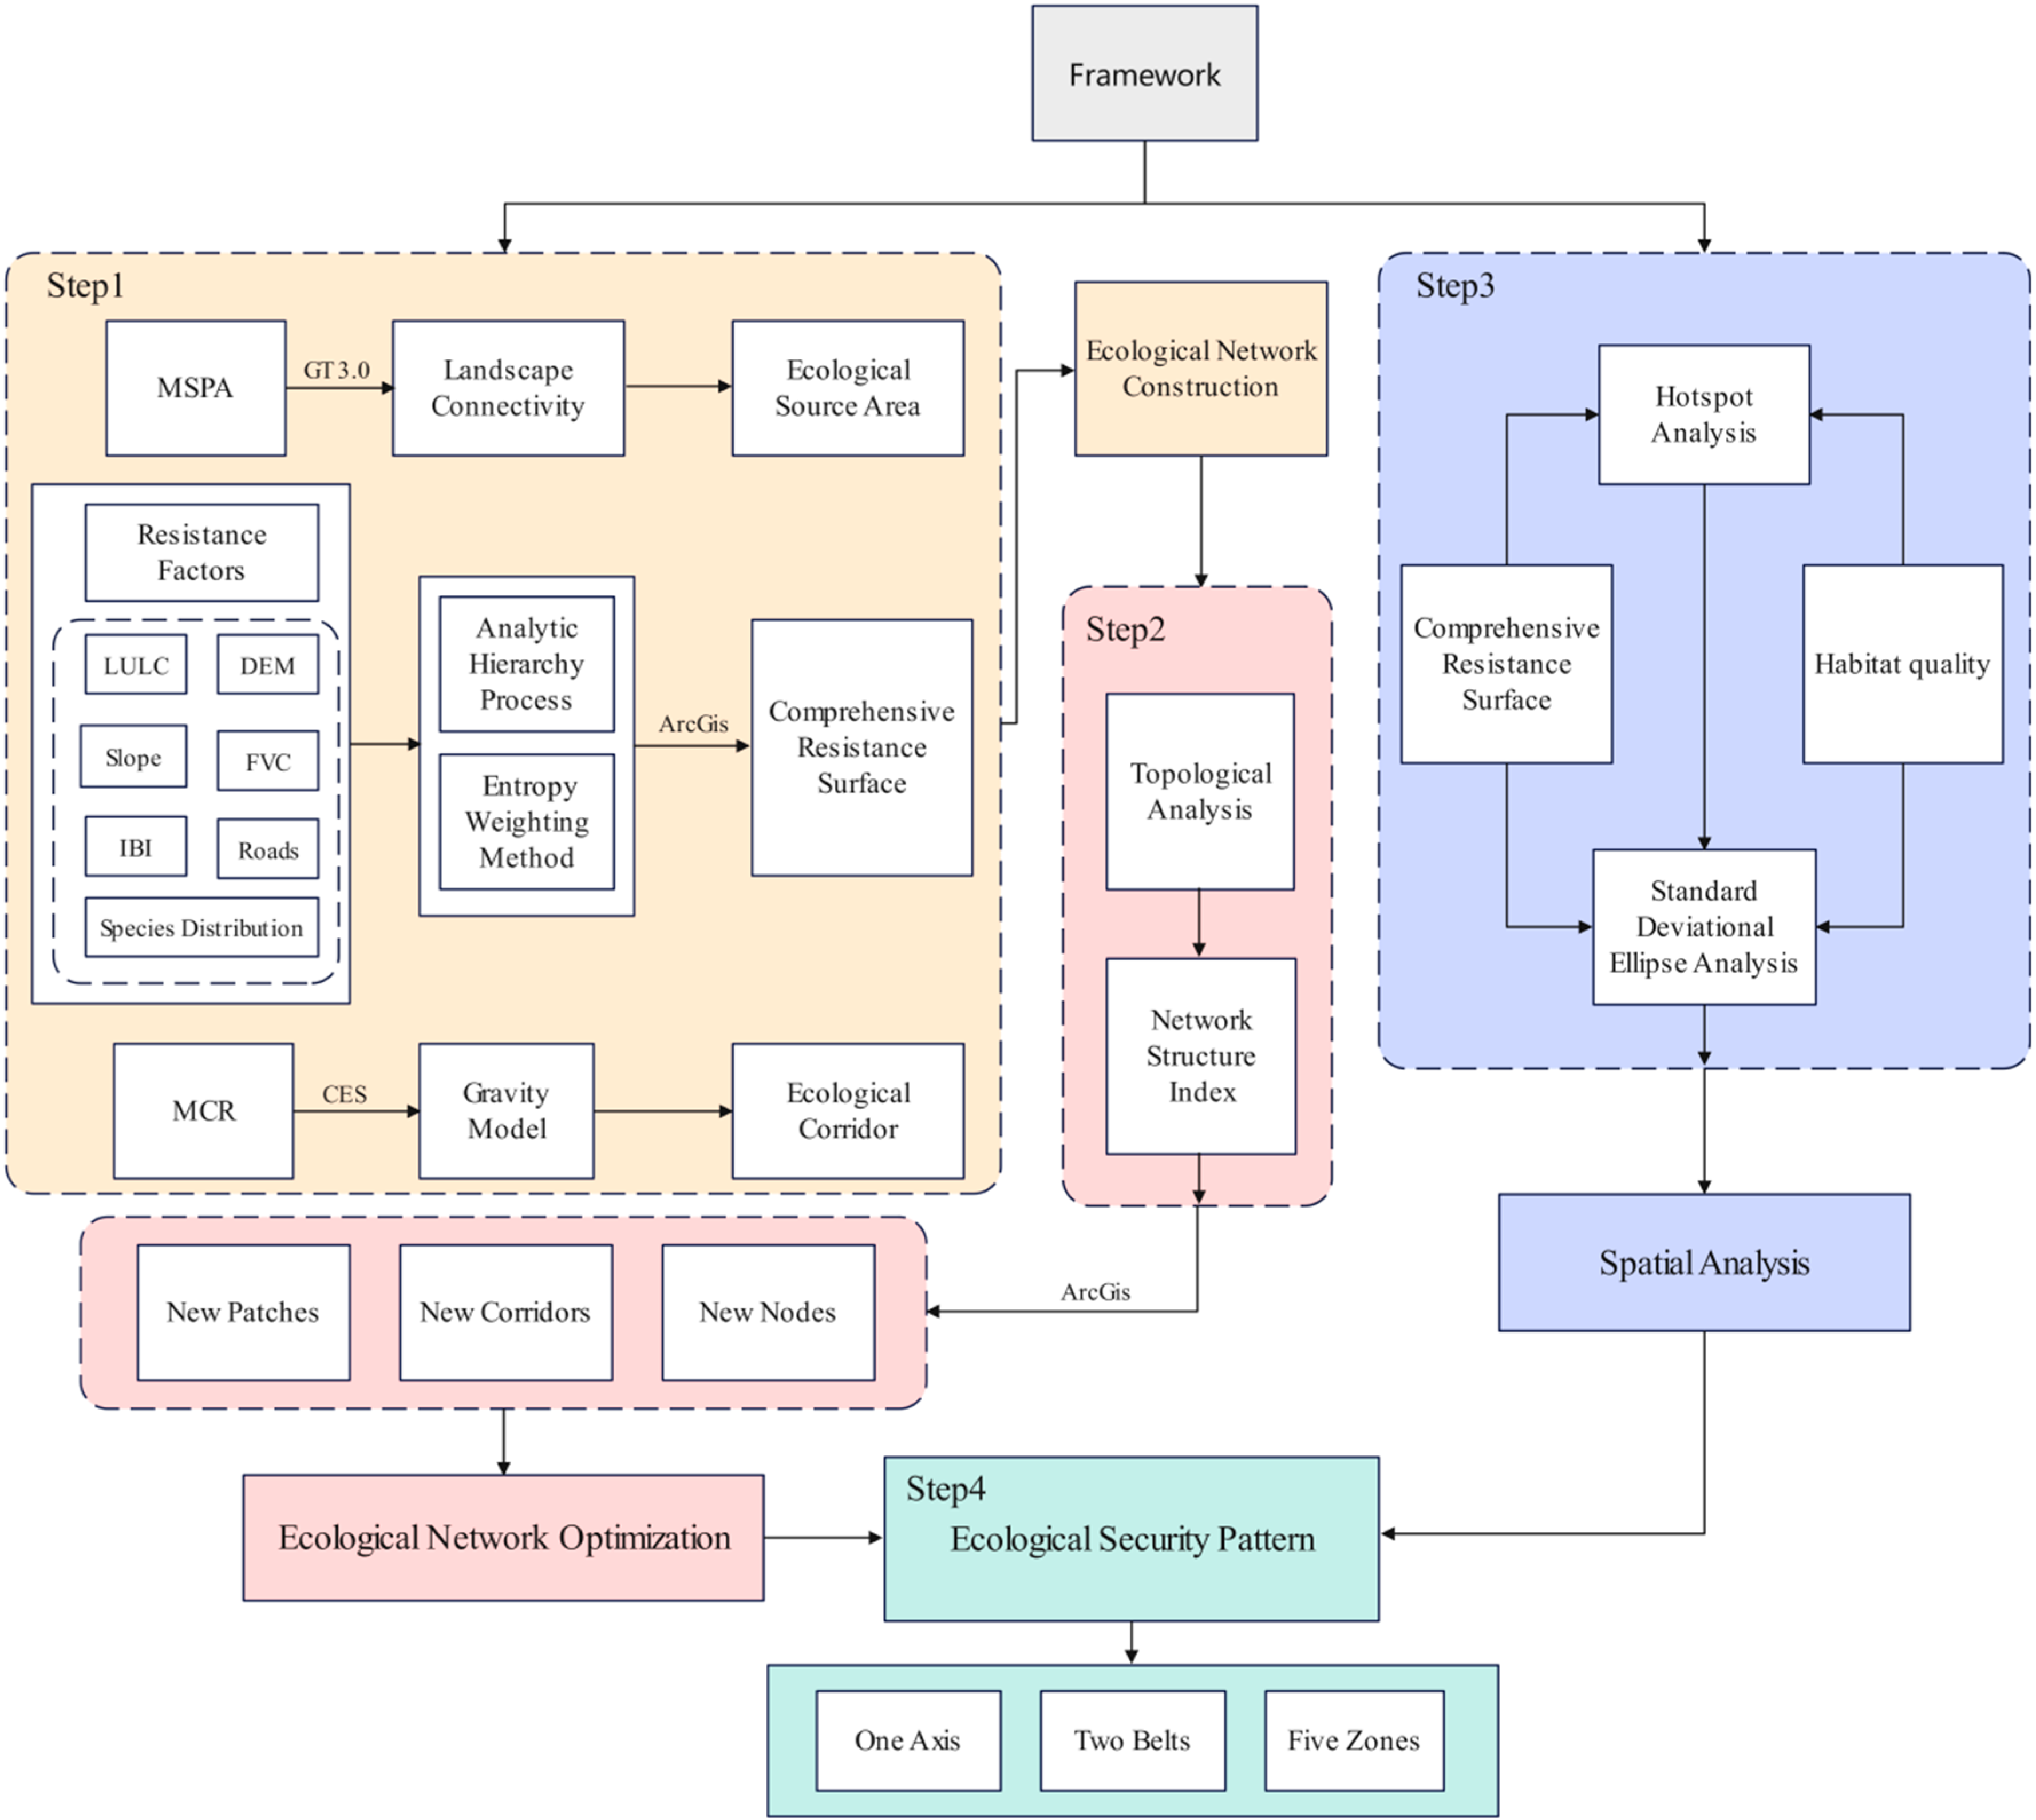
2.3. Research Methodology

The analytical framework for the study area is divided into four parts (see Figure 2), and the specific analysis process is as follows: Step 1: Connectivity Analysis and Ecological Network Construction Based on MSPA. Initially, an MSPA is conducted to analyze the connectivity in the study area and to identify key ecological source sites. Subsequently, factors impeding ecological flow, such as land use, DEM, and slope, are selected to construct an ecological resistance surface. Using the MCR model, potential ecological corridors are delineated. By integrating ecological source sites, the resistance surface, and ecological corridors, a preliminary ecological network framework is established. Step 2: Optimization of the Ecological Network. The network is enhanced by integrating additional ecological patches, corridors, and nodes through topological analysis and network structure indices, thereby enhancing its connectivity and optimizing the spatial layout within the network to improve its stability and functionality. Step 3: Spatial Analysis. HSA and the SDE model are employed to conduct a spatial analysis, exploring the distribution of ecological resistance and the spatial characteristics of habitat quality in depth. Step 4: Construction of Ecological Security Patterns. Finally, by integrating all information from the previous steps, an ecological security pattern described as “one axis, two belts, five zones” is constructed.

2.3.1. Selection Method for Ecological Source Sites

MSPA is a mathematical tool used for processing raster images that can accurately differentiate landscape structures and types and assess the importance of various landscape patches. In this study, land cover data are utilized as the basis for extracting types of land use such as forests, grasslands, wetlands, and water bodies in ArcGIS 10.8, designated as foreground data with a value of 1, while other land use types are designated as background data with a value of 2. Subsequently, landscape element data encompassing seven categories, including core areas, islets, bridges, loops, edges, gaps, and branches, are generated using Guidos Toolbox 3.2. Ultimately, core areas larger than 13 km2 are selected as candidate patches for ecological source sites to further analyze landscape connectivity [38].
Landscape connectivity reflects the ease of material and informational exchanges and migration among ecological patches, and robust connectivity is crucial for maintaining ecosystem stability and conserving biodiversity. The Integral Index of Connectivity (IIC), the Probability of Connectivity (PC), and the delta Probability of Connectivity (dPC) provide comprehensive assessments of landscape connectivity. By utilizing Conefor 2.6 software, with a connectivity threshold set at 2500 m and a connectivity probability of 0.5, landscape connectivity evaluations are conducted. This approach facilitates the ranking of core area patches in terms of importance and further extraction of ecological source sites [39]. The formulas are as follows:
I I C = i = 1 n j = 1 n a i a j 1 + n l i j A l 2
P C = i = 1 n j = 1 n a i a j P i j * A L 2
d P C = P C P C r e m o v e P C × 100 %
In these equations, IIC represents the Integral Index of Connectivity, PC symbolizes the Probability of Connectivity, and dPC denotes the importance value of patches. αi and αj respectively represent the areas of patches i and j, nlij represents the number of connections between patches i and j, AL is the total area, and Pij is the maximum potential for species dispersal between patches i and j. PCremove indicates the value of the connectivity index after the removal of patch αi.

2.3.2. Resistance Surface Construction

The construction of ecological resistance surfaces is critical, as species movement and migration are often impeded by various environmental factors. Therefore, it is necessary to incorporate resistance values from different landscape types to build a comprehensive resistance surface. Resistance factors are environmental elements that influence ecosystem or species distribution. Drawing on previous research [40], this study selected six primary influencing factors, land cover, slope, DEM, IBI, distance from roads, and distance from railways, and introduced two corrective factors: fractional vegetation cover (FVC) and species distribution distance. The IBI measures the impact of buildings on the surrounding environment, ecosystems, and urban landscapes. Species distribution distance refers to the spatial distance between different populations or habitats of a species, reflecting the spatial distribution patterns and habitat connectivity of species populations, calculated through multiple buffer zones in ArcGIS. The eight resistance factors were graded and assigned values. This study employed the analytic hierarchy process (AHP) and the entropy weighting method to evaluate the weights of natural factors (such as elevation, slope direction, slope, and FVC) and anthropogenic factors (including land use type, distance from roads, and distance from railways, as well as IBI) and constructed a resistance surface model combining natural and anthropogenic elements [41]. Table 2 presents the impact assessment of different factors on the ecological network or species migration, where resistance factors are categorized by grading standards and assigned corresponding resistance values (1–9) and weights to quantify the impact of various environmental factors.

2.3.3. Construction of Ecological Networks

(1)
Identification of Potential Ecological Corridors Based on the MCR Model. The MCR model is a pivotal methodology for identifying potential ecological corridors. By calculating the resistance values between source areas within an ecological resistance surface, the LCP can be determined, facilitating the construction of an ecological network. The formula is as follows:
M C R = f min i = 1 n D i j × R j
In the formula, MCR denotes the minimum cumulative resistance value, fmin represents a function positively correlating spatial distance with resistance coefficients, Dij is the spatial distance that ecological source i traverses through grid cell j, and Rj represents the degree to which grid cell j impedes ecological flows.
(2)
Weight Grading of Ecological Corridors Based on the Gravity Model. The gravity model enables calculation of mutual attraction between patches, extracting significant ecological corridors. This study utilizes the gravity model, designating corridors with interaction forces above 70 as primary ecological corridors and those with interaction forces between 24 and 70 as secondary ecological corridors. The formula is as follows:
G i j = N i × N j D i j 2 = L max 2 × I n ( S i × S j ) L i j 2 × P i × P j
In the formula, Gij denotes the interaction force between patches i and j; Si represents the area of patch i; Ni and Nj are the weight values of patches i and j, respectively; Pi and Pj denote the resistance values of patches i and j, respectively; Lij indicates the cumulative resistance value between patches i and j; Lmax represents the maximum resistance value of potential corridors.
(3)
Assessment of Ecological Network Structure Using Index Models. Network connectivity models are capable of calculating the connectivity of ecological corridors with their respective endpoints, reflecting the strength and complexity of the ecological network. These models evaluate the network’s robustness, stability, and resistance to external disturbances [42]. The network closure index (α) measures the proportion of actual closed loops (closed paths) within the network; a higher α value indicates stronger closure and greater structural complexity. The network connectivity index (β) represents the average number of corridors per ecological node, reflecting the level of network connectivity. A higher β value indicates stronger connectivity and higher interactivity among nodes. The network connectivity rate (γ) assesses the ratio of actual connected corridors to the theoretical maximum number of connections, providing a comprehensive evaluation of the network’s overall connectivity efficiency. The calculation formula is as follows:
α = S Q + 1 2 Q 5 ; β = S Q ; γ = S 3 ( Q 2 )
In the formula, S represents the number of potential ecological corridors, and Q denotes the quantity of ecological patches.
(4)
Analysis of Ecological Nodes, Stepping Stones, and Breakpoints. Ecological nodes are regions within an ecological network that play a pivotal role and are often characterized by high biodiversity, essential ecological functions, or strategic geographical locations. These nodes constitute the core components of ecosystems [43]. Situated at the intersections of ecological corridors, nodes connect different habitats and are crucial for maintaining the stability of ecosystems. “Stepping stones” refer to smaller patches within the ecological network, located between larger habitats, and serve as temporary habitats or refueling stations during species migration. They effectively reduce the effects of habitat fragmentation, enhance the dispersal capabilities and survival chances of species, and mitigate the negative impacts of habitat fragmentation on species. Breakpoints within an ecological network are areas where connectivity is disrupted or fails, often due to human activities or natural destruction, such as intersections between railways and corridors. This fragmentation leads to interruptions in ecological functions, impeding species migration or gene flow.

2.3.4. Spatial Analysis Based on HSA and SDE

Habitat quality and ecological resistance play significant roles in constructing ecological security patterns. Dynamic assessments of habitat quality are instrumental in early detection of ecological degradation trends, enabling timely interventions and effective measures to reduce ecological security risks. These assessments also provide a scientific basis for ecological restoration, ensuring that restoration measures effectively enhance regional ecological security and protect biodiversity. According to the InVEST model user guide and related studies in the research area [44], settings for threat sources and sensitivity among other relevant parameters are configured (see Table 3 and Table 4).
Ecological resistance is composed of various resistance factors, such as land cover and DEM, forming an integrated resistance surface (see Table 2, Figure 3). This surface quantifies the resistance offered by different land surface types to ecological elements, such as species migration and ecological flow. The guidance provided by this analysis is crucial for the layout of ecological corridors and ecological source sites, ensuring the scientific validity and sustainability of ecological security patterns.
HSA is a robust tool capable of identifying regions within ecosystems that are either under significant environmental stress or exhibit concentrated biodiversity, thereby pinpointing critical areas for ecological conservation. The confidence intervals utilized in HSA are instrumental in evaluating the statistical significance of clusters of high values (hot spots) or low values (cold spots). Common confidence levels for determining hot spots and cold spots include thresholds where a Gi* value greater than 1.645 (90% confidence), 1.960 (95% confidence), or 2.576 (99% confidence) signifies a statistically significant hot spot, while a Gi* value less than −1.645 (90% confidence), −1.960 (95% confidence), or −2.576 (99% confidence) indicates a cold spot, with the significance increasing progressively at higher thresholds [45]. The formula for hot spot analysis is as follows:
G i * = j = 1 n ω i , j x j X ¯ j = 1 n ω i , j n j = 1 n ω i , j 2 ( j = 1 n ω i , j ) 2 / ( n 1 ) s
In the formula, Gi∗ represents the hot spot statistic, xj denotes the observed value at target area j, wi,j is the spatial weights matrix indicating the spatial relationship between points i and j, n is the number of spatial cells, and X ¯ is the global mean of observed values, with S being the standard deviation of observed values. The parameters X ¯ and S are calculated using the following formula:
X ¯ = 1 n i = 1 n x i ; S = 1 n j = 1 n x j 2 ( X ¯ ) 2
In the formula, X ¯ is the global mean, S is the standard deviation, xj is the observed value at target area j, and n is the number of spatial cells.
The SDE is employed to analyze the spatial orientation and morphological characteristics of ecological distributions, identifying the principal spatial expansion trends within ecosystems. By comparing SDEs over different time periods, one can assess the expansion, contraction, or migration of ecosystems. The SDE is characterized by basic parameters such as the centroid, major and minor axes, and orientation, which describe the general spatial distribution features, including the mean center, orientation angle, and the variances along the x and y axes. The formulas for these parameters are as follows:
Mean Center Formula:
X ω = i = 1 n ω i μ i i = 1 n ω i ; Y ω = i = 1 n ω i ο i i = 1 n ω i
Orientation Angle Formula:
tan θ = ( i = 1 n ω i 2 u ¯ i 2 i = 1 n ω i = 1 2 ο ¯ i 2 ) ± ( i = 1 n ω i 2 u ¯ i 2 i = 1 n ω i = 1 2 ο ¯ i 2 ) 2 + 4 i = 1 n ω i 2 u ¯ i 2 ο ¯ i 2 2 i = 1 n ω i 2 u i o i
x-Axis Mean Square Deviation:
σ x = i = 1 n ( ω i u ¯ i cos θ ω i ο ¯ i sin θ ) 2 i = 1 n ω i 2
y-Axis Mean Square Deviation:
σ y = i = 1 n ( ω i u i sin θ ω i ο i cos θ ) 2 i = 1 n ω i 2
In the formula, ( ο ¯ , u ¯ ) represents the spatial position of the subject, wi denotes weights, (Xw, Yw) signifies the weighted mean center, θ is the ellipse’s orientation angle, indicating the angle formed by the ellipse’s major axis with north in a clockwise direction, õ and ũ represent the deviations of coordinates from the target location to the mean center, and σx and σy respectively denote the variances along the x and y axes.

3. Results

3.1. Analysis and Selection of Ecological Source Sites

Through the analysis of MSPA, 31 core patches with an area greater than 3 km² were identified. These core patches exhibit lower human activity and higher ecological value, making them optimal candidates for ecological source sites. To mitigate landscape fragmentation, the selection of core patches for further study was refined using landscape connectivity metrics (see Table 5). By referencing prior research and considering the specific conditions of the study area, core patches with a dPC value greater than 3 and an IIC value greater than 2 were selected. Ultimately, 13 ecological patches were chosen as ecological source sites for subsequent research. These sites, characterized by large areas and superior ecological source, are significant for their high connectivity and potential to facilitate species migration and interaction. The results indicate that the total area of these ecological source sites is 2102.89 km2, accounting for 45.58% of the study area. These sites are primarily located in the northern and northwestern regions of the main urban area of Kunming, as well as other parts of the city. The primary land use types within these ecological source sites are forests, water bodies, and grasslands. Specifically, forested areas cover 1684.49 km2, accounting for 80.14% of the total area of ecological source sites; water bodies cover 284.23 km2, representing 13.54%; and grasslands cover 194.23 km2, making up 9.23%.

3.2. Construction of the Ecological Network

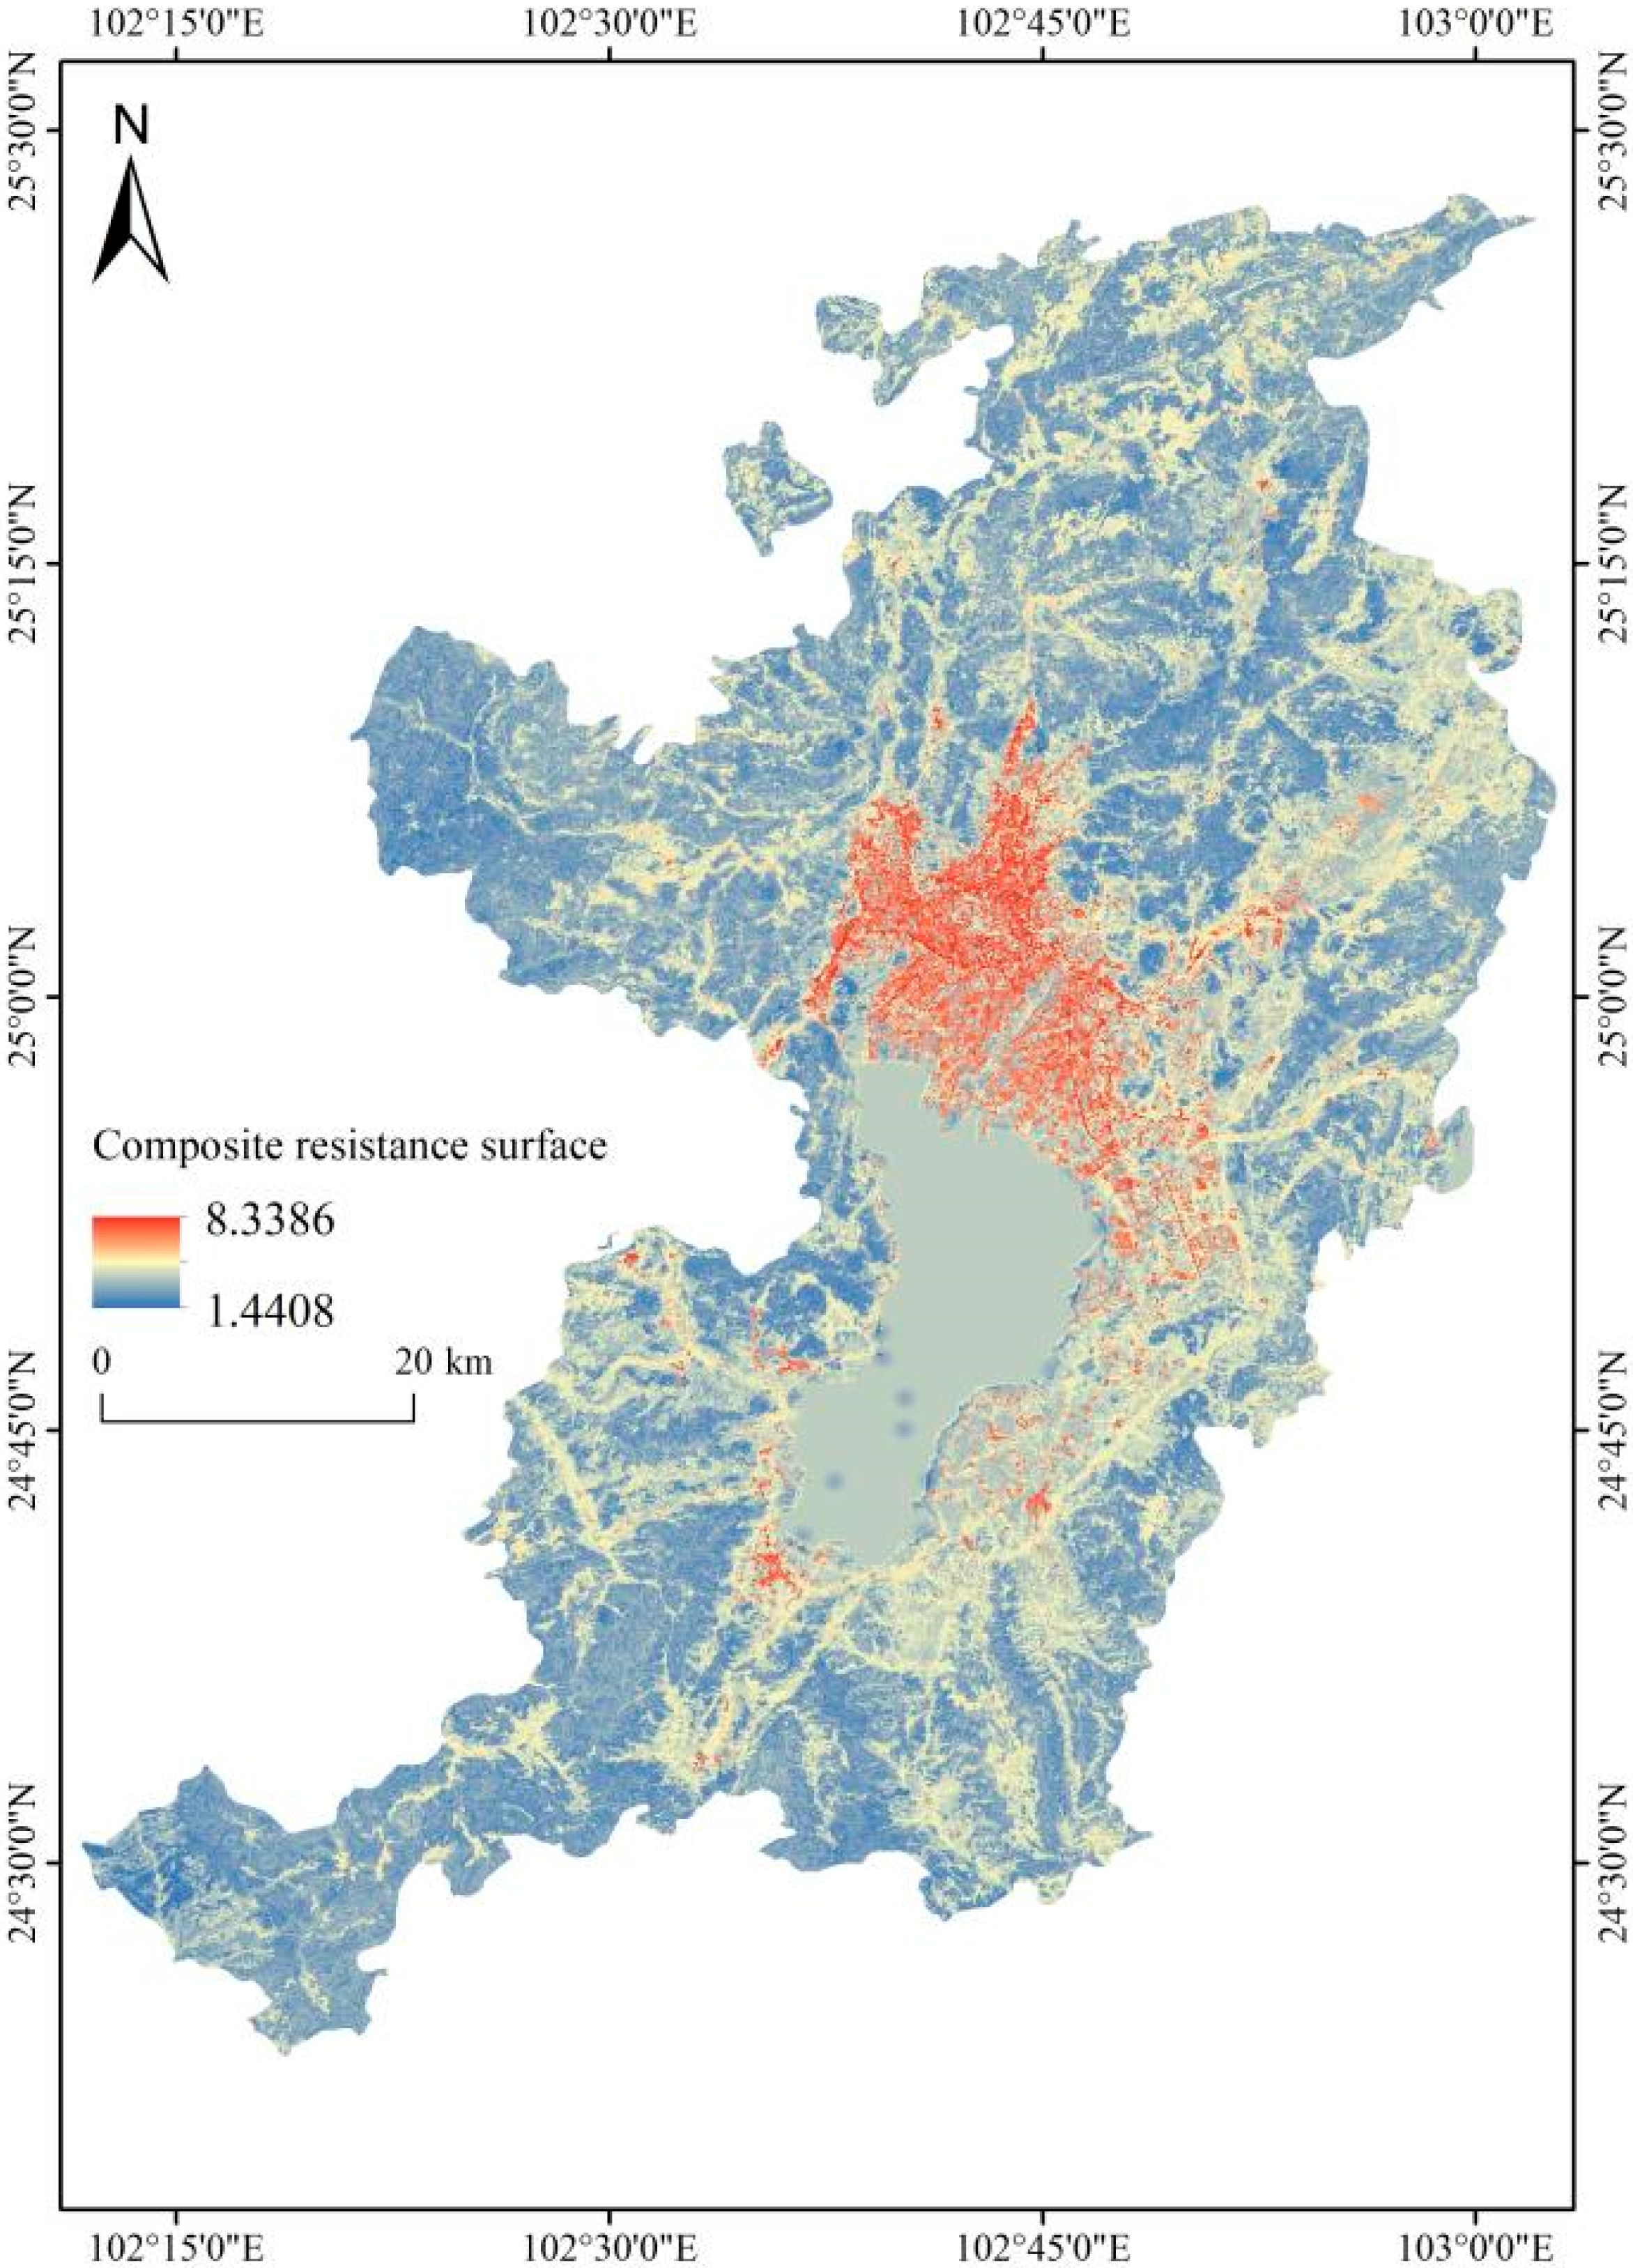
3.2.1. Ecological Resistance Surface

Figure 4 depicts the composite resilience surface (CRS) for the main urban area of Kunming, which is utilized to characterize the degree of resistance to ecological flows, such as wildlife migration and connectivity of ecological corridors, across different regions. Higher resistance values indicate greater human activity intensity, higher degrees of ecosystem fragmentation, and poorer ecological permeability. Areas with the highest resistance, shown in red (with a maximum resistance value of 8.33), correspond to the urban core and high-density building zones. Yellow areas, indicating medium resistance, are typically suburban or semi-developed regions. Blue areas, with the lowest resistance value of 1.44, correspond to regions with better ecological conditions, such as forests, wetlands, and nature reserves. Overall, the ecological resistance in the main urban area of Kunming decreases from the center to the periphery. Areas closer to the city center exhibit higher ecological resistance due to urbanization, whereas regions further from the center with more natural land show lower resistance, creating a pattern where the center has high resistance and the periphery has low resistance.

3.2.2. Extraction and Grading of Ecological Corridors

In this study, the gravity model was used to identify the intensity of interactions between ecological source areas. Figure 5 is a matrix heatmap showing the correlation or interaction between variables. The horizontal and vertical axes are labeled X1 to X13, representing 13 ecological source patches. The interaction force q ranges from 2.29 to 622.07, with green representing higher values, indicating stronger influence on the target variable, and dark brown representing lower values, indicating weaker influence and smaller contributions in the model. The higher values are mainly associated with areas related to X7, X8, X9, and X10 (for example, the interaction value between X8 and X7 is 545.56, and it is 620.07 between X9 and X10), which indicates significant ecological connectivity between source areas 8, 9, and 10. Their geographic adjacency is beneficial for the construction of ecological corridors. The lower values (brown and yellow) are concentrated in regions such as X1–X4 and X2–X5, indicating lower correlation or smaller values between these variables. Ecological source area 9 has a strong interaction, showing its central position in the regional ecological network, and should be a focus for protection and improvement of its ecological connectivity.
By integrating the results from landscape connectivity analysis, MCR, and the gravity model, ecological corridors were extracted and classified. A total of 91 potential ecological corridors were identified within the study area. Corridors where the interaction force between ecological source sites exceeded 70 were classified as primary ecological corridors, and those with interaction forces between 24 and 70 were classified as secondary ecological corridors. Among these, there were 15 primary ecological corridors, spanning a total length of 386.38 km2, and 19 secondary ecological corridors, covering 817.75 km2. Both primary and secondary ecological corridors connected patches with higher habitat quality, thus enhancing the potential for biological migration and interchange.

3.3. Optimization of the Ecological Network

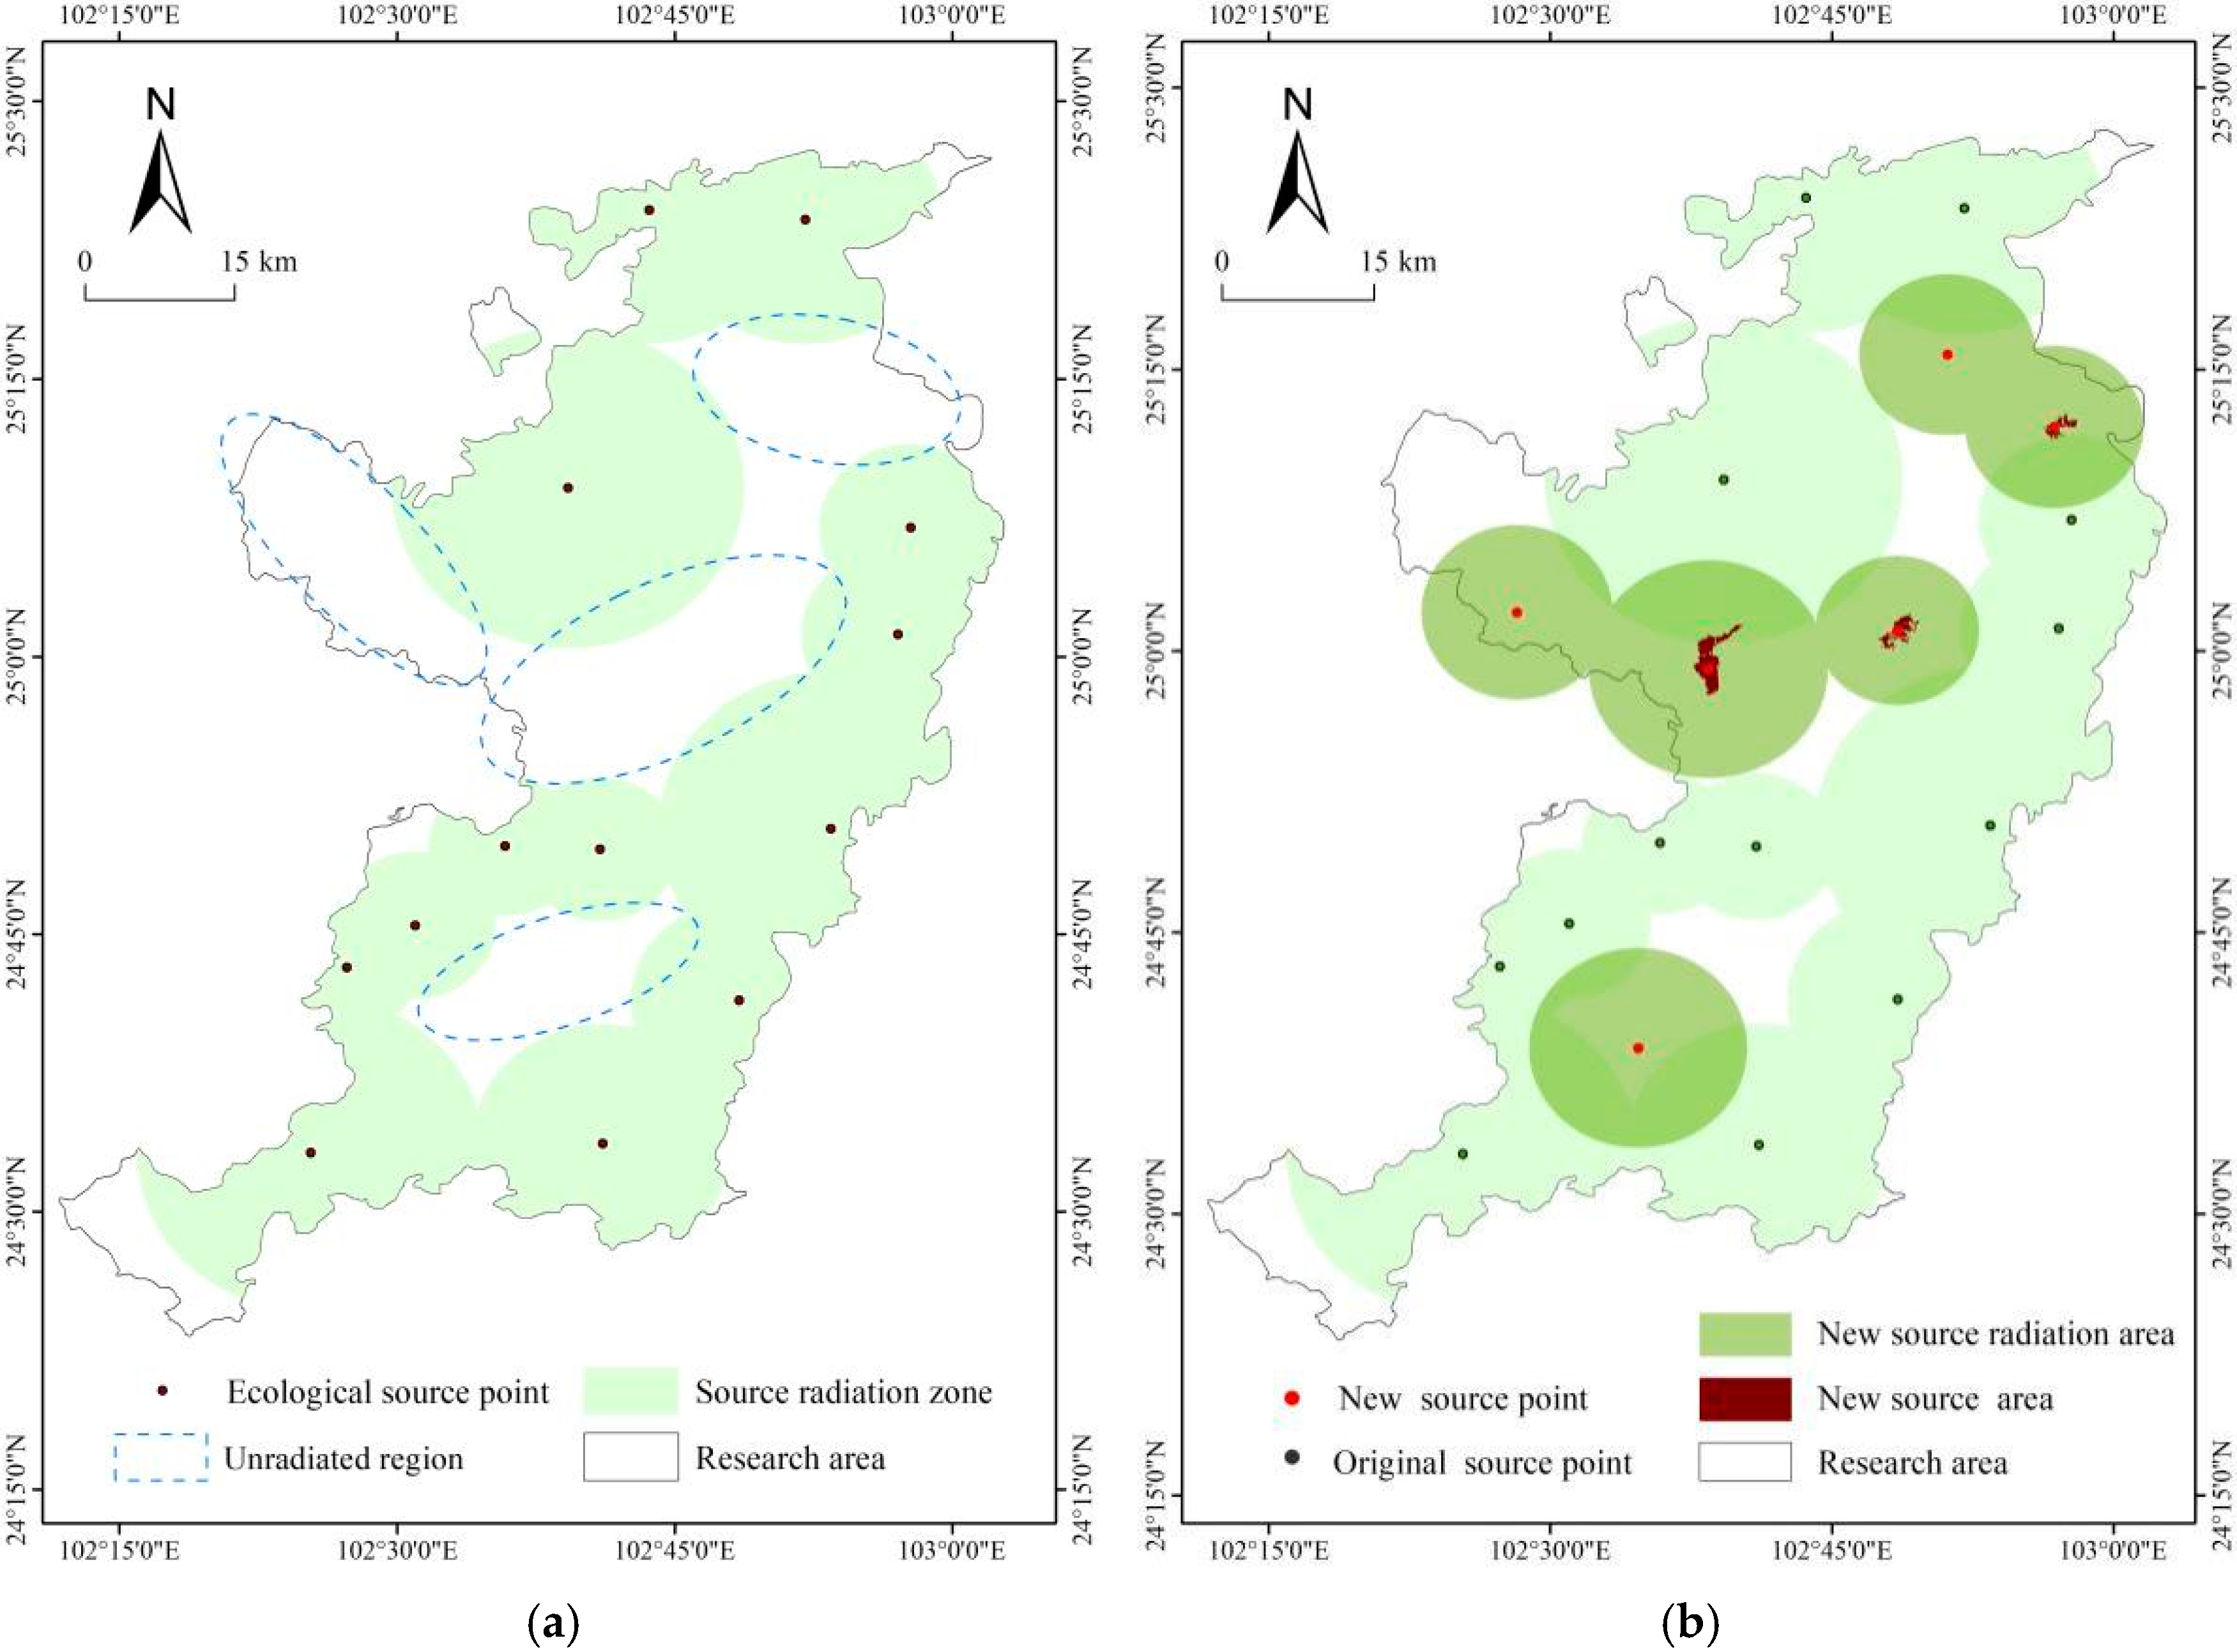
3.3.1. Enhancement of Ecological Patches

Given the current deficiencies in integrity and functionality of the existing ecological network, this study has expanded the network by adding six new ecological patches, each exceeding an area of 1 km2. These newly added patches exhibit a dPC greater than 2 and an IIC exceeding 1. Building upon the foundational 13 ecological patches, the study utilized ArcGIS tools to generate concentric circles centered on the geometric centers of the patches, with radii of 20 km, 15 km, 10 km, and 5 km, respectively. The larger the area of the patch, the greater its radius of influence (see Figure 6a). Neighborhood analysis tools from ArcGIS identified radiative voids within the spatial configuration of the ecological network. By integrating new ecological patches and corridors, and employing a network connectivity model, the study successfully optimized the ecological network of the research area. Figure 6b illustrates the newly added ecological source sites and patches, which include six additional ecological source sites, encompassing a total area of 16.217 km2. The strategic placement and design of these new elements have significantly expanded the coverage of the ecological network, filling ecological gaps in certain areas. The optimized network exhibits enhanced connectivity, with a reduction in isolated nodes, thereby fostering a more robust ecosystem that facilitates increased potential pathways for species migration.

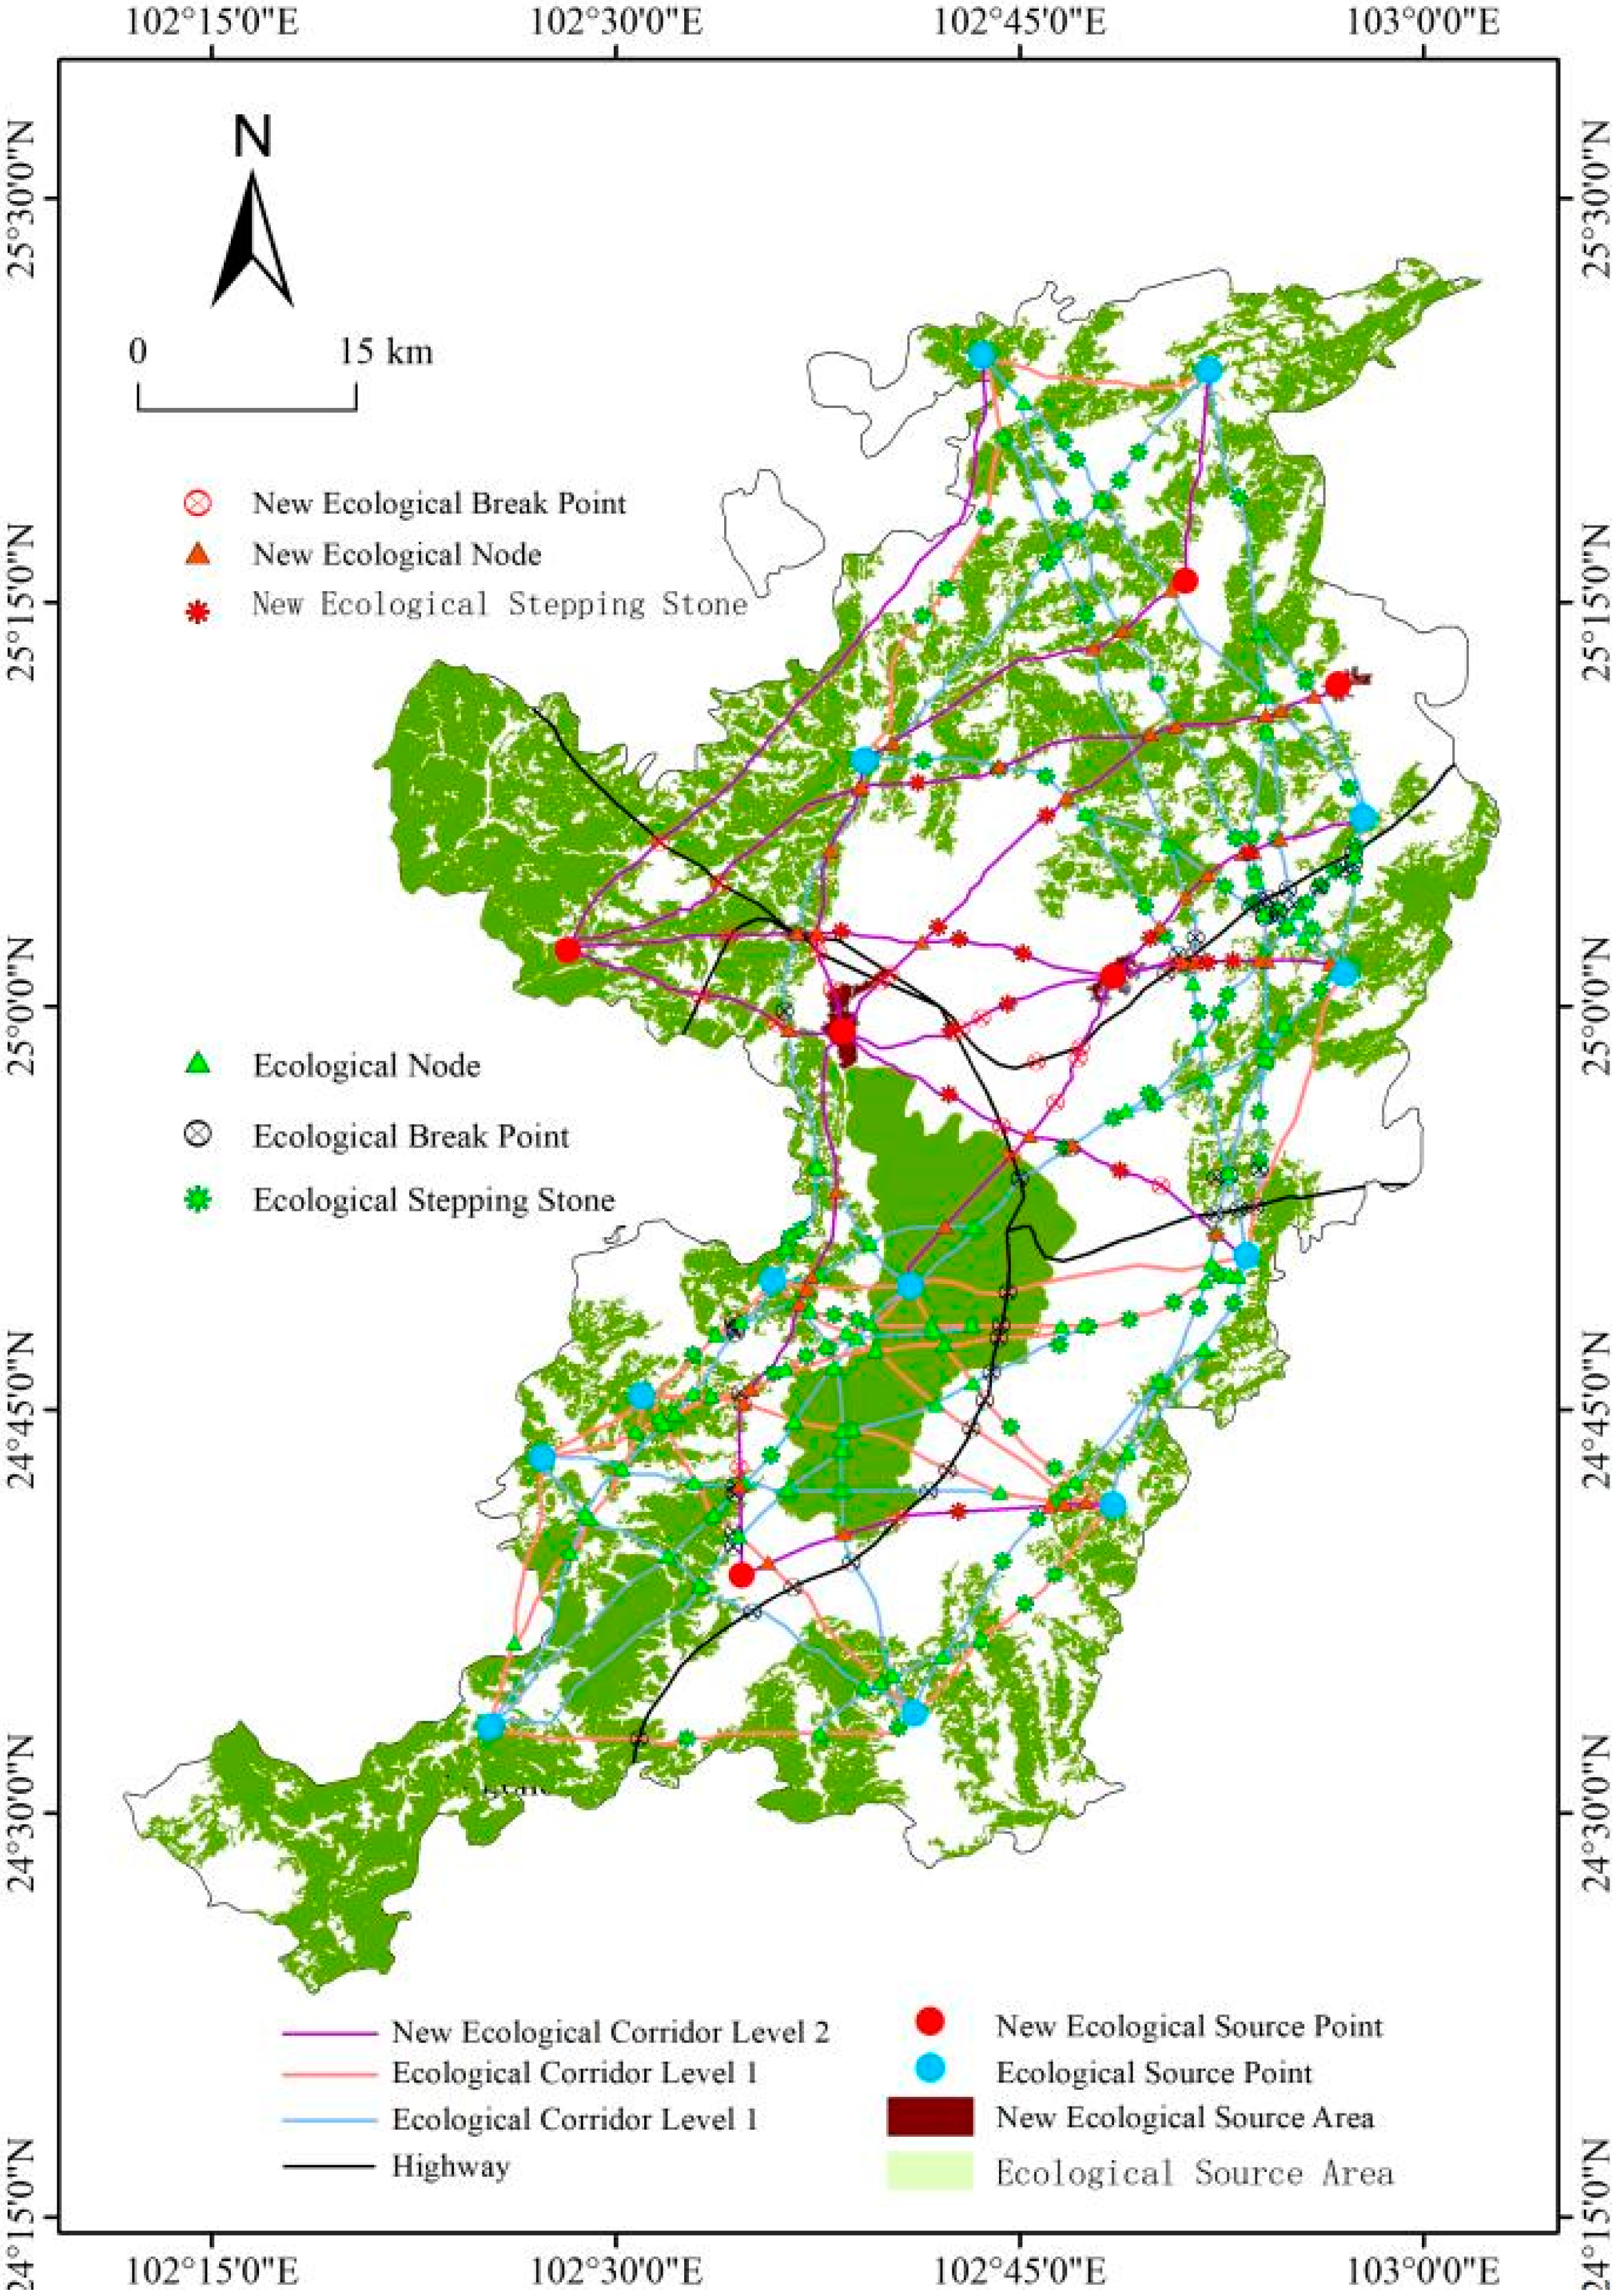
3.3.2. Analysis of New Ecological Corridors

Future planning and construction projects should prioritize the significance of transitional areas by developing ecological corridors to improve the ecological network. Following the addition of new ecological patches and their radiative ranges (illustrated in Figure 6), the study applied the MCR model and the cost-distance method to identify 15 primary ecological corridors and 19 secondary ecological corridors. Furthermore, the analysis recognized 103 ecological nodes and 285 potential ecological corridors, including 11 newly identified secondary corridors. Additionally, after eliminating 13 overlapping corridors, the study employed the gravity model to select 56 corridors that demonstrated strong interactive forces (Figure 7). Ultimately, this culminated in the establishment of an enhanced ecological network for the main urban area of Kunming, significantly improving regional ecological connectivity.

3.3.3. Analysis of Added Ecological Nodes, Stepping Stones, and Breakpoints

To meet the research requirements for constructing ecological security patterns, an analysis was conducted on the ecological nodes, “stepping stones,” and breakpoints within the study area. Figure 8 illustrates the identification of 103 ecological nodes, 70 stepping stones, and 48 ecological breakpoints. In terms of optimizing the ecological network, 51 new ecological nodes and 15 stepping stones were added. Additionally, significant advancements were made in identifying 24 major ecological breakpoints. These optimizations are expected to significantly enhance the connectivity and stability of the ecological network, thus providing more effective support for species migration and ecological processes.

3.3.4. Quantitative Analysis of Network Structure Indices

We employed quantitative analysis using network structure indices to evaluate the ecological corridor network before and after optimization. Table 6 displays the changes in key indicators of the ecological network: the network closure index (α) increased from 8.52 to 9.82, a percentage increase of 15.16%, indicating an increase in network loops that enhances its complexity and robustness. The network connectivity index (β) increased from 13.69 to 17.05, a percentage increase of 24.56%, suggesting that the average number of connective corridors per ecological patch has increased, thereby strengthening the overall connectivity of the network post-optimization. This enhancement facilitates more frequent interactions between nodes, making species migration and ecological processes smoother. The network connectivity rate (γ) increased from 5.39 to 6.35, a percentage change of 17.79%, improving the network’s connectivity. These results demonstrate that the ecological network has significantly improved in terms of connectivity, complexity, and redundancy following optimization.

3.4. Spatial Analysis of the Main Urban Area of Kunming Based on HSA and SDE

Utilizing data on ecological resistance and habitat quality, this study employed HSA and SDE to determine the spatial characteristics of ecological resistance and habitat quality within the designated research area. The habitat quality module of the InVEST model was utilized to calculate the habitat quality of the main urban area of Kunming. The initial step involved the creation of a grid in ArcGIS, dividing the entire main urban area into 500 m × 500 m sections, followed by a spatial statistical analysis of the average resistance values per grid. As depicted in Figure 9a, the spatial hotspots of resistance in Kunming’s urban core (Gi* values exceeding 1.645 at 90%, 1.960 at 95%, or 2.576 at 99%) predominantly exhibit a planar distribution, concentrating in built-up areas, particularly in Wuhua District, Panlong District, and Xishan District. These regions, characterized by their fragile ecological environments and high resistance values, significantly impede ecological processes. Conversely, cold spot areas (Gi* values less than −1.645 at 90%, −1.960 at 95%, or −2.576 at 99%) are primarily located in the northern, western, and southern forested areas of the study region, signifying lower ecological resistance and healthier ecological environments.
Figure 9b illustrates the analysis through SDE, aligning the principal axis of the ellipse with the overall spatial pattern of Dian Lake, indicating that the spatial distribution of ecological resistance is closely associated with the geographical environment of the main urban area of Kunming. When combined with hotspot analysis, the hotspots are primarily located in the central part of the ellipse and along the coastal areas of Dian Lake, whereas the cold spot regions are concentrated in the north, south, and west. The spatial distribution of ecological resistance in Kunming’s main urban area demonstrates a clear imbalance, with significant spatial differentiation between hotspot and cold spot areas. The SDE further corroborates this spatial trend, and its directional characteristics are instrumental in revealing the primary channels of ecological resistance, which is crucial for optimizing the layout of ecological corridors.
Regarding habitat quality, Figure 9c,d display the spatial distribution characteristics of habitat quality in Kunming’s main urban area. Ecological hotspots are predominantly situated on the urban periphery and within natural reserves, while ecological cold spots are more frequently found in areas with dense urbanization, exhibiting a certain degree of spatial segregation. Figure 9d illustrates significant spatial variability in habitat quality distribution, with high-quality habitats mostly concentrated on the periphery of the city or within natural reserves, whereas low-quality habitats appear in the city center and its surrounding areas. This distribution pattern indicates significant changes in Kunming’s ecological environment due to urbanization, with many areas previously characterized by high-quality habitats being replaced by urban expansion.

3.5. Construction of Ecological Security Patterns

In the process of constructing ecological security patterns, this study proposes enhancing the ecological network connectivity and stability in the main urban area of Kunming through the optimization of ecological corridors, selection of key ecological nodes, and integration of ecological functional zones. The core content of building ecological security patterns primarily encompasses the following three aspects:
(1)
Enhancement of Landscape Connectivity: By strategically arranging ecological corridors to connect scattered ecological nodes, a coherent ecological network is formed. This arrangement facilitates species migration and gene flow, thereby reducing the adverse effects of habitat fragmentation.
(2)
Biodiversity Protection: Through zonal protection and effective connectivity of ecological corridors, a comprehensive ecological conservation system has been established. This not only aids in the protection of biodiversity in Kunming and its surrounding areas but also provides suitable habitats for various species, particularly serving as a bridge in species migration and gene exchange.
(3)
Coordination of Urban Development and Ecological Protection: Through rational planning and reservation of ecological spaces, the expansion of urban areas can include ecological spaces, ensuring that ecosystems remain healthy and stable during urbanization processes.
Figure 10 demonstrates the layout of different ecological functional zones. Based on the optimization of the ecological network and spatial analysis, an ecological conservation pattern of “one axis, three zones, and two belts” has been constructed for the main urban area of Kunming, specifically including the following:
“One Axis” refers to the Kunming Built-up Area–Dian Lake Ecological Control Axis: This region forms a north-south ecological restoration axis centered around Dian Lake, extending from the main urban area of Kunming to the Songhua Dam Reservoir and Changchong Mountain in the north, through the northern shore and central city area of Dian Lake, and stretching to the southern shore, Caohai, and Baofeng areas. As the largest freshwater lake on the Yunnan-Guizhou Plateau, Dian Lake possesses significant ecological value. The ecological control axis connects important water sources, wetlands, and mountain ecological resources in Kunming, forming an ecological framework that enhances the overall ecosystem stability and ensures water quality safety in Dian Lake. The central built-up area of Kunming plays a pivotal role within the regional ecological security patterns, enhancing connectivity with other ecological corridors through planning and improvement of the ecological corridor network.
The term “two belts” refers to the Western Ecological Protection Belt and the Eastern Ecological Restoration Belt. (a) The Eastern Ecological Restoration Belt is located on the eastern side of the main urban area of Kunming, positioned between the city and ecological reserves. It connects the Guandu, Chenggong, and Jinning districts and serves as a primary zone for the city’s future expansion. This region includes significant forest ecological source sites such as Panlong Mountain, Mushroom Mountain, Yingpan Mountain, and Zhaojia Mountain. These sites cover a considerable vertical range but currently suffer from weakened ecological connectivity due to urban expansion and industrial impacts. Therefore, they require focused restoration and protection efforts, such as the addition of green corridors and parks. Additionally, the isolation effect of major transportation arteries, including Kunming Changshui International Airport and the Eastern Expressway, exacerbates the fragmentation of the ecosystem. Future strategies could involve restoring damaged ecological environments and recovering biodiversity. (b) The Western Ecological Protection Belt encompasses important mountainous forest ecological source sites, such as Jiner Mountain, Zhizi Mountain, Chessboard Mountain, Demon Wind Mountain, suburban parks, and Sanhua Mountain, as well as aquatic ecological sources like Sanjiacun Reservoir and Minglang Reservoir. Together, these elements form a critical ecological barrier for the western region, providing high-quality ecological services to the main urban area of Kunming. They play a vital role particularly in water conservation, climate regulation, and maintaining biodiversity.
The “Five Zones” framework encompasses the Ecological Conservation Area (ECA), Biodiversity Conservation Area (BCA), Ecological Control Area (ECTA), Water Conservation Area (WCA), and Ecological Restoration Area (ERA).
(a)
The Ecological Conservation Area is subdivided into three regions: the Northern Ecological Conservation Area (ECA-I), the Northwestern Ecological Conservation Area (ECA-II), and the Southern Ecological Conservation Area (ECA-III). These areas are located on the western side of Xishan and Qipan Mountain as well as in the southern part of the Jinning District and around Luopashan. They include significant forest ecological sources such as Changzishan and Shiyangquanshan, as well as aquatic ecological sources such as Songhuaba Reservoir and Panlong River. However, due to frequent human activities, these regions exhibit weaker ecological connections with other main urban areas, posing challenges to the construction of ecological corridors. These areas are prioritized for future urban greenway development and regional ecological protection.
(b)
The Biodiversity Conservation Area includes the Northern Biodiversity Conservation Area (BCA-I) and the Southern Biodiversity Conservation Area (BCA-II), primarily located around Dian Lake, Songhuaba Reservoir, Xishan, and Changchongshan. As core zones for biodiversity protection, these regions are minimally affected by development, thereby maintaining high ecological quality and experiencing less ecological fragmentation. It is crucial to focus on protecting biodiversity within these areas.
(c)
The Ecological Control Area (ECTA, I-IV) encompasses areas around Songhuaba Reservoir, the Xishan mountain range, Dian Lake, and adjacent wetlands in the northern part of Kunming. Urban expansion has led to spatial conflicts between urban construction and ecological preservation, resulting in increased ecological fragmentation, decreased ecological connectivity, and reduced biodiversity. Addressing these challenges requires planning and constructing ecological corridors through landscape connectivity analysis, along with delineating core protection zones, ecological buffer zones, and reasonable development areas to balance ecological preservation with urban growth.
(d)
The Water Conservation Area (WCA) is situated in the southern part of Kunming, primarily around Dian Lake and its surrounding regions. This area plays a crucial role in maintaining a stable water supply and ensuring water quality in Kunming. It is imperative that the government clearly defines the boundaries of this conservation area, prohibits destructive development, and implements vegetation restoration and soil conservation projects to minimize human disturbances.
(e)
The Ecological Restoration Area (ERA, I-IV) is mainly located along the eastern shore of Dian Lake, Luolong River, Jinmashan, and Changposhan, creating multiple ecological nodes in the Guandu and Chenggong districts. This area forms the “core zone” of the ecological network. By integrating the ecological restoration areas of Jinmashan and the eastern shore of Dian Lake, ecological corridors are constructed to connect the biodiversity conservation areas and the water conservation area. From the northern region of Hongshan-Changposhan to the southern region of the eastern shore of Dian Lake-Luolong, the ecological restoration areas establish a vital ecological restoration axis, enhancing the connectivity between the main urban area of Kunming and the eastern natural ecosystems.

4. Discussion

4.1. Construction and Optimization of the Ecological Network

This study employed the MSPA-MCR model to construct an ecological network for the main urban area of Kunming. Within the study region, 13 ecological source sites were identified, encompassing a total area of 2102.89 km2, which represents 45.58% of the total study area. Following optimization, six additional ecological source sites were incorporated, increasing the total area by 16.22 km2 and achieving a more balanced distribution of ecological source sites. The number of potential ecological corridors increased significantly from 178 to 324. Specifically, 11 new secondary ecological corridors were added, enhancing the overall network’s connectivity. Furthermore, the quantities of ecological nodes, stepping stones, and ecological breakpoints also increased; ecological nodes rose from 103 to 154, stepping stones from 70 to 85, and ecological breakpoints from 48 to 72. These enhancements indicate that the optimization measures improved the continuity and repair capacity of the ecological network. In terms of the structural indices of the ecological network, the network closure index (α) increased by 15.16%, the network connectivity index (β) increased by 24.56%, and the network connectivity rate (γ) increased by 17.79%. These improvements suggest that the connectivity of the ecological network was significantly enhanced post-optimization, leading to a more robust overall structure. In summary, the optimization of the ecological network resulted in improved distribution of ecological source sites, layout of ecological corridors, and adjustments in nodes and breakpoints, substantially enhancing the ecological connectivity and stability of the system.

4.2. Construction and Optimization of Ecological Security Patterns

This study has developed “One Axis, Two Belts, Three Zones” ecological security patterns based on the construction and optimization of ecological networks and spatial analysis, integrating HSA and SDE spatial analysis techniques. The objective is to address the challenges posed by urbanization and the necessity for ecological protection. The ecological control axis connects Dian Lake with the surrounding ecological regions, forming a north-south ecological restoration axis. This not only helps improve the water quality safety of Dian Lake but also enhances the stability of the regional ecosystem, elevates the ecological services of wetlands, and ensures water source safety.
In the planning of the “Two Belts,” the eastern ecological restoration belt faces pressures from urban expansion and transportation infrastructure development, necessitating the strengthening of ecological restoration through green corridors and parks to enhance ecological connectivity. Conversely, the western ecological protection belt utilizes topographical barriers to safeguard the relatively intact ecological environment, with plans for future greenway constructions to further enhance ecological service functions. The “Three Zones” division refines the ecological protection and restoration layout within the main urban area of Kunming, prioritizing the protection of ecological resources, especially the water conservation areas, which play a critical role in water supply and water quality purification. The ecological restoration zones provide effective pathways for restoring ecological connectivity and repairing damaged ecosystems.

4.3. Limitations of the Study

Despite the significant achievements in optimizing ecological networks and constructing ecological security patterns, this study still faces several limitations:
(a)
Data Limitations: The research primarily relies on remote sensing data and GIS analysis from the year 2020. Future studies should integrate more dynamic data, such as long-term ecological monitoring data, to enhance the timeliness and precision of ecological network modeling.
(b)
Model Limitations: Although the MSPA-MCR model effectively simulates ecological networks, it incorporates certain simplifying assumptions during the calculation of ecological connectivity, such as neglecting species behavioral characteristics and dynamic migration patterns.
(c)
Human Factors: The study has not sufficiently accounted for potential future urban expansion, policy changes, or other human factors that could significantly impact ecological networks and security patterns. Future research could incorporate urban growth simulations (e.g., CA-Markov models) and socio-economic factor analysis to improve the scientific rigor of ecological planning.

5. Conclusions

This study, based on the MSPA-MCR model, has optimized the ecological network of Kunming’s main urban area, incorporating HSA and standard deviational ellipse for spatial analysis, and established an ecological security pattern comprising “one axis, two belts, and three zones.” The principal conclusions are as follows:
(1)
The optimization of the ecological network significantly improved regional ecological connectivity. The number of ecological source sites increased from 13 to 19, and 146 new ecological corridors were added, thereby enhancing the overall connectivity of the optimized ecological network.
(2)
The application of spatial analysis methods enhanced the scientific validity of the ecological security patterns. Ecological resistance analysis identified high resistance areas primarily concentrated in the Wuhua, Panlong, and Guandu districts, indicating a need for intensified ecological restoration.
(3)
The “one axis, two belts, and three zones” ecological security pattern provides a strategic framework for ecological optimization. Focused efforts on ecological restoration in the Dian Lake watershed, optimization of ecological corridors, protection of biodiversity, and enhancement of regional ecological security are recommended.
The approach proposed in this study of combining MSPA-MCR with spatial analysis offers significant theoretical support for ecological conservation and sustainable development in the main urban area of Kunming. It can also serve as a reference for ecological security planning in other highland and mountainous urban areas. Future research should explore potential applications of this method in other ecosystems, such as the urban heat island effect. Additionally, further integration of dynamic ecological data and human activity factors is necessary to enhance the precision of ecological network optimization and security pattern construction, thereby supporting more scientifically informed ecological planning and sustainable urban development.

Author Contributions

Methodology, conceptualization, W.C. and G.C.; software, W.C. and Q.C.; validation, W.C. and J.Z.; supervision, Y.L. and G.C.; resources, G.C. and J.Z.; data curation, W.C.; writing—original draft, G.C. and H.Y.; writing—review and editing, H.Y. and W.C.; project administration, G.C.; funding acquisition, G.C., Y.L. and J.Z. All authors have read and agreed to the published version of the manuscript.

Funding

This research was funded by the National Natural Science Foundation of China, under the project titled “Study on multi-scale coupling and multi-objective collaborative optimization of the production-living-ecological space of the urban agglomeration in central Yunnan” (grant number: 42301304); the Yunnan Provincial Basic Research Program, under the project titled “Identification of Territorial Spatial Characteristics and Pattern Optimization and Reconstruction of the urban agglomeration in central Yunnan from a Functional Zoning Perspective” (grant number: 202201AU070112); and the State Key Laboratory of Geo-Information Engineering and Key Laboratory of Surveying and Mapping Science and Geospatial Information Technology of MNR, CASM, under the project titled “Multi-scenario Simulation of Ecosystem Services in Plateau Mountainous Areas Based on Land Use and Climate Change“ (grant number: No. 2024-04-14).

Institutional Review Board Statement

Not applicable.

Informed Consent Statement

Not applicable.

Data Availability Statement

Data are contained within the article. The data used to support the findings of this study are available from the first author upon request.

Acknowledgments

We thank the editors and anonymous reviewers who provided comments and suggestions for further improvement; in addition, Wendi Chen would like to thank Guangzhao Wu, Ruiyuan Wang, and Taohui Li for their strong support of this work.

Conflicts of Interest

The authors declare no conflicts of interest.

References

  1. Wang, Y.; Li, X.; Zhang, F.; Wang, W.; Xiao, R. Effects of rapid urbanization on ecological functional vulnerability of the land system in Wuhan, China: A flow and stock perspective. J. Clean. Prod. 2020, 248, 119284. [Google Scholar] [CrossRef]
  2. Chen, X.; Yang, Z.; Wang, T.; Han, F. Landscape Ecological Risk and Ecological Security Pattern Construction in World Natural Heritage Sites: A Case Study of Bayinbuluke, Xinjiang, China. ISPRS Int. J. Geo-Inf. 2022, 11, 328. [Google Scholar] [CrossRef]
  3. Tang, F.; Wang, L.; Guo, Y.; Fu, M.; Huang, N.; Duan, W.; Luo, M.; Zhang, J.; Li, W.; Song, W. Spatio-temporal variation and coupling coordination relationship between urbanisation and habitat quality in the Grand Canal, China. Land Use Policy 2022, 117, 106119. [Google Scholar] [CrossRef]
  4. He, H.; Yu, X.; Yu, H.; Ma, Z.; Luo, Y.; Liu, T.; Rong, Z.; Xu, J.; Chen, D.; Li, P.; et al. Suitable habitat evaluation and ecological security pattern optimization for the ecological restoration of Giant Panda habitat based on nonstationary factors and MCR model. Ecol. Model. 2024, 494, 110760. [Google Scholar] [CrossRef]
  5. Xu, Y.; Liu, Y.; Sun, Q.; Qi, W. Construction of Cultivated Land Ecological Network Based on Supply and Demand of Ecosystem Services and MCR Model: A Case Study of Shandong Province, China. Sustainability 2024, 16, 3745. [Google Scholar] [CrossRef]
  6. Liu, P.-X.; Liu, Y.; Li, T.-N.; Guo, W.-W.; Yang, A.-L.; Yang, X.; Li, E.-Z.; Wang, Z.-J. Identification and Trend Analysis of Ecological Security Pattern in Mudanjiang City Based on MSPA-MCR-PLUS Model. Sustainability 2024, 16, 9690. [Google Scholar] [CrossRef]
  7. Zhang, R.; Wang, C.; Xiong, Y. Ecological security assessment of China based on the Pressure-State-Response framework. Ecol. Indic. 2023, 154, 110647. [Google Scholar] [CrossRef]
  8. Li, X.; Xiao, L.; Tian, C.; Zhu, B.; Chevallier, J. Impacts of the ecological footprint on sustainable development: Evidence from China. J. Clean. Prod. 2022, 352, 131472. [Google Scholar] [CrossRef]
  9. Lai, S.; Sha, J.; Eladawy, A.; Li, X.; Wang, J.; Kurbanov, E.; Lin, Z.; Wu, L.; Han, R.; Su, Y.C. Evaluation of ecological security and ecological maintenance based on pressure-state-response (PSR) model, case study: Fuzhou city, China. Hum. Ecol. Risk Assess. 2022, 28, 734–761. [Google Scholar] [CrossRef]
  10. Feng, M.; Zhao, W.; Zhang, T. Construction and optimization strategy of county ecological infrastructure network based on MCR and gravity model—A case study of langzhong county in sichuan province. Sustainability 2023, 15, 8478. [Google Scholar] [CrossRef]
  11. Liu, J.; Chen, J.; Yang, Y.; You, H.; Han, X. Construction and optimization of an ecological network in the Yellow River Source Region Based on MSPA and MCR Modelling. Int. J. Environ. Res. Public Health 2023, 20, 3724. [Google Scholar] [CrossRef] [PubMed]
  12. Wang, S.; Li, W.; Li, Q.; Wang, J. Ecological security pattern construction in Beijing-Tianjin-Hebei region based on hotspots of multiple ecosystem services. Sustainability 2022, 14, 699. [Google Scholar] [CrossRef]
  13. Yan, Y.; Ju, H.; Zhang, S.; Chen, G. The construction of ecological security patterns in coastal areas based on landscape ecological risk assessment—A case study of Jiaodong Peninsula, China. Int. J. Environ. Res. Public Health 2021, 18, 12249. [Google Scholar] [CrossRef] [PubMed]
  14. Xu, J.; Fan, F.; Liu, Y.; Dong, J.; Chen, J. Construction of ecological security patterns in nature reserves based on ecosystem services and circuit theory: A case study in Wenchuan, China. Int. J. Environ. Res. Public Health 2019, 16, 3220. [Google Scholar] [CrossRef]
  15. Sun, D.; Wu, X.; Wen, H.; Ma, X.; Zhang, F.; Ji, Q.; Zhang, J. Ecological security pattern based on XGBoost-MCR model: A case study of the three gorges reservoir region. J. Clean. Prod. 2024, 470, 143252. [Google Scholar] [CrossRef]
  16. Dong, X.; Wang, F.; Fu, M. Research progress and prospects for constructing ecological security pattern based on ecological network. Ecol. Indic. 2024, 168, 112800. [Google Scholar] [CrossRef]
  17. Liu, C.; Li, W.; Xu, J.; Zhou, H.; Li, C.; Wang, W. Global trends and characteristics of ecological security research in the early 21st century: A literature review and bibliometric analysis. Ecol. Indic. 2022, 137, 108734. [Google Scholar] [CrossRef]
  18. Tang, F.; Zhou, X.; Wang, L.; Zhang, Y.; Fu, M.; Zhang, P. Linking ecosystem service and MSPA to construct landscape ecological network of the Huaiyang Section of the Grand Canal. Land 2021, 10, 919. [Google Scholar] [CrossRef]
  19. Teng, M.; Wu, C.; Zhou, Z.; Lord, E.; Zheng, Z. Multipurpose greenway planning for changing cities: A framework integrating priorities and a least-cost path model. Landsc. Urban Plan. 2011, 103, 1–14. [Google Scholar] [CrossRef]
  20. Mohammadpour, N.; Jahanishakib, F.; Asadolahi, Z. Development of sustainable protection of biodiversity using modeling corridors of the landscape based on circuit theory. Geogr. Environ. Sustain. 2023, 13, 55–68. [Google Scholar]
  21. Machado-Stredel, F.; Cobos, M.E.; Peterson, A.T. A simulation-based method for selecting calibration areas for ecological niche models and species distribution models. Front. Biogeogr. 2021, 13, e48814. [Google Scholar] [CrossRef]
  22. Lumia, G.; Pratico, S.; Di Fazio, S.; Cushman, S.; Modica, G. Combined use of urban Atlas and Corine land cover datasets for the implementation of an ecological network using graph theory within a multi-species approach. Ecol. Indic. 2023, 148, 110150. [Google Scholar] [CrossRef]
  23. Li, M.; Zhang, Z.; Liu, X.; Hui, Y. Multi-scenario analysis of land space based on PLUS and MSPA. Environ. Monit. Assess. 2023, 195, 817. [Google Scholar] [CrossRef]
  24. Feng, X.; Du, Z.; Tao, P.; Liang, H.; Wang, Y.; Wang, X. Construction of Green Space Ecological Network in Xiongan New Area Based on the MSPA–InVEST–MCR Model. Appl. Sci. 2024, 14, 10760. [Google Scholar] [CrossRef]
  25. Wei, Q.; Halike, A.; Yao, K.; Chen, L.; Balati, M. Construction and optimization of ecological security pattern in Ebinur Lake Basin based on MSPA-MCR models. Ecol. Indic. 2022, 138, 108857. [Google Scholar] [CrossRef]
  26. Wu, Y.; Han, Z.; Meng, J.; Zhu, L. Circuit theory-based ecological security pattern could promote ecological protection in the Heihe River Basin of China. Environ. Sci. Pollut. Res. 2023, 30, 27340–27356. [Google Scholar] [CrossRef]
  27. Tang, H.; Peng, J.; Jiang, H.; Lin, Y.; Dong, J.; Liu, M.; Meersmans, J. Spatial analysis enables priority selection in conservation practices for landscapes that need ecological security. J. Environ. Manag. 2023, 345, 118888. [Google Scholar] [CrossRef] [PubMed]
  28. Chen, Y. An analytical process of spatial autocorrelation functions based on Moran’s index. PLoS ONE 2021, 16, 249589. [Google Scholar] [CrossRef]
  29. Anselin, L. Spatial econometrics. Handb. Spatial Anal. Soc. Sci. 2022, 588, 101–122. [Google Scholar] [CrossRef]
  30. Le, K.G.; Liu, P.; Lin, L.T. Traffic accident hotspot identification by integrating kernel density estimation and spatial autocorrelation analysis: A case study. Int. J. Crashworthiness 2022, 27, 543–553. [Google Scholar] [CrossRef]
  31. Zhang, F.; Jia, Y.; Liu, X.; Li, T.; Gao, Q. Application of MSPA-MCR models to construct ecological security pattern in the basin: A case study of Dawen River basin. Ecol. Indic. 2024, 160, 111887. [Google Scholar] [CrossRef]
  32. Zhang, Y.; Zhao, Z.; Fu, B.; Ma, R.; Yang, Y.; Lü, Y.; Wu, X. Identifying ecological security patterns based on the supply, demand and sensitivity of ecosystem service: A case study in the Yellow River Basin, China. J. Environ. Manag. 2022, 315, 115158. [Google Scholar] [CrossRef] [PubMed]
  33. Wang, J.; Zhou, W.; Pickett, S.T.; Yu, W.; Li, W. A multiscale analysis of urbanization effects on ecosystem services supply in an urban megaregion. Sci. Total Environ. 2019, 662, 824–833. [Google Scholar] [CrossRef]
  34. Xu, W.; Wang, J.; Zhang, M.; Li, S. Construction of landscape ecological network based on landscape ecological risk assessment in a large-scale opencast coal mine area. J. Clean. Prod. 2021, 286, 125523. [Google Scholar] [CrossRef]
  35. Liu, Y.; Lu, Y.; Xu, D.; Zhou, H.; Zhang, S. Enhancing the MSPA method to incorporate ecological sensitivity: Construction of ecological security patterns in Harbin city. Sustainability 2024, 16, 2875. [Google Scholar] [CrossRef]
  36. Carroll, C.; Hoban, S.; Ray, J.C. Lessons from COP15 on effective scientific engagement in biodiversity policy processes. Conserv. Biol. 2024, 38, e14192. [Google Scholar] [CrossRef]
  37. Huigang, L.; Cui, H.; Xiaoli, Z.; Zhiming, Y. Significance of and outlook for the Biosecurity Law of the People’s Republic of China. J. Biosaf. Biosecur. 2021, 3, 46–50. [Google Scholar] [CrossRef]
  38. Qin, J.Z.; Dai, J.P.; Li, S.H.; Zhang, J.Z.; Peng, J.S. Construction of ecological network in Qujing city based on MSPA and MCR models. Sci. Rep. 2024, 14, 9800. [Google Scholar] [CrossRef]
  39. Huang, X.; Wang, H.; Shan, L.; Xiao, F. Constructing and optimizing urban ecological network in the context of rapid urbanization for improving landscape connectivity. Ecol. Indic. 2021, 132, 108319. [Google Scholar] [CrossRef]
  40. Luo, J.; Zhu, L.; Fu, H. Construction of wetland ecological network based on MSPA-Conefor-MCR: A case study of Haikou City. Ecol. Indic. 2024, 166, 112329. [Google Scholar] [CrossRef]
  41. Chen, W.; Liu, H.; Wang, J. Construction and optimization of regional ecological security patterns based on MSPA-MCR-GA Model: A case study of Dongting Lake Basin in China. Ecol. Indic. 2024, 165, 112169. [Google Scholar] [CrossRef]
  42. Ding, M.; Liu, W.; Xiao, L.; Zhong, F.; Lu, N.; Zhang, J.; Zhang, Z.; Xu, X.; Wang, K. Construction and optimization strategy of ecological security pattern in a rapidly urbanizing region: A case study in central-south China. Ecol. Indic. 2022, 136, 108604. [Google Scholar] [CrossRef]
  43. Cui, L.; Wang, J.; Sun, L.; Lv, C. Construction and optimization of green space ecological networks in urban fringe areas: A case study with the urban fringe area of Tongzhou district in Beijing. J. Clean. Prod. 2020, 276, 124266. [Google Scholar] [CrossRef]
  44. Wang, R.Y.; Mo, X.; Ji, H.; Zhu, Z.; Wang, Y.S.; Bao, Z.; Li, T. Comparison of the CASA and InVEST models’ effects for estimating spatiotemporal differences in carbon storage of green spaces in megacities. Sci. Rep. 2024, 14, 5456. [Google Scholar] [CrossRef]
  45. Zeng, W.; Tang, H.; Liang, X.; Hu, Z.; Yang, Z.; Guan, Q. Using ecological security pattern to identify priority protected areas: A case study in the Wuhan Metropolitan Area, China. Ecolo. Indic. 2023, 148, 110121. [Google Scholar] [CrossRef]
Figure 1. Geographical location of the study area.
Sustainability 17 03623 g001
Figure 2. Diagram of the study.
Sustainability 17 03623 g002
Figure 3. (ad) represent the resistance values of CLCD, slope, IBI, and DEM, respectively; (eh) represent the resistance values of FVC, distance to species distribution, distance to roads, and distance to railways, respectively.
Sustainability 17 03623 g003
Figure 4. Composite resistance surface in the study area.
Sustainability 17 03623 g004
Figure 5. Interaction force heatmap based on the gravity model.
Sustainability 17 03623 g005
Figure 6. (a) shows the radiation range of ecological source areas in the study area and the non-radiated areas. (b) Newly added ecological patches in the study area.
Sustainability 17 03623 g006
Figure 7. (a) shows the spatial distribution of newly added ecological corridors, (b) shows the ecological patches in the study area.
Sustainability 17 03623 g007
Figure 8. New ecological nodes, stepping stones, and breakpoints in the study area.
Sustainability 17 03623 g008
Figure 9. (a,c) respectively represent the hot spot analysis of resistance surface and habitat quality, while fig (b,d) respectively represent the direction distribution of resistance surface and habitat quality.
Sustainability 17 03623 g009
Figure 10. Ecological security pattern in the main urban area of Kunming.
Sustainability 17 03623 g010
Table 1. General information on datasets used in this study.
DataReference YearSpatial ResolutionSource
IBI202030 mGoogle Earth Engine
(https://code.earthengine.google.com/, accessed on 5 January 2025)
FVC202030 mGoogle Earth Engine
(https://code.earthengine.google.com/, accessed on 5 January 2025)
Land cover 202030 mResource and Environment Data Center, Chinese Academy of Sciences (http://www.resdc.cn/, accessed on 5 January 2025)
DEM202030 mGeospatial Data Cloud (http://www.gscloud.cn/, accessed on 5 January 2025)
Slope202030 mCalculated using DEM data in ArcGIS 10.8 software
Species distribution202030 mResource and Environment Data Center, Chinese Academy of Sciences (http://www.resdc.cn/, accessed on 5 January 2025)
roads202030 mOpen Street Map
(http://www.openstreetmap.org, accessed on 5 January 2025)
rivers202030 m
Table 2. Evaluation system of resistance factor assignment.
Resistance
Factor
Classification
Criteria
Resistance
Value
WeightResistance
Factor
Classification
Criteria
Resistance
Value
Weight
Land use typeForest Grassland10.3459Distance to species distribution/(m)0–10010.0892
Arable land 3100–3003
Water5300–5005
Bare land7500–7007
Impervious surface9>7009
Slope/(°)0–610.1209Distance to roads/(m)0–5090.0588
6–13350–1007
13–205100–2005
20–307200–3003
>309>3001
DEM/m<170010.1103Distance to railways/(m)0–5090.0588
1700–1900350–1007
1900–21005100–2005
2100–23007200–3003
>23009>3001
IBI<0.210.1101FVC<0.290.106
0.2–0.430.2–0.47
0.4–0.650.4–0.65
0.6–0.870.6–0.83
>0.89>0.81
Table 3. The maximum impact distance and weight of habitat threat factors.
Threat FactorWeightMaximum Impact Distance (km)Decay Type
Farmland0.60.5Linear Decay
Urban Land12Exponential Decay
Rural Settlements0.81Exponential Decay
Road Land0.61.5Exponential Decay
Railway Land0.81.5Exponential Decay
Table 4. Habitat suitability and sensitivity of threat factors for different land use types.
Land Use TypeHabitat SuitabilityFarmlandUrban LandRural Settlements RoadRoadRailway
Paddy Field0.50.30.70.60.50.5
Dry Land0.50.30.60.60.50.5
Forested Land10.80.850.90.60.6
Shrubland10.50.60.650.50.5
Sparse Forest0.950.90.80.90.70.7
Other Forest0.950.90.850.850.70.7
High Coverage Grassland0.80.60.60.550.30.3
Medium Coverage Grassland0.70.550.70.50.30.3
Low Coverage Grassland0.60.50.60.50.40.4
River and Ditch0.90.60.60.50.30.3
Lake0.90.650.750.650.40.4
Reservoir and Pond0.70.50.80.50.60.6
Shoreland0.60.60.60.60.50.5
Urban Land000000
Rural Settlement000000
Other Construction Land000000
Gobi Desert00.10000
Marshland00.10000
Bare Land00.10.100.10.1
Table 5. Ecological source landscape connectivity.
NodeIICdPCdANodeIICdPCdA
11.121.280.18172.242.670.37
23.453.771.04180.150.200.23
30.751.650.36190.851.360.19
41.231.360.18200.140.200.14
59.4210.154.83214.524.022.01
61.782.030.19225.876.022.24
70.931.830.63235.325.553.05
81.011.330.20241.992.250.65
90.270.300.202532.1431.5514.22
103.603.820.61261.051.260.15
112.873.080.25275.986.202.37
121.591.760.23281.351.570.31
131.021.280.192914.4914.717.54
1472.4169.1636.25300.560.610.17
151.341.840.413126.4627.8315.56
169.0710.495.05
Table 6. Ecological network structure indices.
Ecological NetworkNumber of Ecological Patches (Q)Number of Potential Ecological Corridors (S)Network Closure Index (α)Network Connectivity Index (β)Network Connectivity Rate Index (γ)
Before Optimization131788.52413.6925.394
After Optimization193249.81817.0526.353
Percentage Change+46.15%+82.02%+15.16%+24.56%+17.79%
Disclaimer/Publisher’s Note: The statements, opinions and data contained in all publications are solely those of the individual author(s) and contributor(s) and not of MDPI and/or the editor(s). MDPI and/or the editor(s) disclaim responsibility for any injury to people or property resulting from any ideas, methods, instructions or products referred to in the content.

