Article

Digital Commerce as a Catalyst for Ecological Transformation: Evidence from China’s Manufacturing Sector

General Graduate School, Dongshin University, Naju-si 58245, Jeollanam-do, Republic of Korea
*
Author to whom correspondence should be addressed.
Sustainability 2025, 17(8), 3600; https://doi.org/10.3390/su17083600
Submission received: 11 March 2025 / Revised: 8 April 2025 / Accepted: 14 April 2025 / Published: 16 April 2025
(This article belongs to the Special Issue Ecodesign of Products and Sustainable Manufacturing)

Abstract

:
The ecological transformation of industrial enterprises is crucial for promoting sustainable development, improving energy efficiency, and boosting environmental quality. This study provides empirical insights into the relationship between digital commerce and the ecological transformation of manufacturing firms, using panel data from Chinese A-share-listed manufacturing businesses from 2011 to 2021. The findings demonstrate that digital commerce significantly accelerates the environmental transition of manufacturing firms, particularly within established organizations, competitive sectors, and non-renewable energy industries. Mechanism analysis reveals that advancements in digital commerce improve the breadth, quality, and sustainability of green technology innovation. Examining threshold effects identifies a distinct threshold in the cumulative impact of green technological improvements, beyond which digital commerce facilitates the ecological transition of industrial firms. Manufacturing enterprises need to optimize the use of digital tools and provide more efficient solutions around resource allocation, so as to gain an advantageous position in the green supply chain.

1. Introduction

With the seriousness of environmental problems, a large number of countries began to carry out green transformation. Among them, industrial pollution accounts for the largest proportion, and the economic intensity of industrial activities is stronger. Governments should promote the green transformation (GT) of industrial companies to see high-quality green economic growth [1]. Given that the world’s resources are dwindling and the environment is changing, this is essential. China has prioritized transitioning to a more sustainable industrial process over the past few years [2]. There is an immediate need to reorganize China’s industrial sector and significantly reduce energy consumption and pollution levels; this is something that the Made in China (2025) program recognizes. Theoretically sound and pragmatically orientated, these development plans provide the groundwork for the long-term success of China’s manufacturing sector. Increasing the GT of manufacturing companies is crucial from a strategic perspective, which should not be surprising. From a macroeconomic perspective, global trade is advantageous since it encourages both strong economic growth and global environmental protection [3], it satisfies the desire for sustainable social and economic development on a worldwide scale, and it gives national governments more influence in international ecological governance [4]. Also, manufacturing companies’ GT promotes innovation and facilitates entry into new worldwide markets [5]. From a macro perspective, GT in manufacturing strengthens the labor market and creates good jobs. The fact that GT creates employment lends credence to this. Eliminating industrial pollution can substantially improve people’s quality of life. At the micro level, GT helps industrial firms reduce production-related pollutants and energy usage. This has several benefits, including increased resource efficiency, better market competitiveness, more straightforward company collaboration, and fewer environmental costs [
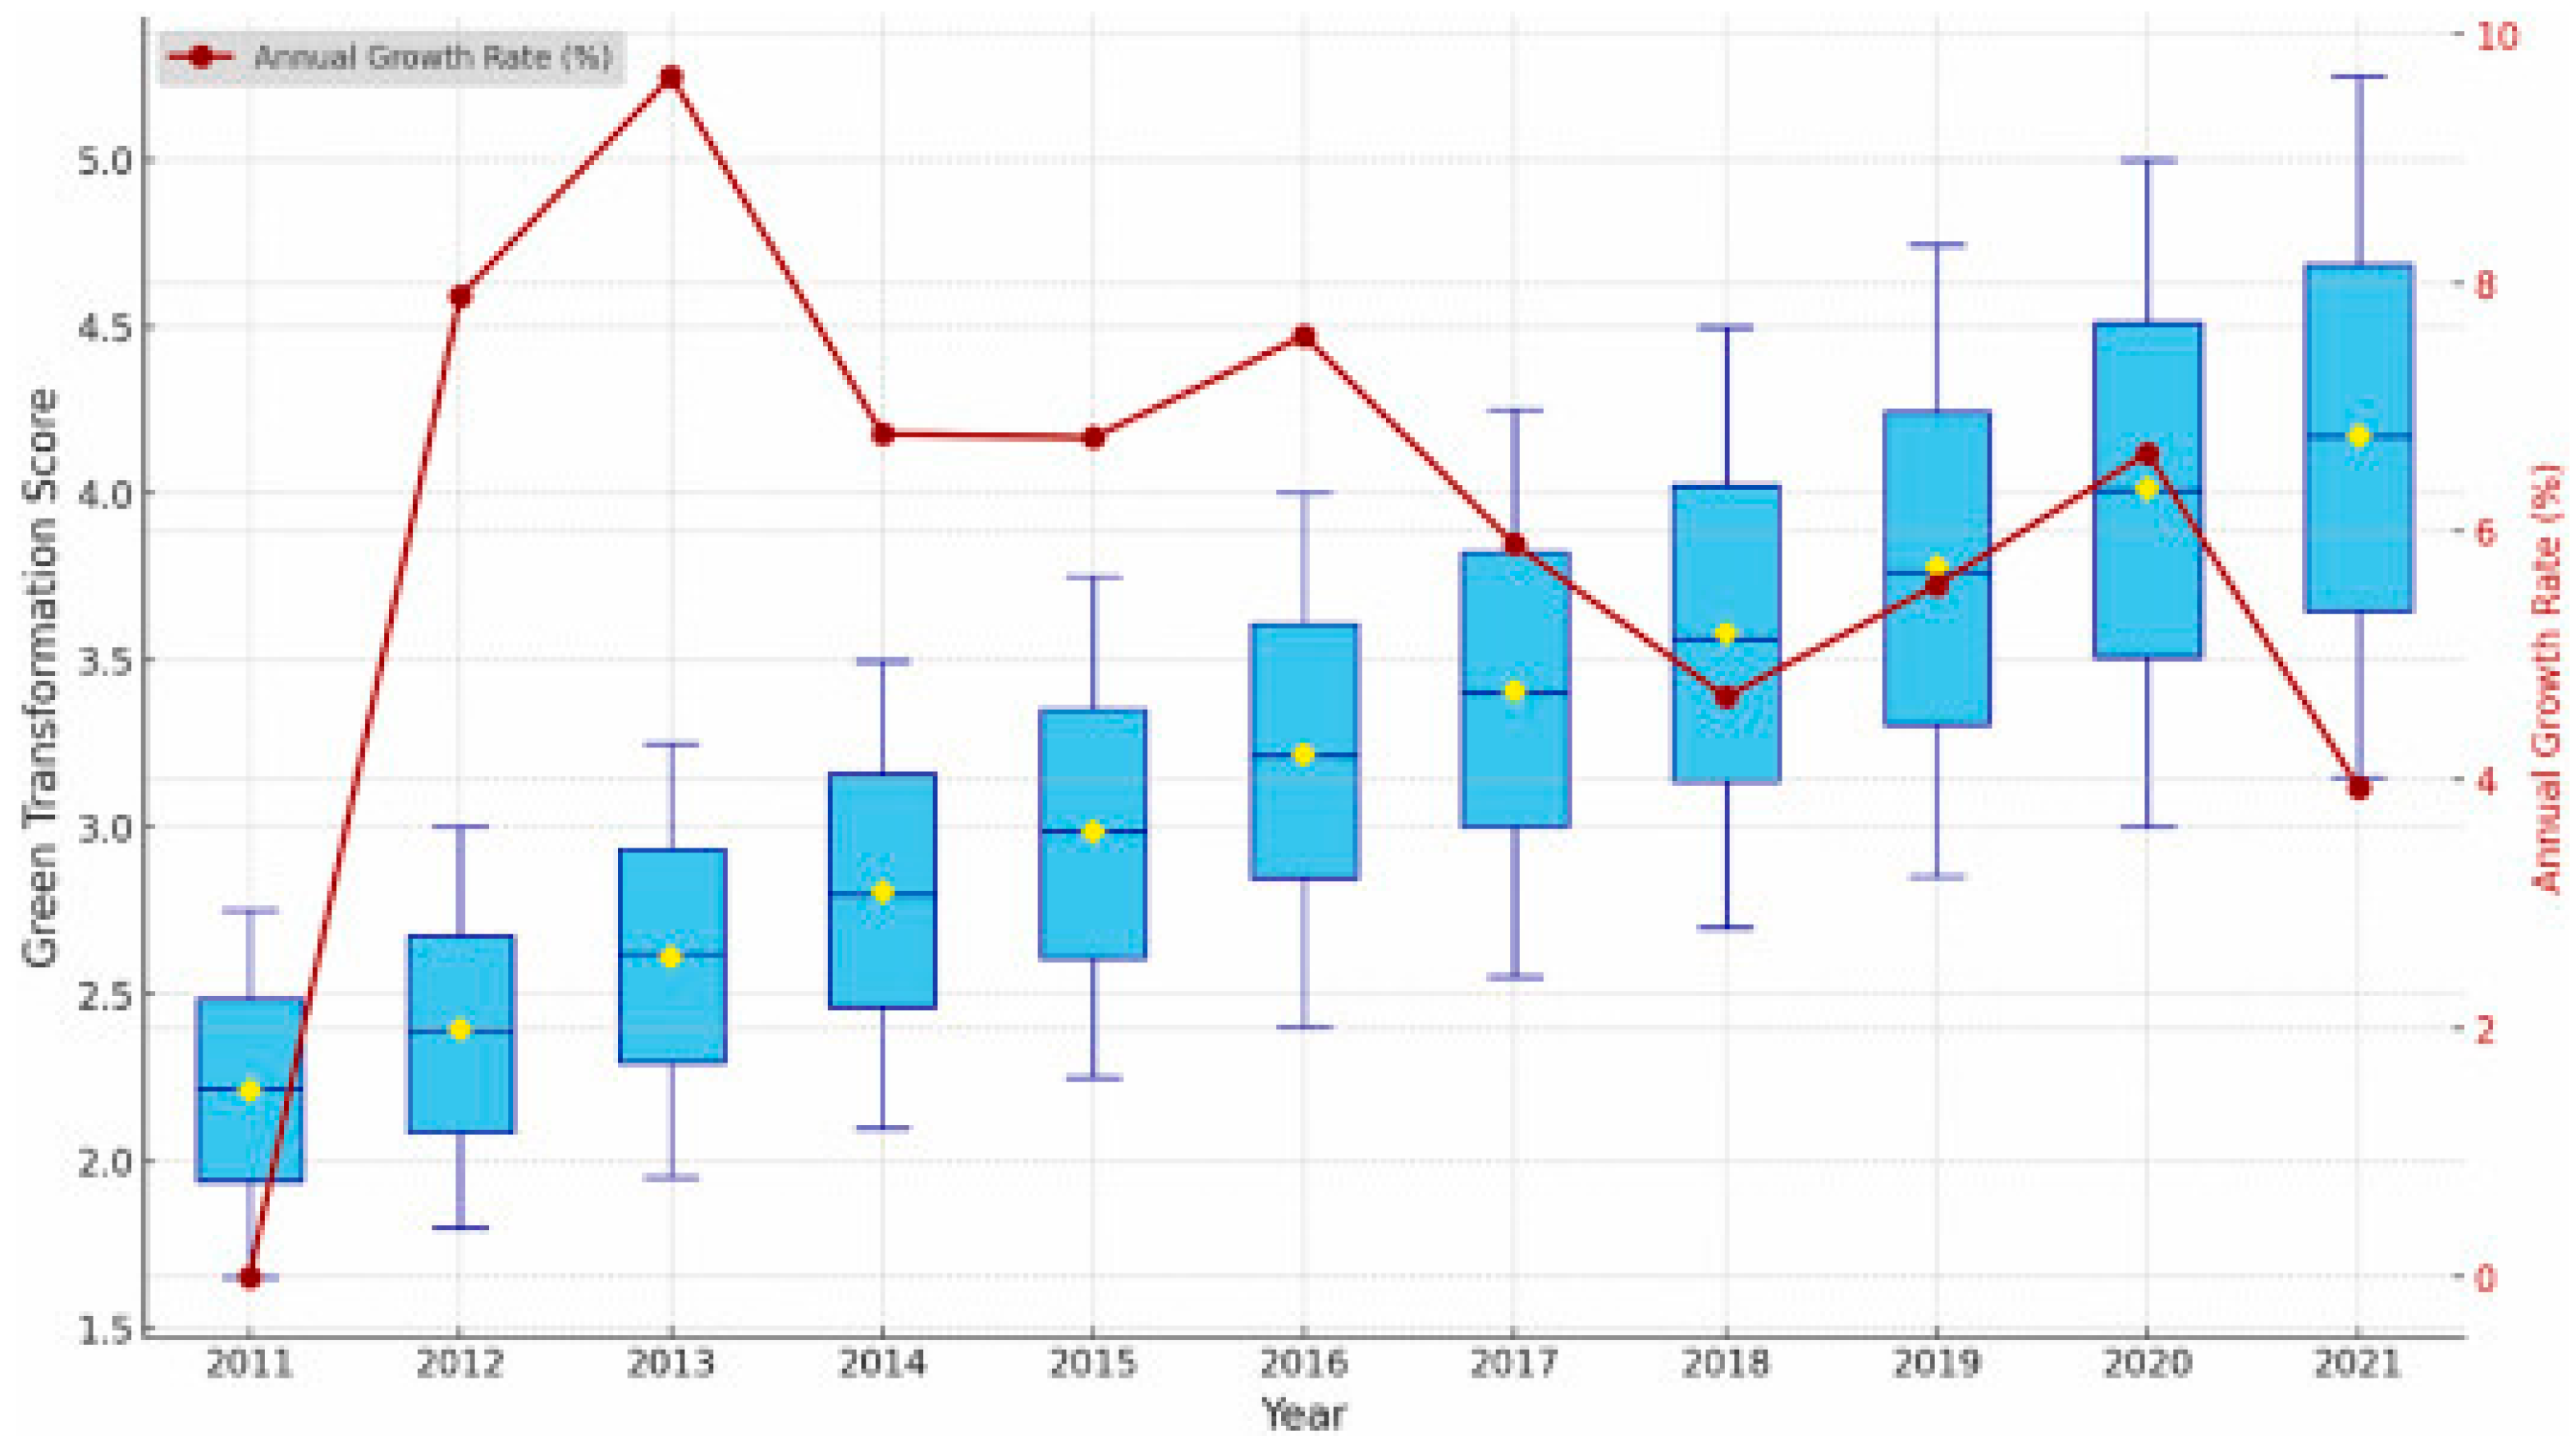
6]. While the GT of Chinese manufacturing companies has been on a significant upward trend in recent years, the annual growth rate peaked in 2013 and has since seen a string of downward fluctuations (see Figure 1). We should be very concerned about this. The shift from “crude” low-quality growth to “intensive” high-quality development in China’s industrial sector may be the driving force behind this phenomenon. After rapid growth, this change has caused GT to gradually “bottleneck”. A significant issue is motivating Chinese manufacturing businesses to attain further GT.
The definition of DT has changed from its first restricted use to its current broader usage. At the onset, electronic transactions were the primary focus of DT [7]. Conversely, its statistical rigor has evolved in tandem with contemporary developments. In 2017, the United States prioritized digital transformation services that may enhance smart manufacturing, data exchanges within global value chains, and other relevant platforms and applications. Digital technology encompasses unsold digital services, essential digital services, digital ordering, and digital delivery, as defined by the United Nations in 2022. Manufacturing enterprises are significantly impacted by digital transformation (DT), and many organizations and professionals believe that DT should be regarded as a comprehensive and broad concept.
Furthermore, green technology innovation (GTI) is crucial for examining GT and enhancing manufacturing organizations [8]. The advent of DT has revitalized this inventive approach with new opportunities. Hervas-Drane asserts that the core premise of GTI is to develop goods, processes, or management to attain long-term environmental sustainability [9]. External factors often support this innovation model’s successful implementation and widespread adoption. However, they frequently entail substantial investment, risk, and an extended payback period. The significant rise in DT offers an unprecedented broad platform for the increasing use of GTI. Barykin said that the intelligent and efficient attributes of digital technology, together with its interconnection and availability of information, have facilitated real-time information sharing across trade partners and enhanced operational efficiency [10]. This adjustment enhances resource allocation, reducing the likelihood of information asymmetry during GTI and assisting organizations in minimizing innovation expenses. Publications from the Fu and Wei groups in 2023 and 2024 are referenced herein.
In this context, China has also accelerated the process of sustainable transformation of the manufacturing industry and has made extensive use of digital technology for support. In March 2025, China’s Ministry of Industry and Information Technology, and three other departments jointly issued the implementation plan for the digital transformation of light industry. By 2027, the popularity of digital R&D and design tools in key light industry enterprises will reach about 90%, and the NC rate of key processes will reach about 75%. About 100 typical scenarios will be created to accelerate the comprehensive development of light industry enabled by digital technology. In addition, the traditional manufacturing industry is the base of the modern industrial system. Accelerating the digital transformation, promoting advanced and applicable technologies [11], and striving to improve the level of high-end, intelligent, and green technologies are important characteristics of modern manufacturing industry. China is leading other developing countries to seize the opportunity of digital, networked, and intelligent integration. It aims to give artificial intelligence and digital technology a role in the reform of the manufacturing industry and improve green total factor productivity. With the promotion of China’s sustainable development and the support of digital technology, China has built the world’s largest and most complete industrial system and information and communication infrastructure, with leading technology and the widest coverage. Many developing countries are in a major period of opportunity to promote high-quality industrial development through digital transformation. But in the process of using complex digital technology, most developing countries cannot expand the real benefits. Firstly, the large investment in digital technology has put too much pressure on enterprises [12]. At the same time, the transformation effect of digital technology is not clear, and there is a lack of evidence to support its contribution in the specific manufacturing industry. Secondly, with the process of globalization and the goal of green sustainable development means that an effective application of digitalization for green activities must be sought. The aforementioned developmental patterns raise significant concerns: Can Chinese manufacturing businesses expedite their progression towards globalization by using digital transformation, a novel and continually growing framework, for international trade? In what ways do the two complement each other? What is the significance of GTI in this relationship? Examining these queries produces substantial practical insights applicable to governmental and corporate strategic planning for digital transformation and industrial advancement, with considerable theoretical importance.
Contemporary research is deficient in examining the influence of digital transformation on manufacturing enterprises’ growth trajectory. The below variables are generally used to investigate the impact of DT. Initially, DT optimizes the use of corporate resources. We assert that this fosters sustainable manufacturing methodologies and technologies while enhancing operational efficiency and facilitating the growth of Global Supply Chains (GSCs). Digital transformation enhances corporate social responsibility by rendering corporations more transparent and responsive to market demands. A significant increase in demand for eco-friendly products has been seen due to digital platforms substantially diminishing information asymmetries between producers and customers. Yi discovered that this transition enables enterprises to gain a competitive advantage by using breakthroughs in green technology and enhancing their environmental protection strategies [13]. Moreover, DT can modify the competitive strategy and market positioning of enterprises. According to Sharifi [14], digitalization has transformed product marketing strategies, customer behaviors, and purchase choices. Martin asserts that for firms to secure a competitive advantage in the digital economy [15], they must integrate sustainability into their fundamental principles and strategic framework. While several studies have examined the consequences of digital transformation, few have thoroughly elucidated its relationship with green transformation and the operational dynamics of upgrading industrial enterprises. This article seeks to rectify the deficiency in research.
This essay raises many minor points. The primary objective of this article is to elucidate the function of digital transformation in enhancing the growth trajectory of manufacturing enterprises. Consequently, traditional trade ideas may be used for DT. The article emphasizes the importance of GTI in DT for promoting GT throughout the industrial sector. We can use these new insights to formulate digital transformation policies to advance sustainable development. This research elucidates how GIT sustainability, as a threshold variable, demonstrates the nonlinear impact of DT on the GT of industrial organizations. A novel perspective on the relationship between digital transformation (DT) and green transformation (GT) in the industrial sector is presented conceptually and experimentally.

2. Theoretical Analysis

2.1. Digital Trade Development and Green Transformation of Manufacturing Companies

According to Dwivedi [16], the Resource-Based View (RBV) posits that a company’s competitive advantage stems from its distinctive resources and skills. Data are a precious commodity in the DT framework. Manufacturing enterprises in GSCs may save a lot of money on search and matching expenses using DT, since it makes market information more open and accessible. Secondly, according to Dwivedi [16], market orientation theory states that businesses should base their strategies on market demand and competitive dynamics. Market demand for environmentally friendly goods is rising in the DT environment, driven by stricter international environmental legislation. Companies can more readily fulfill market demand, develop and update goods, and access innovative green technology using the DT platform. To achieve a competitive edge, organizations are compelled to use GT by this market-oriented approach. DT’s digital technologies, including cloud computing and big data analytics, let businesses track their energy consumption and emissions in real-time, which in turn helps them refine their energy management and recycling practices and reduce their environmental impact. This enhancement of ecological efficiency is a crucial component of GT and helps achieve the company’s sustainability objectives. Of course, there are also studies that potentially believe that digital commerce has a slight negative impact on sustainability, especially in less developed countries due to the high cost of digital commerce and the weak manufacturing foundation in less developed regions. Too much digital infrastructure construction will force them to divert money from sustainable investment. It may cause the stagnation of sustainable activities in the short term, but in the long run, the contribution of digital commerce to its economic growth is still outstanding, and the benefits of digital economy can be transferred to the construction of sustainable development systems in the future. Finally, this article presents its hypothesis:
H1. 
The digital transformation may substantially enhance the growth trajectory of industrial firms.

2.2. The Role of Mechanisms for Green Technology Innovation

Manufacturing GT enterprises have never had it so good with DT, the new major player in modern international commerce and economy. GTI’s significance has grown since it is a vital link between DT and GT. Through efficient use of resources and rapid transmission of information, DT has set the stage for GTI’s booming growth. The widespread use of DT has encouraged data sharing and collaborative innovation among manufacturing organizations, decreased the market entry hurdle for environmental goods and technologies, and opened up new avenues for product development. Along the way, GTI not only helps businesses bring GT to life but also opens up new possibilities and necessitates the expansion of DT due to its unique inventive qualities.
Green technology innovation theory is a derivative of green theory. Based on the principle of sustainable development, the theory puts forward the application of ecological technology and green innovation. Green technology innovation, also known as ecological technology innovation [17], is a kind of technology innovation. Generally, management innovation and technological innovation with the goal of protecting the environment are collectively referred to as green technological innovation. There are two main ways to define green technology innovation, starting from the characteristics of green technology innovation and summarizing the main characteristics to obtain the definition. Regarding the production process, the green technology innovation process is described systematically. Different from previous technological innovation, green technological innovation has the typical characteristics of “dual externalities”, positive externalities based on knowledge and technology spillovers. The mechanism of green technology innovation lies in the fact that leading enterprises carry out green technology research and development, improving their technology and putting it into operation in the market. Their first-mover advantage enables them to seize control of market segments, thus encouraging competitors to imitate or reverse research and development [18], ultimately improving the technical level in the industry. This process is based on the leading enterprises’ independent payment of technology R&D costs, which will produce technology spillover effects in the industry, and so has positive externalities.
To begin, GTI’s scale impact has been amplified thanks to DT. Using digital platforms, manufacturing organizations may track real-time shifts in consumer demand and identify promising areas for environmentally friendly product and technology development. Companies may better allocate resources and concentrate on environmentally friendly initiatives with high potential using this data-based decision support, as mentioned by Jin [19]. The scale effect is a slow but noticeable phenomenon in the ever-growing green product industry. It helps reduce the cost of green innovation initiatives individually while making businesses more efficient and competitive via mass manufacturing and scale sales. Companies may strengthen GT by forming a GTI cooperation network using the information-sharing mechanism in DT environments. This network can then enable enterprises to share resources and reap complementary benefits.
In addition to facilitating GTI’s scale impact, DT also improves the quality of green innovation. According to Ahmed [20], manufacturing enterprises can more easily obtain high-quality raw materials and state-of-the-art technical help when they use DT. The quality and technical content of environmentally friendly items has been significantly improved. More innovative green breakthroughs have occurred because businesses have been able to raise their research and development standards, tighten their environmental rules, and promote technology integration across disciplines. These top-notch inventions satisfy customers’ needs for high-quality, environmentally friendly goods and encourage corporate green technology by striking a balance between the two.
Lastly, GTI’s cumulative impact is strongly supported by the ongoing development of DT. Using DT platforms’ unbroken data flow and real-time market intelligence, manufacturing organizations may stay ahead of technological curves, increase the efficacy and flexibility of sustainable technologies, and keep up with technological advancements. They also found that technological advancements are continuous. Simultaneously, DT’s worldwide impact encourages technical collaboration and exchanges, opening up more opportunities and resources for GTI research and development. As part of this effort, worldwide standards and rules have been developed and improved, which has helped to standardize GTI further and provide manufacturing businesses with assistance on their journey of GT.
This article presents the following theories in light of the above:
H2. 
By the scale impact of GTI, the DT favorably affects the GT of manufacturing enterprises.
H3. 
Manufacturing enterprises’ GT is favorably impacted by the DT via the quality effect of GTI.
H4. 
By the cumulative impact of GTI, the DT has a favorable influence on the GT of manufacturing enterprises.

3. Research Design

3.1. Model Setting

This research used a two-way fixed effects model to analyze the impact of digital transformation (DT) on green transformation (GT) inside industrial companies. This model addresses endogeneity by including both firm-specific and year-fixed effects. Firm-fixed effects account for unobserved time-invariant elements that may affect DT and GT. Management strategies and organizational culture exemplify such characteristics. Conversely, year-fixed effects address time-specific factors, such as policy changes and macroeconomic conditions, that may simultaneously influence DT and GT. The baseline model of the analysis is defined as follows:
G T i , t = α 0 + α 1 D T i , t + C o n t r o l s i , t + μ i + η t + ε i , t
G T i , t is the green transformation level of manufacturing firm I last year; among them, it is the most prominent. D T i , t represents the degree of digital commerce. ηt means the year’s fixed effect, which controls the yearly influence of all firms.
From the point of view of green technological innovation, this section examines how digital commerce helps the green transformation of industrial enterprises. With this objective in mind, the following article presents an econometric model that incorporates interactions to investigate the process in question:
G T i , t = α 0 + α 1 ( D T i , t × M i , t ) + α 2 D T i , t + α 2 M i , t + C o n t r o l s i , t + μ i + η t + ε i , t
Mi,t stands for the magnitude, quality, and cumulative impacts of innovation in green technology and is a moderator parameter. All independent and moderating factors are centered on accurately evaluating the interaction impact and keeping the parameters comparable.
In addition, the difference in differences method is also an excellent alternative model. However, in this paper, because we have not set up a control group, an experimental group, or a goal-directed result group, the use of this would have notable limitations. When dealing with a dynamic panel data model, System GMM is an important tool to solve the endogenous problem. But, generally, the lag term variable will be introduced here, and the autocorrelation of the disturbance term will be investigated. System GMM requires equation variables to be dynamic variables, and not all explanatory variables are strictly exogenous. Moreover, the research cycle of this paper is long, and the number of samples is relatively small, so it does not have the conditions for the use of GMM, nor does it need to investigate the lag effect. Therefore, the two-way fixed effect model is the best choice.

3.2. Variable Selection

3.2.1. Dependent Variable

This study employs the innovative method proposed by Loughran and McDonald to evaluate the extent to which publicly listed companies have undergone green transformation (GT). A thorough study of text data extracted from these firms’ annual reports is the core of our research. This method efficiently processes and analyses massive volumes of unstructured textual data using automated natural language processing algorithms. This methodology surpasses traditional content analysis approaches regarding correctness, consistency, and impartiality. To measure something, you primarily need to carry out three separate processes. Finding the source of the text is the first step. This study has chosen to rely on annual reports as their significant data source due to two principal considerations. (1) Annual reports greatly facilitate the distribution of company information. Their comprehensive and detailed analysis sheds light on a company’s overall strategy, as well as its GT projects and their results. (2) Keyword matching and extraction are made simpler in annual reports due to the similar structure and terminology used in these standardized public publications. The second stage executes the keyword selection. This research builds on previous work by Yuhui [21]. It uses reputable policy documents like the Environmental Protection Law, the Technical Guidelines for Evaluating Corporate Environmental Behavior, and the White Paper on the Standardization of Green Manufacturing. In doing so, we ensure that the results are precise and all-encompassing. The screening process yields 113 keywords covering various topics, such as management supervision, technological innovation, strategic direction, pollution control, and publicity strategies. Finally, the GT measurement system must be operationalized. This scientific technique ensures an unbiased and comprehensive assessment of the company’s green transformation. Here, we use the big data tool for semantic text analysis. The company’s annual report was crawled through using Baidu Index and python tools. Based on word frequency statistics and machine learning, the text of green-transformation-related definitions were confirmed and the GT index of specific enterprises was finally obtained through cleaning and refining.

3.2.2. Independent Variable

Digital transformation (DT) has emerged as a crucial driver of international trade development in the face of dramatic alterations in the dynamics of global commerce. Nevertheless, there is still a significant obstacle to overcome in precisely detecting and assessing the degree of DT across various places. Building on the work carried out by Wu [22], this study takes a comprehensive look at DT by analyzing it via four fundamental dimensions: infrastructure, business environment, innovation development, and development potential. A thorough DT measuring framework is constructed by carefully selecting twenty essential indicators. This framework provides a scientific and exact mechanism for monitoring and analyzing the growth of DT. This research uses the entropy value technique to guarantee impartiality in the index development. This impartial weighting methodology evaluates each indicator’s relative relevance by analyzing the data’s dispersion. This method helps mitigate the possible biases arising from subjective weighing. Using SPSS software 17.0, data processing and calculations were carried out, ultimately creating a DT development index that included 31 Chinese provinces from 2011 to 2021. Table 1 comprehensively summarizes the measurement indicators used in this investigation. These indicators were gathered from reputable sources such as the China Statistical Yearbook, official data issued by the National Bureau of Statistics, the China Logistics Yearbook, and the Fangang Marketisation Index Report. The entropy method used in this paper is an objective weight statistical method. The steps are as follows: define the weight based on the value of indicator information. Firstly, the data are standardized. Secondly, the proportion of each index of each enterprise in the sample value in each year is calculated. Finally, the specific entropy proportion is obtained based on the entropy weight formula, that is, the relative weight of each indicator.

3.2.3. Control Variable

Burroughs [23] were the primary sources from which the control variables used in this research were derived. A measure of a corporation’s capital structure is financial leverage, which is abbreviated as Lev. The technique used to calculate the size of a corporation is the natural logarithm of total assets. This is because larger corporations could typically access more resources and are more willing to take risks. However, Tobin’s Q (Tobin Q) is a way to compare a company’s market value to the cost of replacing its assets, as stated by Lu [24]. The formula for this strategy is the market value plus total liabilities divided by total assets. Find out how quickly a company’s sales are rising by comparing the current period’s sales to those of the preceding period; this is what the word “growth” refers to. Barth [25] states that one uses the return on assets (ROA) measures to assess profitability. These measures are determined by dividing the net profit by the average total assets. The variable Dual Position (Dual) has a value of 1 if the chief executive officer is also the board chairman. The value of Dual is zero if the chief executive officer does not hold both posts. This factor helps determine how concentrated leadership affects company performance and decision-making. Similarly, SOE is a binary variable that takes the value of 1 for state-owned companies and 0 for non-owned companies. One way to measure the impact of ownership on corporate governance is using this variable. Finally, the firm age, or firm age, is based on the number of years from the company’s founding. The reason is that established businesses have a reputation for being more reliable and knowledgeable. With the help of these control variables, we can be sure that our study of what drives companies’ green transformation and technical innovation is solid.

3.2.4. Mechanism Variable

According to the current literature, two key markers for a company’s status as a green technological innovator (GTI) are its investment in environmental R&D and its number of green patents. Its ecological research and development investments may measure a corporation’s financial commitment to environmentally friendly technology. These investments show that the company is involved in innovation-related activities. Conversely, the quantity of ecologically friendly patents reflects these endeavors and offers a tangible indication of technological advancement’s impact.
Furthermore, the methodology for evaluating green innovations’ sustainability, which He created, is used in this research. This technique tracks the development of green innovation trends inside firms across time by calculating sequential growth rates on an annual basis. Green innovation in organizations has been steadily expanding throughout the years, and this method shows how that increase has been consistent and steady. This assessment method highlights the importance of continuity and the cumulative nature of innovation initiatives while simultaneously evaluating the success of a specific year. Consequently, this study employs it to provide a more complete understanding of companies’ innovation paths over the long run by statistically assessing the cumulative impact of green technological innovation (SLGI).

3.3. Data Sources

A suite of data-processing techniques are used in this study to guarantee the accuracy and dependability of the data. An initial sample of manufacturing firms (MCs) registered on the Shanghai and Shenzhen A-share marketplaces between 2011 and 2021 are used to perform these methods. We have excluded those classified as ST or PT to exclude businesses that can cause a financial catastrophe. Furthermore, samples that include incomplete or missing data will not be considered. On top of that, we look for outliers by comparing the data from before and after the 1% change. All continuous variables undergo the Winsorization method to mitigate the effect of very high or low values. The final dataset for the firm year has 16,894 observations once these revisions are implemented. The China Tertiary Industry Statistical Yearbook and the China Statistical Yearbook are used to compile statistics at the provincial and local levels.
In contrast, the CSMAR and Wind databases are consulted for company-level statistics. Table 2 displays the descriptive statistics, which reveal that 2.831 is the mean, 2.874 is the median, and 1.599 is the standard deviation for digital transformation (DT). It is clear from these numbers that DT varies significantly between the provinces. The level of participation in green transformation (GT) by firms varies between regions, and these differences are likely due to differences in digital infrastructure, governmental support, and economic development. While this happens, GT shows a wide range of change degrees at the company level, with a mean of 3.359 and a standard deviation of 0.678. From what we can see, the varied DT development across different regions and firms heavily influences the pace and effectiveness of GT in manufacturing companies.

4. Empirical Results and Analyses

4.1. Benchmark Regression

This study examines the impact of digital transformation (DT) on green transformation (GT) inside industrial companies. Table 3 presents the results of the baseline regression model, which progressively integrates control variables, firm-fixed effects, and year-fixed effects. Column (1) presents the preliminary model without control variables and fixed effects to provide a basis for assessing the relationship. Column (2) incorporates control variables that address additional firm-level factors, augmenting the model. To further guarantee that company-specific characteristics do not affect the results, Column (3) incorporates firm-fixed effects to account for unobserved variability across firms. Year-fixed effects are included in Column (4) to account for macroeconomic trends and temporal shocks. The importance of the DT coefficient at 0.0217 persists after considering other factors, signifying that a one standard deviation increase in DT leads to an approximate 3.47% increase in GT (calculated as 0.0217 × 1.599 × 100%). Digital transformation is undeniably a crucial element in advancing green technology inside industrial businesses by facilitating ecological transition, promoting sustainable practices, and enhancing green innovation. This study supports Hypothesis H1 and demonstrates how digital transformation might transform manufacturing’s approach to environmental sustainability.

4.2. Robustness Check

Accurately assessing DT’s role in facilitating GT for manufacturing enterprises requires knowledge of macroeconomic dynamics and industry-specific characteristics. The complex relationships between the factors at the macro and micro levels and the management structures and environmental policies of different organizations are evident. In particular, traditional statistical methods may fail to adequately capture these intricate nonlinear interactions when dealing with linear models. By presenting substantial benefits in processing high-dimensional data and nonparametric modeling, this study presents a dual machine learning approach that circumvents conventional econometric models’ limitations when dealing with complicated data structures. Gradient boosting and Lasso regression are the only machine-learning methods used in this study. While the primary use of Lasso and Gradient Boosting is prediction, both methods also provide coefficients during model formation that represent the relative relevance of the features to the prediction aim. These methods enhance both the model’s adaptability and the reliability of the study findings. Table 4 demonstrates that, at the 5% significance level, there is a positive and statistically significant relationship between manufacturing company GT and DT, suggesting that a well-designed DT system can substantially enhance manufacturing sector GT.
Lasso regression is a compressed estimate. It achieves a more refined model by constructing a penalty function, which makes it compress some regression coefficients, that is, the sum of the absolute values of the mandatory coefficients is less than a fixed value. At the same time, some regression coefficients are set to zero. Therefore, it retains the advantage of subset contraction. Lasso regression is a kind of biased estimation method for processing data with complex collinearity, which makes some coefficients smaller, and even some coefficients with small absolute values directly become 0. Therefore, it is particularly suitable for parameter reduction and parameter selection, so it is a linear model used to estimate sparse parameters. This helps the high-dimensional data in this paper obtain more robust test results and avoids the multicollinearity problem. The gradient boosting regression test can help this paper deal with complex nonlinear relationships and reduce residual interference. It is an optimized and robust regression model.
Table 5 displays the results of robustness tests to verify the reliability of the link between digital transformation (DT) and green transformation (GT) by examining various model specifications. Column (1) incorporates provincial fixed effects to account for regional variables, and the coefficient of DT remains positive and statistically significant (0.0225 **), suggesting that regional disparities do not significantly influence the results. In Column (2), city-fixed effects are accounted for, and DT continues to positively influence GT (0.0224 **), indicating that city-level fluctuations do not affect the relationship. Column (3) introduces further control variables, including cash flow and TOP1 (most enormous shareholder ownership ratio); still, DT maintains a substantial positive coefficient (0.0214 **), affirming that the observed impact is not influenced by missing firm-level data. Incorporating company and year-fixed effects in all models guarantees the consideration of unobserved heterogeneity and temporal trends. Furthermore, the modified R2 values remain consistent (~0.635), underscoring the reliability of the findings. These data together affirm that the beneficial impact of DT on GT persists across various model parameters, reinforcing the validity of the study’s conclusions.
The endogeneity tests confirm the robustness of the association between digital transformation (DT) and green transformation (GT) by using both instrumental variable (IV) and heteroskedastic instrumental variable (HIV) methodologies.
The IV technique reveals a considerably negative coefficient for the instrumental variable (−1388.5627 ***) and a robust F-statistic (8526.62), suggesting the instrument’s importance in forecasting DT. Moreover, in the second-stage regression, DT positively influences GT (0.0175 *), indicating that DT substantially contributes to GT after mitigating any endogeneity issues.
The HIV approach offers further confirmation, since the coefficient of DT (0.4469 ***) is significant, strengthening the assertion that DT influences GT. The Kleibergen–Paap (K–P) rk LM statistic and its p-value (0.000) affirm the considerable importance of the instrumental variables, whilst the K–Paap rk Wald F statistic (238.889) is above the usual threshold, alleviating worries over weak instrument bias. Furthermore, the modified R2 values reveal that the instrumental variable technique accounts for a significant percentage of the variation in DT (0.979) and GT (0.527), underscoring the model’s robustness. These data show that DT substantially benefits GT, especially considering possible endogeneity. This enhances the credibility of the study’s conclusions, indicating that digital transformation is a vital catalyst for green transformation in industrial enterprises (Table 6).

5. Further Analysis

The heterogeneity tests indicate disparities in the influence of digital transformation (DT) on green transformation (GT) based on several business factors, such as industry type, competitive intensity, and phases of the organization’s life cycle. The influence of digital transformation on green technology is seen in both new energy and non-new energy enterprises, with a somewhat more significant effect observed in non-new energy organizations (0.0218 ** vs. 0.0226). This indicates that whereas new energy businesses intrinsically align with environmental goals, existing organizations receive more advantages from digital transformation in advancing their ecological transition. Secondly, industrial competition significantly influences the DT-GT connection. Companies in highly competitive industries exhibit a more significant impact (0.0259 **) than those in low-competition sectors (0.0190). This discovery supports the idea that market pressure drives companies to pursue efficiency and innovation via digital transformation, confirming its function as a strategic catalyst for growth in volatile market environments.
Ultimately, the impact of digital transformation fluctuates throughout various phases of the company life cycle. Companies in the maturity phase have the most significant effect (0.0334 **), suggesting that established enterprises with robust structures and resources are more adept at using digital transformation for growth transformation. The impact is negligible throughout the growth (0.0030) and decline (0.0019) phases, indicating that nascent organizations may be deficient in the infrastructure necessary to leverage digital transformation whilst decreasing enterprises face resource limitations that hinder their green transformation initiatives. The findings suggest that DT’s impact on GT varies across sectors and company attributes. Its efficacy depends on market factors and the developmental phases of organizations, underscoring the need for customized digital transformation adoption methods to optimize growth trajectory results.
When comparing organizations operating in high-competition sectors to those operating in low-competition industries, it is clear that the industry’s competitive climate significantly influences the link between digital transformation (DT) and green transformation (GT) in manufacturing enterprises. After dividing the sample into two groups according to the yearly median of the Herfindahl index for the industry, it was shown that DT had a more significant beneficial influence on GT in highly competitive sectors. To begin with, businesses operating in highly competitive marketplaces are required to continually search for operational solutions that are both efficient and cost-effective to preserve their market position. DT plays a significant part in the optimization of supply chain management, the reduction in resource waste, and the enhancement of energy efficiency. These qualities allow businesses to quickly adjust to the market’s needs while simultaneously spurring innovation, ultimately driving GT.
Secondly, businesses are required to investigate new market prospects because of the growing number of environmental rules and the changing tastes of consumers toward environmentally friendly goods. DT reduces the information gap in the market, enabling businesses to more correctly evaluate the demand that consumers have for environmentally friendly goods. Consequently, companies are far more likely to incorporate environmentally friendly technology, improve manufacturing procedures, and maintain their dedication to green innovation.
Last but not least, DT makes it easier to access cutting-edge green technologies and management techniques using worldwide networks that promote technology interchange and information sharing. By exposing companies to a wide variety of technical solutions and worldwide best practices, they can expedite their technological learning, enabling them to develop more quickly and improve their graphics processing skills. These results, taken as a whole, shed light on the fact that DT acts as a strategic facilitator of GT, especially in highly competitive sectors where the need for efficiency, market responsiveness, and continual innovation is more acute.
This article depends on this cash flow segmentation. As seen in Table 7, the empirical findings indicate that DT is more successful in boosting GT for firms in the maturity stage than organizations in the development and decline phases. This phenomenon may be investigated from a variety of different points of view. In the first place, digital transformation necessitates that businesses possess a specific technical foundation and make a financial investment to integrate sophisticated information systems and data management technologies successfully. Secondly, well-established companies have a comprehensive understanding of the consumer services that they provide and the related market activities. Consequently, this enables companies to use data analytics tools more intelligently, allowing them to use digital commerce’s opportunities better.
Last but not least, GT mandates that businesses implement environmentally friendly practices in various aspects of sustainability, such as the management of supply chains, the design of products, and the technology used in manufacturing, in addition to the production processes. More mature businesses often have supply chain management systems that are more effective and have greater operational efficiency, both of which may be further optimized via digital trade opportunities. For instance, blockchain technology enhances the transparency and traceability of supply chains, making it easier to use resources effectively and adhere to environmental regulations [26].
Table 8 presents compelling evidence that digital transformation (DT) facilitates green transformation (GT) in manufacturing firms via three primary mechanisms: green innovation (GIN), green innovation quality (GIQ), and the cumulative impact of sustainable technology innovation (SLGI). Among them, GIN, GIQ, and SLGN indicators are calculated from the original indicators before the weight. The data are from the annual reports of enterprises, the statistical yearbook of China’s green innovation and the guotai’an database. In Column (1), the interaction term GIN × DT has a coefficient of 0.1923, significant at the 1% level, suggesting that DT amplifies GT via green innovation. This indicates that digital transformation promotes the development and implementation of green technology, enabling companies to incorporate digital tools into their sustainability initiatives. In Column (2), the coefficient of GIQ×DT is 0.3194 and is statistically significant at the 1% level, indicating that DT substantially enhances the quality of green innovation. This underscores the idea that digital transformation promotes information interchange, resource accessibility, and technical spillovers, improving green technology innovation quality. Notwithstanding the negative coefficient for GIQ (−0.0319), the robust interaction effect indicates that DT is pivotal in mitigating possible issues in green innovation quality. Column (3) indicates that digital transformation (DT) enhances green technology (GT) via the cumulative impact of green technology innovation, shown by the coefficient of SLGI×DT at 0.0121, significant at the 1% level. This discovery corroborates that digital transformation enables companies to perpetually amass innovative experiences, establishing a self-reinforcing loop that bolsters their enduring green transformation. Although the coefficient for SLGI is negative (−0.0012), the positive interaction with DT indicates that firms with a more advanced green innovation system obtain substantial advantages from digital technology [27].
In all three models, the coefficient for DT consistently exhibits a positive and substantial value, hence reaffirming its contribution to the advancement of GT. The incorporation of company and year-fixed effects, together with control variables, guarantees the robustness of these results. The models have robust explanatory power, shown by an adjusted R2 of 0.635. These findings highlight that digital transformation is a crucial facilitator of green transformation in manufacturing. It enhances the quality and overall effect of green innovation while promoting the widespread adoption of sustainable practices [28].
According to the data shown in Table 8, digital transformation (DT) plays a significant part in fostering green transformation (GT) in manufacturing organizations. Given that the coefficient of 0.3194 for the interaction term GIQ × DT in Column (2) is significant at the 1% level, it can be concluded that Hypothesis H3 is shown to be correct. Based on this outcome, it can be concluded that DT improves the quality of GTI, making implementing innovative, environmentally friendly technologies easier by encouraging the flow of knowledge and technical information. The enhanced quality of GTI helps businesses transition to a more environmentally friendly business model. It boosts their added value and market competitiveness, encouraging them to participate in ecologically responsible technical innovation [29].
Similarly, the interaction term SLGI × DT in Column 3 has a coefficient of 0.0121, which is equally significant at the 1% level, thus validating Hypothesis H4. It can be deduced from this that DT has a cumulative impact on GTI, which enables businesses to constantly amass technical knowledge and experience in the field of innovation. Using DT platforms, industrial companies can develop a self-sustaining cycle of environmentally friendly technical breakthroughs, steadily strengthening their innovation capacity. This accumulation effect not only helps to promote the development of ecologically friendly technologies over the long term, but it also helps to increase the market positioning of businesses, which ensures that they will remain competitive in the ever-changing industrial landscape. In the end, these findings underscore that DT acts as both a catalyst for high-quality innovation and a driver of persistent technical advancement, ultimately resulting in a more comprehensive and long-lasting green transformation in the industrial sector.
The findings of the SLGI threshold effects test in Table 9 demonstrate the existence of a single threshold effect, with an F-statistic of 15.80 and a corresponding p-value of 0.000, indicating statistical significance at the 1% level. The determined threshold value is 11.609, demonstrating that the influence of digital transformation (DT) on green technology innovation changes after SLGI crosses this level. The double threshold test, however, reveals an F-statistic of 5.87 with a p-value of 0.167, showing that a second threshold is not statistically significant [30].
Table 10 provides the findings of the SLGI threshold regression, illustrating the effect of several business characteristics on green innovation. Leverage (Lev) shows a substantial negative impact (Coef. = −0.6301, p < 0.01), showing that increased financial leverage constrains green technology innovation. Firm size (Size) has a positive influence (Coef. = 0.1842, p < 0.01), suggesting that more significant enterprises possess more capacity for the adoption of green technology owing to their resource availability. Tobin’s Q adversely affects innovation (Coef. = −0.0187, p < 0.05), suggesting that firms with elevated market valuations may favor financial returns over environmentally sustainable investments. Other economic factors, including growth, return on assets (ROA), and state ownership (SOE), have no substantial influence. Firm age (FirmAge) has a significant favorable influence (Coef. = 2.6791, p < 0.01), indicating that older enterprises use accumulated expertise and stability to foster green technology innovation [31].
Comparison between DT and SLGI elucidates threshold effects. When SLGI is below 2.6039, DT has a minor influence on green innovation (Coef. = −0.0008, p = 0.318), suggesting that digital transformation fails to provide considerable advantages at diminished levels of green innovation potential. Once SLGI surpasses the threshold of 2.6039, DT has a substantial positive impact (Coef. = 0.0022, p < 0.05), indicating that digital transformation fosters green innovation solely when firms possess a robust foundation in green innovation. This affirms that digital transformation is inadequate on its own; instead, it augments and improves green innovation initiatives after companies attain a certain degree of technical maturity.
The expansion of market access, the enhancement of information availability, and the improvement of transaction efficiency are three ways that digital transformation (DT) contributes to the spread and use of green technology in industrial firms. However, its catalytic impact becomes noticeable only when companies’ green technology innovation (measured by the SLGI index) goes beyond a certain point. Technology developments may be inconsistent and unstable at lower SLGI levels because enterprises may not have a well-established green innovation framework. Businesses can make steady strides in green technology through R&D, manufacturing, and sales when the SLGI passes the barrier because they have established better organized and long-lasting infrastructure for green innovation. Businesses with superior SLGI also have an advantage in the market since they can better address the need for eco-friendly goods, which are growing in popularity. Green technology innovation is sped up with the use of DT, which enables businesses to track market trends, change product strategies, and optimize production planning in reaction to changing customer demands [32].

6. Conclusions

6.1. Theoretical Contributions

The essay delves into how DT affected GT manufacturing businesses, specifically how GTI was involved. According to the research, industrial companies that use DT also use GT. According to the results of the effect mechanism study, DT promotes GT in manufacturing organizations by increasing the amount and quality of GTI and making it more sustainable. According to heterogeneity studies, DT actively promotes GT among non-new energy firms, more competitive companies, and mature-stage enterprises more than non-new energy companies. This shows that DT’s effects could differ depending on factors like industry type and the maturity level of the business. Once the critical value of the cumulative impact of GTI exceeds 2.6039, the critical value effect analysis reveals that DT does not substantially enhance GT for manufacturing enterprises. Once we move beyond this obstacle, the DT’s facilitative impact will be much more substantial. These results shed light on the ever-changing nature of the connection between DT and GT via empirical data. Additionally, they provide theoretical backing and legislative recommendations to help legislators advance DT growth and the long-term transformation of the manufacturing sector.

6.2. Practical Implications

The first step for manufacturing businesses to reach full GTI potential is to improve their DT use. This will help with innovation quantity, quality, and sustainability. When it comes to pushing green growth in manufacturing and products, digital technologies like cloud computing and big data help optimize resource allocation and enhance energy efficiency. In the end, GTI must remain a top priority for organizations. Secondly, a more determined approach to integrate into the growth of DT is required of established organizations, companies in highly competitive sectors, and companies that do not operate in the new energy sector. Market and competitive strategies might help these organizations optimize their GT more efficiently. Companies may boost their environmental competitiveness in the market by using green marketing and supply chain strategies. Lastly, research has shown that DT enhances GT the greatest when the total impact of GTI surpasses a certain level (e.g., 2.6039 referenced in the article). Hence, for a sustainable long-term transition, businesses must maintain their investments in green research and innovation to strengthen the uptake and stability of green technology. For developed countries, they have accumulated the advantages and effects of DT for a long time, so they can put more resource effects into sustainable development. By improving the supply chain model through DT, the market size and participants of large cross-border transactions have increased the vitality and potential of the digital economy. For developing countries, digital technology can effectively improve resource allocation and production efficiency in cross-border transactions, thereby increasing the growth and competitiveness of the digital economy. Enterprises should choose the introduction mode of digital technology according to the type (new energy or conventional industry) and accumulate DT resources for a long time and expand DT investment to cross the threshold constraint of its effect. Green supply chain integration provides enterprises with the ability to seamlessly integrate digital technology with existing green supply chain processes by promoting knowledge absorption and strengthening cooperation and information exchange with suppliers and customers. This collaborative approach not only improves operational efficiency but also enhances environmental sustainability. For less developed countries, the key is to absorb DT capacity transferred from other countries. DT mode and business should be established as soon as possible, so as to build a green business framework.

6.3. Limitations and Future Directions

There are some problems with this document. While the research finds that DT positively affects manufacturing businesses’ GT, it may have failed to consider other essential aspects, such as government aid programs, shifts in market demand, and the optimization of internal management. The study’s thoroughness and depth can be diminished if these elements significantly affect firms’ GT and are not included in the analytical framework. On the one hand, the article compares and contrasts businesses that have been around for varying amounts of time, have seen various forms of rivalry, and have used multiple forms of energy. On the other hand, environmental protection regulations, technical innovation rates, and competitive market circumstances vary greatly between enterprises, affecting how quickly GT evolves. Additional analysis of the discrepancies in these aspects is required.

Author Contributions

Writing—original draft preparation, R.L.; writing—review and editing, G.-y.S. All authors have read and agreed to the published version of the manuscript.

Funding

The APC was funded by G.-y.S.

Institutional Review Board Statement

Not applicable.

Informed Consent Statement

Not applicable.

Data Availability Statement

Data will be made available on request.

Conflicts of Interest

The authors declare no conflicts of interest.

References

  1. Long, R.; Bao, S.; Wu, M.; Chen, H. Overall evaluation and regional differences of green transformation: Analysis based on “government-enterprise-resident” three-dimensional participants perspective. Environ. Impact Assess. Rev. 2022, 96, 106843. [Google Scholar] [CrossRef]
  2. Chen, W.; Chen, J.; Xu, D.; Liu, J.; Niu, N. Assessment of the practices and contributions of China’s green industry to the socio-economic development. J. Clean. Prod. 2017, 153, 648–656. [Google Scholar] [CrossRef]
  3. Yu, Y.; Qayyum, M.; Li, S. Trade dynamics of environmental goods within global energy economy and their impacts on green technological innovation: A complex network analysis. Energy Econ. 2024, 140, 107957. [Google Scholar] [CrossRef]
  4. Hu, F.; Qiu, L.; Xi, X.; Zhou, H.; Hu, T.; Su, N.; Zhou, H.; Li, X.; Yang, S.; Duan, Z.; et al. Has COVID-19 Changed China’s Digital Trade?—Implications for Health Economics. Front. Public Health 2022, 10, 831549. [Google Scholar] [CrossRef]
  5. Zafar, S.Z.; Zhilin, Q.; Mabrouk, F.; Ramirez-Asis, E.; Alzoubi, H.M.; Hishan, S.S.; Michel, M. Empirical linkages between ICT, tourism, and trade towards sustainable environment: Evidence from BRICS countries. Econ. Res. Istraz. 2022, 36, 2127417. [Google Scholar] [CrossRef]
  6. Wan, M.; Kuang, H.; Jia, P.; Zhao, S. Research on the Decision Making of Value Chain Reconstruction of Chinese Port Enterprises under the Background of Free Trade Zone Policy. Systems 2024, 12, 91. [Google Scholar] [CrossRef]
  7. Xu, Y.; Wang, R.; Zhang, S. Digital Economy, Green Innovation Efficiency, and New Quality Productive Forces: Empirical Evidence from Chinese Provincial Panel Data. Sustainability 2025, 17, 633. [Google Scholar] [CrossRef]
  8. Gaies, B.; Nakhli, M.S.; Sahut, J.M.; Guesmi, K. Is Bitcoin rooted in confidence?—Unraveling the determinants of globalized digital currencies. Technol. Forecast. Soc. Change 2021, 172, 121038. [Google Scholar] [CrossRef]
  9. Hervas-Drane, A.; Noam, E. Peer-to-peer file sharing and cultural trade protectionism. Inf. Econ. Policy 2017, 41, 15–27. [Google Scholar] [CrossRef]
  10. Barykin, S.Y.; Kapustina, I.V.; Sergeev, S.M.; Kalinina, O.V.; Vilken, V.V.; De la Poza, E.; Putikhin, Y.Y.; Volkova, L.V. Developing the physical distribution digital twin model within the trade network. Acad. Strateg. Manag. J. 2021, 20, 1–18. [Google Scholar]
  11. Cai, X.; Gao, X.; Zheng, S.; Qiu, S.; Ye, Z.; Zhang, X.; Liu, C.; Tan, Z. Research on the Assessment and Drivers of the Coupling Coordination Development between Green Innovation and Digital Economy. Appl. Spat. Anal. Policy 2025, 18, 1–22. [Google Scholar] [CrossRef]
  12. Liu, Q.; Yang, X.; Shen, Z.; Štreimikienė, D. Digital economy and substantial green innovation: Empirical evidence from Chinese listed companies. Technol. Anal. Strat. Manag. 2022, 36, 2609–2623. [Google Scholar] [CrossRef]
  13. Yi, C.; Ma, H.C.; Zhao, K. Impacts of digital economic transformation and green growth on trade flows of mineral resources. Resour. Policy 2024, 90, 104664. [Google Scholar] [CrossRef]
  14. Sharifi, A.; Allam, Z.; Bibri, S.E.; Khavarian-Garmsir, A.R. Smart cities and sustainable development goals (SDGs): A systematic literature review of co-benefits and trade-offs. Cities 2024, 146, 104659. [Google Scholar] [CrossRef]
  15. Martin, J. Drugs on the Dark Net: How Cryptomarkets Are Transforming the Global Trade in Illicit Drugs; Springer: Berlin/Heidelberg, Germany, 2014; pp. 1–92. [Google Scholar] [CrossRef]
  16. Dwivedi, Y.K.; Hughes, L.; Kar, A.K.; Baabdullah, A.M.; Grover, P.; Abbas, R.; Andreini, D.; Abumoghli, I.; Barlette, Y.; Bunker, D.; et al. Climate change and COP26: Are digital technologies and information management part of the problem or the solution? An editorial reflection and call to action. Int. J. Inf. Manag. 2022, 63, 102456. [Google Scholar] [CrossRef]
  17. Ma, D.; Zhu, Q.; Business, J.O.; Woodside, A.G. Innovation in emerging economies: Research on the digital economy driving high-quality green development. J. Bus. Res. 2022, 145, 801–813. [Google Scholar] [CrossRef]
  18. Chen, K.; Zhao, S.; Jiang, G.; He, Y.; Li, H. The green innovation effect of the digital economy. Int. Rev. Econ. Financ. 2025, 99, 103970. [Google Scholar] [CrossRef]
  19. Jin, Y.; Zhou, B.; Zhang, P.; Li, T. How education expenditures, natural resources, and GDP interact with load capacity factor in the presence of trade diversity index under COVID-19 perception: Evidence from G-7 nations. Resour. Policy 2024, 88, 104532. [Google Scholar] [CrossRef]
  20. Ahmed, Z.; Le, H.P. Linking Information Communication Technology, trade globalization index, and CO2 emissions: Evidence from advanced panel techniques. Environ. Sci. Pollut. Res. 2021, 28, 8770–8781. [Google Scholar] [CrossRef]
  21. Yuhui, D.; Zhang, L. Regional Digital Finance and Corporate Financial Risk: Based on Chinese Listed Companies. Emerg. Mark. Financ. Trade 2023, 59, 296–311. [Google Scholar] [CrossRef]
  22. Wu, B.; Yang, W. Empirical test of the impact of the digital economy on China’s employment structure. Financ. Res. Lett. 2022, 49, 103047. [Google Scholar] [CrossRef]
  23. Burroughs, B.; Burroughs, W.J. Digital logistics: Enchantment in distribution channels. Technol. Soc. 2020, 62, 101277. [Google Scholar] [CrossRef] [PubMed]
  24. Lu, Z.; Wu, J.; Li, H.; Nguyen, D.K. Local Bank, Digital Financial Inclusion and SME Financing Constraints: Empirical Evidence from China. Emerg. Mark. Financ. Trade 2022, 58, 1712–1725. [Google Scholar] [CrossRef]
  25. Barth, L.; Schweiger, L.; Benedech, R.; Ehrat, M. From data to value in smart waste management: Optimizing solid waste collection with a digital twin-based decision support system. Decis. Anal. J. 2023, 9, 100347. [Google Scholar] [CrossRef]
  26. El Houda, Z.A.; Brik, B. Next-power: Next-generation framework for secure and sustainable energy trading in the metaverse. Ad Hoc Netw. 2023, 149, 103243. [Google Scholar] [CrossRef]
  27. Al-Sulaiti, K.I.; Baker, M.J.; Bryman, A.; Baker, M.J.; Ballington, L.; Bilkey, W.J.; Nes, E.; Bryman, A.; Bell, E.; Chen, C.; et al. Research Methods for Business Students. Int. Mark. Rev. 2010, 14, 656. [Google Scholar] [CrossRef]
  28. Feng, C.; Liu, Y.-Q.; Yang, J. Do energy trade patterns affect renewable energy development? The threshold role of digital economy and economic freedom. Technol. Forecast. Soc. Change 2024, 203, 123371. [Google Scholar] [CrossRef]
  29. Dong, W.; Li, Y.; Gao, P.; Sun, Y. Role of trade and green bond market in renewable energy deployment in Southeast Asia. Renew. Energy 2023, 204, 313–319. [Google Scholar] [CrossRef]
  30. Murshed, M.; Mahmood, H.; Alkhateeb, T.T.Y.; Banerjee, S. Calibrating the impacts of regional trade integration and renewable energy transition on the sustainability of international inbound tourism demand in South Asia. Sustainability 2020, 12, 8341. [Google Scholar] [CrossRef]
  31. Park, S.R.; Choi, D.Y.; Hong, P. Club convergence and factors of digital divide across countries. Technol. Forecast. Soc. Change 2015, 96, 92–100. [Google Scholar] [CrossRef]
  32. Bunje, M.Y.; Abendin, S.; Wang, Y. The multidimensional effect of financial development on trade in Africa: The role of the digital economy. Telecommun. Policy 2022, 46, 102444. [Google Scholar] [CrossRef]
Figure 1. Historical box plots and growth rate trajectories for the green transformation of publicly listed Chinese industrial firms.
Sustainability 17 03600 g001
Table 1. Digital trade indicators system.
CategorySubcategoryIndicatorMeasurement ApproachWeight
Digital Trade ReadinessConnectivity and AdoptionSmart Device PenetrationNumber of AI-integrated devices per 100 people2.35
Digital Network PerformanceData Transmission SpeedAverage broadband speed (Mbps)6.92
Internet AccessibilityFiber Optic CoveragePercentage of households with fiber-optic internet4.12
Investment in Smart InfrastructureDigital Infrastructure ExpenditurePer capita investment in cloud computing, IoT, and AI technologies6.78
Logistics EfficiencyDigitalized Supply Chain UtilizationShare of logistics companies using smart tracking systems3.51
Digital Trade Business ClimateMarket DynamicsBusiness Digitalization IndexProportion of firms implementing digital tools0.91
Trade CompetitivenessDigital Trade Expansion ScoreWeighted index of trade openness and digital trade volume1.24
E-Governance and Public ServicesGovernment Digital EngagementProportion of public services available online4.15
Legal and Regulatory FrameworkDigital Business Protection LawsExistence of data privacy and cybersecurity regulations (1 = Yes, 0 = No)1.89
Financial InclusionAccessibility of FinTech ServicesShare of adults using mobile payment systems2.76
Innovation and Digital TransformationPolicy and Trade ReformDigital Trade Policy ImplementationNumber of new digital trade policies per year13.85
Workforce Digital SkillsTech-Savvy Workforce RatioPercentage of employees with advanced digital certifications0.82
Enterprise Technology UsageCloud Computing UtilizationNumber of cloud-integrated businesses per 100 firms0.67
R&D and Technology GrowthDigital R&D InvestmentPer capita expenditure on digital innovation by enterprises6.42
Commercialization of InnovationEmerging Tech AdoptionShare of revenue from AI and blockchain-driven solutions9.72
Future Growth and CompetitivenessInternational Market IntegrationDigital Trade DependenceShare of digital services exports in total trade6.23
Expansion of Digital EconomyDigital Service OutputPer capita contribution of digital services to GDP8.56
E-Commerce PenetrationOnline Retail GrowthPercentage increase in online sales year-over-year7.99
Corporate Digital MaturityAI and Automation in BusinessShare of enterprises using AI-driven decision-making8.47
Business Digital EngagementSME Participation in Digital MarketsProportion of small and medium enterprises engaged in e-commerce2.94
Table 2. Descriptive statistics.
VariableNMeanSDMinp50Max
DT16,8942.8311.5990.4562.8747.008
GT16,8943.3590.7781.6523.3235.146
GIN16,8940.4580.8480.0000.0003.664
GIQ16,8940.1550.4770.0000.0002.565
SLGI16,9000.4580.8480.0000.0003.664
Lev16,8940.3950.1920.0520.3870.868
Size16,89422.0301.14019.69021.89025.350
TobinQ16,8942.1461.3260.8951.7118.136
Growth16,8940.1710.350−0.4810.1162.080
ROA16,8940.0440.064−0.2110.0420.226
Dual16,8940.3100.4630.0000.0001.000
SOE16,8940.2840.4510.0000.0001.000
FirmAge16,8942.8720.3321.3862.8903.466
Table 3. Benchmark regression results.
Variable(1)(2)(3)(4)
DT0.2609 ***0.2184 ***0.1721 ***0.0217 **
(0.0047)(0.0052)(0.0080)(0.0087)
Lev −0.2337 ***−0.4249 ***−0.1266 ***
(0.0482)(0.0494)(0.0432)
Size 0.0724 ***0.1072 ***0.0210 *
(0.0089)(0.0147)(0.0120)
TobinQ 0.0174 ***−0.0007−0.0065
(0.0054)(0.0046)(0.0048)
Growth 0.0396 **−0.0188−0.0220 *
(0.0156)(0.0136)(0.0129)
ROA −0.5810 ***−0.2611 **−0.0779
(0.1216)(0.1099)(0.0974)
Dual 0.0047−0.0020−0.0031
(0.0158)(0.0158)(0.0139)
SOE −0.1477 ***−0.01280.0176
(0.0201)(0.0410)(0.0321)
FirmAge 0.5684 ***1.9925 ***0.0064
(0.0238)(0.0644)(0.0702)
Constant2.6203 ***−0.3726 **−5.0317 ***2.8724 ***
(0.0134)(0.1897)(0.2736)(0.3094)
Firm FENNYY
Year FENNNY
Obs16,89416,89416,55416,554
Adj.R20.2880.3490.5970.635
Note: The cluster robust standard error at the enterprise level is in parentheses. *, **, and ***, respectively, represent the significance levels of 10%, 5%, and 1%.
Table 4. Test results of dual machine learning.
VariableLasso RegressionGradient Boosting
DT0.0155 **0.0217 ***
(0.0072)(0.0036)
Obs16,89416,894
Note: The cluster robust standard error at the enterprise level is in parentheses. **, and ***, respectively, represent the significance levels of 5%, and 1%.
Table 5. Results of other robustness tests.
Variable(1)(2)(3)
Province Fixed EffectsCity Fixed EffectsAdding Control Variables
DT0.0225 **0.0224 **0.0214 **
(0.0089)(0.0090)(0.0087)
Cashflow −0.1173
(0.0723)
TOP1 0.0001
(0.0008)
Other controlY
YY
Firm FEYYY
Year FEYYY
City FENYN
Province FEYNN
Obs16,55416,55316,554
Adj.R20.6350.6290.635
Note: The cluster robust standard error at the enterprise level is in parentheses. ** represents the significance levels of 5%.
Table 6. Results of endogeneity tests.
VariablesInstrumental Variables MethodHeteroskedastic Instrumental Variables Method
DTGTGT
IV−1388.5627 ***
(15.0380)
DT 0.0175 *0.4469 ***
(0.0094)(0.0134)
Phase I F-value8526.62
K-P rk LM statistic 1256.445824.140
K-P rk LM P-value 0.0000.000
K-Paap rk Wald F statistic 8526.620238.889
15% maximal IV size 8.9631.58
Control variablesYYY
Firm FEYYY
Year FEYYY
Obs16,55416,55416,894
Adj.R20.9790.0004590.527
Note: The cluster robust standard error at the enterprise level is in parentheses. *, and ***, respectively, represent the significance levels of 10%, and 1%.
Table 7. Results of heterogeneity tests.
VariableNew Energy CompaniesDegree of Competition in the IndustryEnterprise Life Cycle
NoYesLowHighGrowthMaturityDecline
DT0.0218 **0.02260.01900.0259 **0.00300.0334 **0.0019 (0.0247)
(0.0088)(0.0436)(0.0144)(0.0114)(0.0146)(0.0155)
Control variablesYYYYYYY
Firm FEYYYYYYY
Year FEYYYYYYY
Obs15,95859663639977669558712443
Adj.R20.6350.6330.6480.6230.6480.6220.613
Note: The cluster robust standard error at the enterprise level is in parentheses. ** represents the significance levels of 5%.
Table 8. Results of the mechanism test.
Variable(1)(2)(3)
GIN × DT0.1923 ***
(0.0568)
GIN−0.0209 *
(0.0110)
GIQ × DT 0.3194 ***
(0.0990)
GIQ −0.0319 *
(0.0181)
SLGI × DT 0.0121 ***
(0.0026)
SLGI −0.0012 **
(0.0005)
DT0.0217 **0.0217 **0.0215 **
(0.0087)(0.0087)(0.0086)
Controls variablesYesYesYes
Firm FEYYY
Year FEYYY
Obs16,55416,55416,554
Adj.R20.6350.6350.635
Note: The cluster robust standard error at the enterprise level is in parentheses. *, **, and ***, respectively, represent the significance levels of 10%, 5%, and 1%.
Table 9. Results of SLGI threshold effects test.
ThresholdFpNumber of BSThreshold Value
1%5%10%
Single15.800.00030011.6097.85715.80
Double5.870.1673009.6437.5356.406
Table 10. Results of SLGI threshold regression.
VariableCoef.Std. Errt-Valuep-Value
Lev−0.6301 ***0.1099−5.740.000
Size0.1842 ***0.03655.050.000
TobinQ−0.0187 **0.0088−2.110.035
Growth0.00100.02850.040.971
ROA−0.19160.2468−0.780.438
Dual0.01150.03180.360.719
SOE0.05650.08990.630.530
FirmAge2.6791 ***0.090129.730.000
DT (SLGI ≤ 2.6039)−0.00080.0008−1.000.318
DT (SLGI > 2.6039)0.0022 **0.00092.510.012
Cons−8.3637 ***0.6447−13.400.000
Note: The cluster robust standard error at the enterprise level is in parentheses. **, and ***, respectively, represent the significance levels of 5%, and 1%.
Disclaimer/Publisher’s Note: The statements, opinions and data contained in all publications are solely those of the individual author(s) and contributor(s) and not of MDPI and/or the editor(s). MDPI and/or the editor(s) disclaim responsibility for any injury to people or property resulting from any ideas, methods, instructions or products referred to in the content.

