Article

Machine Learning in Mode Choice Prediction as Part of MPOs’ Regional Travel Demand Models: Is It Time for Change?

1
Department of City and Metropolitan Planning, College of Architecture + Planning, University of Utah, 375S 1530E, Salt Lake City, UT 84112, USA
2
Department of Urban Studies and Planning, Massachusetts Institute of Technology (MIT), MIT 9-216, 77 Massachusetts Avenue, Cambridge, MA 02139, USA
3
Department of Geography, University of Utah, 375S 1530E, Salt Lake City, UT 84112, USA
4
Department of Planning and Urban Studies, University of New Orleans, 378 Milneburg Hall, 2000 Lakeshore Drive, New Orleans, LA 70148, USA
*
Author to whom correspondence should be addressed.
Sustainability 2025, 17(8), 3580; https://doi.org/10.3390/su17083580
Submission received: 21 February 2025 / Revised: 29 March 2025 / Accepted: 8 April 2025 / Published: 16 April 2025
(This article belongs to the Section Sustainable Transportation)

Abstract

This study aims to improve the predictive accuracy of metropolitan planning organizations’ (MPOs’) travel demand models (TDM) by unraveling the factors influencing transportation mode choices. By exploring the interplay between trip characteristics, socioeconomics, built environment features, and regional conditions, we aim to address existing gaps in MPOs’ TDMs which revolve around the need to also integrate non-motorized modes and a more comprehensive array of features. Additionally, our objective is to develop a more robust predictive model compared to the current nested logit (NL) and multinomial logit (MNL) models commonly employed by MPOs. We apply a one-vs-rest random forest (RF) model to predict mode choices (Home-based-Work, Home-Based-Other, and non-home-based) for over 800,000 trips by 80,000 households across 29 US regions. Validation results demonstrate the RF model’s superior performance compared to conventional NL/MNL models. Key findings highlight that increased travel time and distance are associated with more auto trips, while household vehicle ownership significantly affects car and transit choices. Built environment features, such as activity density, transit density, and intersection density, also play crucial roles in mode preferences. This study offers a more robust predictive framework that can be directly applied in MPO TDMs, contributing to more accurate and inclusive transportation planning.

1. Introduction

Recognizing the significance of incorporating non-motorized modes of transportation, several planning organizations have initiated the integration of walking and bicycling into their travel demand models. Mode choice is the third phase in the traditional four-step modeling process, coming after trip distribution and before network assignment. This pivotal mode choice step is responsible for determining the proportion of trips allocated to each distinct mode of transportation across various zone pairings and trip purposes.
The demand for more accurate forecasts of pedestrian and bicycle travel has arisen, even as conventional models have predominantly emphasized motorized modes of transportation [1]. This shift has far-reaching implications. In addition to evaluating project benefits in relation to factors like transit passenger demand, reductions in greenhouse gas emissions, and energy consumption, it involves prioritizing initiatives based on user interest and the potential to attract new pedestrians or cyclists. It necessitates the development of dedicated networks to support these non-motorized modes, addressing shortcomings in existing networks and enhancing safety measures [2].
Tour-based models bifurcate mode choice in tour and trip levels. Trip-level mode choice pertains to each trip within a tour, between each pair of stops, dependent on tour mode choice. Regardless of the model type—four-step or tour-based—mode choice determinations draw on probabilities derived from various characteristics encompassing trip attributes, traveler profiles [3], the availability of transportation options including public transit, and the contextual built environment of travel [4].
Despite two decades of research extensively examining how the built environment shapes travel behavior and mode choice [5,6,7,8,9,10,11,12], only a handful of agencies have factored a full set of built environment characteristics into their modeling process. In essence, metropolitan planning organizations (MPOs) commonly incorporate trip, mode, and socio-demographic attributes but tend to overlook built environmental variables in the context of modeling travel mode choice. Furthermore, only a minority of MPOs incorporate non-motorized modes of walking and cycling within their mode choice models. Notably, the Wasatch Front Regional Council (WFRC) and Mountainland Association of Governments (MAG) accommodate non-motorized trips, albeit primarily through trip distance and with no consideration of the built environment features. A substantial reason for the exclusion of walk and bike modes in certain MPOs’ models stems from data deficiencies, particularly pertaining to bicycle trips.
Central to this study, the objective is to underscore that the built environment, encapsulated in the “D variables” (development density, land use diversity, street design, distance to transit, and destination accessibility), wields a pivotal influence in inducing non-motorized transportation modes. While the extent of this influence varies, D variables consistently promote non-motorized and transit-based travel. Higher densities, mixed land uses, grid-type network layouts, and improved access to core destinations are anticipated to bring about an increase in non-motorized trips [13,14,15].
The next objective pertains to the modeling methodology. Whether in trip-based or tour-based models, the formulation of mode choice involves discrete choice frameworks corresponding to specific tour or trip modes. Multinomial logit (MNL) and nested logit (NL) models represent two prevalent approaches within discrete choice modeling. Notably, WFRC/MAG employed a nested multinomial logit mode choice model to gauge the division between non-motorized (walk/bike) and motorized (auto and transit) trips. In this study, we are seeking to improve the current models being employed by the MPOs.
This research uses data extracted from 29 distinct U.S. regions, which serves as the foundation for the incorporation of the “D variables” representing the built environment. The execution of four distinct RF models, accompanied by a subsequent comparative analysis, led to the identification of the most optimal model. The employed methodology is a machine learning (ML) paradigm, specifically a random forest (RF) model. The discernible edge in accuracy exhibited by the ML approach—exemplified by the one-vs-rest RF model—prompted its selection as the ultimate modeling strategy moving forward. Overall, this model improves accuracy and precision in modeling outcomes. After concluding the research trajectory, a rigorous evaluation transpires, juxtaposing the outcomes gleaned from our devised model with the pre-existing pioneer MPOs’ models. This assessment serves as a metric for assessing the precision and validity of our model vis-à-vis a well-established counterpart.
The subsequent sections of this paper are structured as follows. Section 2 has two sub-sections: Section 2.1 presents a comprehensive review of the pertinent literature on travel mode choice, with a special emphasis on non-motorized modes, and Section 2.2 sheds light on the gaps in the existing practices, also known as MPOs’ travel demand models. Section 3 outlines our data, variables, and our methodology. Our model outcomes and findings are presented in Section 4, followed by an evaluation of our models vis-à-vis existing models in Section 5. Lastly, Section 6 synthesizes the findings and presents concluding remarks.
In summary, this study contributes to the transportation modeling literature by applying a machine learning-based approach, specifically a one-vs-rest random forest (RF) model, to mode choice prediction. By comparing its performance against the traditional nested logit (NL) and multinomial logit (MNL) models commonly used by MPOs, we demonstrate the potential advantages of ML techniques in handling complex mode choice behavior. Our results reveal that the RF model consistently outperforms the NL model across multiple performance metrics, underscoring its superior predictive power. Additionally, we identify nuanced relationships between built environment factors and mode choice that traditional models may overlook. These findings provide valuable insights for transportation planners seeking to enhance the accuracy of travel demand forecasting.

2. Literature Review

2.1. Mode Choices Within Research Body

The impacts of the built environment factors on mode choice have been extensively explored within the body of the literature [4,9,15,16,17,18]. This influence has typically been investigated based on classification due to five key elements in the relevant studies (i.e., density, diversity, design, destination accessibility, and Distance to transit) [19,20]. Since covering all determinants explored in the prior research is infeasible, utilizing these dimensions as a structured framework would be beneficial in comprehending the nuanced interplay between built environment factors and travel behaviors.
Twenty-five published studies centered on non-motorized travel mode choice utilizing varied response variables have been synthesized in Table 1. Notably, there is an evolution in approach over time, with earlier studies often assessing the likelihood of selecting non-motorized travel modes [8,19,21,22], while in a more contemporary context, there is a discernible shift toward recognizing the divergence between walking and biking modes, prompting a more separate examination of these two modes within the modeling process [12,23,24,25,26,27,28,29,30,31,32,33].
Central to these studies, the five Ds consistently emerge as influential factors. Across this diverse array of studies, while effect sizes and trip purposes may diverge, walk mode choices showcase a positive association with higher population and employment densities, bigger retail floor area ratios (FARs), mixed and diversified land use, and proximity to nearby commercial development [23,25,26,29,30,32]. Furthermore, the choice of bicycle correlates directly with bigger population densities and land use diversity [25,26], although reduced biking within contexts of greater job and population densities has also been noted [12].
Intriguingly, while density and diversity variables form a common thread, the distinction between walk and bike mode choices becomes evident through design variables. Walk mode choice models delve into intricate pedestrian environment facets, entailing enhanced street connectivity, including shorter block sizes, denser blocks, fewer cul-de-sac streets, and expanded and/or wider sidewalks, collectively propelling the walking likelihood [29,31,33]. Conversely, bike mode models embed variables pertaining to bicycling infrastructure and designated bike lanes, underscoring the catalytic role of bicycling amenities and, generally, environments that are conducive to cycling [25,33].
Regarding the last two Ds, a small amount of research introduces variables that encompass destination accessibility and access (distance) to transit. For instance, good access to employment and a smaller walking period (time or distance) are conducive to a higher probability of walking [21,24,31]. Moreover, shorter travel times correlate with an increased likelihood of biking [31].
The evolution in methodology in the body of research is also worth noting. Earlier studies leaned towards statistical approaches and predominantly utilized non-linear models, often relying on logit regressions. However, a noteworthy shift has emerged in recent research endeavors, mirroring our own study. We have observed other studies attempting to enhance their prediction accuracy by employing machine learning techniques. Specifically, Cheng et al. [34] modeled mode choice by adopting the random forest model, while Liu et al. [35] explored the realm of travel behavior with an extreme gradient boosting model. This methodological diversification marks a compelling development in the pursuit of more refined and effective modeling approaches within the research domain.
Table 1. A summary of the built environment determinants of non-motorized mode choices.
StudyMethodFive Built Environment Ds
DensityDiversityDesignDestination AccessibilityDistance to Transit
Non-motorized mode choice
Kockelman (1997) [21]Logistic regression-Land use mix (+)-Job accessibility by walking (+)-
Cervero & Kockelman (1997) [19]Logistic regression--Sidewalk width (+), Proportion front and side parking (+)--
Zhang (2004) [8]Multinomial logit regression, Nested logit regressionPopulation density (+), Job density (+)Entropy of land use balance (+)Street connectivity (+)--
Bento et al. (2005) [22]Multinomial logit regressionPopulation density (−)Job-housing balance (−)--Supply of rail transit (+)
Walk or Bike Mode Choice
Reilly & Landis (2002) [23]Multinomial logit regressionPopulation Density (+)Distance to closest commercial use (−)---
Rajamani et al. (2003) [30]Multinomial logit regression-Land use mix (+)% Cul-de-sac street (−)--
Ewing et al. (2004) [31]Multinomial logit regression--Average sidewalk coverage (+)Walk time to school (−)-
Ewing et al. (2004) [31]Multinomial logit regression---Bike time to school
(−)
-
Kim et al. (2007) [24]Multinomial logit regression--Park and ride lot at the station (−)-Distance between home and station (−)
Frank et al. (2008) [32]Nested logit regressionRetail floor area ratio (+)Land use mix (+)Intersection Density (+)--
Mitra (2012) [28]Binomial regression-Jobs-to-population ratio (−)block density (+)--
Ozbil & Peponis (2012) [29]Linear regression-Mixed-use entropy (+)Street connectivity (+)--
Hamre & Buehler (2014) [25]Multinomial logit regressionPopulation density (+)----
Hamre & Buehler (2014) [25]Multinomial logit regressionPopulation density (+)Urban core (+)Bikeway supply (+)--
Khan et al. (2014) [12]Multinomial logit regression--3-way intersection density (+), 4-way intersection density (+)--
Khan et al. (2014) [12]Multinomial logit regressionPopulation + Job density (−)-4-way intersection density (+)
Ferrell et al. (2015) [26]Multinomial logit regressionPopulation density (+)Mixed-use (+)4-way intersection density (+)--
Aziz et al. (2018) [33]Multinomial logit regression--Sidewalk width (+)--
Aziz et al. (2018) [33]Mixed Logit regression--Bike land length (+),
Fraction open space (+)
--
Aziz et al. (2018) [33]Mixed Logit regression Fraction of
industrial land use (−)
Fraction of residential land use in destination (−)
Sidewalk width (+)
Bike lane length (+)
Bike lane proportion (+)
Ton et al. (2019) [36]Multinomial logit regression Activity spaces (+)
Presence of public buildings and shops (+)
Street furniture:
garbage bins (+) playgrounds (−)
Bicycle parking (+)
Suburban areas (−)
Cheng et al. (2019) [34]Random forest Land Entropy (+)Road density (+)Travel time (−)Distance to the nearest Metro station (−)
Distance to the nearest bus stop (−)
Bus network density (+)
Number of bus stops in 500 m neighborhood (+)
Liu et al. (2021) [35]Extreme Gradient BoostingPopulation density (+)Land use entropy (+)
Job density (+)
Intersection density (+)Trip distance (−)
Distance to city
center (−)
Bus stop density (+)
(+) = positive relationship. (−) = negative relationship.

2.2. Mode Choices Within Travel Demand Practices

2.2.1. Limitations of the Four-Step Models

The prediction of travel mode choice is an integral step within the traditional four-step travel demand model that might include various transportation modes such as private motorized vehicles, public transit, walking, biking, and other alternatives. Fundamental to these travel mode choice models is the endeavor to unearth the relationships between users’ mode choices and the influential determinants [24,31,37]. However, it is important to note that non-motorized travel has historically been neglected in regional forecasting models due to data inconsistency, limited records of non-motorized trips, and a historical lack of interest from MPOs [38,39]. Nevertheless, in this paper, we attempt to bridge this gap by establishing frameworks for mode choice modeling and identifying significant variables that induce walking and bike choices. Overlooking built environment features as an important influential factor is another gap that our study aims to address, recognizing the critical role these factors play in shaping individuals’ mode choices.
This section of our report delves into an extensive review of the MPOs’ travel demand models across the US. The primary aim is to evaluate the extent to which these models incorporate or overlook non-motorized modes of transportation within their frameworks, and how comprehensive the list of influential determinants in their models is.

2.2.2. Current Trends in Mode Choice Modeling Within MPO Travel Demand Practices

The inclusion of non-motorized travel mode choice into regional travel demand models is a relatively recent development, spanning less than thirty years. This period has witnessed the exploration of diverse modeling structures and a wide spectrum of factors in the pursuit of refining these models [38,40].
To assess prevailing modeling practices for walk and bike mode choices, we conducted a survey of 25 randomly selected MPOs across the United States. The information presented in Table 2 was obtained through a comprehensive review of MPO travel demand model reports obtained by direct outreach to MPOs. After the survey, we contacted MPO modelers individually to verify their current mode choice modeling practices and clarify any missing or ambiguous details. Our analysis aimed to highlight the gap between academic research and its practical application in regional travel demand modeling. While these MPOs represent a range of population sizes, our focus was particularly on larger regions, often regarded as leaders in adopting novel travel modeling methodologies.
The review reveals several key observations, aligning with findings from Singleton et al. (2013, 2018) [38,41]. Among the 25 MPOs analyzed, the Des Moines Area MPO does not include a mode choice model in its regional TDM. The Stanislaus Council of Governments (StanCOG) adopts an adjustment procedure rather than a full mode choice analysis due to the region’s low share of transit trips. Additionally, 13 MPOs incorporate mode choice models but only for motorized modes (i.e., automobiles and transit), omitting non-motorized trips. This means that a total of 15 MPOs do not explicitly model walk and bike mode shares.
Of these 15 MPOs, the North Jersey Transportation Planning Authority (NJTPA) and the Chicago Metropolitan Agency for Planning (CMAP) differentiate between motorized and non-motorized trips after the trip generation stage but do not explicitly model non-motorized modes in the mode choice step.
The remaining MPOs have been observed to predominantly utilize two model forms in their mode choice step—the multinomial logit (MNL) model and the nested logit (NL) model. Despite the prevalent use of the MNL model in the United States (as evidenced by the Fresno report, 2014) [42], our results exhibit variation. Among the remaining MPOs that do include active modes, five use a nested logit (NL) model, while four employ a multinomial logit (MNL) model. The Lincoln MPO takes a different approach, using a direct distance-based algorithm to estimate non-motorized mode shares. Furthermore, seven MPOs that predict non-motorized trips rely solely on travel distance or time as predictive variables. The Association of Monterey Bay Area Governments (AMBAG) integrates additional factors such as trip time and total job density, while the Memphis Urban Area MPO includes household income and population density as explanatory variables. These variations highlight the lack of a standardized approach to modeling active transportation within MPO travel demand models.
Table 2 provides a detailed summary of how different MPOs incorporate (or do not incorporate) non-motorized modes into their travel demand models. By synthesizing these findings, this study underscores the inconsistencies in MPO practices and the need for a more comprehensive, standardized approach to mode choice modeling that better reflects real-world travel behavior.

3. Materials and Methods

3.1. Data

In this study, we leverage two distinct categories of data to comprehensively investigate the factors influencing mode choice.

3.1.1. Household Travel Survey

The dataset utilized in this study comprises comprehensive data derived from 29 distinct regions across the United States. The household travel survey data used in this study were obtained from various metropolitan planning organizations (MPOs) and regional transportation agencies across 29 U.S. regions. These surveys were conducted as part of regional travel demand modeling efforts and include detailed trip-level records collected through self-reported travel diaries. The pooled dataset was compiled from available travel survey data, supplemented with agency-provided datasets when necessary. Many of the household-level travel datasets were obtained under non-disclosure agreements. Our final dataset encompasses a total of 761,623 trips undertaken by 86,400 households. The trips are further categorized into three distinct trip purposes, namely home-based work (HBW), home-based other (HBO), and non-home-based (NHB), constituting 118,915, 403,636, and 239,072 trips, respectively. It is noteworthy that the home-based shop (HBShp) trips are amalgamated with HBO trips, while the NHB category encompasses both non-home-based work and non-home-based non-work trips.
However, it is essential to acknowledge the presence of missing values within our dataset. To facilitate random forest (RF) modeling, these missing values were systematically addressed, resulting in a refined dataset. Consequently, the final dataset includes 117,703, 390,384, and 233,168 trips with non-missing values for HBW, HBO, and NHB, respectively. It is important to highlight that the non-motorized mode share within these regions exhibits variations, with percentages fluctuating from one region to another. For instance, non-motorized mode shares for regions like Boston stand at approximately 20 percent, whereas a region such as Houston, TX, reports considerably lower percentages, around 2.8 percent. It is worth noting that, on average, the utilization of non-motorized modes for HBO trips tends to surpass that of other trip purposes. This share varies across regions, ranging from 5% in San Antonio, TX, to a notable 25% in Seattle, WA.

3.1.2. Built Environment

Within the category of built environmental data, our study incorporates a comprehensive set of variables that encapsulate the five Ds and aims to measure the influence of the built environment on mode choice. These data are controlled and analyzed at the Traffic Analysis Zone (TAZ) level. Firstly, we integrate parcel-level land use data that provides detailed classifications of land use. This dataset forms the basis for calculating measures of land use mix, a critical factor in understanding mode choice behavior. Secondly, we leverage Geographic Information System (GIS) layers that furnish essential information regarding street networks and intersections. From these GIS layers, we extract data to compute intersection density, as well as to determine the percentage of four-way intersections within each TAZ. These measures offer insights into the street design and ease of mobility within the built environment. Furthermore, we utilize GIS data that specifically outlines the locations of transit stops. This dataset enables us to calculate transit stop densities within TAZs, which is a proxy of access to transit and can significantly influence mode choice. Moreover, to capture the population and employment dynamics within our study regions, we acquire data at the block or block group level. These demographic and economic statistics serve as the foundation for computing activity density, shedding light on the level of activity within different areas. Lastly, we incorporate GIS layers that delineate TAZs, enriched with socioeconomic information such as population and employment. Additionally, we integrate travel times for both auto and transit travel between TAZs, commonly referred to as travel time skims. These data, in conjunction with TAZ employment statistics, allow us to calculate regional employment accessibility measures for both auto and transit modes. These accessibility measures offer valuable insights into the ease of access to employment centers via different modes of transportation.
Together, this diverse and comprehensive set of built environmental data enables us to examine how various aspects of the built environment influence mode choice, contributing to a deeper understanding of travel behavior across the selected regions.

3.2. Variables

3.2.1. Outcome Variable

The central outcome variable under investigation in this study is “mode choice”. It represents the mode of transportation chosen by travelers and is categorized into four distinctive classes: walking, bicycling, using public transit, or driving a private car. This outcome variable forms the core of our analysis, serving as a pivotal point for understanding the choices made by individuals regarding their preferred mode of travel.

3.2.2. Explanatory Variables

Our analysis incorporates an extensive range of explanatory variables, categorized into four distinct groups:
Trip Characteristics: These variables include travel distance and travel time, reflecting the physical and temporal aspects of trips. Travel distance impacts mode choice by considering convenience and accessibility, while travel time offers insights into the time commitment required for specific modes of transportation. We normalized travel time based on the average speed of each mode of transport to achieve more meaningful results.
Households’ Socioeconomic Characteristics: This category explores the influence of household-related factors on mode choice. Variables such as household size, the number of employed individuals, age, average household income, and vehicle ownership play pivotal roles in shaping transportation choices.
Built Environment Variables (5Ds): We considered key built environment variables that encapsulate the fundamental attributes of the physical surroundings. These variables directly influence the convenience, accessibility, and appeal of non-motorized travel modes, namely walking and bicycling. The variables within this category include activity density, job–population balance, land use entropy, intersection density, the percentage of four-way intersections, transit stop density, and the percentage of jobs that are accessible within specified drive times or transit ride times.
Regional Variables: This category examines regional-level factors that influence mode choice. Variables such as regional population, regional population density, gas prices, and weather conditions (including temperature and precipitation) can impact travelers’ mode choices, leading to fluctuations in transportation preferences. The data for these variables were obtained from governmental statistical agencies, climate monitoring databases, and fuel price reports. These regional attributes help capture broader economic and environmental conditions that may affect travel behavior, providing additional context for understanding mode choice patterns. Table 3 presents an overview of the variables used in this study, along with their corresponding descriptive statistics.
This selection regarding explanatory variables in this study was guided by prior research on mode choice modeling and factors commonly found to influence travel behavior (e.g., [3,4,5,6,7,8,9,43,44]). In addition, we incorporated variables based on theoretical considerations and their relevance to the specific context of our study. For instance, built environment variables were selected based on the widely recognized 5Ds framework (density, diversity, design, destination accessibility, and distance to transit), while regional factors were included to capture broader contextual influences on travel behavior.

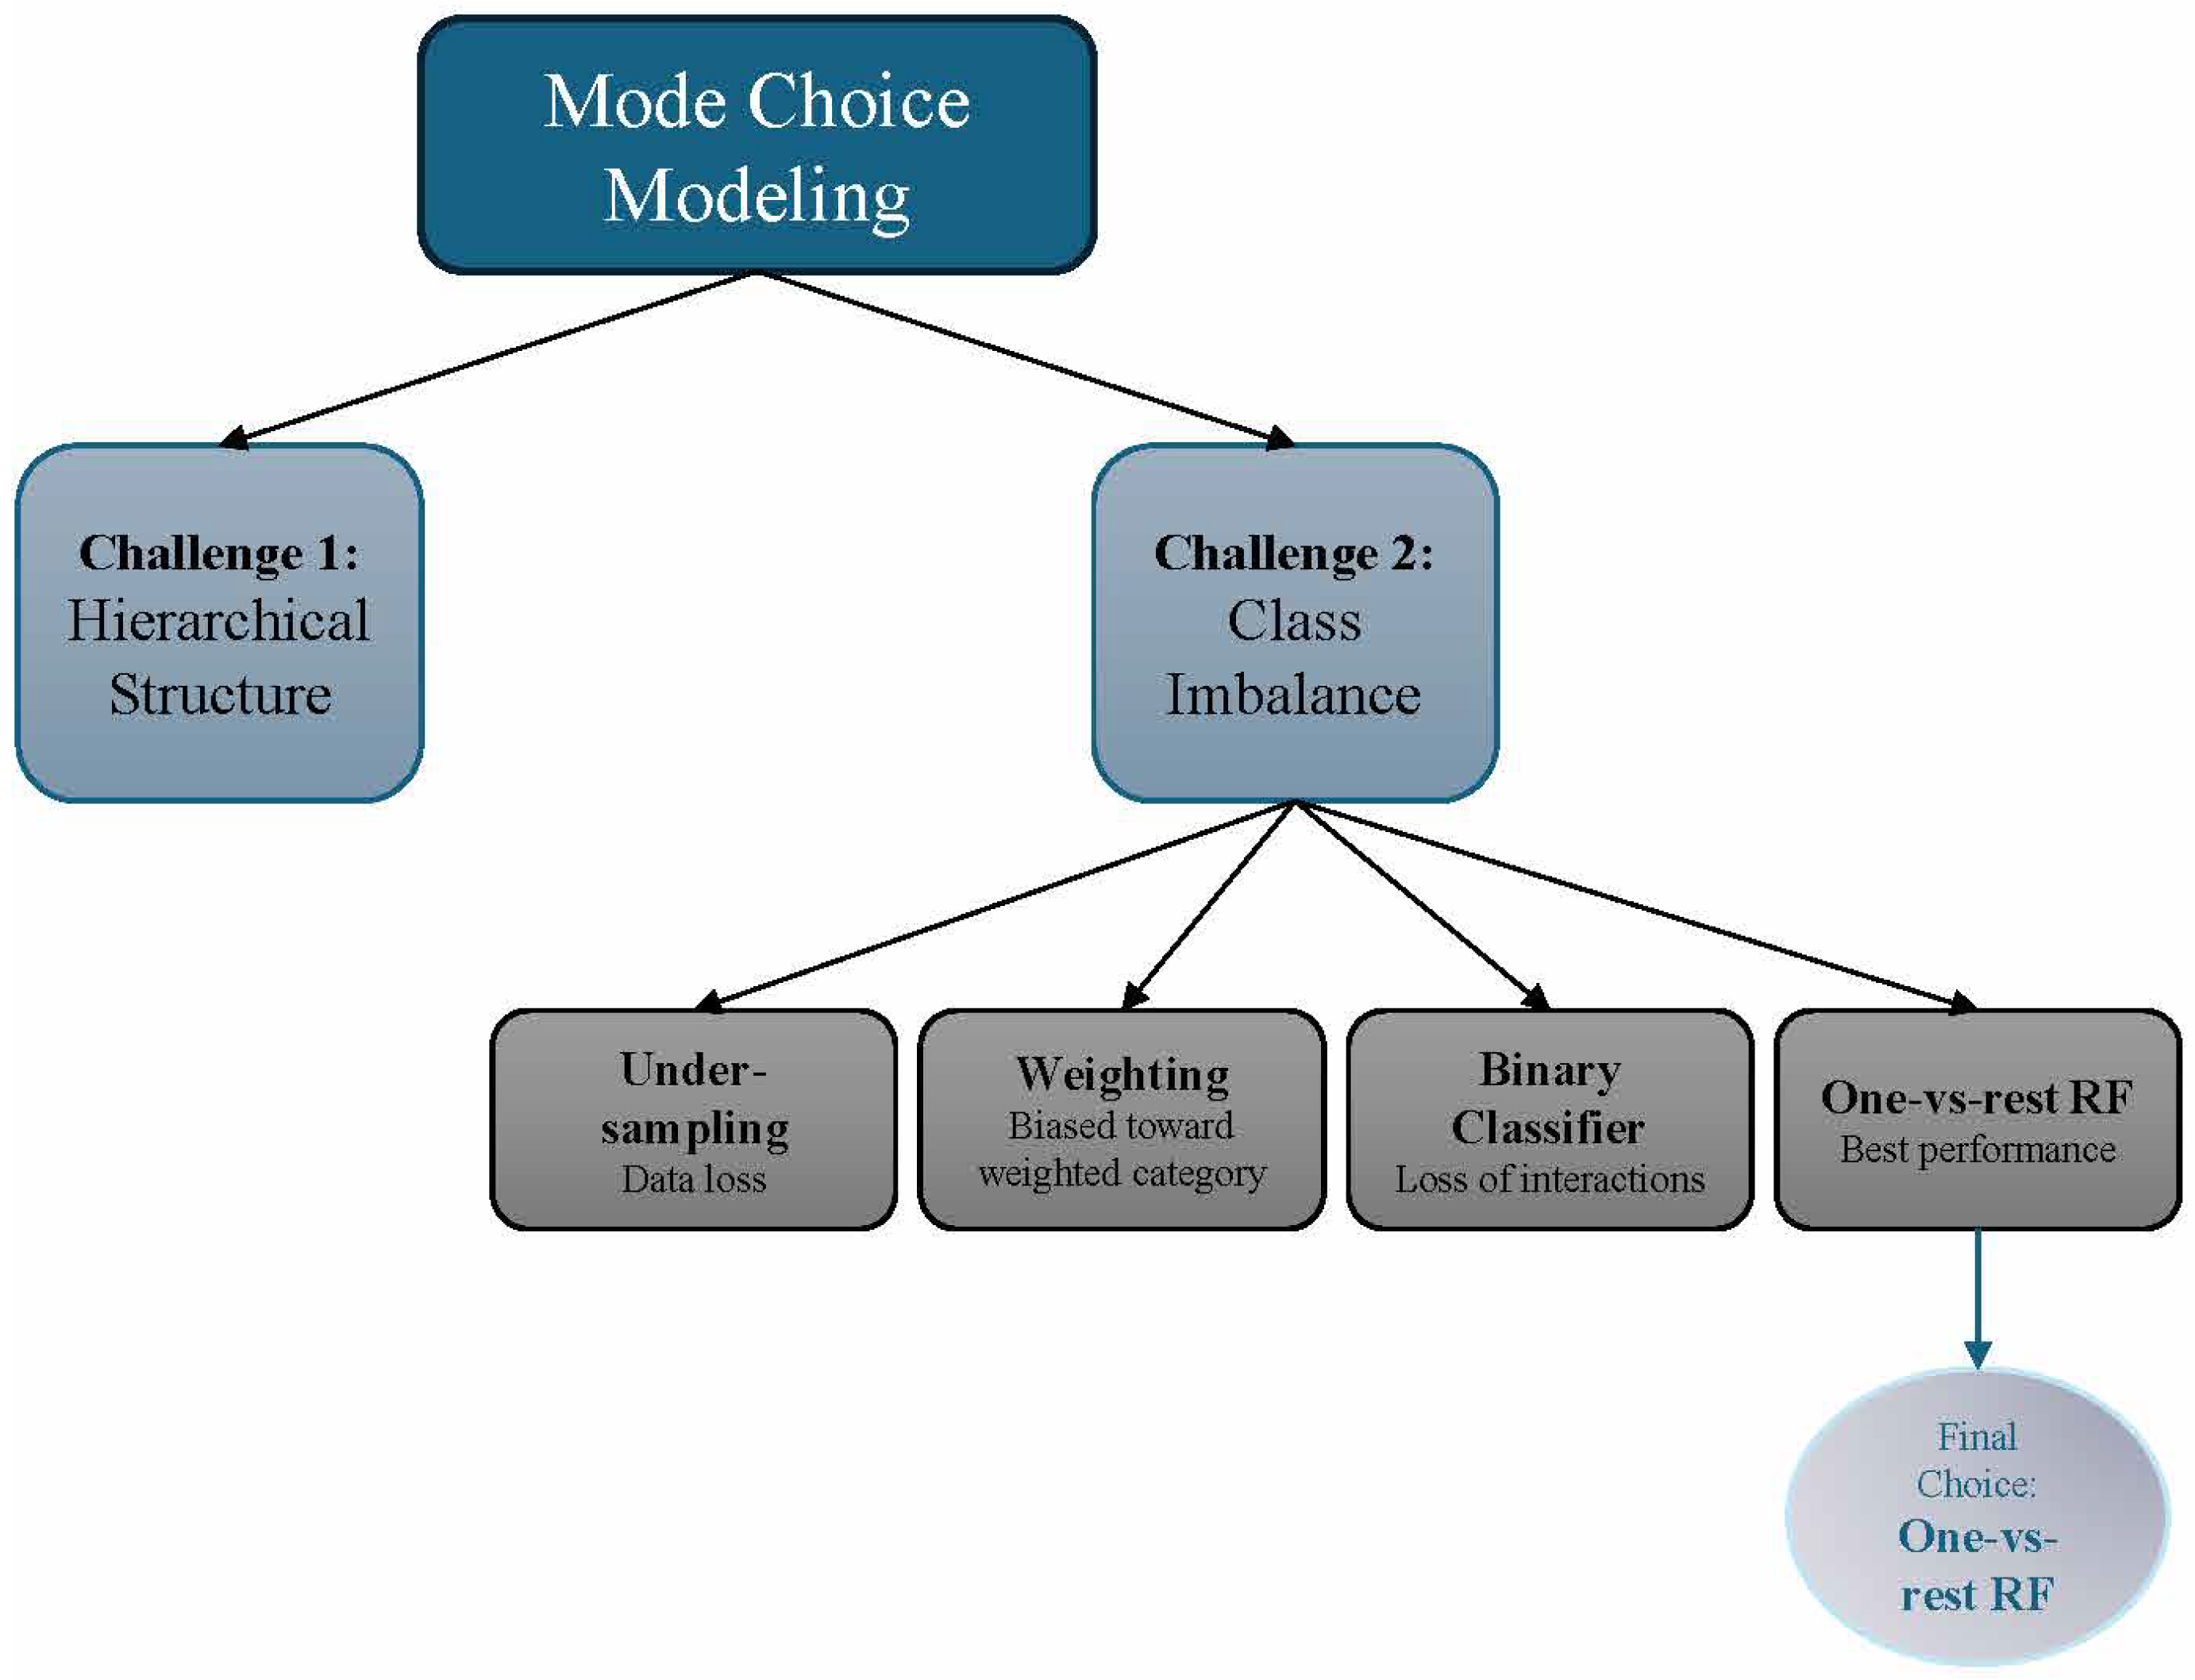
3.3. Analysis Methodology

In this section, we present our analysis methodology, designed to accommodate the categorical nature of our outcome variable and the hierarchical structure that is inherent in our dataset. Our outcome variable, “mode choice”, is categorical and encompasses four distinct classes: “walk”, “bike”, “transit”, and “car”. To effectively analyze this categorical variable, we have selected the random forest (RF) model, a robust choice for classification tasks involving partitioned choice sets. Random forest (RF) is an ensemble learning method that constructs multiple decision trees during training and outputs either the majority vote (for classification) or the average prediction (for regression). The model operates by randomly selecting subsets of data and features for each tree, thereby reducing overfitting and improving generalization [45]. RF is particularly useful for handling complex, high-dimensional datasets and capturing non-linear relationships between variables. Unlike traditional econometric models that rely on predefined functional forms and assumptions about variable relationships, RF models can flexibly learn patterns from data without prior structural constraints [46]. Additionally, feature importance scores derived from RF provide valuable insights into the relative influence of different predictors on travel mode choice; so, it is particularly advantageous for our analysis. This comprehensive approach empowers us to also effectively model and investigate the mode choice behavior of travelers in diverse regions across the United States. So, the RF model was selected for this study due to its robustness in handling high-dimensional and mixed data, its ability to mitigate overfitting through ensemble learning, and its interpretability via feature importance rankings. RF offers a balance between predictive accuracy, computational efficiency, and transparency, making it well-suited for mode choice modeling [46].
However, we encountered several challenges during our process. First, our dataset exhibits a hierarchical structure, where trips are nested within households within regions. This issue cannot be captured solely by RF. The second notable challenge in our analysis is the presence of class imbalance within our outcome variable. Specifically, more than 90% of trips fall into the “car” category, while the combination of “walk”, “bike”, and “transit” modes comprises less than 10% of the dataset. To mitigate the effects of this class imbalance, we experiment with four distinct approaches (See Figure 1):
  • Under-sampling: This approach entails a random reduction in instances in the majority class (in this instance, “car”) to achieve a balanced class distribution. Employing under-sampling led to a reduction in our data size, resulting in a substantial decrease in computational time. However, it raised concerns about potential data loss.
  • Weighting: We assigned varying weights to each class based on their representation in the dataset. This approach aims to provide more emphasis on the minority classes during model training to address the class imbalance issue. However, this approach presented several drawbacks. Firstly, the random forest model, when using class weights, tends to prioritize the class with higher weights, potentially leading to a biased model. Secondly, in our case, the high class imbalance resulted in an overly dominant influence of the “car” class, diminishing the model’s ability to effectively capture patterns in the minority classes. Additionally, the weighting method did not sufficiently alleviate the risk of overfitting to the majority class.
  • Binary Classifier: We developed two dedicated random forest models. The first model focused exclusively on non-car trips, including “walk”, “bike”, and “transit”. The second model served as a binary classifier, distinguishing between “car” (assigned a label of 1) and “non-car” (assigned a label of 0) trips. Despite its conceptual simplicity, this approach faced challenges. Firstly, by separating the problem into two models, we lost the holistic view of interactions among all travel modes. This lack of holistic modeling could lead to information loss and suboptimal predictive performance. Additionally, predicting “non-car” as a single class might oversimplify the nuanced differences between “walk”, “bike”, and “transit”.
  • One-vs-rest RF: The one-vs-rest RF method, also known as one-vs-all or unary coding, involves training a separate random forest model for each class, treating it as the positive class while grouping all other classes as the negative class. This way, we transform the multi-class classification problem into multiple binary classification problems. During prediction, the class associated with the model that yields the highest probability is assigned to the observation. This method effectively addresses class imbalance concerns and allows the random forest algorithm to provide robust predictions for each travel mode while yielding the best performance measures.
Ultimately, due to the limitations of the first three approaches and the desire for a more comprehensive analysis, we chose not to pursue the first three methods further. Instead, through comprehensive experimentation, we found that the One-vs-rest RF method yielded the most favorable results in managing class imbalance and optimizing overall model performance. The approach not only overcomes the challenges posed by an imbalanced class distribution but also provides interpretable results for each travel mode. The dataset was split into training and testing sets using an 80–20 ratio, where 80% of the data were used for training the model and 20% were reserved for testing. Additionally, to ensure the robustness of the model and prevent overfitting, we implemented k-fold cross-validation with k = 5. This approach divides the training data into five subsets, iteratively training the model on four subsets while validating on the remaining subset, ensuring a more reliable estimation of model performance.

4. Results and Discussion

In unraveling the intricacies of travel behavior, our exploration extends across three distinct trip purposes models: HBO, HBW, and NHB trips. The random forest model serves as our guide, revealing the role of variables influencing travel modes and providing nuanced insights into the diverse factors shaping mode choices. Zooming in on specific metrics for each travel mode for different trip purposes, our RF model showcases its effectiveness in predicting the most important determinant of people’s mode choices. The nuances of transportation choices, whether originating from home, work-related scenarios, or extending beyond, are encapsulated in the model’s predictive ability.

4.1. Performance Measures

Before starting to discuss the results of our expedition into understanding the influential factors affecting mode choice across varied trip purposes, we need to discuss the performance of our one-vs-rest RF model by testing the performance measures. For the HBO trips, the one-vs-rest RF model paints a compelling picture, achieving an outstanding overall accuracy of 99%. Then, we consider the balanced accuracy, which is crucial for accounting for class imbalances, and we observe a lower, yet impressive value of 97%. We also examined the Area Under the ROC Curve (AUC-ROC) for each travel mode. The AUC-ROC values for HBO trips stand out: bike: 0.91, car: 0.98, transit: 0.97, and walk: 0.98. The aggregated AUC for the full model is a robust 0.96, showcasing the model’s ability to discriminate effectively. As we navigate the nuanced ROC curves for each class, the varying performance across different travel modes becomes evident.
For the HBW trips, our RF model continues to impress, achieving an overall accuracy of 98.4%. The balanced accuracy score stands out at 95%, reflecting its adeptness in handling class imbalances. The AUC-ROC values are brilliant: bike: 0.995, car: 0.998, transit: 0.996, and walk: 0.999. The aggregated AUC for the full model is an impressive 0.997, underlining its robust discriminatory power.
As we explore NHB trips, the RF model maintains its high standards with an overall accuracy of 97.4%. The balanced accuracy score, slightly lower at 94%, demonstrates its ability to navigate class imbalances in this context. The AUC for the full model is a strong 0.98, and for each mode is as follows: bike: 0.95, car: 0.997, transit: 0.995, and walk: 0.998. This highlights its consistent discriminatory power. Figure 2 illustrates ROC curves for all three trip purposes divided by individual modes of transportation.

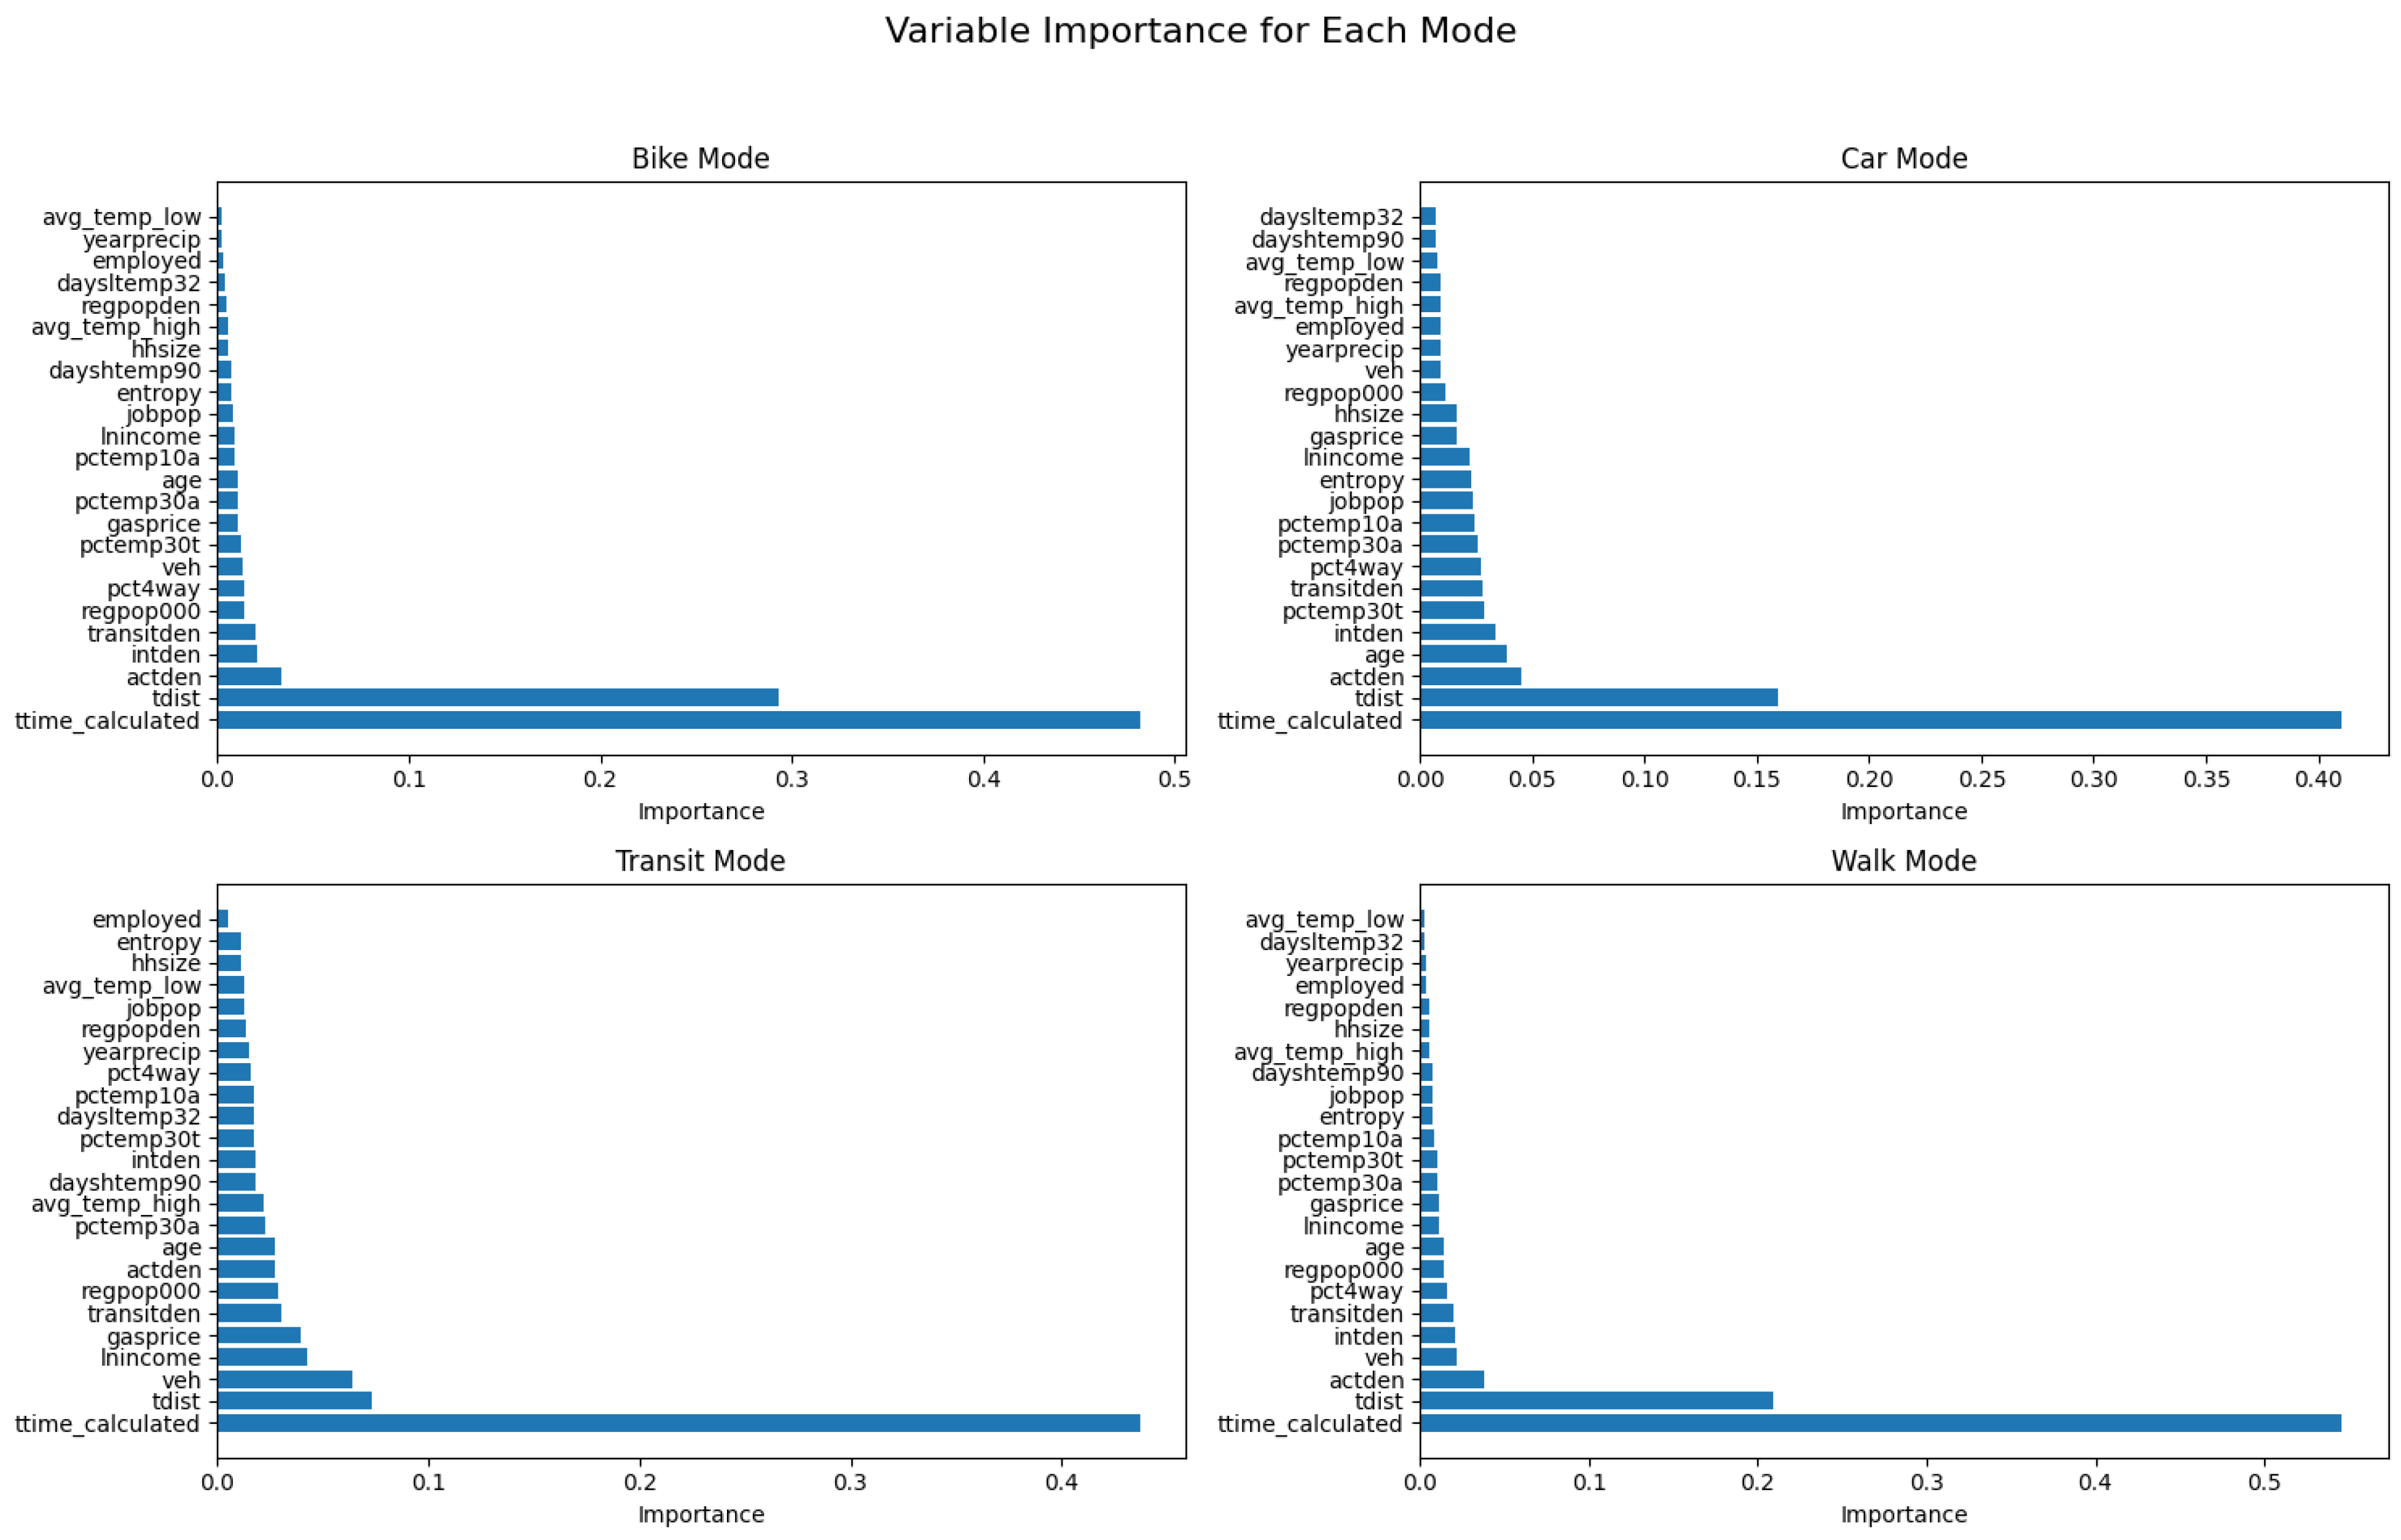
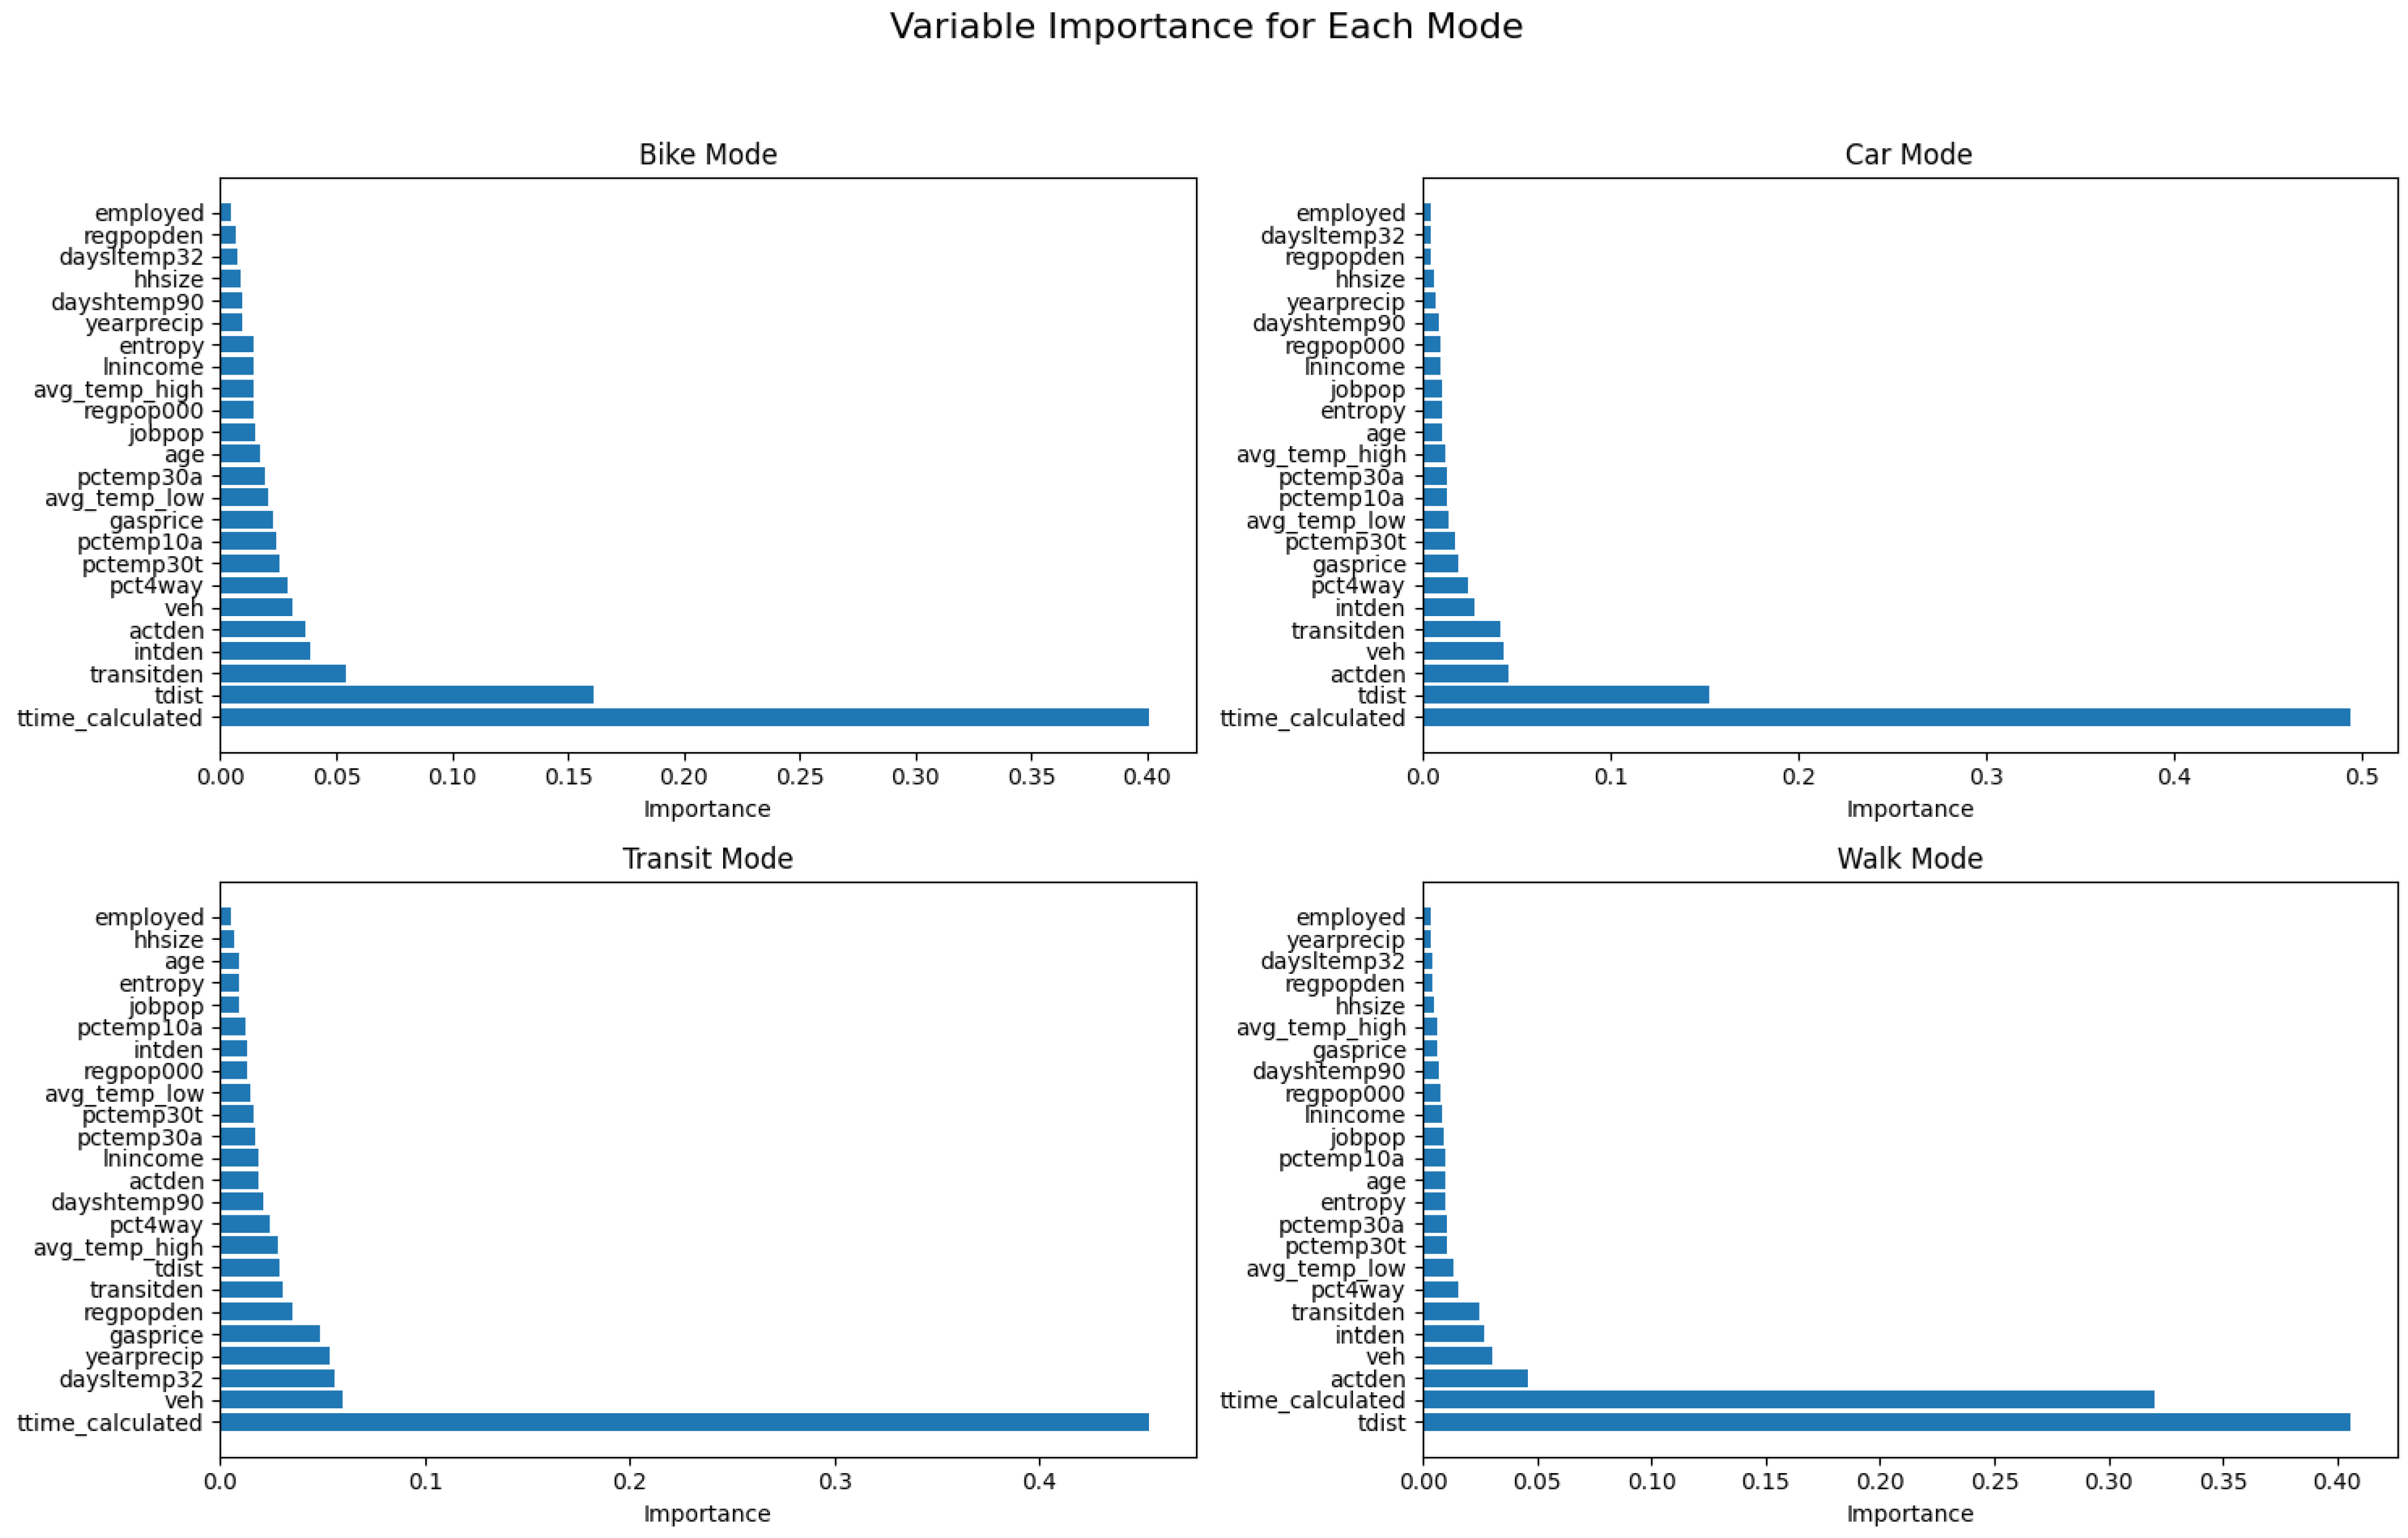
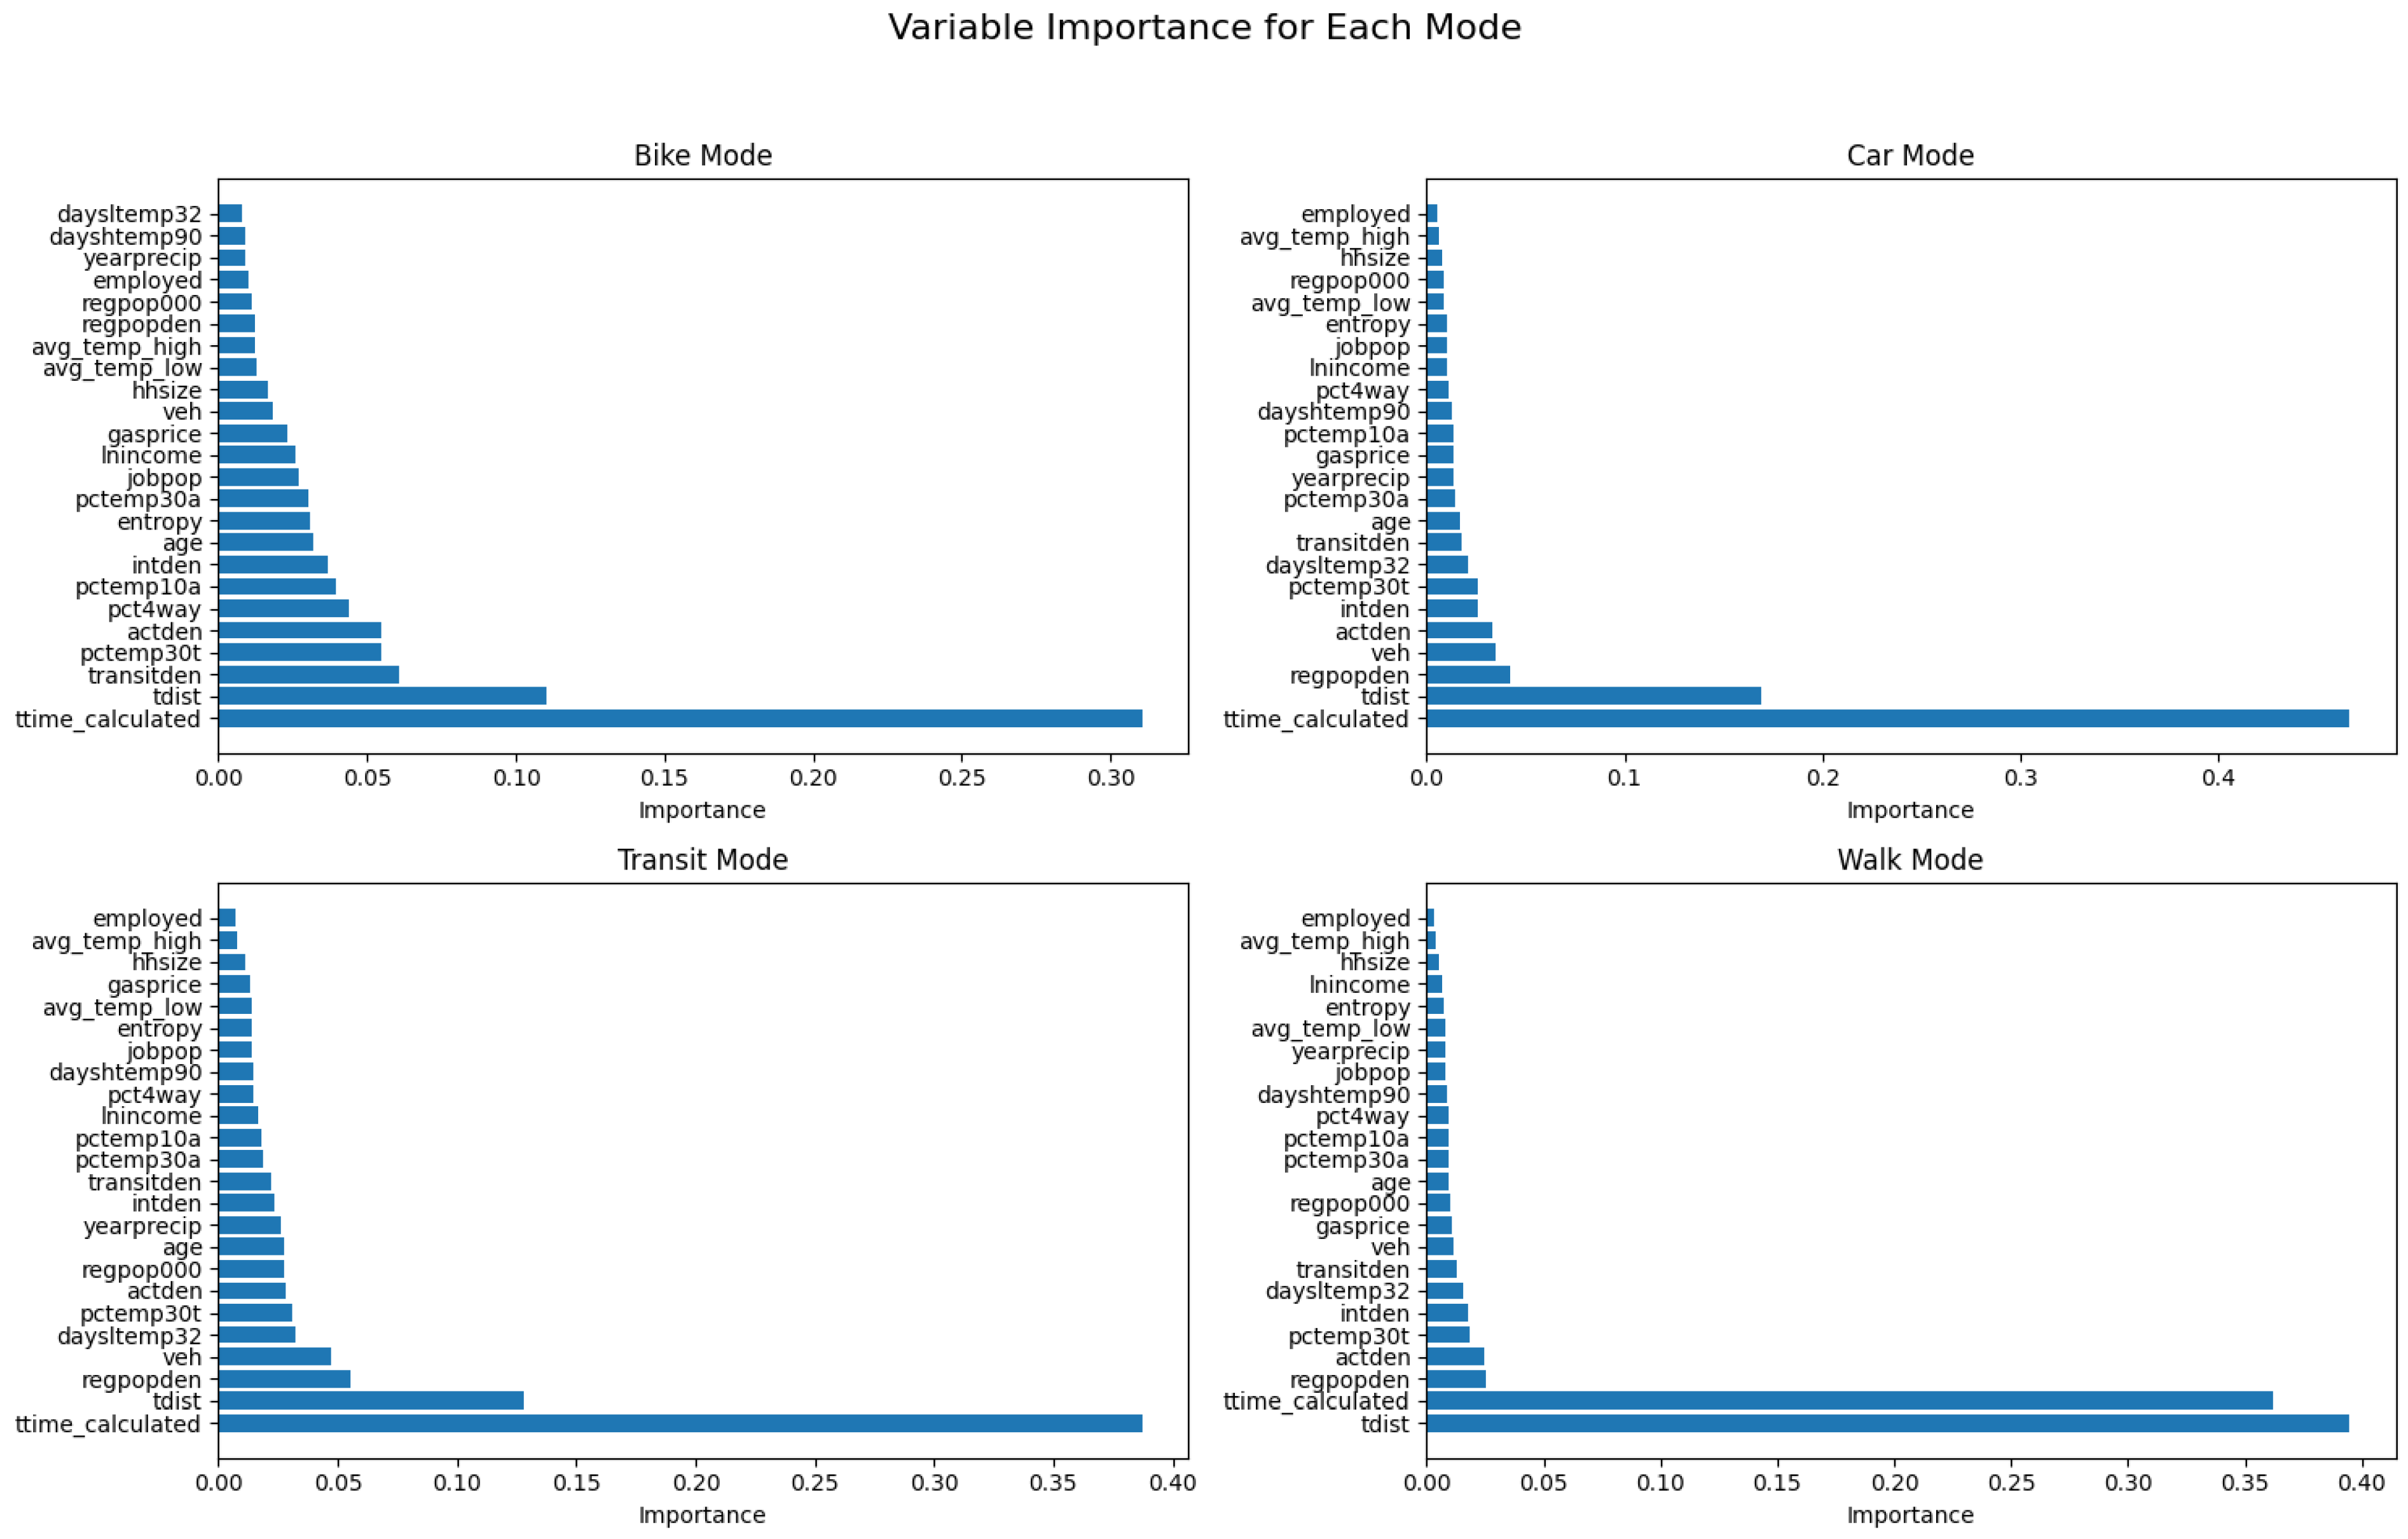
4.2. Variable Importance

Our model revealed that travel time and travel distance emerge as pivotal factors influencing mode choices across various trip purposes and transportation modes. The data underscores a consistent trend: as travel distance or time increases, the likelihood of opting for bike and walk modes decreases. This is consistent with the notion that walkers and bikers prioritize manageable distances. Conversely, for car trips, this association is direct, indicating that a longer travel distance or time correlates with a higher probability of choosing a car as the preferred mode of transportation.
Aligning with the body of literature [47], for transit trips, while the model initially indicates a direct association, the trend reverses beyond a certain threshold of travel time and distance (See Figure 3). This could be attributed to factors such as discomfort and inconvenience after a certain travel time/distance for transit riders, which may outweigh the benefits of using transit for longer trips. The diminishing attractiveness of transit beyond a certain travel time or distance can be explained by the additional time spent waiting at transit stops, potential transfers, and the overall less direct nature of transit routes compared to those of personal vehicles.
In the context of all trip purposes, travel time takes precedence as the top influencer for most modes, with travel distance following closely. This pattern holds true for all modes, except for HBW/NHB-walk trips, where travel time claims the second position. The prominence of travel time across various modes and trip purposes suggests its inherent significance as a more nuanced and practical measure influencing individuals’ transportation decisions.
The prioritization of travel time over travel distance can be rationalized by considering the intricacies of daily commuting. In the case of car trips, factors such as traffic congestion and the density of signaled intersections may lead to longer travel times, even for relatively short distances. For transit trips, the variability in headways and the potential for indirect access to destinations contribute to the heightened importance of travel time. Waiting times at transit stops and the need for additional transfers can significantly extend the overall travel time, making it a crucial consideration for transit mode choices.
Surprisingly, there is a slight change in the ranking when analyzing HBW-transit trips. Here, while the significance of travel time as the most crucial factor remains the same, the importance of travel distance decreases (travel distance is ranked eighth, whereas previously it was second). This unique pattern may be attributed to the nature of HBW trips. The elevated importance of travel time in transit choices, compared to travel distance, can be elucidated by the impact of headways. In transit scenarios, waiting times at stations, coupled with the potential need for additional transfers, can substantially contribute to overall travel time. This phenomenon extends beyond distance, with riders experiencing delays and longer travel times even on short trips due to the intricacies of transit scheduling. Individuals may prioritize minimizing travel time to enhance efficiency, especially in work-related trips where time sensitivity is pronounced. Conversely, recreational or non-work-related trips may allow for a higher tolerance of longer travel distances if scenic routes or specific destinations are prioritized.
In the realm of socioeconomic factors influencing mode choice, household vehicle ownership stands out as a pivotal determinant for all trip purposes (See Figure 4). The correlation is unmistakable: a higher count of household cars aligns with an increased likelihood of opting for car trips. Analyzing the PDPs for vehicle ownership, we observe a clear trend: the likelihood of car trips increases significantly from households with zero vehicles to those with approximately 1.5–2 vehicles. However, beyond this threshold, vehicle ownership has minimal impact on the propensity for car trips. This is evident in the PDPs, where the curve becomes almost horizontal after the 1.5–2 vehicle mark.
Moreover, an increase in household vehicle ownership is associated with a reduced probability of selecting transit, biking, and walking for different trip purposes. However, the impact of vehicle ownership on bike trips remains relatively modest, with other built environment features taking precedence. This phenomenon suggests that many cyclists may choose biking for reasons such as health or recreation when having access to a friendly built environment, irrespective of their car ownership status. A bike-friendly environment, like the existence of amenities such as bike lanes, might influence individuals to choose biking.
Regional population and population density are crucial factors influencing mode choice behavior, specifically NHB trips. The rationale behind this lies in the inherent relationship between population (density) and the availability and accessibility of transportation options. In regions with higher population densities, there tends to be a greater concentration of amenities, services, and employment opportunities, which can significantly impact mode choice. Higher regional population densities often translate to more access to opportunities within a shorter distance, making non-motorized modes like walking or biking more feasible and attractive. Additionally, higher population densities may also correlate with better public transit infrastructure and services, further influencing mode choice preferences.
But why does regional population and population density indicate more importance for NHB trips but not for HBW and HBO trips? The reason could be primarily due to the nature and purpose of these trips. NHB trips often involve travel between different locations that are not the individual’s home, such as between workplaces, shopping centers, or other activity sites. In densely populated areas, the proximity and accessibility of these destinations are higher, making shorter and more convenient trips feasible. Consequently, individuals are more likely to choose non-motorized modes or transit when the density of services and activities is higher, as the travel distances are shorter and the infrastructure supports these modes. In contrast, HBW and HBO trips typically start or end at the individual’s home. The decision-making process for these trips is more influenced by factors such as the distance between home and the workplace or other regular destinations, the availability of parking, and the convenience of the chosen mode for daily commutes or routine activities.
Built environment characteristics, such as activity density, transit density, intersection density, the percentage of four-way intersections, and access to employment by car/transit, play pivotal roles, aligning with the notion that mode choices are influenced by the surrounding built environment. This aligns seamlessly with the established understanding that the surrounding built environment significantly shapes transportation preferences. The gratifying correspondence between our model results and the existing literature underscores the robustness of our approach. Interestingly, among all built environment features, mixed-use-related proxies, job–population balance, and land use entropy demonstrated a smaller impact on households’ mode choice.
The partial dependency plots (See Figure 5) illustrate upward trends, indicating direct associations between the aforementioned built environment features and households’ mode choice for bike, walk, and transit trips, across all three trip purposes. For sustainable modes like transit, walking, and biking, the upward trend in the partial dependency plots gradually levels off, indicating a diminishing impact of built environment features on mode choice beyond a certain threshold. This shift in trend, which is especially noticeable for attributes like activity density, suggests that there is a saturation point where further improvements in these features may not significantly increase the preference for sustainable modes. This phenomenon can be attributed to diminishing marginal returns, where the additional benefits of enhancing activity density or other built environment characteristics become less pronounced as they reach an optimal level. Other factors not captured by these features may become more influential in determining mode choice preferences for sustainable travel options.
Conversely, for car trips, the associations are reversed, indicating that sustainable modes become more appealing as the built environment becomes denser, more diverse, better connected, transit-friendly, and job-accessible. Surprisingly, the relationship between certain built environment features, such as activity density, and mode choice for HBO-car and HBO-walk trips does not align with expectations. For HBO-walk trips, activity density shows a neutral correlation, while for HBO-car trips, there is no clear pattern, with the trend fluctuating between increasing and decreasing several times. This divergence from the anticipated trends can be attributed to the unique nature of HBO trips, which primarily involve non-work-related travel. These unexpected trends can be explained by the specific characteristics of these trip purposes. HBO trips often encompass a wide range of non-work-related activities, such as leisure, shopping, and socializing, which may not be as directly influenced by activity density as work-related trips. For HBO-walk trips, the neutral correlation with activity density suggests that other factors, such as the availability of amenities or the presence of pedestrian-friendly infrastructure, may play a more significant role in mode choice. Similarly, the fluctuating trend for HBO-car trips indicates that the decision to use a car for non-work-related trips may be influenced by a combination of factors, including convenience, parking availability, and the nature of the trip itself.
Delving deeper into the rationale behind these observed associations, a dense and well-connected built environment fosters the attractiveness of biking, walking, and transit use. High activity density suggests vibrant and accessible neighborhoods, making these sustainable modes more practical and appealing. Transit density and job–population balance enhance the efficiency of public transportation, rendering it a convenient choice. The prevalence of four-way intersections and the accessibility to employment hubs contribute to the seamless flow of pedestrian and cyclist traffic.
While built environment characteristics consistently secure a notable position, either second, after trip-related factors (travel time/distance), or third, following vehicle ownership and/or regional population density, across all travel purposes (HBO, HBW, and NHB) and nearly all modes of transportation, an intriguing divergence emerges for transit trips. In this specific context, the significance of built environment features takes a backseat, following behind socioeconomic attributes of households (income), and regional variables like gas price and weather conditions (number of days with extreme low/high temperatures, and precipitation).
For transit trips (especially HBO-transit), household income demonstrated a strong reversed association. As household income increases, the probability of choosing transit mode significantly decreases. One plausible explanation for this shift could be the availability of alternative transportation options for higher-income households. These households may have greater access to private vehicles, ride-sharing services, or other modes of transportation that offer more convenience and flexibility than transit. Additionally, higher-income households may prioritize comfort and convenience in their travel choices, which could lead them to opt for modes of transportation that offer greater comfort and flexibility, such as private vehicles or ride-sharing services. Furthermore, higher-income households may have more flexibility in their work schedules, allowing them to choose transportation options that align with their preferences for convenience and comfort.
The impact of income on car and walk trips is relatively moderate. Surprisingly, bike trips demonstrate a positive correlation with family income, indicating that as individuals become wealthier, there is an increased tendency to opt for biking. This unexpected pattern may be attributed to various factors. Wealthier individuals may have the means to invest in quality bicycles and related accessories, making biking a more accessible and attractive option. Additionally, affluent neighborhoods might offer better cycling infrastructure and safety measures, encouraging residents to choose biking as a convenient and enjoyable mode of transportation. The availability of leisure time for recreational biking among higher-income individuals could also contribute to this observed trend. Also, there could be greater awareness among more educated persons of public health benefits of cycling/physical activity. Further research and exploration into the specific dynamics of this relationship would provide valuable insights into the complex interplay between income and biking preferences in different socioeconomic contexts.
Additionally, regional variables like gas prices (for HBO and HBW) and weather conditions (for HBW and NHB) may exert a more prominent influence on transit choices. Economic considerations, such as fluctuating gas prices, could sway individuals toward cost-effective transit options, meaning that as gas prices increase, people choose to use transit over their cars. Moreover, weather conditions, especially extreme temperatures and precipitation, might impact the perceived convenience and comfort of transit, leading individuals to weigh these factors more heavily in their decision-making process. For other modes of transport, the significance of weather conditions is less pronounced.
Age significantly influences mode choice, with a nearly neutral effect on car and walk trips, a general decreasing effect on transit trips, and a curvilinear effect on bike trips. The neutral impact of age on car and walk trips suggests that these modes may be less influenced by age-related factors and more by other considerations such as convenience, accessibility, and personal preferences. Despite the decreasing impact of age on transit trips in general, it follows a distinct pattern, increasing up to the age of 16–18 (based on our model) before decreasing, which may be attributed to the age at which individuals typically obtain their driver’s license and transition to car-based transportation. The general decreasing impact of age on transit trips could be attributed to a variety of factors, including changes in mobility needs, preferences for more comfortable or convenient modes, and the availability of alternative transportation options. Furthermore, as age increases, the likelihood of choosing a bike for trips initially rises to a certain age (based on our model, the age of 40) before declining. The curvilinear effect of age on bike trips is particularly interesting, as it could be due to a combination of factors, including changes in physical ability, lifestyle preferences, and the perceived safety and comfort of biking as individuals age.
Across all modes and all trip purposes, some socioeconomic variables, such as household size and employment status, as well as most of the weather-related proxies, play relatively smaller roles. Figure 6, Figure 7 and Figure 8 depict Variable Importance Plots (VIPs) across various trip purposes, categorized by four distinct modes: bike, car, transit, and walk.

5. Model Validation

To assess the predictive performance of our one-vs-rest RF model in comparison to the conventional NL model employed by MPOs, we conducted a comprehensive evaluation using various performance measures. The comparison was carried out separately for each trip purpose class (HBW, HBO, and NHB) using metrics such as accuracy, balanced accuracy, F1 score, recall, and the area under the receiver operating characteristic curve (AUC-ROC) (see Table 4). To do so, we followed these steps:
  • Model Generation: We generated one-vs-rest RF models for each trip purpose separately, as well as the NL model (The full report of the results of the NL model can be found in our other document, “Key Enhancements to the WFRC/MAG Four-Step Travel Demand Model”, authored by Ewing et al. (2019) [48] at the Metropolitan Research Center, University of Utah. This report is available on the NITC’s website. A summary of the NL model results tables can be found in this manuscript’s Appendix A) employed by MPOs, using the same dataset.
  • Performance Measure Calculation: Performance measures were calculated for all six models (three RF and three NL models) for each transportation mode separately.
  • Comparison: The performance measures were compared across the RF and NL models to ascertain the relative predictive capabilities of each.
The process of computing these metrics for our RF model was straightforward, requiring only a few lines of code. However, the same metrics for the NL model involved a more intricate and manual approach. This included extracting the predicted probabilities of the NL model for each mode, identifying the mode with the highest probability, comparing it with the actual observed values, creating dummy variables for both observed and predicted values, and then calculating true positive, true negative, false positive, and false negative values. Finally, the performance measures were computed based on these values.
To ensure the reliability of our performance evaluation, all reported accuracy metrics were computed using a separate test set rather than the training set. We utilized an 80–20 train–test split and conducted cross-validation to enhance the robustness of our findings. While the overall accuracy of the RF model is high (e.g., 99% for HBO trips), we also report balanced accuracy (e.g., 97%) to account for class imbalances. The AUC-ROC values further reinforce the model’s strong discriminatory power across different travel modes. The observed high accuracy is largely attributed to the nature of the dataset, where some modes dominate certain trip purposes. To mitigate potential bias, we have examined additional class-wise performance metrics, including precision, recall, and F1-score. These measures confirm that the model maintains a strong predictive capability across all travel modes, not just the majority class.
The comparative analysis of model performance between the RF and NL models reveals a consistent superiority of the RF model in predictive accuracy. Moreover, there are several inherent advantages that make the RF method a compelling choice for mode choice prediction in transportation planning.

5.1. Superior Predictive Performance

Across all trip purposes and transportation modes, the RF model consistently outperformed the NL model in terms of accuracy, balanced accuracy, F1 score, recall, precision, and AUC-ROC. The superiority of performance measures is the greatest in HBO trips, which may be due to the huge data size. These findings underscore the RF model’s remarkable ability to capture the complexities of mode choice behavior and provide more accurate predictions, thereby offering valuable insights for transportation planning and policymaking.

5.2. Inherent Advantages

The RF model presents several advantages over the traditional nested logit (NL) model. Firstly, it offers unparalleled flexibility and adaptability by capturing non-linear relationships and interactions among predictor variables without predefined assumptions about choice behavior structure. This flexibility enables the RF model to accommodate diverse datasets and evolving transportation dynamics, enhancing the relevance and robustness of mode choice predictions. Secondly, the RF model boasts simplicity and ease of implementation compared to NL, as it eliminates the need for intricate parameter estimation processes and checking for collinearity among predictor variables. This simplification reduces the risk of overfitting and makes the RF model more accessible to transportation planning practitioners. Moreover, the RF model demonstrates robustness to violations of traditional statistical assumptions, such as the independence of observations and homoscedasticity, through ensemble learning techniques and bootstrap aggregating. This robustness ensures reliable predictions even in the presence of heterogeneous and non-normal data distributions. Additionally, the RF model’s ability to resolve data imbalances and provide insights into variable importance further solidifies its superiority in mode choice prediction.
Overall, the superior performance of the RF model underscores its efficacy in mode choice prediction and signifies a paradigm shift from traditional NL modeling approaches. The RF model’s ability to leverage the rich complexity of data and adapt to diverse scenarios offers MPOs a compelling rationale to embrace this innovative approach in enhancing the accuracy and relevance of their travel demand models. By adopting machine learning techniques like the one-vs-rest random forest model, MPOs can effectively address the evolving dynamics of transportation behavior.
When comparing our results to those of prior NL and MNL studies, we observe several similarities and notable differences. Consistent with NL and MNL models, our ML-based approach confirms that travel time negatively impacts mode choice probability across all modes, and vehicle ownership significantly reduces the likelihood of choosing non-auto modes. However, our model captures more nuanced interactions between built environment variables and mode choices. For instance, while previous NL/MNL models have generally found that higher activity density promotes transit and non-motorized modes, our ML results suggest that in some cases, excessive density can deter bike use, likely due to congestion and safety concerns—an effect that may not have been easily captured through traditional logit specifications. Additionally, ML models identify complex, region-specific variations in the impact of job accessibility on mode choice that standard NL/MNL models typically generalize through fixed parameters.
These findings suggest that while NL and MNL models remain valuable for policy analysis due to their interpretability and theoretical foundations, ML models provide a powerful complementary approach, especially when aiming to uncover hidden patterns and enhance predictive performance. Future MPO modeling efforts could benefit from integrating ML techniques alongside traditional models to better account for behavioral complexities in travel mode choice.

6. Conclusions and Research Outlook

6.1. Conclusions

The study unveils the critical determinants shaping individuals’ transportation mode choices, shedding light on nuanced associations influenced by trip characteristics, socioeconomic factors, built environment features, and regional characteristics. Travel time and distance emerge as pivotal factors, showcasing consistent trends across various trip purposes and transportation modes. The more travel time/distance, the greater the tendency to use personal automobiles. In the context of trip purposes, travel time takes precedence. This emphasizes the significance of time sensitivity in commuting decisions, especially for transit trips in which there is not necessarily a direct association between trip distance and time with the impact of headways on travel time, emphasizing the multifaceted nature of mode choices in different contexts.
The influence of household vehicle ownership stands out, particularly for car and transit choices, underscoring the role of access to personal vehicles in shaping travel decisions. Moreover, built environment characteristics play a pivotal role, aligning with the existing literature and emphasizing the appeal of sustainable modes in dense, mixed, and well-connected environments. Higher activity density, good design, better access to transit, and access to jobs and mixes of usage not only suggest vibrant and accessible neighborhoods but also render these sustainable modes more practical and appealing. That is, built environment features can contribute to the flow of pedestrian and cyclist traffic, enhancing the overall attractiveness of non-motorized modes, and foster the efficiency of public transportation, making it a convenient choice for commuters. These findings resonate with the established understanding that a well-structured and connected transit network, coupled with a balanced distribution of employment opportunities and efficient design, significantly influences mode choices.
The study also proves the nuanced impact of other socioeconomic variables, such as income and age, and regional variables, such as gas price and weather conditions, albeit for the latter with relatively smaller magnitudes. While these factors might play smaller roles compared to travel time, distance, vehicle ownership, and built environment characteristics, they introduce subtle threads that contribute to transportation mode preferences.
In essence, the study underscores that mode choices are not dictated by a single dominant factor but are an intricate interplay of various elements. Travel time, distance, vehicle ownership, built environment characteristics, socioeconomic factors, and regional variables collectively mold individuals’ decisions, creating a diverse and dynamic landscape of transportation preferences.
Our study surpasses the existing literature in several key aspects. With a large dataset encompassing approximately 800 K trips by more than 80 K households across 29 U.S. regions, our findings exhibit robust external validity. Employing a one-vs-rest random forest model, our advanced approach outperforms traditional statistical models both in the literature and in practice, providing more accurate predictions of mode choices. The analysis of four distinct classes (bike, car, transit, and walk) and three trip purposes (HBO, HBW, NHB) adds granularity, enhancing the understanding of mode choice determinants.
Compared to the previous studies that applied machine learning to predict mode choice [34,35], our dataset surpasses theirs significantly. Although they employed machine learning techniques, our study’s scale and scope provide a more comprehensive view of mode choice dynamics.

6.2. Research Outlook

Certain limitations warrant consideration. Variables such as parking supplies and prices, travel attitudes, individuals’ mode-specific comfort, personal preferences, and residential self-selection play significant roles in the intricate decision-making process influencing mode choices. Furthermore, the absence of certain design features [49], including amenities like sidewalks and bike lanes, adds another layer to the limitations of our study. However, due to data limitations, these nuanced elements were not incorporated into our analysis. Future research endeavors should consider these factors to provide a more comprehensive understanding of the determinants shaping mode choices. Additionally, our outcome variable (mode) only includes four modes of transportation; hence, our study did not encompass emerging transportation modes like micromobility options (e.g., scooters), ride-hailing services (e.g., Uber, Lyft), carpooling, and other potential modes due to data availability.
Our model holds practical significance for travel demand modeling and forecasting. The adoption of innovative modeling approaches like random forest (RF) holds significant promise for enhancing the accuracy, efficiency, and equity of transportation planning initiatives. Future research endeavors may explore the integration of advanced machine learning techniques with domain-specific insights to develop hybrid modeling frameworks that further leverage the strengths of both statistical and machine learning approaches.
However, a critical gap remains between the demonstrably superior performance of machine learning and its real-world application by MPOs. Despite the significant advantages of RF over traditional statistical models, no MPOs in the United States, including pioneering agencies, have adopted these methods yet. To bridge this gap, future research is necessary.
Here are two potential avenues:
  • Investigate Barriers to Adoption: Conduct a qualitative survey among MPOs to identify the specific barriers hindering the adoption of the machine learning method, as well as the inclusion of non-motorized modes for mode choice prediction. This survey could explore technical challenges, staff expertise limitations, data availability constraints, budgetary restrictions, or even psychological resistance to new methodologies. Understanding these barriers is crucial for developing targeted strategies to promote the integration of machine learning in MPO practices.
  • Demonstrate Practical Value: Develop a comprehensive communication strategy to convince MPOs of the value proposition offered by our modeling approach. This strategy could involve the following:
    Creating User-Friendly Tools: Develop user-friendly interfaces or software specifically tailored for MPOs, allowing them to easily implement and leverage the benefits of RF modeling.
    Highlighting Cost-Effectiveness: Quantify the potential cost savings and resource optimization that are achievable through more accurate predictions.
    Showcasing Real-World Applications: Develop case studies or pilot projects that demonstrate the practical benefits of RF modeling in real-world transportation planning scenarios.
By addressing the barriers to adoption and effectively communicating the value proposition, we can encourage MPOs to embrace the transformative potential of machine learning for mode choice prediction. This shift, in turn, will empower transportation agencies and policymakers to harness data-driven insights for optimizing resource allocation, improving mobility outcomes, and creating more sustainable and inclusive urban transportation systems.

Author Contributions

Study conception and design: R.E. and S.S.; introduction and literature review: H.A.K. and S.S.; data collection: G.T. and S.S.; modeling: H.A.K. and S.B.; analysis, and interpretation of results: H.A.K.; conclusions: H.A.K.; draft manuscript preparation: H.A.K. All authors have read and agreed to the published version of the manuscript.

Funding

This research is part of the report NITC-RR-1086 and is funded and sponsored by the National Institute for Transportation and Communities (NITC). The report, ‘Key Enhancements to the WFRC/MAG Four-Step Travel Demand Model’, authored by Ewing et al. (2019) [48] at the Metropolitan Research Center, University of Utah, is available on the NITC’s website. The current manuscript builds upon and expands the findings of this previous work.

Institutional Review Board Statement

Not applicable.

Informed Consent Statement

Not applicable.

Data Availability Statement

The data supporting the findings of this study are available upon reasonable request from the corresponding author. However, the authors do not wish to make the data publicly available at this time.

Conflicts of Interest

The authors declare no conflicts of interest. The funders had no role in the design of the study; in the collection, analyses, or interpretation of data; in the writing of the manuscript; or in the decision to publish the results.

Abbreviations

The following abbreviations are used in this manuscript:
MPOMetropolitan planning organization
TDMTravel demand model
NLNested logit model
MNLMultinomial logit model
MLMachine learning
RFRandom forest model
HBWHome-based-Work
HBOHome-Based-Other
NHBNon-home-based

Appendix A

Table A1. Results of the NL model for HBW trips.
VariableEstimateStd. ErrorZ Value
walk:(intercept)−0.713050.1378−5.1743 ***
bike:(intercept)−4.122090.3561−11.5741 ***
transit:(intercept)−4.967350.2736−18.1533 ***
time−0.020840.0008−25.1233 ***
walk:hhsize0.016140.01571.0306
bike:hhsize0.149980.01579.5724 ***
transit:hhsize0.244680.019312.7036 ***
walk:veh−0.336550.0237−14.2263 ***
bike:veh−0.212990.0270−7.8911 ***
transit:veh−1.263290.0314−40.2503 ***
walk:lnactden0.291650.022512.9439 ***
bike:lnactden−0.145530.0285−5.1085 ***
transit:lnactden0.178490.03385.2853 ***
walk:pct4way0.001640.00082.0074 *
bike:pct4way0.008530.00099.1691 ***
transit:pct4way0.007100.00116.5861 ***
walk:pctemp30a−0.003460.0014−2.4979 *
bike:pctemp30a0.007550.00223.4628 ***
transit:pctemp30a0.016960.00237.5079 ***
walk:pctemp30t0.002600.00181.4628
bike:pctemp30t0.009800.00224.4542 ***
transit:pctemp30t0.006960.00252.7927 **
walk:SLC Region0.068390.10940.6251
bike:SLC Region2.081250.29307.1029 ***
transit:SLC Region2.542200.213411.9136 ***
walk:Provo-Orem Region−0.106550.1438−0.7409
bike:Provo-Orem Region2.055390.32836.2609 ***
transit:Provo-Orem Region2.287470.26738.5578 ***
iv:motor0.475410.12043.9481 ***
iv:nonmotor2.223300.098122.6641 ***
Number of regions: 20
Log-Likelihood: −15,989
McFadden R2: 0.33183
Note: p < 0.10 (*), p < 0.05 (**), and p < 0.01 (***) indicate statistical significance levels.
Table A2. Results of the NL model for HBO trips.
VariableEstimateStd. ErrorZ Value
walk:(intercept)0.470340.035913.0992 ***
bike:(intercept)−2.865720.1067−26.8683 ***
transit:(intercept)−1.942070.1152−16.8555 ***
time−0.098140.0003−314.883 ***
walk:hhsize−0.040720.0038−10.703 ***
bike:hhsize−0.006800.0096−0.7076
transit:hhsize0.045880.01243.7032 ***
walk:veh−0.313910.0053−59.2256 ***
bike:veh−0.160050.0132−12.1132 ***
transit:veh−0.964480.0157−61.2389 ***
walk:pct4way0.004620.000317.8001 ***
bike:pct4way0.006270.00069.9308 ***
transit:pct4way0.004200.00075.7418 ***
walk:pctemp30t0.006300.000319.1271 ***
bike:pctemp30t0.007020.00098.006 ***
transit:pctemp30t0.006880.00135.2614 ***
walk:SLC Region0.462310.035113.1893 ***
bike:SLC Region0.919950.10129.0919 ***
transit:SLC Region0.293790.11942.4599 *
walk:Provo-Orem Region0.422090.038710.9028 ***
bike:Provo-Orem Region0.503530.11914.2276 ***
transit:Provo-Orem Region−1.238820.2192−5.6528 ***
iv:motor2.721540.044561.1692 ***
iv:nonmotor1.586390.0120132.2214 ***
iv:nonmotor2.223300.098122.6641 ***
Number of regions: 28
Log-Likelihood: −121,240
McFadden R2: 0. 34605
Note: p < 0.10 (*), and p < 0.01 (***) indicate statistical significance levels.
Table A3. Results of the NL model for NHB trips.
VariableEstimateStd. ErrorZ Value
walk:(intercept)−2.879300.1081−26.6485 ***
bike:(intercept)−3.241700.1063−30.5106 ***
transit:(intercept)−0.246490.0148−16.6038 ***
time−0.011230.0002−63.6916 ***
walk:hhsize0.020220.00643.1527 **
bike:hhsize0.117030.007515.5387 ***
transit:hhsize0.002130.00102.1724 *
walk:veh−0.067580.0097−6.9433 ***
bike:veh−1.087600.0104−104.2272 ***
transit:veh−0.023340.0016−14.6607 ***
walk:lnactden0.093540.01187.9266 ***
bike:lnactden0.279450.012222.9042 ***
transit:lnactden0.008070.00155.4579 ***
walk:pct4way0.001590.00043.7203 ***
bike:pct4way0.000680.00061.2053
transit:pct4way0.000280.00013.8149 ***
walk:pctemp10a0.016910.001610.7216 ***
bike:pctemp10a0.003040.00161.9547
transit:pctemp10a−0.001290.0002−5.8653 ***
walk:pctemp30t−0.004010.0006−6.3851 ***
bike:pctemp30t0.017520.000823.3014 ***
transit:pctemp30t0.001700.000117.4064 ***
walk:SLC Region1.021400.10669.5853 ***
bike:SLC Region0.410490.12253.3505 ***
transit:SLC Region−0.054570.0187−2.9198 **
walk:Provo-Orem Region1.238700.118810.4232 ***
bike:Provo-Orem Region−0.764620.2214−3.4538 ***
transit:Provo-Orem Region−0.129510.0279−4.6469 ***
iv:motor−0.356590.0387−9.2133 ***
iv:nonmotor9.022800.136865.9438 ***
Number of regions: 28
Log-Likelihood: −104,630
McFadden R2: 0. 3757
Note: p < 0.10 (*), p < 0.05 (**), and p < 0.01 (***) indicate statistical significance levels.

References

  1. Okrah, M.B. Handling Non-Motorized Trips in Travel Demand Models. In Sustainable Mobility in Metropolitan Regions; Wulfhorst, G., Klug, S., Eds.; Studien zur Mobilitäts- und Verkehrsforschung; Springer: Wiesbaden, Germany, 2016. [Google Scholar]
  2. Schwartz, W.L.; Porter, C.D.; Payne, G.C.; Suhrbier, J.H.; Moe, P.C.; Wilkinson, P.C. Guidebook on Methods to Estimate Non-Motorized Travel: Overview of Methods; Cambridge Systematics, Inc.: Medford, MA, USA, 1999. [Google Scholar]
  3. Limtanakool, N.; Dijst, M.; Schwanen, T. The influence of socioeconomic characteristics, land use and travel time considerations on mode choice for medium-and longer-distance trips. J. Transp. Geogr. 2006, 14, 327–341. [Google Scholar] [CrossRef]
  4. Cervero, R. Built environments and mode choice: Toward a normative framework. Transp. Res. Part D Transp. Environ. 2002, 7, 265–284. [Google Scholar] [CrossRef]
  5. Wang, D.; Zhou, M. The built environment and travel behavior in urban China: A literature review. Transp. Res. Part D Transp. Environ. 2017, 52, 574–585. [Google Scholar] [CrossRef]
  6. Lee, J.S.; Nam, J.; Lee, S.S. Built environment impacts on individual mode choice: An empirical study of the Houston-Galveston metropolitan area. Int. J. Sustain. Transp. 2014, 8, 447–470. [Google Scholar] [CrossRef]
  7. Handy, S.; Cao, X.; Mokhtarian, P. Correlation or causality between the built environment and travel behavior? Evidence from Northern California. Transp. Res. Part D Transp. Environ. 2005, 10, 427–444. [Google Scholar] [CrossRef]
  8. Zhang, M. The Role of Land Use in Travel Mode Choice: Evidence from Boston and Hong Kong. J. Am. Plan. Assoc. 2004, 70, 344–360. [Google Scholar] [CrossRef]
  9. Munshi, T. Built environment and mode choice relationship for commute travel in the city of Rajkot, India. Transp. Res. Part D 2016, 44, 239–253. [Google Scholar] [CrossRef]
  10. Sabouri, S.; Ewing, R.; Kalantari, H.A. Estimating transit’s land-use multiplier: Direct and indirect effects on vehicle miles traveled. Transportation 2024, 1–21. [Google Scholar] [CrossRef]
  11. Zhang, L.; Hong, J.; Nasri, A.; Shen, Q. How built environment affects travel behavior: A comparative analysis of the connections between land use and vehicle miles traveled in US cities. J. Transp. Land Use 2012, 5, 40–52. [Google Scholar] [CrossRef]
  12. Khan, M.; Kockelman, K.M.; Xiong, X. Models for anticipating non-motorized travel choices, and the role of the built environment. Transp. Policy 2014, 35, 117–126. [Google Scholar] [CrossRef]
  13. Titze, S.; Stronegger, W.J.; Janschitz, S.; Oja, P. Association of built-environment, social-environment and personal factors with bicycling as a mode of transportation among Austrian city dwellers. Prev. Med. 2008, 47, 252–259. [Google Scholar] [CrossRef] [PubMed]
  14. Timperio, A.; Veitch, J.; Sahlqvist, S. Built and physical environment correlates of active transportation. In Children’s Active Transportation; Elsevier: Amsterdam, The Netherlands, 2018; pp. 141–153. [Google Scholar]
  15. Eldeeb, G.; Mohamed, M.; Páez, A. Built for active travel? Investigating the contextual effects of the built environment on transportation mode choice. J. Transp. Geogr. 2021, 96, 103158. [Google Scholar] [CrossRef]
  16. Nakshi, P.; Debnath, A.K. Impact of built environment on mode choice to major destinations in Dhaka. Transp. Res. Rec. 2021, 2675, 281–296. [Google Scholar] [CrossRef]
  17. Ding, C.; Wang, D.; Liu, C.; Zhang, Y.; Yang, J. Exploring the influence of built environment on travel mode choice considering the mediating effects of car ownership and travel distance. Transp. Res. Part A Policy Pract. 2017, 100, 65–80. [Google Scholar] [CrossRef]
  18. Chen, C.; Gong, H.; Paaswell, R. Role of the built environment on mode choice decisions: Additional evidence on the impact of density. Transportation 2008, 35, 285–299. [Google Scholar] [CrossRef]
  19. Cervero, R.; Kockelman, K. Travel demand and the 3Ds: Density, diversity, and design. Transp. Res. Part D Transp. Environ. 1997, 2, 199–219. [Google Scholar] [CrossRef]
  20. Tian, G.; Kalantari, H.A.; Ewing, R. Are older adults living in compact development more active?—Evidence from 36 diverse regions of the United States. Comput. Urban Sci. 2023, 3, 10. [Google Scholar] [CrossRef]
  21. Kockelman, K.M. Travel behavior as a function of accessibility, land use mixing and land use balance: Evidence from the San Francisco Bay Area. Transp. Res. Rec. 1997, 1607, 116–125. [Google Scholar] [CrossRef]
  22. Bento, A.M.; Cropper, M.L.; Mobarak, A.M.; Vinha, K. The impact of urban spatial structure on travel demand in the United States. Rev. Econ. Stat. 2005, 87, 466–478. [Google Scholar] [CrossRef]
  23. Reilly, M.; Landis, J. The Influence of Built-Form and Land Use on Mode Choice: Evidence from the 1996 Bay Area Travel Survey; University of California Transportation Center: Berkeley, CA, USA, 2002. [Google Scholar]
  24. Kim, B.Y.; Fleming, G.G.; Lee, J.J.; Waitz, I.A.; Clarke, J.-P.; Balasubramanian, S.; Malwitz, A.; Klima, K.; Locke, M.; Holsclaw, C.A.; et al. System for assessing Aviation’s Global Emissions (SAGE). Part 1: Model description and inventory results. Transp. Res. D 2007, 12, 325–346. [Google Scholar] [CrossRef]
  25. Hamre, A.; Buehler, R. Commuter Mode Choice and Free Car Parking, Public Transportation Benefits, Showers/Lockers, and Bike Parking at Work: Evidence from the Washington, DC Region. J. Public Transp. 2014, 17, 67–91. [Google Scholar] [CrossRef]
  26. Ferrell, C.E.; Mathur, S.; Appleyard, B.S. Neighborhood Crime and Transit Station Access Mode Choice-Phase III of Neighborhood Crime and Travel Behavior; Mineta Transportation Institute: San Jose, CA, USA, 2015. [Google Scholar]
  27. Bautista-Hernández, D.A. Mode choice in commuting and the built environment in México City. Is there a chance for non-motorized travel? J. Transp. Geogr. 2021, 92, 103024. [Google Scholar] [CrossRef]
  28. Mitra, R. School Travel Mode Choice Behaviour in Toronto, Canada. Ph.D. Thesis, University of Toronto, Toronto, ON, Canada, 2012. [Google Scholar]
  29. Ozbil, A.; Peponis, J. The Effects of Urban Form on Walking to Transit. In Proceedings of Eighth International Space Syntax Symposium; PUC: Santiago, Chile, 2012. [Google Scholar]
  30. Rajamani, J.; Bhat, C.R.; Handy, S.; Knaap, G.; Song, Y. Assessing the Impact of Urban Form Measures in Nonwork Trip Mode Choice after Controlling for Demographic and Level-of-Service Effects. In Proceedings of the Transportation Research Board Annual Meeting, Washington, DC, USA, 8 September 2003. [Google Scholar]
  31. Ewing, R.; Schroeer, W.; Greene, W. School Location and Student Travel Analysis of Factors Affecting Mode Choice. Transp. Res. Rec. 2004, 1895, 55–63. [Google Scholar] [CrossRef]
  32. Frank, L.; Bradley, M.; Kavage, S.; Chapman, J.; Lawton, T.K. Urban form, travel time, and cost relationships with tour complexity and mode choice. Transportation 2008, 35, 37–54. [Google Scholar] [CrossRef]
  33. Aziz, H.M.; Nagle, N.; Morton, A.; Hilliard, M.; White, D.; Stewart, R. Exploring the impact of walk–bike infrastructure, safety perception, and built-environment on active transportation mode choice: A random parameter model using New York City commuter data. Transportation 2018, 45, 1207–1229. [Google Scholar] [CrossRef]
  34. Cheng, L.; Chen, X.; De Vos, J.; Lai, X.; Witlox, F. Applying a random forest method approach to model travel mode choice behavior. Travel Behav. Soc. 2019, 14, 1–10. [Google Scholar] [CrossRef]
  35. Liu, J.; Wang, B.; Xiao, L. Non-linear associations between built environment and active travel for working and shopping: An extreme gradient boosting approach. J. Transp. Geogr. 2021, 92, 103034. [Google Scholar] [CrossRef]
  36. Ton, D.; Duives, D.C.; Cats, O.; Hoogendoorn-Lanser, S.; Hoogendoorn, S.P. Cycling or walking? Determinants of mode choice in the Netherlands. Transp. Res. Part A Policy Pract. 2019, 123, 7–23. [Google Scholar] [CrossRef]
  37. Ding, L.; Zhang, N. A Travel Mode Choice Model Using Individual Grouping Based on Cluster Analysis. Procedia Eng. 2016, 137, 786–795. [Google Scholar] [CrossRef]
  38. Singleton, P.A.; Clifton, K.J. Pedestrians in Regional Travel Demand Forecasting Models: State-of-the-Practice. In Proceedings of the 92nd Annual Meeting of the Transportation Research Board, Washington, DC, USA, 13–17 January 2013; pp. 13–4857. [Google Scholar]
  39. Zhang, Y. Microsimulating Active Transportation Mode Choice Using Smartphone-Based Travel Survey and Transportation Tomorrow Survey Data. 2015. Available online: https://tspace.library.utoronto.ca/handle/1807/71456 (accessed on 9 April 2025).
  40. Turner, S.; Hottenstein, A.; Shunk, G. Bicycle and Pedestrian Travel Demand Forecasting: Literature Review; Texas Transportation Institute, The Texas A&M University System: College Station, TX, USA, 1997. [Google Scholar]
  41. Singleton, P.A.; Totten, J.C.; Orrego-Oñate, J.P.; Schneider, R.J.; Clifton, K.J. Making strides: State of the practice of pedestrian forecasting in regional travel models. Transp. Res. Rec. 2018, 2672, 58–68. [Google Scholar] [CrossRef]
  42. Fehr & Peers. Model Description & Validation Report: Fresno Council of Governments Travel Demand Model. Prepared for Fresno Council of Governments, January 2014. Available online: https://www.fresnocog.org/wp-content/uploads/publications/Modeling/MIPModel_Documentation.pdf (accessed on 9 April 2025).
  43. Sabouri, S.; Tian, G.; Ewing, R.; Park, K.; Greene, W. The built environment and vehicle ownership modeling: Evidence from 32 diverse regions in the US. J. Transp. Geogr. 2021, 93, 103073. [Google Scholar] [CrossRef]
  44. Abdollahpour, S.S.; Buehler, R.; Le, H.T.; Nasri, A.; Hankey, S. Built environment’s nonlinear effects on mode shares around BRT and rail stations. Transp. Res. Part D Transp. Environ. 2024, 129, 104143. [Google Scholar] [CrossRef]
  45. Mohammadi, P.; Rashidi, A.; Malekzadeh, M.; Tiwari, S. Evaluating various machine learning algorithms for automated inspection of culverts. Eng. Anal. Bound. Elem. 2023, 148, 366–375. [Google Scholar] [CrossRef]
  46. Mohammadi, P.; Rashidi, A.; Asgari, S. Privacy-preserving culvert predictive models: A federated learning approach. Adv. Eng. Inform. 2024, 61, 102483. [Google Scholar] [CrossRef]
  47. Tabassum, N.; Kalantari, H.A.; Kaniewska, J.; Ameli, S.H.; Ewing, R.; Yang, W.; Promy, N.S. Ways of increasing transit ridership-lessons learned from successful transit agencies. Case Stud. Transp. Policy 2025, 19, 101362. [Google Scholar] [CrossRef]
  48. Ewing, R.; Sabouri, S.; Park, K.; Lyons, T.; Tian, G. Key Enhancements to the WFRC/MAG Four-Step Travel Demand Model; Transportation Research and Education Center (TREC): Portland, OR, USA, 2019. [Google Scholar]
  49. Azin, B.; Ewing, R.; Yang, W.; Promy, N.S.; Kalantari, H.A.; Tabassum, N. Urban Arterial Lane Width versus Speed and Crash Rates: A Comprehensive Study of Road Safety. Sustainability 2025, 17, 628. [Google Scholar] [CrossRef]
Figure 1. Data challenges and methodology steps.
Sustainability 17 03580 g001
Figure 2. ROC curves for (a) HBO, (b) HBW, and (c) NHB trips (left to right, respectively).
Sustainability 17 03580 g002
Figure 3. Partial dependency plots (PDPs) for travel distances of (a) HBO, (b) HBW, and (c) NHB trips (left to right, respectively).
Sustainability 17 03580 g003
Figure 4. Partial dependency plots (PDPs) for household vehicle ownership for (a) HBO, (b) HBW, and (c) NHB trips (left to right, respectively).
Sustainability 17 03580 g004
Figure 5. Partial dependency plots (PDPs) for activity density of (a) HBO, (b) HBW, and (c) NHB trips (left to right, respectively).
Sustainability 17 03580 g005
Figure 6. VIPs for HBO trips by mode ((up-left) bike trips, (up-right) car trips, (down-left) transit trips, and (down-right) walk trips).
Sustainability 17 03580 g006
Figure 7. VIPs for HBW trips ((up-left) bike trips, (up-right) car trips, (down-left) transit trips, and (down-right) walk trips).
Sustainability 17 03580 g007
Figure 8. VIPs for NHB trips ((up-left) bike trips, (up-right) car trips, (down-left) transit trips, and (down-right) walk trips).
Sustainability 17 03580 g008
Table 2. Current trends in mode choice modeling within MPO travel demand models.
MPO *Area (Biggest City)Service Area Size **Active Modes
BATSBrunswick, Glynn County, GeorgiaSmallNo inclusion of active modes in their model.
RVTORoanoke, VirginiaSmallNo inclusion of active modes in their model.
LMPOLincoln, NebraskaSmallEmploys a distance-based algorithm to estimate the proportion of non-motorized modes. Aligned with but not identical to the HBW trips, as they utilize local data which is exclusively accessible for commuting trips. Data were obtained from an external region for other trip purposes. Following an assessment of various data sources, including NHTS data, San Luis Obispo, CA, was chosen as the reference model for non-motorized modes.
NFRMPOFort Collins, ColoradoSmallUtilizing a mode choice framework that encompasses multiple multinomial choices, the NFR model divides non-motorized trips into two categories: walking and biking. Trip probabilities for these modes are determined based on their respective time allocations for walking and biking.
CHCNGA-TPOChattanooga, Catoosa Counties, GeorgiaSmallABM ***: Structured as a multinomial logit, the tour main mode sub-model offers eight mode options: Bicycle, Walk, Walk-to-Transit, Drive-to-Transit, Drive Alone, School Bus, Shared Ride (2 people), and Shared Ride (3+ people). The decision between walking or biking trips is solely based on the roundtrip road distance.
ARTSAugusta, GeorgiaSmallNon-motorized travel is not accounted for in the ARTS model. Instead, the mode choice component focuses on “motorized person trips”, dividing them into auto and transit trips.
DMAMPOUrbandale, IowaSmallMode choice modeling is not conducted by the Des Moines Area MPO.
StanCOGModesto, Stanislaus County, CaliforniaMediumNon-motorized travel is not modeled in the StanCOG model. Instead of a comprehensive mode choice analysis step, the model utilizes an adjustment procedure.
COMPASSMeridian, IdahoMediumA nested logit structure is employed, encompassing five alternatives. Within the non-motorized nest, walk and bicycle modes are included, with their probabilities calculated based on trip distance.
AMBAGMarina, CaliforniaMediumThe mode choice model in the updated AMBAG RTDM employs a nested logit-based structure. It comprises a series of logit models, including multinomial or nested variants, which are tailored to different trip purposes and peak/off-peak periods. The model estimates probabilities for various travel modes, such as auto alone, auto-shared ride (carpool), bike, walk, and transit. Trip time and total employment density are the factors that the predictions for walk and bike trips are based on.
CDTCAlbany, New YorkMediumNon-motorized travel is not included in the modeling approach. The model employs a multinomial logit framework for other modes.
FCOGFresno, CaliforniaMediumThe mode choice models in Fresno County utilize a multinomial logit formulation. Within the Fresno COG Model, the mode choice step categorizes trips into various options including walking, biking, local bus, regional bus, bus rapid transit (BRT), shared ride (3+ people), shared ride (2 people), and drive alone.
MMPOMemphis, TennesseeLargeUtilizing a nested logit model, certain trip purposes do not include bike trips and are consequently excluded from consideration. The variables employed to forecast the likelihood of non-motorized trips encompass population density and household income.
WFRCSalt Lake City, UtahLargeTo determine the distribution between motorized (auto and transit) trips and non-motorized trips (walk/bike), a nested multinomial logit mode choice model is employed. Trip distance is the sole predictor utilized for the non-motorized share.
METROPLANOrlando, FloridaLargeThis does not model non-motorized travel. For the rest, they use a nested logit form.
MARCKansas City, Kansas and MissouriLargeNon-motorized travel is not included in the modeling approach. The model employs a nested logit framework for other modes.
OKI-MPOCincinnati, OhioLargeABM. Non-motorized travel is included in the modeling approach. The model employs a multinomial logit framework for other modes.
EWGSt. Louis, MissouriLargeNon-motorized travel is not included in the modeling approach. The model employs a nested logit framework for other modes.
BMPOBoston, MassachusettsLargeThe model is structured in a multinomial logit form, excluding the bike mode. Walk time serves as the sole predictor for the probability of walking
SEMCOGDetroit, MichiganLargeNon-motorized travel is not included in the modeling approach in the existing version. The model employs a multinomial logit framework for other modes. In the ongoing/future approach, utilizing ABM., the focus will extend to non-motorized transportation, delineating between walking and biking modes. This ongoing effort is projected for completion within the current year
TPBWashington D.C. Metro AreaLargeNo inclusion of active modes in their model.
H-GACHouston, TexasLargeNon-motorized travel is not included in the modeling approach. The model employs a nested logit framework for other modes.
NCTCOGArlington, TexasLargeNon-motorized travel is not included in the modeling approach. For other modes, the model employs a nested logit framework (HBW and HNW), and a multinomial logit model (NHB).
NJTPANewark, New JerseyLargeEmploying a binomial logit model, non-motorized and motorized trips are divided after trip generation but before trip distribution. However, non-motorized travel is not modeled at the mode choice stage. Nested logit is utilized for other modes.
CMAPChicago, IllinoisLargeSucceeding trip generation but preceding trip distribution, non-motorized and motorized trips are separated. However, non-motorized travel is not modeled in the mode choice model. A multinomial logit model is used for other modes.
* The abbreviations listed under MPO represent the official acronyms used by the respective metropolitan planning organizations. ** Small is quantified as under 500,000, Medium is quantified as 500,000 to 1 million, and Large is over 1 million. *** ABM: Activity-Based Modeling.
Table 3. Variables, definitions, and descriptive statistics.
VariableDescriptionNMeanS.D.
Response Variables
modeMode choice (categorical variable with four classes: walk, bike, transit, and car)807,827--
Trip PurposeTrip purpose: home-based work (HBW), home-based other (HBO), non-home-based (NHB)---
Trip Characteristics
ttime_calculatedStandardized travel time807,8270.647.85
tdistTravel distance807,8275.71.18
Households’ Socioeconomic Characteristics
hhsizeHousehold size807,8272.961.29
employedNumber of employed persons in the household807,8271.430.85
vehNumber of vehicles owned by households807,8272.11.04
ageAge807,82737.1823.1
lninccpe2012Natural log of household income (in 1000 s of 2012 dollars)807,82711.051.26
Built Environment Variables
actdenActivity density (pop + emp per square mile in 1000 s)807,82713.6552.6
JobpopJob–population balance807,8270.480.31
entropyLand use entropy (mix)807,8270.490.27
IntdenIntersection density807,827107.394.35
pct4waypercentage of four-way intersections807,82728.621.86
transitdenTransit stops density (Number of stops per area)807,82731.73105.11
pctemp10aPercentage of regional employment within 10 min by auto807,8279.2113.3
pctemp20aPercentage of regional employment within 20 min by auto807,82732.1726.6
pctemp30aPercentage of regional employment within 30 min by auto807,82754.2529.5
pctemp30tPercentage of regional employment within 30 min by transit807,82722.5624.5
Regional Variables
regpop000Regional population in thousands807,8273,021,449.851,783,604
regpopdenRegional population density807,827791.18377.13
gaspriceRegional gas price807,8272.870.11
avg_temp_lowAnnual average of low temperature807,82738.7913.23
avg_temp_highAnnual average of high temperature807,82774.758.31
daysltemp32Number of days of low temperature <= 32 °F807,82735.5439.36
dayshtemp90Number of days of high temperature >= 90 °F807,82746.6343.61
yearprecipAnnual precipitation in inches807,82740.3915.11
Table 4. Model performance comparison of RF vs. NL models.
Performance MeasureHBWHBONHB
RFNLRFNLRFNL
AUC-ROC0.9970.6370.990.8070.980.914
Accuracy0.9840.9360.990.900.9740.865
Balanced Accuracy0.950.5840.970.640.940.75
F10.9830.430.9930.760.9930.76
Recall0.9840.270.9980.610.9930.83
Disclaimer/Publisher’s Note: The statements, opinions and data contained in all publications are solely those of the individual author(s) and contributor(s) and not of MDPI and/or the editor(s). MDPI and/or the editor(s) disclaim responsibility for any injury to people or property resulting from any ideas, methods, instructions or products referred to in the content.

