Article

An Analysis of Spatiotemporal Evolution and Influencing Factors of Urban Resilience: A Case Study of Liaoning Province, China

School of Geographical Sciences and Tourism, Jilin Normal University, Siping 136000, China
*
Author to whom correspondence should be addressed.
Sustainability 2025, 17(8), 3565; https://doi.org/10.3390/su17083565
Submission received: 24 March 2025 / Revised: 12 April 2025 / Accepted: 14 April 2025 / Published: 15 April 2025

Abstract

This study selects Liaoning Province, China, as the research area and constructs a theoretical evaluation framework for urban resilience based on the five dimensions: ecological, economic, social, infrastructural, and institutional. It examines the spatiotemporal evolution characteristics and identifies obstacle factors of urban resilience in Liaoning Province from 2011 to 2022, utilizing the optimal parameter-based geographical detector (OPGD) model to analyze its primary driving factors and interactions. The results show that from 2011 to 2022, urban resilience exhibited a fluctuating upward trend, rising from 0.182 in 2011 to 0.288 in 2022, while the disparity among prefecture-level cities has diminished. Spatially, the urban resilience in Liaoning Province tends to be higher in the northern region and lower in the southern region. In the east–west direction, it shows higher levels in the eastern region and lower levels in the western region during the early stage of the study period, followed by an inverted “U”-shaped evolutionary trend by the end of the study period. The obstacle degree to urban resilience development in Liaoning Province intensified from 2011 to 2022. Improving urban resilience in Liaoning Province in the future requires a focus on improving and enhancing the economic and institutional resilience subsystems. The year-end deposit balance of financial institutions is the dominant driving factor of urban resilience. This study offers theoretical support and practical guidance for future urban spatial planning and sustainable development.

1. Introduction

Cities are inherently complex ecosystems with closely interconnected social, economic, and environmental characteristics [1], making them vulnerable to threats such as climate change, public health events, and economic crises [2,3,4]. In 2022, UN-Habitat released the World Cities Report, which projects that by 2050, the global urban population share will increase from 56% in 2021 to 68%. Global urbanization is a major transformation of human society in the twenty-first century [5]. Urbanization enhances labor supply and economic vitality, but it requires rapid and sustainable development to address the challenges of population growth [6]. While urbanization promotes economic and social prosperity and development in cities, cities confront escalating risks of disruption and uncertainty [7], posing serious challenges to urban management and planning [8]. The combination of threats and urbanization makes the concept of urban resilience a critical paradigm for sustainable urban development [9,10]. Against this backdrop, in September 2023, the Chinese government explicitly introduced the concept of “new quality productivity”, considering the realities of economic development. The proposal of “new quality productivity” enriches the connotation of high-quality development [11], aiming to enhance urban innovation capacity through green development and technological innovation, while strengthening the motivation for sustainable development. At the same time, international initiatives such as the United Nations Sustainable Development Goals for 2030, the Sendai Framework for Disaster Risk Reduction 2015–2030, and the Global 100 Resilient Cities initiative emphasize urban sustainability, with the central goal of building “safe, inclusive, plastic, and resilient” cities [12]. Therefore, studying the evolution of urban resilience is an urgent need for addressing the challenges posed by complex urban changes and holds significant practical significance in fostering the sustainable and healthy development of cities.
The term “resilience” was initially used in the engineering field to describe the return to an original state. Over time, research on resilience has expanded to encompass natural ecological resilience [13], socio-ecological resilience [14], and the concept of urban resilience has gradually developed [15]. The concept of urban resilience spans multiple disciplines, including engineering, geography, social ecology, environmental science, urban planning, political science, etc. [16,17], with definitions yet to be unified [18], but all perspectives involve the internal coordination and organizational capacity of the urban system, as well as its pressure resistance and resilience in the face of external uncertainties and risks [19]. Currently, research on urban resilience has become a forefront field and a research hotspot for addressing and preventing various natural disasters, anthropogenic disturbances, and public health emergencies [20,21]. In recent years, a considerable amount of research on urban resilience has been conducted by scholars both domestically and internationally. Some scholars have focused on examining urban resilience from a single dimension, such as ecological resilience [22], economic resilience [23], and infrastructure resilience [24]. Moreover, the majority of scholars argue that cities are complex, integrated systems, and they emphasize the establishment of theoretical frameworks based on multiple dimensions to conduct a comprehensive evaluation of urban resilience. Xufang Mu et al. [25] evaluated the urban resilience of the Beijing–Tianjin–Hebei urban agglomeration from four dimensions: economy, society, environment, and infrastructure. Hudec et al. [26] assessed urban resilience from three dimensions—economy, society, and community connectivity—within the context of an economic crisis. In terms of research methods, resilience measurement has encompassed various evaluation approaches, including the Analytic Hierarchy Process (AHP) [27,28], entropy weight method (EWM) [29], and system dynamics models [30], a variety of evaluation methods. The analysis of influencing factors is often based on linear regression models [31], which exhibit relatively weak spatial differentiation.
In summary, measuring urban resilience levels remains a research priority. The existing literature provides a theoretical foundation and methodological support for this study. However, the evaluation methods are relatively traditional, with most focusing on either subjective or objective assessments and few integrating both, which overlooks a comprehensive consideration of human factors and the relative importance of the intrinsic characteristics of cities. Secondly, existing studies tend to focus on urban agglomerations and other globally developed economic regions, with relatively few studies on the provincial-level resilience of less developed regions. The central and southern regions of Liaoning Province are typical representatives of old industrial bases. These areas face issues such as economic transformation and ecological degradation, making cities vulnerable to shocks and weakening their capacity to withstand sudden risks. Additionally, data sources are primarily based on single statistical data, with relatively few uses of remote sensing data. The accuracy of evaluation indicators impacts the precision of the assessment results. In light of this, this study introduces remote sensing monitoring data in the ecological and economic dimensions and employs the AHP–entropy weight combined weighting TOPSIS method to comprehensively measure urban resilience in Liaoning Province. It further analyzes the spatiotemporal evolution characteristics of urban resilience and utilizes the obstacle degree model and the optimal parameter-based geographical detector to identify the bottlenecks and driving factors affecting urban resilience. The aim is to provide a reference for promoting high-quality urban development in Liaoning Province under the new economic normal.

2. Materials and Methods

2.1. The Study Area

Liaoning Province, located in the southern part of Northeast China (38°43′–43°26′ N, 118°53′–125°46′ E), governs 14 prefecture-level cities (Figure 1). Many of its cities are traditional heavy industrial bases, with industries dominated by steel, machinery manufacturing, coal, and petrochemical industries. The province is relatively abundant in mineral resources and has relatively good port conditions, making it a key region for promoting the comprehensive revitalization of Northeast China in the new era. As of 2022, the province’s GDP reached CNY 2.89751 trillion, with an urbanization rate of 73%. Against the backdrop of rapid industrialization and urbanization, Liaoning Province has excessive burden burdens, confronting enormous challenges posed by natural disasters, climate change, and other emergencies. There is an urgent need to enhance urban resilience, identify key influencing factors, and strengthen the cities’ disaster response capacity.

2.2. Data Source

Socio-economic data are sourced from the Liaoning Statistical Yearbook (2012–2023), China Urban Statistical Yearbook (2012–2023), and China Urban Construction Statistical Yearbook (2011–2022), as well as statistical yearbooks and statistical bulletins from various prefecture-level cities in Liaoning Province. PM2.5 data are sourced from the National Qinghai–Tibet Plateau Scientific Data Center (https://data.tpdc.ac.cn/home) (accessed on 14 June 2024). NDVI data from 2011 to 2022 are obtained from the MODIS13A3 product (https://lpdaac.usgs.gov) (accessed on 20 June 2024). The nighttime light data are derived from the integration of DMSP/OLS and NPP/VIIR datasets, resulting in an improved continuous nighttime light dataset for the years 2011 to 2022 (https://dataverse.harvard.edu/) (accessed on 2 July 2024).

2.3. Construction of the Urban Resilience Evaluation Indicator System

The BRIC model assesses resilience in the United States across six dimensions: social, environmental, institutional, economic, infrastructural, and community-organized [32]. This study builds upon the BRIC model and incorporates the research findings of Ruidong Zhao et al. [33]. In considering the limitations of available indicators in China, five dimensions are selected—economic, social, infrastructural, ecological, and institutional—that are consistent with the country’s national context. The social, economic, ecological, infrastructural, and institutional dimensions are integrated into a highly complex coupled system, within which urban resilience refers to the capacity to maintain internal stability and recover functionality in the face of external shocks [34]. However, the concept of urban resilience is more complex and profound in nature. Therefore, it is essential to incorporate evaluation elements at the indicator layer that can deeply reflect the intrinsic characteristics of urban resilience. Based on this, a comprehensive urban resilience evaluation indicator system was ultimately developed, consisting of 23 indicators across five dimensions: economy, society, infrastructure, ecology, and institution (Table 1).
The economic subsystem serves as the fundamental driver of urban development, providing a solid economic foundation for sustainable urban growth [35]. Among its indicators, the deposit balance reflects the basic financial security of residents [36]. The output value of the tertiary industry reflects the development level of the service sector and indicates the potential for economic growth [37]. The nighttime light index is widely used as a proxy for economic vitality [38]. GDP per capita is a key indicator for assessing regional economic strength [39]. Fluctuations in financial revenue reflect the dynamics of the regional economic environment [35].
The ecological subsystem emphasizes the system’s capacity for self-protection, dynamic adaptation, and restorative transformation when faced with climate change, environmental pollution, and urbanization stressors [27]. The development of heavy industrial bases has led to a reduction in green space, inadequate environmental governance capacity, excessive pollutant emissions, and increased pressure on ecosystem functioning [40]. Therefore, indicators are selected from the perspectives of ecological pressure, response, and recovery. Specifically, industrial sulfur dioxide and PM2.5 concentration represent the impact of pollutant emissions on ecosystems and the degree of air pollution, respectively, both contributing to ecological stress [41]. The Normalized Difference Vegetation Index (NDVI) reflects vegetation coverage and is used to quantify ecosystem recovery capacity. The greening coverage rate of built-up areas and the park green space area reflect urban and residential greening levels, respectively, contributing to the enhancement of ecological protection functions [33].
The social subsystem refers to the capacity of a society to self-regulate, adapt, and regain stability under uncertain conditions while maintaining continuous functioning. The development status of the urban social system is directly linked to the basic livelihoods and well-being of the population [42]. Population density reflects the level of population concentration in a region. Scientific development provides essential support for enhancing resilience. A robust educational system can effectively enhance public safety awareness and disaster preparedness capabilities. The number of hospital beds reflects the level of urban medical services and represents the health security capacity of society. It plays a crucial role in providing medical assistance and accommodating affected populations during post-disaster recovery, including events such as earthquakes, floods, fires, food safety incidents, and epidemics [43]. The average wage of on-the-job employees serves as an indicator of income levels.
The infrastructure subsystem plays a fundamental role in urban operation and development [44], encompassing critical facilities that support cities in responding to disaster shocks and achieving recovery and reconstruction. Among these, the number of international Internet users reflects the capacity of information infrastructure [45]. The water supply penetration rate and gas supply penetration rate, respectively, reflect the service capacity of water and gas infrastructure. Road area per capita reflects urban transportation capacity [46]. The density of a drainage pipe in a built-up area reflects the level of basic water discharge infrastructure, which supports the response to extreme climate events and the continuity of urban operations.
The institutional subsystem enhances resilience by establishing standardized regulations and a security management mechanism that combines both stability and flexibility, aiming to prevent the repeated occurrence of urban risks [47]. Among the key indicators, basic pension insurance reflects the level of institutional support for elderly care services in cities. Basic medical insurance reflects the service capacity of urban healthcare institutions and, to some extent, alleviates the financial burden on individuals [35]. Hong Kong-, Macau-, and Taiwan-funded enterprises serve as a representation of the degree of marketization and openness of a city. Therefore, this study selects basic pension insurance, basic medical insurance, and Hong Kong-, Macao-, and Taiwan-invested enterprises as indicators of institutional resilience.

2.4. Methodology

2.4.1. Combined Subjective–Objective Weighting Method

During the computation process, the Min-Max Standardization method was employed to preprocess the data in order to avoid the impact of dimensional differences in the original data on the results [48].
To reduce the impact of human factors and the degree of data discretization when assigning weights, this study used the entropy weight method (EWM) for objective weighting and the Analytic Hierarchy Process (AHP) for subjective weighting. The subjective weight W1i and objective weight W2i were calculated separately, and the combined weights were obtained by using the principle of minimum information entropy to reduce bias, ultimately resulting in the comprehensive weight Wi. The calculation formula is as follows:
w i = w 1 i × w 2 i 1 n w 1 i × w 2 i
where n is the number of indicators, which is 23 in this study. The calculation results are shown in Table 1.

2.4.2. TOPSIS

The TOPSIS method (technique for order preference by similarity to an ideal solution) determines the optimal solution by calculating the distance of each evaluation object to both the positive and negative ideal solutions across all indicators, without relying on sample size or their arrangement order [49]. Compared to other evaluation methods, the TOPSIS method fully utilizes the indicator data information, and its results can accurately reflect the differences between each evaluation indicator. The formula is as follows:
d i + = j = 1 m ( Z i j Z + ) 2  
d i = j = 1 m   ( Z i j Z ) 2  
C i = d i d i + + d i
where Z + is the positive ideal solution; Z is the negative ideal solution; d i + and d i are the distances between each city’s resilience level and the positive and negative ideal solutions, respectively; and C i is the relative proximity of each city’s resilience level to the ideal solution, with greater C i values indicating higher urban resilience development levels.

2.4.3. Kernel Density Estimation Methods

Kernel density estimation is a non-parametric method that is employed to analyze nonequilibrium distributions, which can reveal the degree of concentration and distribution patterns of urban resilience, significantly enhancing the robustness and reliability of the study [50]. The formula is as follows:
f x = 1 n h i = 1 n k x i x ¯ h
where f x is the kernel density function of urban resilience; n is the sample size; h is the bandwidth; x i is the resilience value of city i; x ¯ is the mean; and k (·) denotes the Gaussian kernel function.

2.4.4. Obstacle Degree Model

The obstacle degree model can identify the key factors that hinder urban resilience and improve resilience by introducing factor contribution, obstacle degree, and deviation degree of indicator [51]. In this study, the model is applied to analyze the obstacle factors in the criterion and indicator layers, revealing the bottlenecks faced by urban resilience in the evolutionary process. The calculation formula is as follows:
N t j = W j × A t j j = 1 n W j × A t j × 100 %
A t j = 1 Y t j
where N t j is the obstacle degree of the j-th indicator on urban resilience in year t; W j is the weight of the individual indicator, representing the contribution of the obstacle factor; A t j is the deviation degree of indicator; and Y t j is the standardized value of each indicator.

2.4.5. Optimal Parameter-Based Geographical Detector (OPGD) Model

GeoDetector is a method used to reveal the spatial differentiation of geographic phenomena and their underlying driving forces through statistical analysis [52]. However, the data discretization process in GeoDetector primarily depends on the researcher’s professional judgment, which involves a certain degree of subjectivity. Building on this, this paper refers to existing studies [52,53], using the GD package in R language, to determine the number of classifications through different discretization methods. The maximum q-value is then calculated. A higher q-value indicates that the discretization is more desirable, with the scheme having the highest q-value selected as the optimal parameter setting for the GeoDetector. On the basis of determining the optimal parameters, the driving forces of urban resilience are analyzed using factor detection methods in GeoDetector. The interaction detector is used to identify whether the combined effect of the two driving factors enhances or weakens the explanatory power of urban resilience.
q = 1 h = 1 L N h σ h 2 N σ 2
where the q -value denotes the explanatory power of a factor; h denotes the number of classifications or partitioning for a given indicator; N is the number of units in the entire region; N h is the number of units in the h -th layer; and σ 2 and σ h 2 denote the variances of urban resilience in the entire region and in the h -th layer, respectively.

3. Results

3.1. Spatiotemporal Evolution Characteristics of Urban Resilience

3.1.1. Temporal Evolution Characteristics

The combined weighting TOPSIS method was used to assess the urban resilience of Liaoning Province from 2011 to 2022, yielding both the urban resilience values and twelve-year averages for the 14 prefecture-level cities (Table 2). Overall, urban resilience in Liaoning Province demonstrates a fluctuating and upward trend from 2011 to 2022, with a consistent increase from 2011 to 2017 and a slight decline in 2018, followed by a steady rise from 2019 to 2022, reaching its peak in 2022. The resilience level increased from 0.182 in 2011 to 0.288 in 2022, reflecting an increase of 58.242%, with an average resilience level of 0.237. Trends in the level of urban resilience vary across prefecture-level cities, but all exhibit fluctuating upward trends. The highest mean resilience value is observed in Shenyang, 0.603, while the lowest is in Tieling, 0.156, indicating the nonequilibrium of urban resilience levels and the significant differences between individual cities. Among them, the mean resilience values of three prefecture-level cities—Shenyang (0.603), Dalian (0.540), and Yingkou (0.254)—were significantly higher than the provincial average. Chaoyang, Jinzhou, and Liaoyang experienced the largest increases in resilience levels, with increases of 125.016%, 103.806%, and 91.530%, respectively, while Dalian had the smallest increase at 39.588%. Notably, since 2018, the resilience levels of Jinzhou and Panjin have remained consistently higher than that of Dandong, a trend that became particularly evident during the COVID-19 pandemic. One possible reason is that Panjin’s economy is dominated by petroleum refining, an industry characterized by low labor intensity and high continuity in production, which demonstrated distinct advantages during the pandemic. The regional logistics hub development policy in Jinzhou was effectively translated into supply assurance capacity during the pandemic. In contrast, Dandong, which relies heavily on border trade and tourism, was more significantly affected by lockdown measures, resulting in slower resilience growth.
To further examine the time-series dynamic evolution of urban resilience from 2011 to 2022, kernel density estimation and box-and-whisker plots were employed to compare the urban resilience values of Liaoning Province in 2011, 2015, 2019, and 2022, and to analyze the trend of their time-series evolution (Figure 2). As shown in the kernel density curve (Figure 2a) and box-and-whisker plot (Figure 2b), the following observations can be made: In terms of the position of the primary peak, kernel density curve consistently shifts rightward, and the median line in the box plot gradually moves toward the upper right, indicating a general upward trend in urban resilience in Liaoning Province, with significant improvements in resilience levels over the study period. In terms of distribution pattern, the main peak of the kernel density curve exhibits an N-shaped pattern, showing “rising-declining-rising” changes, with the width of the primary peak exhibiting a “narrowing-widening” trend. Compared to 2011, the height of the primary peak in 2022 has significantly increased, while the width of the peak has not changed substantially. Additionally, the lengths of the upper and lower quartiles in the box-and-whisker plot have decreased, indicating that the disparity in urban resilience among prefecture-level cities has diminished over the study period. Regarding distribution extension and the number of peaks, a distinct rightward tailing phenomenon is observed in the kernel density curve for urban resilience in Liaoning Province, with multiple peaks appearing on the right side of the curve. The pattern of a “single main peak with right-side peaks” is particularly prominent, with a relatively large difference in height between the main peak and the side peaks. This indicates that some cities in Liaoning Province exhibit higher resilience levels than others, demonstrating a gradient effect and a degree of polarization in urban resilience across the cities.

3.1.2. Spatial Evolution Characteristics

The geostatistical trend analysis method was employed to generate a spatial trend surface map in Liaoning Province for the years 2011, 2015, 2019, and 2022 (Figure 3). This map was used to examine the spatial evolution of urban resilience in the region over the period from 2011 to 2022, with the green line indicating the trend of spatial distribution in the east–west direction, and the blue line representing the trend in the north–south direction. From 2011 to 2015, urban resilience generally followed a “high in the east, low in the west; high in the south, low in the north” distribution, indicating a clear spatial directional characteristic of urban resilience. The southern and eastern regions of Liaoning Province exhibited areas of high urban resilience values. From 2015 to 2022, the east–west direction exhibited an inverted “U”-shaped development trend, with no significant changes observed, while the north–south direction maintained the pattern of “higher values in the south and lower values in the north”. Specifically, significant differences were observed in the directionality of the trend lines, with a steeper transition in the north–south direction and a smoother transition in the east–west direction.
To investigate spatial heterogeneity of urban resilience, and drawing on previous studies [33,41], along with actual measurement values, ArcGIS was used to classify urban resilience from 2011 to 2022 into five levels: low [0.100, 0.170), lower [0.170, 0.190), medium [0.190, 0.210), higher [0.210, 0.250), and high [0.250, 0.721]. To visualize the evolution of the spatial pattern of resilience across the 14 cities, spatial distribution maps of urban resilience for the years 2011, 2015, 2019, and 2022 were plotted for Liaoning Province (Figure 4).
Overall, urban resilience in Liaoning Province exhibited a pattern of low-value aggregation and high-value dispersion, by the end of the study period forming a spatial heterogeneity pattern with a core in the “Shenyang-Dalian-Jinzhou-Anshan-Yingkou” region, which gradually decreased towards the periphery. In 2011, the urban resilience values across Liaoning Province ranged from [0.100, 0.476], with the majority of cities exhibiting low resilience, which accounted for 78.571% of the total region. Only Anshan exhibited higher resilience, with two cities—Shenyang and Dalian—classified as high-resilience cities. By 2015, the number of low-resilience cities had slightly decreased, with Panjin and Yingkou improving from low to lower resilience, and Anshan moving from lower to higher resilience, while the number of high-resilience cities remained unchanged. This shift reflected a development trend centered on provincial capitals and coastal cities, driving the improvement of resilience in surrounding cities. In 2019, urban resilience levels had significantly improved compared to 2015. The number of low-resilience cities dropped to one, while the number of lower-resilience cities increased to four. Additionally, the number of cities in the medium, higher, and high resilience categories all rose to three. The reason may be the United Nations’ 2030 Sustainable Development Goal, which proposed the construction of resilient cities, with regions achieving immediate results in urban resilience through administrative measures. In 2022, the values of urban resilience in Liaoning Province ranged from [0.194, 0.677], indicating a continued improvement in urban resilience. The number of medium-resilience cities increased to four, accounting for 28.571% of the total region, while both high-resilience and higher-resilience cities rose to five, comprising 71.429% of the total region. There were no cities with low or lower resilience in the province. In summary, from 2011 to 2022, urban resilience in Liaoning Province showed a consistent upward trend across different magnitudes, with a noticeable spatial nonequilibrium in resilience levels, which is relatively consistent with the results from kernel density estimation.

3.1.3. Temporal Analysis in Urban Resilience Subsystems

Figure 5 illustrates the trend of resilience change in urban resilience subsystems from 2011 to 2022. The ecological resilience development has steadily increased, while the levels of economic, social, infrastructural, and institutional resilience have shown fluctuating upward trends. The average ecological resilience value increased from 0.345 in 2011 to 0.603 in 2022, with an average annual growth rate of 6.222%. The levels of economic, social, infrastructural, and institutional resilience increased from 0.184, 0.180, 0.215, and 0.126 in 2011 to 0.331, 0.280, 0.361, and 0.154 in 2022, respectively, with average annual growth rates of 6.651%, 4.635%, 5.653%, and 1.874%. Ecological development in urban construction in Liaoning Province has made effective progress, while infrastructure remains a shortcoming compared to other subsystems. Under the national context of promoting ecological civilization and advancing ecological protection and sustainable development policies in Liaoning Province, the strengthening of ecological protection has enhanced urban development levels in the province, particularly in terms of significantly improving the ability to increase vegetation cover, improve air quality, and control soil pollution. However, in most cities of Liaoning Province, financial support for infrastructure is slightly insufficient, and the extent of infrastructure development is relatively behind the needs of city growth, which to some extent, constrained the improvement of city development levels.

3.1.4. Spatial Distribution Patterns of Urban Resilience Subsystems

The spatial distribution patterns of urban resilience subsystems in Liaoning Province for the years 2011, 2015, 2019, and 2022 were further examined using the Inverse Distance Weighting (IDW) method. The IDW method is a local interpolation technique based on distance, which assumes that each known point has localized influence, with unknown points being more affected by closer known points than by those further away. In cases where known points are relatively evenly distributed, the inverse distance weighting (IDW) method can present precise or smooth interpolation effects. The outcomes are shown in Figure 6.
In 2011, high ecological resilience was observed in Huludao, while low resilience was distributed in Chaoyang and Panjin. High economic resilience was concentrated in Shenyang and Dalian, whereas the marginal areas in the northeast show low resilience levels. High levels of social resilience were found in Shenyang and Dalian, while low-resilience areas were mainly distributed in the central and western regions. High infrastructure resilience was observed in Dandong, Shenyang, and Dalian, while low-resilience areas were more evenly distributed across the region. Institutional resilience was higher in Shenyang and Dalian, with low-resilience areas located in the eastern region. In 2015, high ecological resilience was observed in Huludao, while moderate levels were distributed across the south-central region. High economic resilience was concentrated in Shenyang and Dalian, with all other prefecture-level cities in the province exhibiting low levels. Social resilience presents a spatial gradient pattern, with high levels centered in Shenyang and Dalian and gradually decreasing toward surrounding areas. High infrastructure resilience was found in Shenyang and Dalian, while low-resilience areas were primarily concentrated around Shenyang. Institutional resilience was higher in Shenyang and Dalian, while most other cities exhibited low levels with a relatively dispersed spatial distribution. In 2019, high ecological resilience was observed in the southwestern region, while Dalian, Yingkou, and Tieling exhibited low levels. High economic resilience was concentrated in Shenyang and Dalian, whereas low-resilience areas were mainly located in the southwestern region and around Shenyang. High levels of social resilience were found in Shenyang and Dalian, while most other prefecture-level cities in the province exhibited low levels. High infrastructure resilience was observed in Shenyang and Dalian, while marginal cities showed low levels of economic resilience. Institutional resilience remained consistent with the 2015 pattern, with high levels in Shenyang and Dalian, and most cities exhibiting low levels with a relatively dispersed distribution. In 2022, high ecological resilience was distributed in Huludao, while low resilience values were primarily found in Fushun and Benxi cities. High-value economic resilience zones were characterized by a circle-like spatial layout with Shenyang and Dalian at the core, while edge-type municipalities such as Huludao, Chaoyang, and Fushun had lower levels of economic resilience. High-value social resilience areas were distributed in Shenyang and Dalian, with low-value areas surrounding the lower-value regions, showing a clear spatial correlation. High-value infrastructure resilience was distributed in Shenyang and Dalian, with low-value areas largely situated in Benxi and Fuxin. Institutional resilience displays a spatial distribution characterized by a decrease from the high-value regions centered in Shenyang and Dalian to the periphery.

3.2. Influencing Factors Analysis

3.2.1. Obstacle Factors Recognition of Criterion Layer

The obstacle degree model was applied to assess the obstacle degree of the urban resilience criterion layer for each city in Liaoning Province. A distribution map illustrating the obstacle factors of the urban resilience criterion layer for the years 2011, 2015, 2019, and 2022 (Figure 7) was plotted to screen the key obstacle factors. The wider the edges of the Sankey diagram, the greater the obstacle degree in the city influenced by the respective factors. The Sankey diagram for the obstacle factors in Liaoning Province reveals that, firstly, the economic resilience subsystem exhibits the widest edges across all cities, suggesting that economic resilience is the primary constraint on urban resilience in the province. Secondly, the social resilience subsystem was a secondary obstacle to urban resilience improvement between 2011 and 2015. However, from 2015 to 2022, the obstacle degree of institutional resilience increased, becoming a secondary subsystem hindering urban resilience enhancement in Liaoning Province, with the potential to escalate to a higher risk level. Infrastructure resilience ranked fourth in terms of obstacle width. Lastly, ecological resilience ranked last, possibly due to factors such as a single industrial structure, significant fiscal pressure, aging infrastructure, an underdeveloped social security system, and severe population outflow in Liaoning Province, which have made social, economic, infrastructural, and institutional resilience more significant barriers, thereby relegating ecological resilience to a relatively lower position. In conclusion, improving urban resilience in Liaoning Province in the future requires a focus on improving and enhancing the economic and institutional resilience subsystems, with urban resilience enhancement serving as a key driver for the high-quality development of its cities.

3.2.2. Obstacle Factors Recognition on Indicator Layer

Uncovering the obstacle factors in the indicator layer affecting the enhancement of urban resilience. The top five ranked significant obstacle factors were listed [54] (Table 3) to explore the internal sources hindering urban development. Overall, from 2011 to 2022, the year-end deposit balance of financial institutions (X6), the number of hospital beds (X14), and the number of participants with basic medical insurance (X22) consistently ranked as the top three obstacle factors affecting urban resilience in Liaoning Province. This indicates that the year-end deposit balance of financial institutions, and the number of participants with basic medical insurance are the primary obstacle factors restricting urban resilience in the province. To address the deficiencies in medical services, Liaoning Province can strengthen healthcare services infrastructure and promote urban resilience by increasing financial deposits, improving the basic medical insurance system, and expanding the number of medical service beds through effective measures. The year-end deposit balance of financial institutions (X6) and the number of participants with basic medical insurance (X22) are attributed to the economic resilience and institutional resilience subsystems, respectively, which supports the results in Section 3.2.1 and further validates that economic resilience and institutional resilience subsystems are main obstacle factors influencing urban resilience in Liaoning Province. Financial revenue (X10), ranked fourth, is also an important factor hindering urban resilience development. The number of participants with basic pension insurance (X21) and the proportion of science expenditure in GDP (X12), ranking fifth, indicate that Liaoning Province’s pension services and science funding hinder the development of urban resilience. In terms of temporal trends, the hindering role of the number of participants with basic medical insurance (X22) has progressively increased from 2011 to 2022, becoming the most significant obstacle factor in 2022. The cumulative obstacle degree of the top five ranked factors exhibits an upward trend, rising from 53.84% in 2011 to 57.47% in 2022, indicating that urban resilience development in Liaoning Province is facing escalating obstacles.

3.2.3. Driving Force Analysis Based on the OPGD

To determine the optimal parameters for the GeoDetector, five discretization methods were employed: natural breaks, equal interval, quartile, geometric interval, and standard deviation (SD) classification. The number of classifications was set between 2 and 7, and the q-values were calculated for 2011, 2015, 2019, 2022, and the entire study period. From these, the classification method that yielded the highest q-value, as well as the classification number at which the 90% quantile of the influence values of all driving factors reached its maximum, was selected as the optimal parameter combination. As shown in Table 4, for most factors in 2011 and 2015, the quantile method was the optimal discretization method, with the optimal number of classifications being 7. In 2019, 2022, and throughout the entire study period, the optimal number of classifications remained at seven, but the quantile method was no longer the preferred method. The five classification methods, respectively, became the optimal discretization method for different driving factors.
Identification of Driver Factors
The driving factors were imported into the GeoDetector to obtain the influence values of individual driving factors on urban resilience. The results are presented in Table 5. The q-values are ranked as follows: X6 > X21 > X14 > X16 > X23 > X10 > X17 > X22 > X9 > X15 > X7 > X11 > X8 > X12 > X2 > X1 > X19 > X13 > X18 > X3 > X20 > X4 > X5. The year-end deposit balance of financial institutions has the highest q-value, demonstrating an explanatory power of over 95%, which shows that the year-end deposit balance of financial institutions plays a dominant role in the level of urban resilience. Second, the number of participants with basic pension insurance, the number of hospital beds, the number of international Internet users, the number of Hong Kong-, Macau-, and Taiwan-funded enterprises, financial revenue, and the water supply penetration rate all exhibit explanatory power exceeding 90%, thus having a larger impact on urban resilience levels. The number of participants in basic medical insurance, GDP per capita, the average wage of on-the-job employees, the proportion of tertiary industry in GDP, nighttime light index, population density, and the proportion of science expenditure in GDP have an explanatory power of more than 20%, indicating a general impact on urban resilience in Liaoning Province. In contrast, factors such as the greening coverage rate of built-up area, NDVI, road area per capita, proportion of education expenditure in GDP, gas supply penetration rate, park green space area per capita, density of drainage pipe of built-up area, industrial sulfur dioxide emission, and PM2.5 concentration all have q-values below 0.2, indicating relatively weak impacts. Therefore, the year-end deposit balance of financial institutions, the number of participants with basic pension insurance, the number of hospital beds, the number of international Internet users, the number of Hong Kong-, Macau-, and Taiwan-funded enterprises, financial revenue, and the water supply penetration rate are the primary driving factors. The q-values for 2011, 2015, 2019, and 2022 were, respectively, detected, and the changes in the q-values of the primary drivers were observed. The impacts of the year-end deposit balance of financial institutions, the number of participants with basic pension insurance, the number of hospital beds, and financial revenue were found to exhibit a fluctuating upward trend, suggesting that the economic, institutional, and social disparities among cities have been progressively increasing and that the influence on urban resilience has been gradually strengthening. The impact of the number of international Internet users, the number of Hong Kong-, Macau-, and Taiwan-funded enterprises remained stable. The impact of the water supply penetration rate; however, exhibited a fluctuating downward trend, failed the significance test in 2022, and demonstrated a reduced influence on the spatial differentiation of urban resilience.
Results of Interactive Detection
By analyzing the results of driving factors interaction detection (Figure 8), it is revealed that interactions exist between the driving factors. After the interaction of two driving factors, both exhibit either double-factor enhancement or nonlinear enhancement, indicating that the interaction between driving factors has a more significant impact than the effect of any single factor. The year-end deposit balance of financial institutions exhibits the strongest driving effect after interaction with other factors, showing explanatory power exceeding 96%. This is followed by the impact of the number of international Internet users, and the number of participants with basic pension insurance, which demonstrates explanatory power above 95%. This indicates that urban resilience in Liaoning Province is primarily driven by the combined effects of financial institution deposits, international Internet usage, pension insurance participation, and the interaction with other driving factors. Additionally, the q-value for GDP per capita as a single factor is 0.527, with relatively weak explanatory power. However, when interacting with factors such as park green space area per capita, industrial sulfur dioxide emission, PM2.5 concentration, the proportion of tertiary industry in GDP, and road area per capita, the interaction exhibits nonlinear enhancement, with q-values of 0.948, 0.965, 0.961, 0.978, and 0.720, all showing explanatory power above 70%. This indicates that the driving force of regional economic strength on urban resilience needs to be more significant through its interaction with factors such as residents’ ecological greening levels, the impact of pollutant emissions on the environment, air pollution levels, the development of the service industry, and the state of transportation infrastructure. It also reflects that adjusting local economic expenditure to strengthen ecological greening, pollutant management, service industry development, and transportation infrastructure can enhance the urban resilience level. The PM2.5 concentration has a q-value of 0.068 in single-factor detection, placing it at the bottom of the list. However, its driving force is significantly enhanced through interactions with other factors, particularly when interacting with the year-end deposit balance of financial institutions, where the q-value rises to 0.974. This indicates that air pollution control has long-term effects, a slow onset, and strong after-effects, exerting an indirect influence on urban resilience. When interacting with driving factors such as year-end financial institution deposit balances, it significantly enhances the level of urban resilience.

4. Discussion

With the advancement of industrialization and urbanization, cities’ overall carrying capacity is diminishing. The assessment of urban resilience levels holds significant theoretical value and practical significance for addressing external shocks and disturbances, as well as for implementing urban development strategies. With the deepening global technological revolution and industrial transformation, Liaoning Province in China, as an old industrial base, urgently requires environmental governance, economic structural transformation, and technological innovation. This paper focuses on Liaoning Province, China, assessing urban resilience from a multi-dimensional perspective and exploring its influencing factors. This research holds important significance for the comprehensive revitalization of lagging old industries and provides a certain practical foundation for future studies on urban resilience in old industrial areas.
This study investigates the spatiotemporal evolution of resilience in 14 cities across Liaoning Province and finds that Shenyang and Dalian generally maintained high resilience levels. This aligns with the findings of Yanpeng Gao et al. [55] for the period 2009–2019; however, their study identified Dalian as having the highest level of resilience. This study identifies Shenyang as having the highest resilience. This discrepancy may be attributed to the different time periods examined. During the COVID-19 outbreak from 2020 to 2022, Dalian, as a port city and cold-chain logistics hub, experienced high levels of population mobility and imported cold-chain logistics, which exacerbated the risk of virus transmission and consequently increased the exposure of its urban system. In contrast, Shenyang’s inward-oriented characteristics may have contributed to greater stability under the shock of the pandemic.
In terms of influencing factors, the deposit balance is the primary driving factor of urban resilience levels. This is consistent with the findings of Huang, Jie et al. [29], indicating that deposit balance can reduce social vulnerability by ensuring residents’ access to basic services such as healthcare, education, and housing. Economic resilience is the main subsystem constraining the improvement of urban resilience in Liaoning Province. To achieve sustainable development, Liaoning Province could promote the application of green technologies to enhance the shock resistance of its economic system through green transformation, reduce resource consumption, and mitigate environmental pollution.
Compared to previous studies [56,57,58], this paper introduces the dimension of institutional resilience to evaluate and analyze the urban resilience of Liaoning Province, thereby enriching the research framework on urban resilience. Additionally, by incorporating remote sensing data, such as NDVI, alongside statistical data, this study enables a more comprehensive assessment of urban resilience, compared to using only statistical data. Given the complexity of urban resilience and the limitations in indicator availability, more consideration is given to China’s national conditions and data accessibility in the selection of indicators. Consequently, institutional resilience indicators are relatively weak. In addition, there is a lack of consideration for ecological indicators, such as those related to natural disasters and the counts of key flora or fauna. Meanwhile, aspects of urban planning, such as urban density and the proportion of high-rise buildings, are also critical factors that should not be overlooked in the assessment of urban resilience. Excessively high urban density and a high proportion of tall buildings can significantly aggravate urban vulnerability during disasters such as earthquakes or fires. Consequently, they may not fully and accurately reflect the urban resilience level in Liaoning Province. Future studies will further strengthen the scientific validity of the indicator system construction.

5. Conclusions

(1)
From 2011 to 2022, the urban resilience of Liaoning Province exhibits a fluctuating upward trend, with a clear overall improvement in resilience levels. Shenyang has the highest level of urban resilience. Urban resilience across prefecture-level cities exhibits growth trends of varying magnitudes, with Chaoyang, Jinzhou, and Liaoyang demonstrating significant upward trends. The disparity in urban resilience levels among local municipalities has decreased.
(2)
From 2011 to 2015, the urban resilience spatial pattern of Liaoning Province exhibited higher resilience in the east and south and lower resilience in the west and north. From 2015 to 2022, the east–west direction showed an inverted “U”-shaped development trend, while the north–south direction maintained the higher in the northern region and lower in the southern region. By the end of the study period, a spatial heterogeneity pattern formed, with a core in the “Shenyang-Dalian-Jinzhou-Anshan-Yingkou” region, gradually decreasing towards the periphery.
(3)
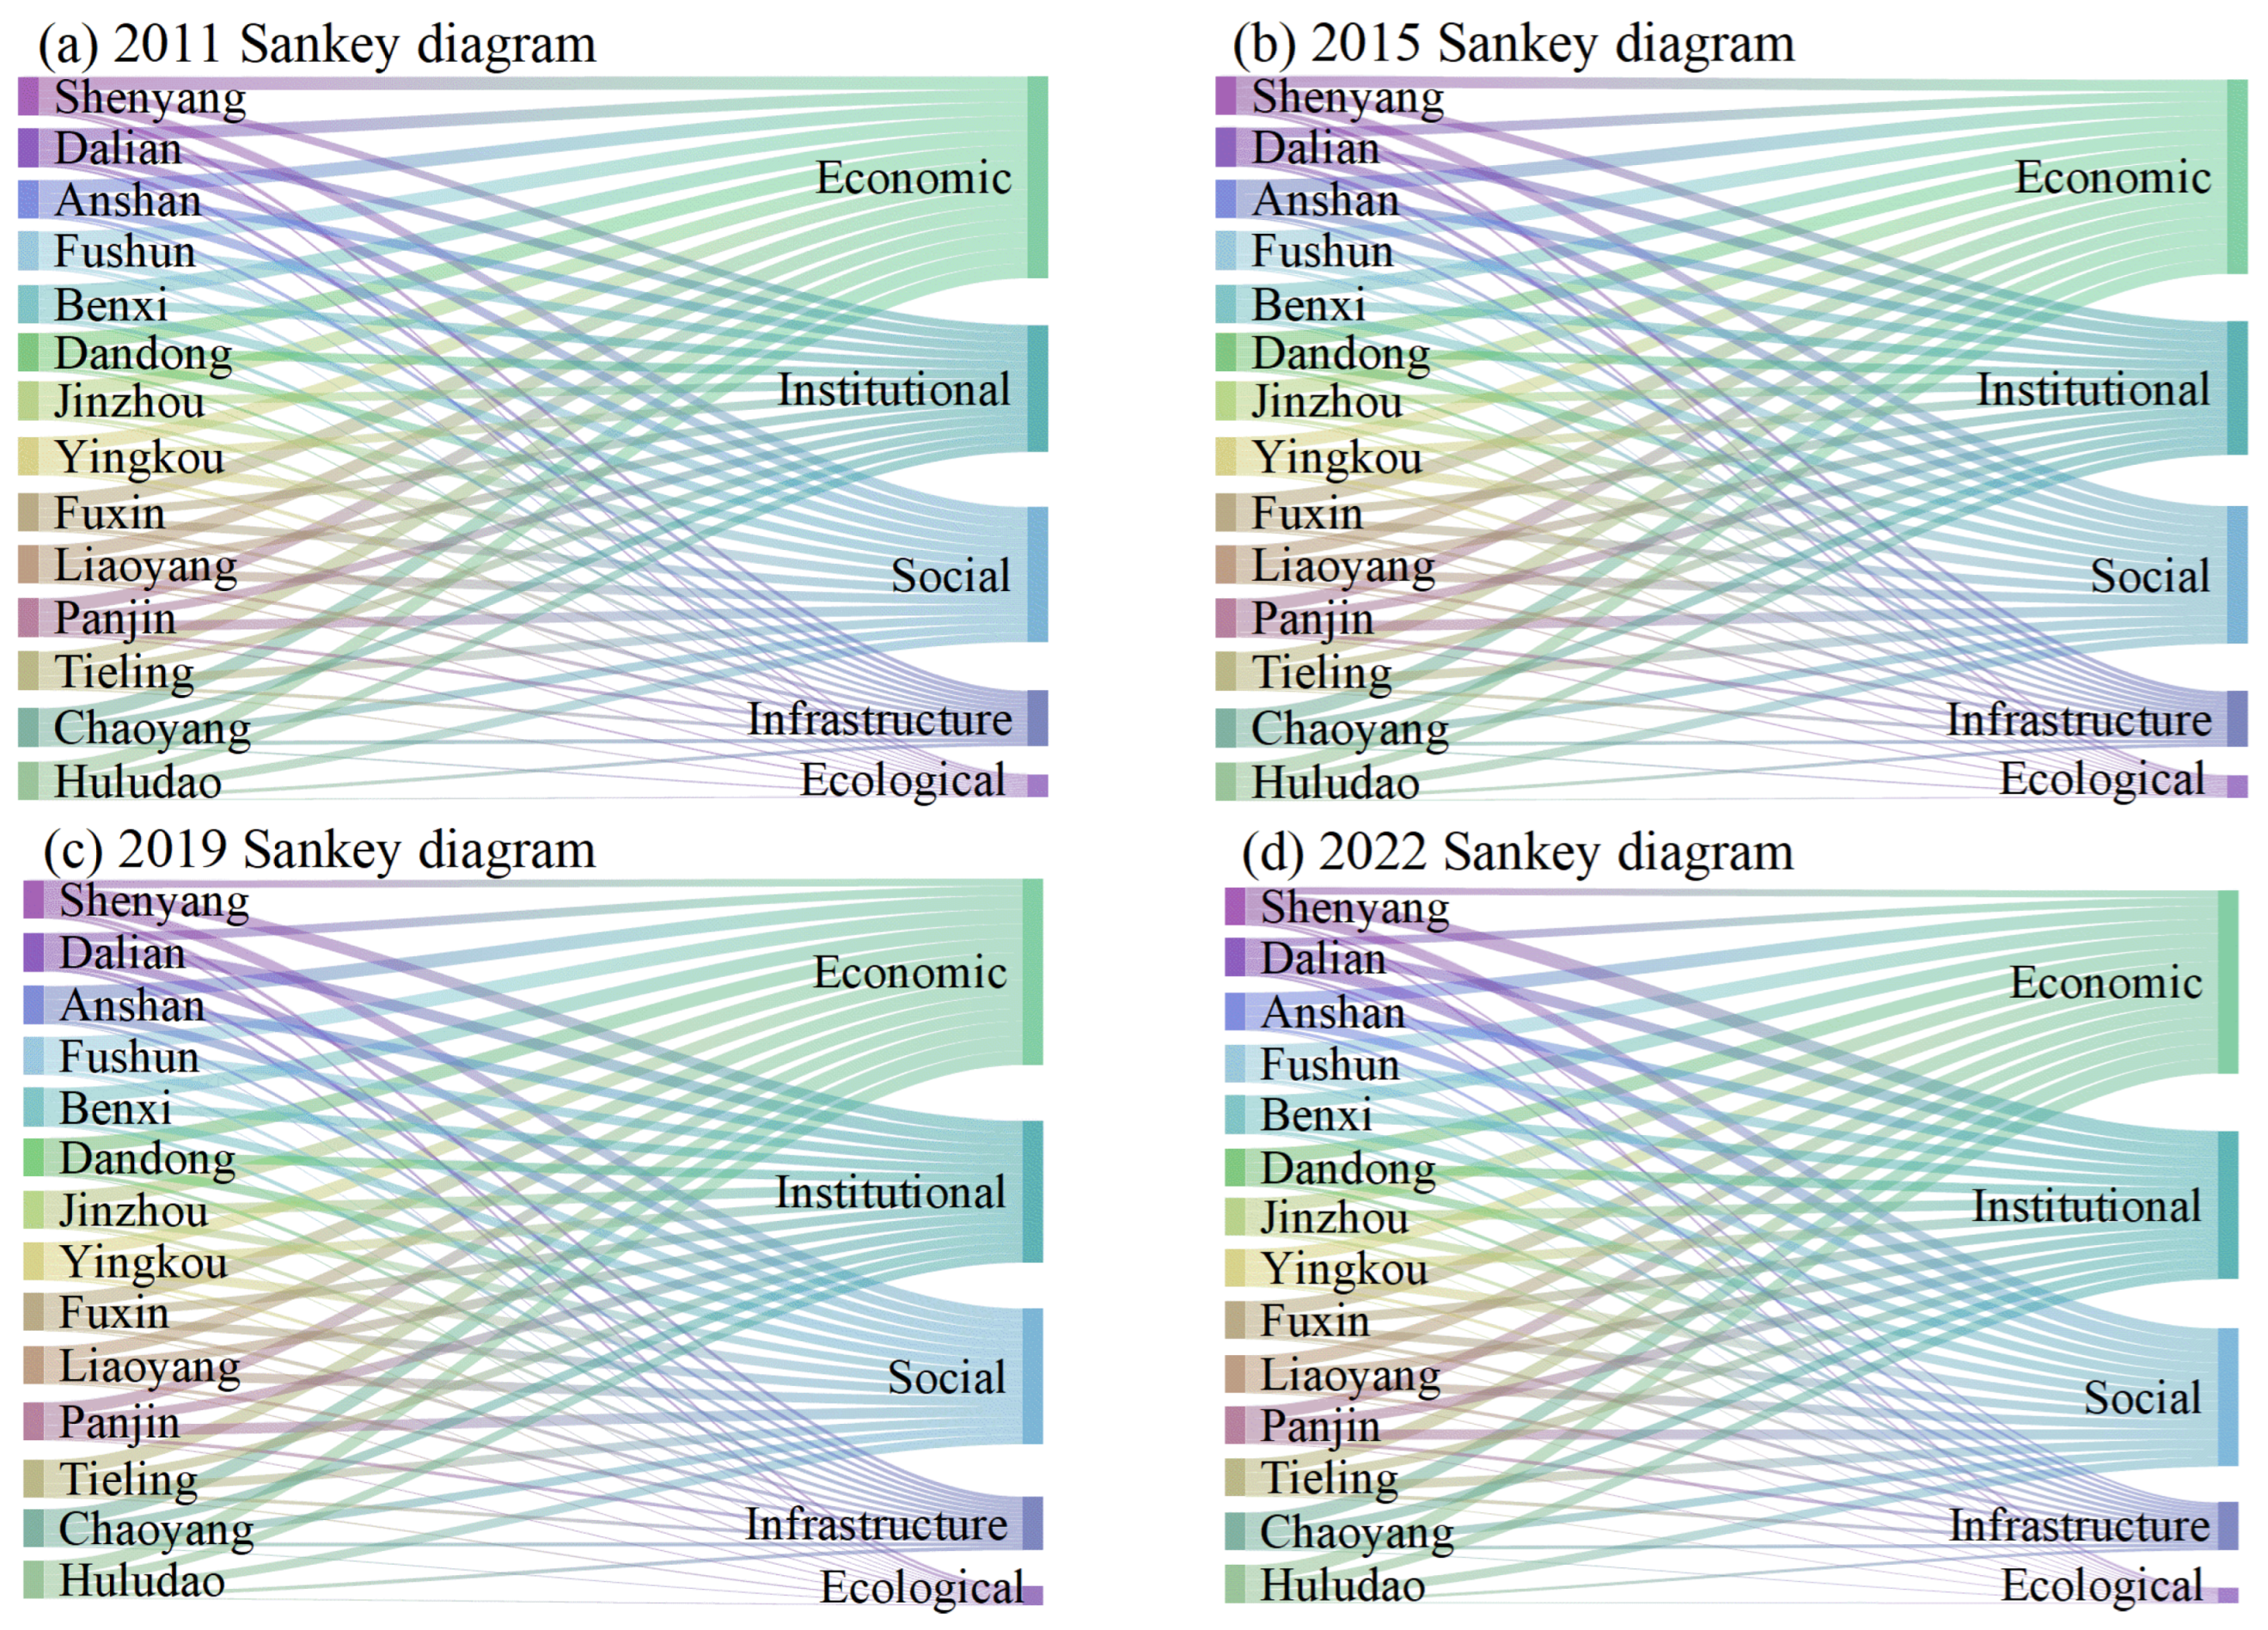
Economic resilience is the primary subsystem hindering the resilience of cities in Liaoning Province. Secondly, the social resilience subsystem is the secondary obstacle to urban resilience improvement in the early stages of the study, while the institutional resilience subsystem becomes the secondary obstacle in the later stages. Lastly, infrastructural resilience ranks fourth in terms of obstacle degree, while ecological resilience ranks last. The cumulative obstacle degree of obstacle factors shows an increasing trend, indicating that urban resilience development in Liaoning Province is facing escalating obstacles.
(4)
The primary driving factors influencing the urban resilience in Liaoning Province include the year-end deposit balance of financial institutions, the number of participants with basic pension insurance, the number of hospital beds, the number of international Internet users, the number of Hong Kong-, Macau-, and Taiwan-funded enterprises, financial revenue, and the water supply penetration rate. The year-end deposit balance of financial institutions is a dominant driving factor of urban resilience, and its influence tends to increase. Interactions exist between the driving factors, and after the interaction of two factors, they exhibit either double-factor enhancement or nonlinear enhancement.

Author Contributions

Conceptualization, C.W. and J.L.; methodology, C.W.; software, C.W.; validation, C.W., Y.L. and Y.Z.; formal analysis, C.W.; investigation, C.W. and J.L.; resources, C.W. and J.L.; data curation, Y.L.; writing—original draft preparation, Y.Z.; writing—review and editing, C.W. and J.L.; visualization, Y.Z.; supervision, J.L.; project administration, C.W. and J.L.; funding acquisition, J.L. All authors have read and agreed to the published version of the manuscript.

Funding

This research was funded by the National Natural Science Foundation of China (41977411); Science and Technology Development Program of Jilin Province (YDZJ202501ZYTS492); the Jilin Provincial Department of Education (JJKH20240563CY); the Social Science Foundation of Jilin Province (2022B40).

Institutional Review Board Statement

Not applicable.

Informed Consent Statement

Not applicable.

Data Availability Statement

Data are contained within the article.

Conflicts of Interest

The authors declare no conflicts of interest.

References

  1. Chrysoulakis, N.; Ludlow, D.; Mitraka, Z.; Somarakis, G.; Khan, Z.; Lauwaet, D.; Hooyberghs, H.; Feliu, E.; Navarro, D.; Feigenwinter, C.; et al. Copernicus for urban resilience in Europe. Sci. Rep. 2023, 13, 16251. [Google Scholar] [CrossRef] [PubMed]
  2. Shi, C.; Guo, N.; Zhu, X.; Wu, F. Assessing Urban Resilience from the Perspective of Scaling Law: Evidence from Chinese Cities. Land 2022, 11, 1803. [Google Scholar] [CrossRef]
  3. Wang, J.; Deng, Y.; Kumari, S.; Song, Z. Research on the Spatial Spillover Effect of Transportation Infrastructure on Urban Resilience in Three Major Urban Agglomerations in China. Sustainability 2023, 15, 5543. [Google Scholar] [CrossRef]
  4. Lv, Y.; Sarker, M.N.I. Integrative approaches to urban resilience: Evaluating the efficacy of resilience strategies in mitigating climate change vulnerabilities. Heliyon 2024, 10, e28191. [Google Scholar] [CrossRef]
  5. Korhonen, J.; Snäkin, J.-P. Quantifying the relationship of resilience and eco-efficiency in complex adaptive energy systems. Ecol. Econ. 2015, 120, 83–92. [Google Scholar] [CrossRef]
  6. Crankshaw, O.; Borel-Saladin, J. Causes of urbanisation and counter-urbanisation in Zambia: Natural population increase or migration? Urban Stud. 2019, 56, 2005–2020. [Google Scholar] [CrossRef]
  7. Lowe, M.; Bell, S.; Briggs, J.; McMillan, E.; Morley, M.; Grenfell, M.; Sweeting, D.; Whitten, A.; Jordan, N. A research-based, practice-relevant urban resilience framework for local government. Local Environ. 2024, 29, 886–901. [Google Scholar] [CrossRef]
  8. Liu, Z.; Fang, C.; Liao, X.; Fan, R.; Sun, B.; Mu, X. Adaptation and adaptability: Deciphering urban resilience from the evolutionary perspective. Environ. Impact Assess. Rev. 2023, 103, 107266. [Google Scholar] [CrossRef]
  9. Bottero, M.; Datola, G.; De Angelis, E. A System Dynamics Model and Analytic Network Process: An Integrated Approach to Investigate Urban Resilience. Land 2020, 9, 242. [Google Scholar] [CrossRef]
  10. Shamsuddin, S. Resilience resistance: The challenges and implications of urban resilience implementation. Cities 2020, 103, 102763. [Google Scholar] [CrossRef]
  11. Wei, C. The Basic Meaning, Historical Evolution and Practical Path of New Quality Productivity. Theory Reform 2023, 6, 25–38. [Google Scholar]
  12. Spaans, M.; Waterhout, B. Building up resilience in cities worldwide—Rotterdam as participant in the 100 Resilient Cities Programme. Cities 2017, 61, 109–116. [Google Scholar] [CrossRef]
  13. Carpenter, S.; Walker, B.; Anderies, J.M.; Abel, N. From Metaphor to Measurement: Resilience of What to What? Ecosystems 2001, 4, 765–781. [Google Scholar] [CrossRef]
  14. Folke, C. Resilience: The emergence of a perspective for social–ecological systems analyses. Glob. Environ. Change 2006, 16, 253–267. [Google Scholar] [CrossRef]
  15. Jabareen, Y. Planning the resilient city: Concepts and strategies for coping with climate change and environmental risk. Cities 2013, 31, 220–229. [Google Scholar] [CrossRef]
  16. Buyukozkan, G.; Ilicak, O.; Feyzioglu, O. A review of urban resilience literature. Sustain. Cities Soc. 2022, 77, 103579. [Google Scholar] [CrossRef]
  17. Datola, G. Implementing urban resilience in urban planning: A comprehensive framework for urban resilience evaluation. Sustain. Cities Soc. 2023, 98, 104821. [Google Scholar] [CrossRef]
  18. Davidson, K.; Thi Minh Phuong, N.; Beilin, R.; Briggs, J. The emerging addition of resilience as a component of sustainability in urban policy. Cities 2019, 92, 1–9. [Google Scholar] [CrossRef]
  19. Ahern, J. From fail-safe to safe-to-fail: Sustainability and resilience in the new urban world. Landsc. Urban Plan. 2011, 100, 341–343. [Google Scholar] [CrossRef]
  20. Ribeiro, P.J.G.; Gonçalves, L. Urban resilience: A conceptual framework. Sustain. Cities Soc. 2019, 50, 101625. [Google Scholar] [CrossRef]
  21. Tong, P. Characteristics, dimensions and methods of current assessment for urban resilience to climate-related disasters: A systematic review of the literature. Int. J. Disaster Risk Reduct. 2021, 60, 102276. [Google Scholar] [CrossRef]
  22. Shamsipour, A.; Jahanshahi, S.; Mousavi, S.S.; Shoja, F.; Golenji, R.A.; Tayebi, S.; Alavi, S.A.; Sharifi, A. Assessing and mapping urban ecological resilience using the loss-gain approach: A case study of Tehran, Iran. Sustain. Cities Soc. 2024, 103, 105252. [Google Scholar] [CrossRef]
  23. Ye, Z.; Li, J.; Chen, J. The promotion mechanism of financial agglomeration and human capital on urban economic resilience: Based on the moderating effect of industrial structure. Int. Rev. Econ. Financ. 2025, 97, 103764. [Google Scholar] [CrossRef]
  24. Rathnayaka, B.; Robert, D.; Adikariwattage, V.; Siriwardana, C.; Meegahapola, L.; Setunge, S.; Amaratunga, D. A unified framework for evaluating the resilience of critical infrastructure: Delphi survey approach. Int. J. Disaster Risk Reduct. 2024, 110, 104598. [Google Scholar] [CrossRef]
  25. Mu, X.; Fang, C.; Yang, Z. Spatio-temporal evolution and dynamic simulation of the urban resilience of Beijing-Tianjin-Hebei urban agglomeration. J. Geogr. Sci. 2022, 32, 1766–1790. [Google Scholar] [CrossRef]
  26. Hudec, O.; Reggiani, A.; Siserova, M. Resilience capacity and vulnerability: A joint analysis with reference to Slovak urban districts. Cities 2018, 73, 24–35. [Google Scholar] [CrossRef]
  27. Liu, Z.; Ma, R.; Wang, H. Assessing urban resilience to public health disaster using the rough analytic hierarchy process method: A regional study in China. J. Saf. Sci. Resil. 2022, 3, 93–104. [Google Scholar] [CrossRef]
  28. Rezvani, S.M.H.S.; de Almeida, N.M.; Falcao, M.J.; Duarte, M. Enhancing urban resilience evaluation systems through automated rational and consistent decision-making simulations. Sustain. Cities Soc. 2022, 78, 103612. [Google Scholar] [CrossRef]
  29. Huang, J.; Lu, H.; Jin, H.; Zhang, L. Urban resilience in China’s eight urban agglomerations: Evolution trends and driving factors. Environ. Sci. Pollut. Res. 2024, 31, 622–633. [Google Scholar] [CrossRef]
  30. Guo, N.; Wu, F.; Sun, D.; Shi, C.; Gao, X. Mechanisms of resilience in cities at different development phases: A system dynamics approach. Urban Clim. 2024, 53, 101793. [Google Scholar] [CrossRef]
  31. You, X.; Sun, Y.; Liu, J. Evolution and analysis of urban resilience and its influencing factors: A case study of Jiangsu Province, China. Nat. Hazards 2022, 113, 1751–1782. [Google Scholar] [CrossRef] [PubMed]
  32. Cutter, S.L.; Ash, K.D.; Emrich, C.T. The geographies of community disaster resilience. Glob. Environ. Change-Hum. Policy Dimens. 2014, 29, 65–77. [Google Scholar] [CrossRef]
  33. Zhao, R.; Fang, C.; Liu, J.; Zhang, L. The evaluation and obstacle analysis of urban resilience from the multidimensional perspective in Chinese cities. Sustain. Cities Soc. 2022, 86, 104160. [Google Scholar] [CrossRef]
  34. Mcphearson, T.; Haase, D.; Kabisch, N.; Gren, A. Advancing understanding of the complex nature of urban systems. Ecol. Indic. 2016, 70, 566–573. [Google Scholar] [CrossRef]
  35. Wang, T.; Yao, C.; Wei, Q. Resilience Assessment and Influencing Factors of Chinese Megacities. Sustainability 2023, 15, 6770. [Google Scholar] [CrossRef]
  36. Sun, Y.; Zhang, L.; Yao, S. Evaluating resilience of prefecture cities in the Yangtze River delta region from a socio-ecological perspective. China Popul. Resour. Environ. 2017, 27, 151–158. [Google Scholar]
  37. Wang, X.; Gao, X. The Evolution of China’s Floating Population and Its Impact on Urbanization: A comparative Analysis based on Inter-and Intra-provincial Perspectives. Sci. Geogr. Sin. 2019, 39, 1866–1874. [Google Scholar]
  38. Zhang, Y.; Song, S.; Li, X.; Gao, S.; Raubal, M. Leveraging context-adjusted nighttime light data for socioeconomic explanations of global urban resilience. Sustain. Cities Soc. 2024, 114, 105739. [Google Scholar] [CrossRef]
  39. Jin, X.Y.; Guan, H.H.; Li, D.K.; Broadberry, S. The evolution of China’s Share in the Global Economy: 1000–2017 AD. Econ. Res. J. 2019, 7, 14–29. [Google Scholar]
  40. Zhu, J.; Sun, H. Research on spatial-temporal evolution and influencing factors of urban resilience of China’s three metropolitan agglomerations. Soft Sci. 2020, 34, 72–79. [Google Scholar]
  41. Ying, C.; Li, J.; Liu, Y.; Zhang, H.; Tian, P.; Gong, H. The spatiotemporal evolution and influencing factors of resilience of county-level cities in the East China Sea coastal zone based on “background-operation-efficiency”. Acta Geogr. Sin. 2024, 79, 462–483. [Google Scholar]
  42. Zhang, M.; Feng, X. Comprehensive evaluation on Chinese cities’ resilience. Urban Probl. 2018, 10, 27–36. [Google Scholar]
  43. Javadpoor, M.; Sharifi, A.; Roosta, M. An adaptation of the Baseline Resilience Indicators for Communities (BRIC) for assessing resilience of Iranian provinces. Int. J. Disaster Risk Reduct. 2021, 66, 102609. [Google Scholar] [CrossRef]
  44. Qin, W.; Lin, A.; Fang, J.; Wang, L.; Li, M. Spatial and temporal evolution of community resilience to natural hazards in the coastal areas of China. Nat. Hazards 2017, 89, 331–349. [Google Scholar] [CrossRef]
  45. Buck, K.D.; Dunn, R.J.; Bennett, M.K.; Bousquin, J. Influence of cross-scale measures on neighborhood resilience. Nat. Hazards 2023, 119, 1011–1040. [Google Scholar] [CrossRef]
  46. Liu, X.; Li, S.; Xu, X.; Luo, J. Integrated natural disasters urban resilience evaluation: The case of China. Nat. Hazards 2021, 107, 2105–2122. [Google Scholar] [CrossRef]
  47. Xiao, W.; Wang, L. Research on the overall risk prevention and control of modern cities from the perspective of resilience. Chin. Public Adm. 2020, 2, 123–128. [Google Scholar]
  48. Liang, Y.; Cheng, Y.; Ren, F.; Du, Q. Urban resilience assessment framework and spatiotemporal dynamics in Hubei, China. Sci. Rep. 2024, 14, 31391. [Google Scholar] [CrossRef]
  49. Shi, W.; Li, B. Resilience spatial network structure of the three major urban agglomerations in the Yellow River Basin. Arid Land Geogr. 2024, 47, 1767–1780. [Google Scholar]
  50. Huang, M.; Zhang, W. Comparison of Resilience Levels and Development Strategies of Four Types of Resource-Based Cities in China. Econ. Geogr. 2023, 43, 34–43. [Google Scholar]
  51. Zhang, Z.; Bai, Y. Spatiotemporal Evolutionary Features and Disorder Factor Diagnosis of Urban Resilience. J. Urban Plan. Dev. 2024, 150, 05024031. [Google Scholar] [CrossRef]
  52. Wang, J.; Xu, C. Geodetector: Principle and prospective. Acta Geogr. Sin. 2017, 72, 116–134. [Google Scholar]
  53. Song, Y.; Wang, J.; Ge, Y.; Xu, C. An optimal parameters-based geographical detector model enhances geographic characteristics of explanatory variables for spatial heterogeneity analysis: Cases with different types of spatial data. Giscience Remote Sens. 2020, 57, 593–610. [Google Scholar] [CrossRef]
  54. Huang, Q.; Cui, Z. Measurement, Differences Decomposition, Dynamic Evolution and Obstacle Factor Identification of Urban Resilience Development Level in China. Stat. Decis. 2023, 39, 106–111. [Google Scholar]
  55. Gao, Y.P.; Chen, W.J. Study on the coupling relationship between urban resilience and urbanization quality-A case study of 14 cities of Liaoning Province in China. PLoS ONE 2021, 16, e0244024. [Google Scholar] [CrossRef]
  56. Huang, J.; Sun, Z.; Du, M. Differences and Drivers of Urban Resilience in Eight Major Urban Agglomerations: Evidence from China. Land 2022, 11, 1470. [Google Scholar] [CrossRef]
  57. Xun, X.; Yuan, Y. Research on the urban resilience evaluation with hybrid multiple attribute TOPSIS method: An example in China. Nat. Hazards 2020, 103, 557–577. [Google Scholar] [CrossRef]
  58. Yu, Y.; Yang, C.; Hu, Q.; Kong, S. Towering sustainability: Unraveling the complex effects of skyscrapers on urban resilience. Environ. Impact Assess. Rev. 2024, 108, 107614. [Google Scholar] [CrossRef]
Figure 1. Location of study area.
Sustainability 17 03565 g001
Figure 2. Kernel density curve and box-and-whisker plot of urban resilience from 2011 to 2022: (a) kernel density curve plot; (b) box-and-whisker plot.
Sustainability 17 03565 g002
Figure 3. Fitted spatial trend surface of urban resilience from 2011 to 2022. Note: The green line indicates the trend of spatial distribution in the east–west direction, and the blue line represents the trend in the north–south direction.
Sustainability 17 03565 g003
Figure 4. Spatial distribution of urban resilience from 2011 to 2022.
Sustainability 17 03565 g004
Figure 5. Radar chart of changes in the resilience subsystems.
Sustainability 17 03565 g005
Figure 6. Spatial distribution of urban resilience subsystems.
Sustainability 17 03565 g006aSustainability 17 03565 g006b
Figure 7. Distribution of obstacle factors at 4urban resilience criterion layer in Liaoning Province.
Sustainability 17 03565 g007
Figure 8. Interactive detection of driving factors.
Sustainability 17 03565 g008
Table 1. Construction of the urban resilience evaluation indicator system for Liaoning Province and its weights.
Target LayerCriterion LayerIndicator LayerAttributeWeight
AHPEWMCombination Weighting
UrbanEcological resilienceX1 NDVI+0.0090.0140.012
resilience X2 Greening coverage rate of built-up area (%)+0.0030.0060.004
X3 Park green space area per capita (m2/person)+0.0240.0170.022
X4 Industrial sulfur dioxide emission (ton)0.0050.0020.003
X5 PM2.5 concentration (µg/m3)0.0050.0200.011
Economic resilienceX6 Year-end deposit balance of financial institutions (CNY ten thousand)+0.1040.1150.122
X7 Proportion of tertiary industry in GDP (%)+0.2080.0150.062
X8 Nighttime light index+0.0230.0570.040
X9 GDP per capita (CNY)+0.0460.0470.052
X10 Financial revenue (CNY ten thousand)+0.0760.0900.093
Social resilienceX11 Population density (person/km2)0.0120.0080.011
X12 Proportion of science expenditure in GDP (%)+0.0380.0730.059
X13 Proportion of education expenditure in GDP (%)+0.0230.0200.024
X14 Number of hospital beds (sheet)+0.1040.0910.109
X15 Average wage of on-the-job employees (CNY)+0.0520.0310.045
Infrastructure resilienceX16 Number of international Internet users (ten thousand users)+0.0520.0610.063
X17 Water supply penetration rate (%)+0.0260.0030.010
X18 Gas supply penetration rate (%)+0.0060.0020.004
X19 Road area per capita (m2/person)+0.0120.0190.016
X20 Density of drainage pipe of built-up area (km/km2)+0.0190.0160.020
Institutional resilienceX21 Number of participants with basic pension insurance (ten thousand people)+0.0830.0650.082
X22 Number of participants with basic medical insurance (ten thousand people)+0.0480.1320.089
X23 Number of Hong Kong-, Macau-, and Taiwan-funded enterprises (number)+0.0180.0960.047
Table 2. Urban resilience values in Liaoning Province.
City201120122013201420152016201720182019202020212022Average
Shenyang0.4760.5270.5500.5750.5630.5770.6020.7210.6450.6500.6690.6770.603
Dalian0.4530.4900.5240.5350.5090.5220.5300.5300.5550.5550.6160.6330.540
Anshan0.1880.1980.2070.2190.2150.2380.2180.2410.2450.2550.2680.2830.231
Fushun0.1230.1400.1460.1730.1660.1570.1610.1640.1730.1890.1900.1950.165
Benxi0.1300.1400.1630.1620.1610.1670.1760.1760.1690.1810.1900.1970.168
Dandong0.1560.1620.1510.1610.1560.1830.2270.1900.2090.2050.2200.2300.188
Jinzhou0.1240.1330.1410.1510.1590.1830.2130.2100.2600.2360.2410.2520.192
Yingkou0.1530.1700.1760.1720.1790.1950.2350.2150.2190.2300.2360.2540.254
Fuxin0.1100.1220.1190.1120.1310.1760.2090.1750.1830.1870.1910.2000.160
Liaoyang0.1190.1320.1400.1560.1610.1860.1800.1920.1960.1980.2130.2280.175
Panjin0.1420.1610.1780.1810.1830.1770.2080.2160.2240.2220.2350.2440.198
Tieling0.1350.1320.1080.1140.1280.1430.2200.1560.1720.1820.1800.1940.156
Chaoyang0.1000.1300.1310.1410.1640.1830.2210.1930.1930.2010.2100.2260.174
Huludao0.1340.1390.1410.1500.1530.1710.1680.1570.1760.1880.2000.2130.166
Average0.1820.1980.2050.2150.2160.2330.2550.2540.2590.2630.2760.2880.237
Table 3. Ranking of the top five obstacle factors at the urban resilience indicator layer.
YearRanking of Obstacle Factors and Obstacle Degree/%
12345
2011X6 (13.86)X14 (11.86)X22 (10.82)X10 (8.90)X21 (8.40)
2015X6 (13.27)X22 (11.44)X14 (11.35)X10 (9.81)X21 (8.34)
2019X6 (12.95)X22 (12.44)X14 (11.77)X10 (9.72)X21 (8.44)
2022X22 (13.72)X6 (12.58)X14 (12.07)X10 (10.51)X12 (8.59)
Table 4. Optimal discretization classification methods and number of classifications for factors.
Factors2011201520192022Entire
MethodsNumberMethodsNumberMethodsNumberMethodsNumberMethodsNumber
X1Equal7Quantile7Equal6Quantile7Natural7
X2Quantile4Quantile7Quantile7SD7SD7
X3SD6SD6Equal5Natural7Natural6
X4Equal6Quantile4Natural7Equal6Quantile7
X5Natural7Natural7Quantile7Geometric6Equal7
X6Natural7Natural7Natural7Natural7Natural6
X7Geometric7Quantile7Equal7SD6Natural7
X8Equal6Natural7Geometric6Geometric7SD7
X9Natural7Quantile7Natural7Equal7Geometric7
X10Quantile7Natural6Natural7Natural7Natural7
X11Quantile7Quantile6Quantile7SD5Natural7
X12Natural7Quantile6Natural7Equal7SD7
X13Quantile6SD5Quantile7Quantile7Quantile7
X14Natural7Natural5Natural6Natural7Natural6
X15Quantile7Quantile6Natural7Quantile6Natural7
X16Quantile7Natural7Natural7Quantile7SD7
X17Geometric6Quantile6Geometric4Equal2Geometric6
X18Quantile4Quantile7Quantile5Geometric4SD7
X19Quantile6Quantile7Quantile5Geometric6Quantile6
X20Natural7Quantile7Quantile7Quantile7Equal6
X21Quantile6Natural7Natural5Quantile7Natural7
X22Quantile7Natural7Quantile7Natural7SD5
X23Quantile6Geometric4Natural4Natural7Natural7
Table 5. Detection results of urban resilience driving factors.
Factors2011201520192022Entire
qqqqqRanking
X10.687 ***0.360 ***0.605 ***0.983 ***0.183 ***16
X20.585 ***0.453 ***0.471 ***0.654 ***0.191 ***15
X30.993 ***0.673 ***0.452 **0.694 ***0.139 ***20
X40.807 ***0.708 ***0.728 ***0.987 ***0.091 **22
X50.600 ***0.982 ***0.474 ***0.596 ***0.06823
X60.990 ***0.995 ***0.990 ***0.996 ***0.968 ***1
X70.808 ***0.990 ***0.982 ***0.699 ***0.340 ***11
X80.588 ***0.694 ***0.645 ***0.675 ***0.300 ***13
X90.776 ***0.987 ***0.984 ***0.987 ***0.527 ***9
X100.990 ***0.995 ***0.988 ***0.996 ***0.917 ***6
X110.365 ***0.435 ***0.967 ***0.657 ***0.304 ***12
X120.710 ***0.487 ***0.502 **0.709 ***0.241 ***14
X130.977 ***0.606 ***0.407 **0.400 ***0.167 ***18
X140.986 ***0.988 ***0.985 ***0.988 ***0.945 ***3
X150.985 ***0.978 ***0.970 ***0.981 ***0.467 ***10
X160.990 ***0.995 ***0.987 ***0.990 ***0.945 ***4
X170.994 ***0.145 *0.999 ***0.0270.904 ***7
X180.620 ***0.260 ***0.313 **0.549 ***0.142 ***19
X190.387 ***0.446 ***0.613 ***0.422 ***0.182 ***17
X200.550 ***0.356 ***0.473 ***0.419 ***0.128 ***21
X210.982 ***0.997 ***0.972 ***0.992 ***0.949 ***2
X220.980 ***0.989 ***0.977 ***0.988 ***0.872 ***8
X230.993 ***0.981 ***0.987 ***0.993 ***0.933 ***5
Note: *** indicates p < 0.1, ** indicates p < 0.01, * indicates p < 0.05.
Disclaimer/Publisher’s Note: The statements, opinions and data contained in all publications are solely those of the individual author(s) and contributor(s) and not of MDPI and/or the editor(s). MDPI and/or the editor(s) disclaim responsibility for any injury to people or property resulting from any ideas, methods, instructions or products referred to in the content.

