Article

Integrated Model for Simulation and Regulation of Basin Water Resources Considering Water Quantity and Quality and Its Application

by
Tianfu Wen
1,2,
Jinjun You
3,*,
Linus Zhang
4,
Nanfang Zhao
1,2,
Zhenzhen Ma
3 and
Xin Liu
1,2
1
Jiangxi Academy of Water Science and Engineering, Nanchang 330029, China
2
Jiangxi Key Laboratory of Flood and Drought Disaster Defense, Nanchang 330029, China
3
State Key Laboratory of Simulation and Regulation of Water Cycle in River Basin, China Institute of Water Resources and Hydropower Research, Beijing 100038, China
4
Department of Water Resources Engineering, Lund University, 22100 Lund, Sweden
*
Author to whom correspondence should be addressed.
Sustainability 2025, 17(8), 3508; https://doi.org/10.3390/su17083508
Submission received: 2 March 2025 / Revised: 7 April 2025 / Accepted: 9 April 2025 / Published: 14 April 2025

Abstract

With the rapid process of urbanization, water conflicts between different water use industries and areas are increasing. Therefore, China has implemented the three-cordons system of water resources management since 2012, when how to make more reasonable regulation of water resources became an urgent problem in most areas of China. In this study, taking the Yuanhe River Basin as an example, an integrated model for the simulation and regulation of water resources considering water quantity and quality from a river basin perspective was proposed, where the water supply was constrained by requirements of water resources management. First, the water resources system was conceptualized into a topologically hydraulic network in the form of point, line, and area elements, including 80 water use units and 79 water supply units. Then, taking the water quantity and quality as constraint conditions in the water supply for corresponding water use sectors, a management-oriented integrated model was established, which highlights the cordon control of the total water use and the pollution load limits of a basin. Finally, through a model simulation, the total water supply was controlled by regulating the water resources, while the pollutant loads into rivers depended on the discharge of water users. Based on the model, strategies for the utilization of water resources and achieving emission reductions of pollution loads were provided. The results of the proposed model in the Yuanhe River Basin showed that benchmarked against the total water demand of 1.705 billion m3, the water shortage was 212 million m3 with a rate of 13.5%, and the loads of COD (Chemical Oxygen Demand) and NH3-N (Ammonia Nitrogen) were 29,096.7 and 2587.3 tons, respectively. The model can provide support for integrated water resources regulation in other basins or regions through a simulation of the natural–social water resources systems, and help stakeholders and decision-makers establish and implement advantageous strategies for regional efficient utilization of water resources.

1. Introduction

Water shortage is a serious problem in the process of urbanization worldwide, and it has even become the main constraint factor in some areas. According to the United Nations World Water Development Report published in 2024, about half of the world’s population faces severe water shortages seasonally [1]. The water demand is continuously increasing due to population growth and economic development [2]. By 2050, approximately 4 billion people and about 22 countries will suffer from severe water shortage problems [3]. Furthermore, restrictions on further exploitation and utilization of water resources are rising in many areas owing to increasing environmental awareness [4]. Consequently, the limited water resources and increasing water demand have been causing potential water resources conflicts in many regions [5,6]. In addition to strengthening water saving, water resources allocation is one of the effective methods for dealing with this conflict as well as improving rational water utilization. In fact, it is a high-dimensional, non-linear, multi-objective and constrained optimization problem [7]. Therefore, various models were constructed to successively solve problems about water resources allocation, such as stochastic multi-objective nonlinear programming model [8], a simulation-based optimization model [9], and a two-stage interval-parameter stochastic fuzzy programming model [10,11,12].
In practice, water resources allocation should not only consider water use efficiency but also preserve equity in different water users [13]. Both efficiency and equality need to be incorporated into the model, which results in the so-called second-best economic optimum [13]. Based on the principle of equality and efficiency, an optimal operation model for cascade reservoir groups was developed considering the impact of reservoirs on water allocation [14]. In fact, equity in water allocation is a significant challenge that needs to be considered by stakeholders [15]. Accordingly, it is necessary to develop comprehensive water resources allocation policies to account for social equity, economic efficiency, and environmental sustainability. Therefore, since 2012, China’s government established the three cordons system that includes total water use control, water use efficiency improvements, and pollution limits of water functional areas [16]. Under the constraints of the “97 Water Diversion Scheme” and the total water use of three cordons, a water resources allocation model for the midstream of Heihe River was constructed to reasonably allocate water resources [17]. Considering the total water use control, water use efficiency, and groundwater availability, the GWAS (General WAS) model of Handan City was established to refine and optimize the allocation of water resources based on the regional topological relationship between water supply and demand [18].
Water projects including diversion and pumping works, ponds, and reservoirs are the key-carriers in the basin water resources system. Water resources regulation that is organically linked with project scheduling has attracted more attention, which usually includes two stages: water resources allocation and water project scheduling [19]. The effective combination of water project scheduling and water resources allocation is an important demand for the water resources utilization under the perfect distribution of water projects, especially large- and middle-sized reservoirs [20]. Through the scheduling of water projects, underground water exploitation and water use behavior, basin water resources regulation can be aimed at making the spatiotemporal distribution of water resources adapt to the economic needs of society and the ecological and environmental requirements as much as possible. Wang et al. [21] proposed an optimization-simulation method that takes into consideration engineering measures, including water transfer projects, reservoirs, and diversion and pumping works. Aiming at realizing the coupling of the water resources allocation with the operational process of hydraulic projects, You et al. established a model through the construction of an integrated framework for water transfer projects and the local water resources system [22]. You et al. proposed a two-layer structure ecological operation model for the integrated ecological operation to combine water exploitation and the operation of hydraulic facilities [23]. The operation rules of specific reservoirs were optimized based on the inflow and water supply provided by the upper layer model, which were then utilized in a second-layer model for reservoir operation.
In recent years, the structure of the water cycle has dualistically evolved due to the intensification of human water use, and consequently the discharge of pollutant loads from water use has a negative impact on the river water quality. Water resources regulation in consideration of the water quantity and quality is an important technical measure to realize the allocation of water resources and the control of water pollution in a basin [24]. In order to improve their feasibility, it is very important to fully reflect the three cordons of China’s water resources management in water resources regulation. Therefore, we establish a basin-scale water resources simulation and regulation model which comprehensively considers the interactions between water quantity and quality. Meanwhile, the model objective function is expanded to fully reflect the requirement of water resources management in China. This study can help decision-makers formulate water resources regulation schemes from a river basin perspective, especially in dry years. The main contents of this paper are organized as follows. Section 2 describes the methods, including hydraulic network structure, integrated modeling with an objective, constraints, and solution methods. Then, the application of this method in the Yuanhe River Basin, including study area, data preprocessing, and basin network is presented in Section 3. Next, model calibration and validation, different regulation schemes, and the selected scheme regulation results are analyzed in Section 4. Finally, the main conclusions of this study are summarized in Section 5.

2. Methodology

2.1. Hydraulic Network Under Dualistic Water Cycle

To effectively describe the basin-level dualistic water cycle, the hydraulic network of the water resources system should be constructed and topologized by point, line and area elements, as shown in Table 1. Area elements are composed of three kinds of units (i.e., water supply units, drainage units, water use units). They include many point elements, such as water sources, drainage outlets, and water users. Specifically, water supply units consist of river-type unit and reservoir-type unit, whereas river-type units include pumping works and diversion works. Large- and middle-sized reservoirs are considered to be independent reservoir-type units while ponds and small-sized reservoirs should be aggregated as several reservoir-type units for simplification of calculation due to their large number. According to water consumption and pollution load discharge or not, water use units consist of instream water use unit and off-stream water use unit, which includes water users of living, industry, irrigation, and so on. Point elements are conceptualized and categorized successively from upstream to downstream, and they are interconnected by line elements, such as networks of natural rivers or artificial channels.
A conceptualized diagram of elements and processes of the water resources system, as shown in 
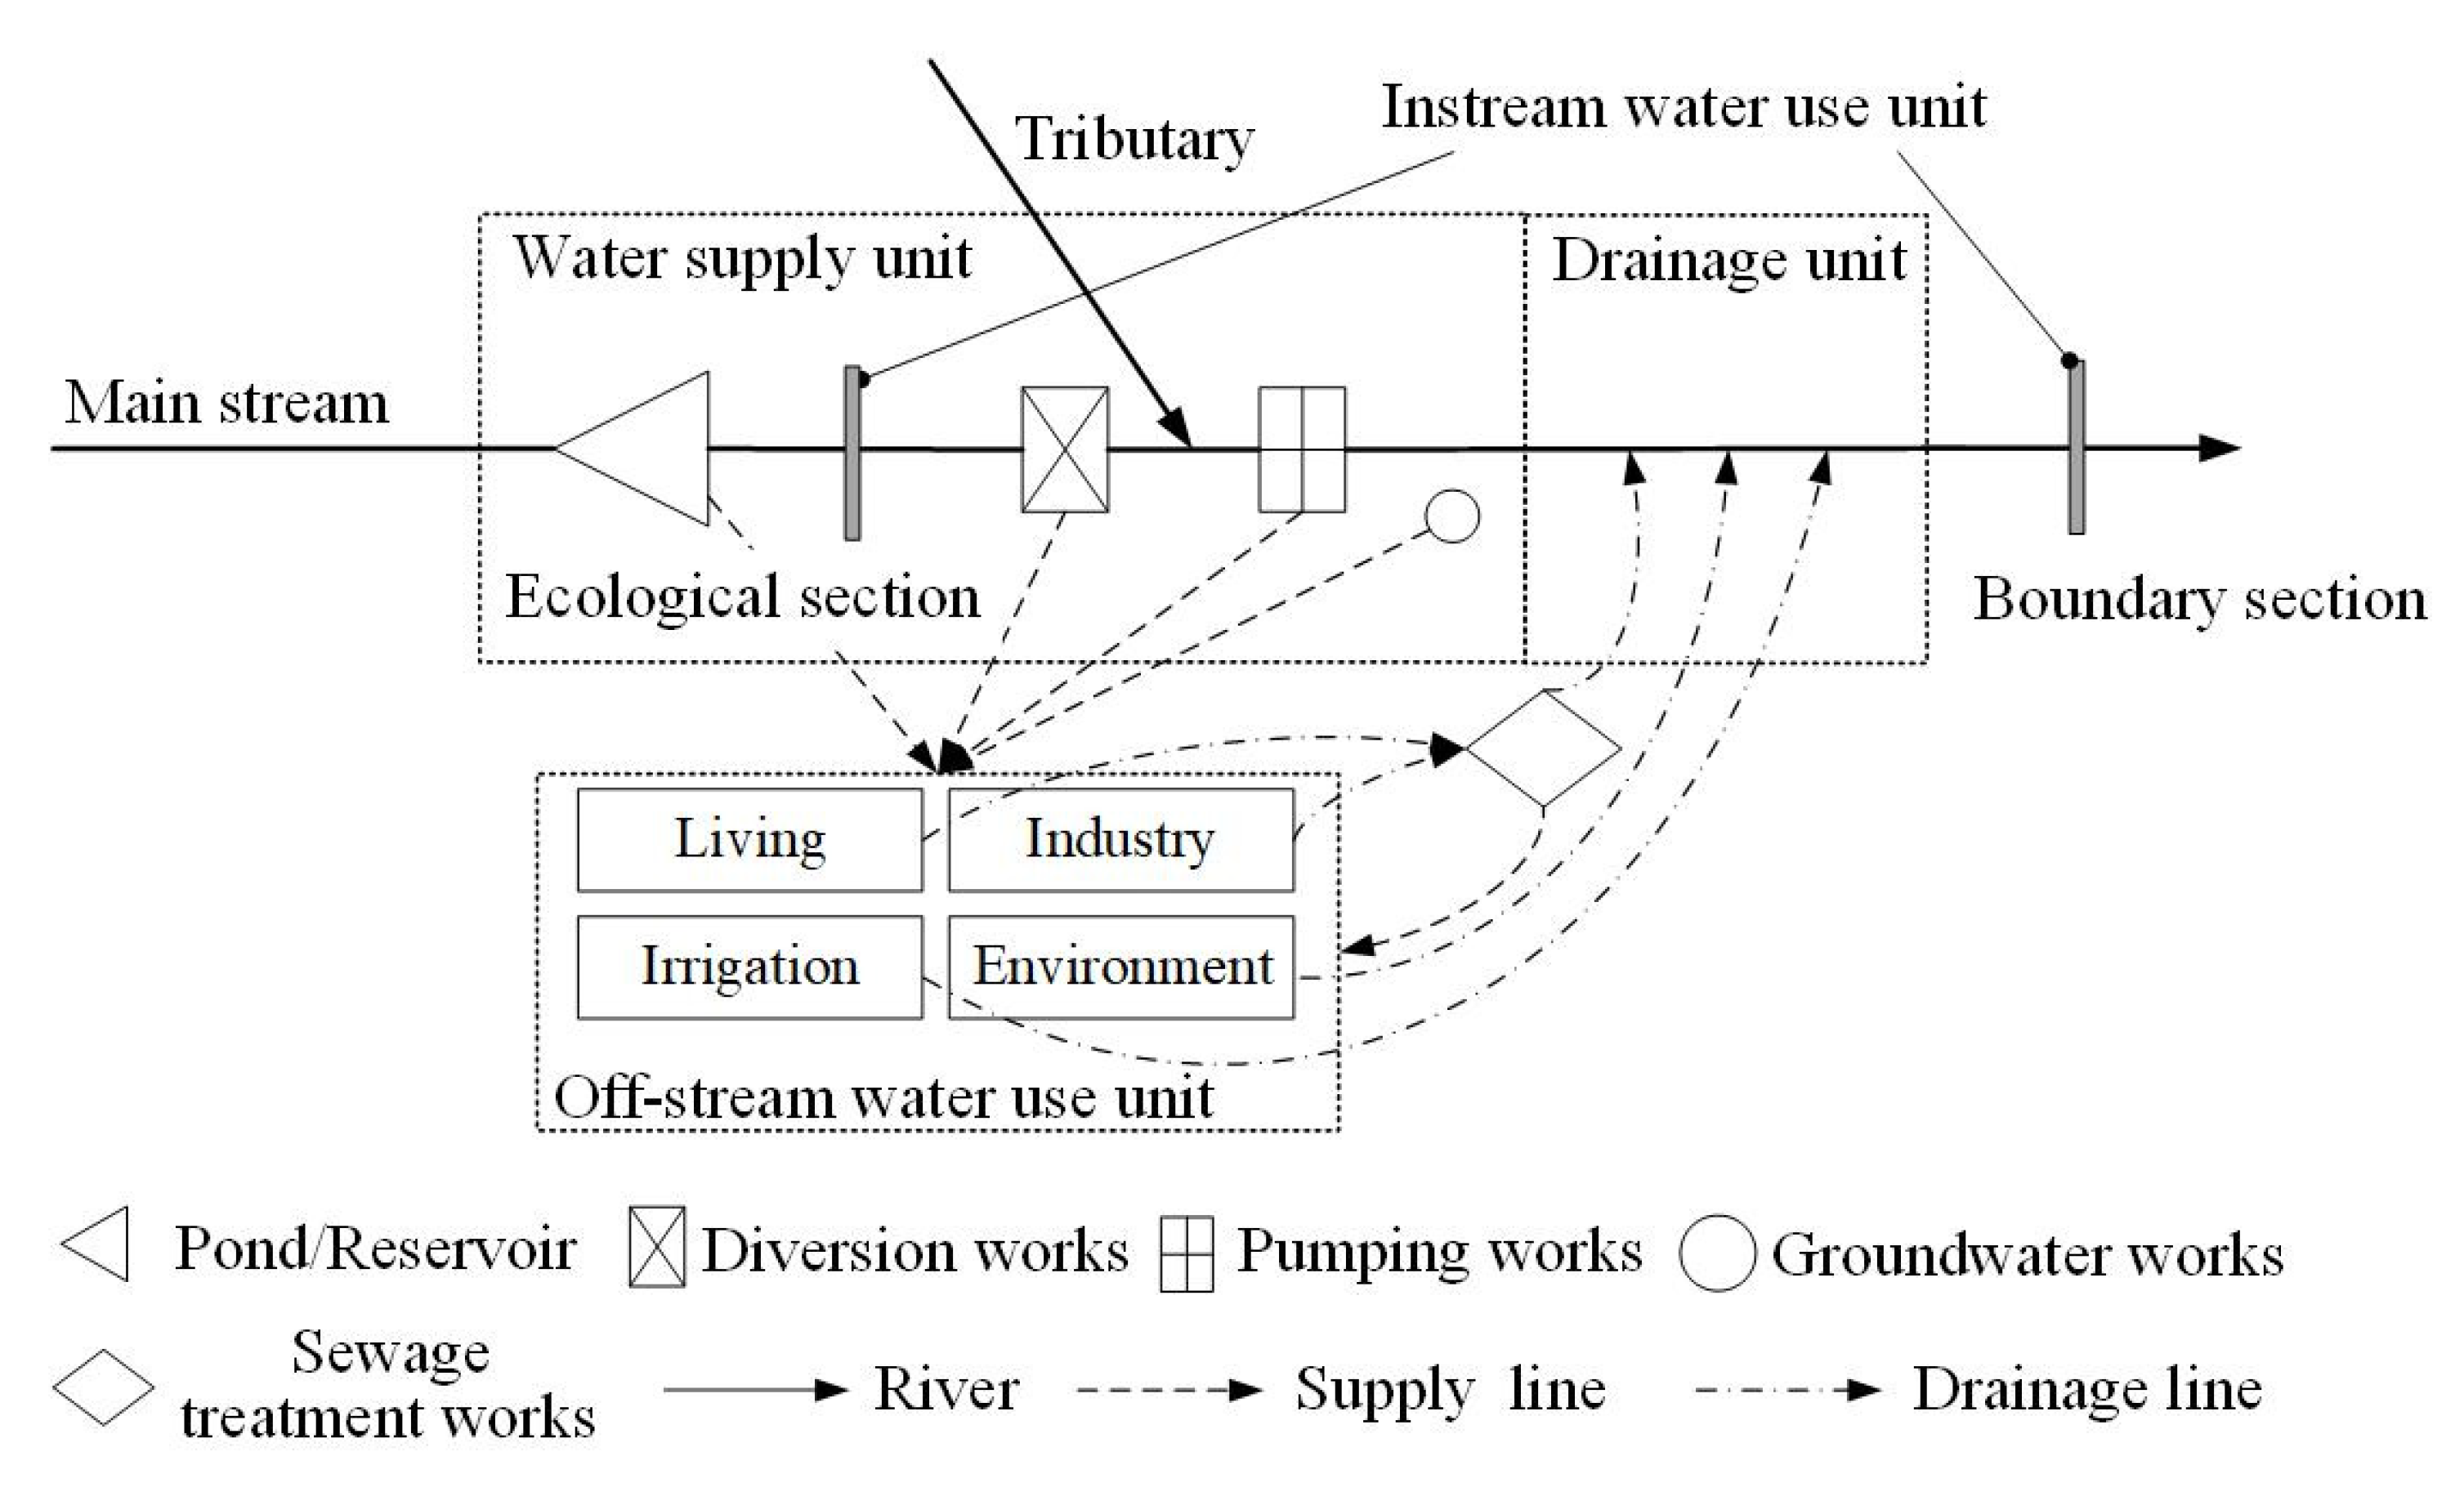
Figure 1, is established to reflect the directed correlation between all elements in the form of point, line, and area elements. In Figure 1, the water demands of off-stream water use units usually consist of living, industrial, irrigation, and environmental demands, which can generally be supplied from reservoirs or rivers by use of diversion works or pumping works, and even groundwater. After being used by off-stream water use units, part of the water used by the living and industrial sectors is reused through sewage treatment works, then the remaining parts with pollutant loads are returned to the drainage units, while excess water for agricultural and environmental demands is returned to the drainage units. The drainage water and pollutant load from off-stream water use units reenter the river, affecting the process of the natural water cycle. For instream water use units, there are mainly the ecological flow demand of the section behind the dam and the interface sections between administrative districts. According to the network relationships, the sum of the outflow amounts of the upstream water supply units and the return water amounts of the drainage units constitute the inflow amounts of the downstream water supply units. The relationships between the inbound and outbound water amounts, supply and drainage amounts, and water consumption and storage amount of each unit are connected based on a water balance, while also reflecting the migration and transformation path of the pollution load in the basin water resources system.

2.2. Basin Water Simulation and Regulation Model Considering Water Quantity and Quality

To better simulate the dualistic nature–society water cycle as well as the river water quality, we developed the Basin Water Simulation and Regulation Model Considering Water Quantity and Quality (WSR-QQ). The model consists of two inter-operational modules: a water balance module and an artificial water regulation module, where the coupling process of the two modules is shown in Figure 2. WRS-QQ mainly highlights the regulation process of water resources considering the influence of water use on the water quality in a river and restrictions of the quality of the water supply. Notably, the water amount and quality in the river are simulated at the same time, which provides a judgement basis for the water quality requirements for different water uses. Moreover, according to the water balance of the water supply and the water demand for the four units, the processes of water supply, consumption, and discharge by water users are objectively described to achieve mutual feedback coupling with the water quantity and quality. The time step of the simulation can be monthly or 10 days, depending on the user’s requirements.
Further, for the social water cycle simulation, the available water supply amount of the water supply unit can be calculated under the premise of instream ecological flow. Then, the water amount that can be supplied from the water supply units by reservoirs, diversion and pumping works, and wells are analyzed through the lines of water supply. Finally, the discharge of the water use units is estimated, which enters the drainage unit through sewage treatment works or drainage lines and then reenters into the river system and becomes the inflow water downstream. Meanwhile, the variation process of the water quality in rivers is simulated simultaneously in the model. The pollutant loads at a particular time from the living, industrial, and farmland irrigation sectors are discharged into the river reaches through the drainage line. Then, the simulation methods for rivers and lakes are used to assess the variations of the water quality, which can be used to judge the water quality for the water supply. Particularly, compared with some other models, such as MIKEBASIN [25], Waterware [26], Aquarius [27], IQQM [28], and WEAP [29], this model is developed to simulate both water quantity and quality with the regulation function in line with the three cordons of China’s water resources management. In addition, the model embodies the water supply order of water use sectors as well as the regulation rules of projects, especially for large- and middle-sized reservoirs. The five types of key equations for rivers, units, and reservoirs are described as follows.
(1) Runoff yields for basin
The VWBM model [30] was chosen to simulate river runoff, which can describe the hydrological process as a series of water storage and flow processes using direct runoff and baseflow. The mechanism of direct runoff can be seen as a translation of the variable-source-area concept of runoff generation, while the baseflow is proportional to the soil moisture [31]. The governing equations are as follows:
W ( t ) = P ( t ) S ( t 1 )
E ( t ) = min W ( t ) 1 exp PET ( t ) α 1 , P E T ( t )
P e ( t ) = P ( t ) P E T ( t ) 1 exp P ( t ) P E T ( t )
Q ( t ) = Q b ( t ) + Q d ( t ) = α 2 S ( t 1 ) + α 3 P e ( t )
S ( t ) = S ( t 1 ) + P ( t ) E ( t ) Q ( t )
where W(t) is the available water within time period t; α 1 α 2 and α 3 are three non-negative parameters without direct physical meanings; P(t) and Pe(t) are the precipitation and precipitation retention within time period t, respectively; PET(t) and E(t) are the potential evapotranspiration and actual evapotranspiration within time period t, respectively; S(t−1) and S(t) are the soil moisture storage amounts at the beginning and end of time period t, respectively; and Qd(t), Qb(t) and Q(t) are the direct runoff, baseflow, and total streamflow within time period t, respectively. The units of the variables are mm.
(2) Water balance for units
The runoff flows from the upper reaches or tributaries of the river into the lower main stream, while the water use unit draws water from the corresponding water supply unit and discharges into the drainage unit. In the process, the water balance in each unit should be satisfied. The water balance formulas of water supply unit i, water drainage unit k, and water use unit j in time period t are as follows:
water   supply   unit   Q i n ( i , t ) + Q y i e l d ( i , t ) = Q S ( i , t ) + Q o u t ( i , t ) + Q l o s s ( i , t ) ± Δ V ( i , t )
water   drainage   unit   Q i n ( j , t ) + Q y i e l d ( j , t ) + Q D ( j , t ) = Q o u t ( j , t ) + Q l o s s ( j , t ) ± Δ V ( j , t )
water   use   unit   Q U ( k , t ) = i k Q S ( i , t ) = Q C ( k , t ) + Q D ( k , t )
Q S ( i , t ) = Q S r e s ( i , t ) + Q S d i v ( i , t ) + Q S p u m p ( i , t ) + Q S u n g ( i , t ) + Q S u c o v ( i , t )
Q U ( k , t ) = Q U l i v ( k , t ) + Q U i n d ( k , t ) + Q U a r g ( k , t ) + Q U e c o ( k , t )
Q C ( k , t ) = Q C l i v i n d ( k , t ) + Q E a r g ( k , t )
Q D ( k , t ) = Q D p o ( k , t ) + Q D n p o ( k , t )
where Qin and Qout are the upstream inflow and outflow of the unit, respectively; Qyield is the self-yield water of the unit; Qloss is the water loss of evaporation or leakage; ΔV is the storage change of the reservoir-type unit; QS is the total supply water of the unit, including the reservoir supply QSres, diversion work supply QSdiv, pumping work supply QSpump, groundwater pumping supply QSung, and unconventional water supply QSucov; QU is the total water use of the unit, including the living water QUliv, industrial water QUind, farmland irrigation water QUarg and off-stream ecological water QUeco; QC is the total consumption water of the unit, including living and industrial water QCliv-ind, and farmland irrigation water QEarg; QD is the total drainage water of the unit, including point source QDpo and non-point source QDnpo. The units of the variables are m3.
(3) Water balance for reservoirs
In a basin, water supply projects generally include water diversion works, pumping works, ponds, and reservoirs. Water diversion and pumping works depend on the capacity of the water supply, while ponds and reservoirs depend on the actual storage capacity. The water balance of reservoir n in time period t is calculated as follows:
Q i n ( n , t ) + Q y i e l d ( n , t ) = Q S r e v ( n , t ) + Q o u t ( n , t ) + Q l o s s ( n , t ) ± Δ V ( n , t )
where Qin and Qout are the inflow and outflow of the reservoir, respectively; Qyield is the self-yield water of the reservoir region; Qloss is the reservoir loss water of evaporation or leakage; ΔV is the storage change of the reservoir; and QSrev is the total water supply of the reservoir. The units of the variables are m3.
(4) Pollutant load balance for river
After sewage is uniformly mixed in the section, the concentration of pollutants decreases continuously along the river. In this study, a one-dimensional water quality model can be used to simulate the migration and transformation process of pollutants in the river, and the formulas are as follows.
water   drainage   unit   C m i x ( j , t ) k j Q D ( k , t ) + Q i n ( j , t ) + Q y i e l d ( j , t ) Q l o s s ( j , t ) = k j C p o ( k , t ) Q D p o ( k , t ) + k j C n p o ( k , t ) A a r g ( k , t ) + C 0 ( j , t ) Q i n ( j , t )
water   supply   unit   C L ( j , t ) = C m i x ( j , t ) exp K r i v L u
where Cpo is the pollutant concentration of point sources (mg/L); Cnpo is the amount of pollutants per unit area (mg/m2); Aarg is the farmland irrigated area (m2); C0 and Cmix are the initial and post-mixing pollutant concentrations, respectively (mg/L); L is the length of river reach (m); u is the average velocity of the river (m/s); Kriv is the pollutant comprehensive attenuation coefficient of the river (1/s); and Cl is the pollutant concentration at L (mg/L).
(5) Pollutant load balance for reservoirs
Due to the degradation and deposition of the pollutants in the reservoir, the pollutant concentrations are different from the values of the reservoir inflow and outflow in a certain period. The Volanweide [32] load model is used to simulate the change of pollutants with the following formulas:
water   drainage   unit   C ( n , t ) j n Q o u t ( j , t ) + V ( n , t ) + Q y i e l d ( n , t ) Q l o s s ( n , t ) = j n C L ( j , t ) Q o u t ( j , t )
water   supply   unit   C T ( n , t ) = C 0 ( n , t ) exp K h t + C ( n , t ) K h 1 exp K h t K h = Q S r e v ( n , t ) + Q o u t ( n , t ) + Q l o s s ( n , t ) V ( n , t ) + K r e s
where Kres is the pollutant comprehensive attenuation coefficient of the reservoir (1/s); V is the reservoir pondage (m3); C0 and C are the initial and inflow pollutant concentrations, respectively (mg/L); and CT is the pollutant concentration in the time period t (mg/L).

2.3. Model Objective and Constraints

2.3.1. Objective Function

In China, the three-cordon system of water resources management is being implemented at present and will be for the foreseeable future. From the scale of the basin, the cordon of water use as well as the upper limit amount of water resources development and utilization are strictly enforced, while the ecological flow in rivers is ensured and the pollutant loads entering the river are controlled to continuously revive the ecological environments of rivers. The aim of water resources regulation is to improve the water supply security under the requirement of water resources management. In this study, the multi-objective function SRd consisting of three objectives (the guarantee degree of the water supply Sd, the proportion of the total water use Rdu and the proportion of the limiting amount of pollution Rdp) is constructed and used in the global multi-objective optimization scheme. In practical applications, with a larger Sd and a smaller Rd, the results can better satisfy the global optimality. As a result, the multi-objective function during the research period is minimized:
min S R d = l = 1 L p s l w l 1 S d l + p r R d u 0.9 + i = 1 2 p r R d p i 0.9
S d l = 1 36 K t = 1 36 k = 1 K Q U l ( k , t ) Q R l ( k , t )
R d u = t = 1 36 l = 1 L k = 1 K Q U l ( k , t ) Q U L
R d p = t = 1 36 k = 1 K C p o ( k , t ) Q D p o ( k , t ) + C n p o ( k , t ) A a r g ( k , t ) P G L
where w is the weight coefficient of the sector, which can be decided by the focus of water use management in applications; ps and pr are the penalty coefficients of Sd and Rd, respectively; QU and QR are the total water use and total water demand of the unit, respectively; QUL is the cordon (maximum of permitted volume) of the total water use; PGL is the cordon of the limiting pollution load. In this study, the w values of living, industrial, agricultural, ecological, and environmental water use are 10, 2, 1, and 1, respectively.
In fact, moderate water shortages in the living, industry, farmland irrigation and environmental sectors are acceptable when the basin is hit by a drought disaster. The optimal value of Sd in the different sectors is 100%, but the minimum acceptable value is set differently according to national relevant technical specification for water supply projects. In Poyang Lake, 95%, 90%, 85% and 85% are selected as the values for the living sector, the industrial sector, the agricultural sector, and the ecological and environmental sector, respectively. According to China’s water resources management requirement, QU cannot exceed QUL and the corresponding upper comfort values (namely the optimal values) were set to 90% of PGL in this study. In fact, the penalty coefficient, as shown in Figure 3, is related to the water demand satisfaction degree and the proportion of cordons. The green region rather than the red region corresponds to the feasible range when comparing the results of different regulation schemes.
In the green range in Figure 3, the farther away from the optimal value, the greater the penalty coefficient is, ranging from 1 to 10. In particular, the penalty coefficient ps is 1 when the Sd is at the optimal value, and pr is the same. In the infeasible region, the penalty coefficient is set to a very large value, such as 100. The set of penalty coefficients ps and pr are as follows:
p s = 100 S d 1 9 ( 1 R d ) / ( 1 R d 0 ) S d 0 < S d < 1 1 S d 1
p r = 100 R d 1 90 ( R d 0.9 ) 0.9 < R d < 1 1 R d 0.9

2.3.2. Main Constraints

The main constraints for the WSR-QQ model are presented below. They include constraints on reservoir storage, water supply projects, and water quality.
(1) Constraint on reservoir storage
V min ( n , t ) V n , t V max ( n , t )
where Vmin and Vmax are the allowable upper and lower limits of the reservoir storage, respectively. Specifically, the upper limit storage is the storage corresponding to the normal level (non-flood season) or the flood control level (flood season), while the lower limit storage is the storage corresponding to the dead level.
(2) Constraints on water supply projects
Q S ( i , t ) min i k Q R ( k , t ) , Q S A ( i , t ) , Q S C ( i , t )
Q R ( k , t ) = Q R l i v ( k , t ) + Q R i n d ( k , t ) + Q R a r g ( k , t ) + Q R e c o ( k , t )
Q S A ( i , t ) = Q i n ( i , t ) + Q y i e l d ( i , t ) Q o u t ( i , t ) Q l o s s ( i , t ) ± Δ V ( i , t )
Q S C ( i , t ) = Q S C r e s ( i , t ) + Q S C d i v ( i , t ) + Q S C p u m p ( i , t ) + Q S C u n g ( i , t ) + Q S C u c o v ( i , t )
where QR is the total water demand of the unit, including living water QRliv, industrial water QRind, farmland irrigation water QRarg, and off-stream ecological water QReco; QSA is the total available water supply of the unit, depending on the inflow Qin, outflow Qout, self-yield water Qyield, loss water Qloss, and change of the unit storage ΔV; and QSC is the total water supply capacity, including the reservoir supply capacity QSCres, diversion work supply capacity QSCdiv, pumping work supply capacity QSCpump, groundwater supply capacity QSCung, and unconventional water supply capacity QSCucov.
(3) Constraints on water quality
Based on the water quality requirements of the sectors, the water supplied to some users should meet the corresponding water quality standards:
Q S u t ( i , t ) C u t C R s Q S A ( i , t )
where Cut is the pollutant concentration of unit in the time period t (mg/L), which refers to CL for rivers in Equation (15) and CT for lakes in Equation (17), and CRs is the upper value of the permitted pollutant concentration for the corresponding sector (mg/L). Specifically, for COD and NH3-N, the values of CRs are less than 20 mg/L (COD) and 1.0 mg/L (NH3-N) for living water, 30 mg/L and 1.5 mg/L for industrial water, 40 mg/L and 2.0 mg/L for agricultural water, ecological and environmental water, respectively. Correspondingly, according to Environmental quality standards for surface water (GB 3838-2002 [33]) [34], classes I–III (i.e., less than 20 mg/L for COD and 1.0 mg/L for NH3-N) are the permitted ranges of the water quality for living water, and classes I–IV (i.e., less than 30 mg/L for COD and 1.5 mg/L for NH3-N) are those for industrial water, classes I–V (i.e., less than 40 mg/L for COD and 2.0 mg/L for NH3-N) are those for agricultural water, ecological and environment water.

2.3.3. Solution Methods

There are two solution methods (the rule-based method and the optimization method) to obtain a suitable water resources regulation scheme in the WSR-QQ model. The practical operation rules can be summarized as a rule-based method through priority order of the water supply and operational rules of projects. The regulation order of water supply projects is to use diversion and pumping works first, then pond and small-sized reservoirs, and finally, large- and middle-sized reservoirs. For the middle- and large-sized reservoirs with multi-objective of water supply, the priority order is to ensure the water demand for living units, then for ecological units, industrial units, and finally, for agricultural units. The calculation process shown in Figure 4 can describe the simulation and regulation process of water resources, associated with the impact of drainage on river water quality. Particularly, from the satisfaction degree of instream ecological water, it can be replenished through upstream medium and large-sized reservoirs when the instream ecological water is insufficient.
The model can be optimized using a genetic algorithm. The water amounts supplied to various users from projects at different times are chosen as decision variables, which are formed into a set of feasible solutions. Then, the satisfaction level of the water demand under each solution is determined. On this basis, the superior solutions are retained, whereas the inferior solutions are eliminated according to corresponding values of the objective function. Thus, a new set of optimal solutions is obtained. This process is performed iteratively to complete the optimization of water resources regulation. The regulation scheme based on global multi-objective optimization can be proposed in combination with the objective function and constraints. In fact, the two types of solution methods are usually combined by optimizing regulations based on feasible results of rule-based regulation, which are screened according to the actual effect of candidate schemes. As a result, the optimized regulation process can be more in line with the actual water resources management and utilization.

3. Application

3.1. Study Area

The Yuanhe River shown in Figure 5 is located in the Poyang Lake Basin of the Yangtze River, China. It covers an area of 6262 km2 and contains 13 major tributaries, with a mainstream length of 279.0 km, where the Kongmujiang River is the largest tributary in the Yuanhe River. The Yuanhe River flows through Yichun City, Xinyu City and into the Ganjiang River, a primary tributary of the Poyang Lake basin from southwest to northeast [35]. The average annual precipitation is 1678.0 mm, while precipitation during the flood season (April–September) accounts for approximately 70% of the annual precipitation. The peak period of farmland irrigation water use is from July to October, followed by a dry season spanning from November to March in the following year. Within the basin, there are 4 large-sized reservoirs (with a total storage greater than 100 million m3), 11 middle-sized reservoirs (with total storage between 10 million and 100 million m3), 649 small-sized reservoirs (with total storage between 0.1 million and 10 million m3), more than 4000 ponds, and about 620 water diversion and pumping works, which form a complete supply project system in the basin.
The Yuanhe River Basin mainly covers five counties, namely Luxi, Yuanzhou, Fenyi, Yushui and Zhangshu, with areas of 728, 2076, 1288, 1815, and 355 km2, respectively. In recent years, the basin hosted a population of 2.84 million people. The area had an industrial added value of 75 million Chinese Yuan and a cultivated land area of 1200 km2. Yuanhuiqu, one of the large-scale irrigation projects in the Poyang Lake Basin, has an effective irrigation area of 190 km2. According to the Environmental quality standards for surface water (GB3838-2002), the water classes are IV or V at Linjiafang in Luxi and Houcun in Fenyi in some months in 2018, and the water classes are the same at Tangbian and Huxindao in Jiangkou Reservoir in most months. In the basin, the water demand of industries is large, which leads to tensions between different water use sectors and areas in the dry season. Moreover, the water quality is poor in some river sectors, which affects the local water intake. In the existing regulations, different projects generally supply water to certain sectors and areas, and the reservoirs that undertake water supply tasks do not give priority to instream ecological flow. The issue of water resources has become significant in Poyang Lake, affecting regional economic development and social stability. The water use characteristics of the Yuanhe River Basin are obvious, which can represent other basins of Poyang Lake.

3.2. Data and Their Preprocessing

The dataset used in this study included five types of geographical diversions, socio-economic statistics, water supply projects, water use statistics, and meteorological and hydrological data. Basin geographical diversions of the county and township were obtained from the Jiangxi Bureau of Surveying, Mapping, and Geoinformation. Basin socio-economic statistics of the population, the gross domestic product (GDP), and the irrigation area were extracted from the Statistical Yearbooks of Pingxiang, Yichun, Xinyu and Ji’an in 2018. The characteristic value and operational rules of water supply projects were from the Hydrological Yearbook of Jiangxi Province in 2018. Basin water data on the water supply, water use, and water consumption were derived from the Water Resources Bulletin of Pingxiang, Yichun, Xinyu, and Ji’an in 2018. Available long-term daily data from thirteen precipitation stations, two evaporation stations, and one hydrologic station from 1980 to 2018 were obtained from the Hydrological Monitoring Centre of Jiangxi Province. In addition, the operation data of Jiangkou Reservoir over the years were from the Operation Manual of Jiangkou Reservoir, compiled by the Sanhe Jiangkou Hydraulic Power Plant in Jiangxi Province. All data shown in Table 2 were of good quality and were checked for quality control by corresponding agencies.
Based on the rainfall of 13 precipitation stations around the basin, the 10-day runoff at the basin outlet was simulated using the VWBM model from 1980 to 2019. The average annual runoff was 6.15 billion m3 in the basin over 40 years, in which the runoff from April 2018 to March 2019 was 4.79 billion m3. Furthermore, the runoff hydrological frequency in 2018 was about 90% based on the frequency analysis, and the period from April 2018 to March 2019 was chosen as the duration for this study according to the periodicity of reservoir operations and farmland irrigation. The water demands of the living sector were calculated according to the population and norm of living water use, while the industrial water demand was computed from the industrial added value and norm of industrial water intake. The water demands over 10 days were divided evenly throughout the year for the living, off-stream environmental, and industrial demands. However, the water demand of farmland irrigation was evaluated based on the effective irrigation area and irrigation water quota, which was determined by crop intermittent irrigation scheduling and effective rainfall during the crop growth period. Therefore, the water demands of the various sectors, i.e., living, industrial, agricultural, ecological, and environmental sectors, in each water use unit were calculated for 10 days from April 2018 to March 2019.

3.3. Network of Water Resources System

To refine water regulations in the Yuanhe River Basin, water use units for both off-stream and instream areas were determined based on the following principles. (1) Particular consideration was given to off-stream areas that are densely populated, industrial parks, and agricultural irrigated areas. (2) The instream areas that are controlled by river sections in important administrative boundaries or next to dams of important reservoirs were treated as relatively independent sub-ecological areas. According to these principles, 57 off-stream units and 23 instream units were selected as water use units in the basin. The former were divided based on natural villages and rivers, with an average area of 100 km2, while the latter were located in county boundaries and dam sections of large- and medium-sized reservoirs. To account for the large number of small-sized reservoirs in the basin, 56 aggregated reservoirs were conceptualized by the locations of off-stream units. The same method was applied to diversion/pumping works. Since large- and middle-sized reservoirs can realize the water supply of inter-units, independent water supply units were considered for reservoirs in the basin. Therefore, the water supply units consisted of 56 river-type units, 56 aggregated reservoir-type units and 17 reservoir-type units based on the basin hydraulic network. The topological relationship between water supply units, water use units, and water drainage units was established based on the water resources network, in which the off-stream and instream water demand must be taken into consideration simultaneously.
Particular consideration should be given to large and middle-sized reservoirs in the water regulation during severe water shortage periods. As shown in Figure 6, the water resources network focused on the supply and drainage relationships between large- and middle-sized reservoirs and the involved water use units by use of point, line, and area elements. In the network, there were 4 large-sized reservoirs (i.e., Shankouyan, Feijiantan, Shifangjing and Jiangkou), 12 middle-sized reservoirs, 23 off-stream water use units, 23 instream water use units, of which six instream units were located at county boundaries, namely Luxi section, Yuanzhou section, Fenyi section, Kongmujiang section, Yushui section and Yuanhe section, and 17 units were ecological flow control sections in the main stream and tributaries.
There are several methods for calculating the instream ecological flow, such as the 7Q10 method [36], the Tennant method [37], the wetted perimeter method [38], the R2CROSS method [39], and IFIM [40]. In practice, the Tennant method is the most widely used in China, and it was used to determine the minimum ecological flow requirements [41,42]. According to this method, 10% of the average runoff was used as the minimum monthly ecological water demand for instream units, where no difference was considered between flood season and non-flood season in a dry year.

4. Results and Analysis

4.1. Model Validation and Calibration

The model involves a water balance module and an artificial water regulation module. First, the water balance module was validated mainly based on runoff at the key sections. Then, the artificial water regulation was examined based on the published water supply amount and water quality in key sections.

4.1.1. Runoff Simulation Validation

The module simulation was evaluated using the Nash–Sutcliffe efficiency coefficient (NSE) and the total relative error (RE) between the simulated and observed runoff data from 1980 to 2000. Since there were few hydrological stations along the mainstream, the Luxi hydrological station with an area of 331 km2 was selected to construct the VWBM model. In the period from 1980 to 2006, the first 20 years were used for model calibration, and the last 5 years were used for model validation. The model parameters were iteratively adjusted by the SCU-EA algorithm, and the optimal values of the three parameters of the model were 0.524, 0.149, and 0.467. The 10-day runoff simulation series at Luxi station is shown in Figure 7. The runoff simulation results showed that the model had an NSE of 0.81 and an RE of 1.73% for the calibration period and an NSE of 0.79 and an RE of 2.14% for the validation period. From the perspective of the simulation results, the module had ideal accuracy. The same parameter values were used for other runoff simulation units with similar areas in the Yuanhe River Basin.
Furthermore, the catchment area of Jiangkou Reservoir was 3900 km2, accounting for 62.3% of the basin area. The accuracy of the runoff simulation in the basin was tested by selecting the inflow runoff of Jiangkou Reservoir. According to the statistical data on water consumption in the basin in the past five years, the average annual water consumption of the area above Jiangkou Reservoir was less than 300 million m3, mainly concentrated in the farmland irrigation sector. Based on the basin water consumption, the NSE and RE between the simulated and measured runoff from 1980 to 2018 were 0.81 and 2.5%, respectively, where the RE was 1.7% in 2018. Generally, the results showed that the model exhibited a good performance and could meet the requirements of water resources simulation and regulation.

4.1.2. Water Simulation Validation

The water supply for social and economic purposes in the basin is composed of the total water amounts supplied for the living, industrial, agricultural, and ecological and environmental sectors in the off-stream water use units. The water supply, water consumption and pollutant loads were calculated using the WSR-QQ model under the basin network of the water resources system.
Since the Yuanhe River Basin belongs to a water-rich region, this study focused on the analysis of water resources simulation and regulation in dry years. The socio-economic water use simulated with a 10-day step in 2018 was compared with the published data derived from the Water Resources Bulletin of Pingxiang, Yichun, Xinyu, and Ji’an to validate the reliability of the model. The statistical water supply and water consumption were 1.36 billion and 630 million m3, respectively, while the corresponding amounts obtained from the model were 1.31 billion and 596 million m3. Thus, the relative errors between the simulated results and the corresponding statistical data were 3.67% and 5.40%, respectively. Comparisons of the simulation results for social and economic purposes and corresponding statistical data from districts or sectors are shown in Table 3 and Table 4, respectively. From Table 3, the maximum and minimum errors of the water supply were 9.06% in Zhangshu and 0.80% in Fenyi, while the counterpart results of the water consumption were 9.07% in Fenyi and 1.14% in Luxi. From Table 4, the simulated results for the living, environmental, industrial, and agricultural sectors were basically consistent with the actual data, where the errors were less than 6% for the water supply and water consumption. This indicated that the model accuracy under the conceptualized water resources network in the Yuanhe River Basin was acceptable.
In the basin, three monitoring sections of Shibei, Kongmujiang, and Hehuguan were selected to evaluate the water quality simulation accuracy based on COD and NH3-N, where changes in the monthly values in 2018 are shown in Figure 8. For COD, the average observed values and simulated values were 10.7 and 11.03 mg/L in Shibei at an upstream location, corresponding to a relative error of about 3.08%, and the error range of the monthly average value was 0.04–0.92 mg/L. Similarly, the relative errors were about 6.05% in Kongmujiang at the midstream location and about 4.12% in Hehuguan at the downstream location. For NH3-N, the average observed and simulated values were 0.80 and 0.82 mg/L in Shibei, respectively, corresponding to a relative error of about 2.50%, while the error range of the monthly average value was 0.01–0.08 mg/L. In general, the model exhibited a good performance for water quality simulation in the Yuanhe River Basin.

4.2. Different Regulation Schemes

4.2.1. Setting of Feasible Schemes

Water resources regulation schemes were set based on three aspects: the water demand satisfaction degree, total water use reduction, and total pollution load reduction. In the Yuanhe River Basin, the socio-economic water demand was 1.705 billion m3 in 2018, while the cordon of total water use was 1.523 billion m3, and the limiting pollution load cordons were 32,402 t/a for COD and 2882 t/a for NH3-N. Without considering the three cordons of China’s water resources management, the total water supply of the basin was 1.655 billion m3, exceeding the cordon of total water use by 8.7%, while the COD and NH3-N values were 34,847.7 and 3136.5 t/a, respectively, exceeding the limiting pollution load cordons by 7.5% and 8.8%. Therefore, to analyze the water regulation scheme for the Yuanhe River Basin under the requirements of water resources management, different regulation schemes must be considered to configure the water supply amounts for the different sectors. By considering combinations of the water supply reduction and sewage treatment improvement, the six schemes shown in Table 5 were set to identify the water regulation for the living, industrial, agricultural, and ecological and environmental sectors with different water supply projects. When the total amount of water supply exceeded the cordon of total water use, it was necessary to rationally reduce the water supply or raise the water use efficiency in these sectors. In detail, some measures such as raising the water use efficiency or conducting restricting water use are adopted to reduce the actual water use when it exceeds the cordon of total water use, while other measures such as raising water use efficiency or sewage treatment in the living and industrial sectors, and fertilizer reduction in the agricultural sector, are used to reduce the total amounts of pollutant loads into the river when they exceed the cordon of the total pollutant loads.
Different from the socio-economic water use sectors (i.e., living, industrial, and agricultural sectors), there is no water consumption process in instream ecological flow. Thus, it is necessary to clarify the method of ecological flow replenishment. As for replenishment measures for instream ecological water, priority is given to water released from reservoirs with a replenishment relationship. After the instream ecological flow in upstream areas or tributaries has been increased, the main stream in the downstream area is replenished by the water from upstream areas or tributaries. It is first ensured that instream ecological flow requirement of the upstream areas and tributaries are satisfied, which will indirectly improve the instream ecological flow of the main stream in the downstream area.

4.2.2. Comprehensive Comparison

Fully following the operational rules and priority orders presented in the rule-based method, the regulation results of water resources under the six schemes were obtained using the WSR-QQ model. The comprehensive objective including the guaranteed degree of the water supply, the proportion of total water use, and the proportion of limiting amount of pollution, for which detailed explanations were provided in Section 2.3.1, was used to judge the effects of different regulation schemes in the basin. With a suitable water shortage rate and pollutant load amounts as the main operation constraints and targets, the objective function values of six schemes for the Yuanhe River Basin were formulated in this study.
As shown in Table 6, the value of the objective function decreased from 54.55 under Scheme 0 to 7.57 under Scheme 5, where the performance of the water resources regulation in the basin was significantly improved. In fact, under the requirement of China’s water resources management, the closer the water demand satisfaction degree was to the minimum acceptable rate in different sectors, the smaller the water supply pollutant discharge was into the river. Based on the results of the objective function, the optimized regulation process of water resources for the Yuanhe River Basin was Scheme 5, which achieved the minimum objective value. The upper limits of the water supply of the living, industrial, agricultural, and ecological and environmental sectors in the basin were reduced to 96, 91, 87 and 86% of the corresponding water demand, respectively, while the COD and NH3-N targets in these sectors were reduced by 13 and 15%, respectively. As a result, the total water supply of the basin was 1.492 billion m3, and the total discharge amounts of COD and NH3-N were 29,096.7 and 2587.3 t/a, respectively, which meet the cordons of total water use and the limiting pollution loads.
When the three objectives (i.e., the guarantee degree of the water supply, the proportion of total water use, and the proportion of limiting amount of pollution) are under reasonable consideration, the operation optimization throughout the basin will lead to significantly improved comprehensive benefits. This has great reference value for administrative managers. The WSR-QQ model’s ability to reflect the advantages and disadvantages of water regulation schemes is particularly important, especially when the basin has planned multiple management objectives. These results also indicate that operation optimization is the best scheme to fully meet the multi-objective benefits of water use units and provide a relatively balanced or compromising scheme.

4.3. Selected Scheme Regulation

4.3.1. Regulation Result of Selected Scheme

The simulation and regulation results of water resources under Scheme 5 were analyzed from multiple perspectives to demonstrate the effectiveness of the WSR-QQ model. There were three kinds of projects: diversion and pumping works, ponds and small-sized reservoirs, and large- and middle-sized reservoirs. The large- and middle-sized reservoirs had a strong regulation capacity and could meet the requirements of the cross-basin water supply. For the administrative regions, Luxi, Yuanzhou, Fenyi and Zhangshu were mainly supplied by diversion and pumping works, as well as ponds and small-sized reservoirs in 2018. The water supply of Luxi was 88 million m3, accounting for 90% of its total amount. However, the water supply from large and middle-sized reservoirs in Yushui was 351 million m3, accounting for 47.3% of the total water supply. For the water use sectors, the off-stream environmental water was mainly supplied by diversion and pumping works, while the water demands of the living, industrial and agricultural sectors of 41 million m3, 27 million m3, and 300 million m3, respectively, were supplied by large- and middle-sized reservoirs, accounting for 29.7, 7.7 and 33.2% of the total amount. Component statistics on the water demand and water supply from the regions and sectors are shown in Figure 9.
For the total water supply of 1.432 billion m3 under Scheme 5, the water consumption and water shortage were 659 million and 211 million m3, respectively. The comprehensive water consumption rate and water shortage rate of the basin were 46.0 and 12.8%, respectively. As for pollutant loads, the discharge of COD and NH3-N were 29,100 tons and 0.26 million tons, respectively. For administrative regions, the proportions of the water demand and water supply in Yushui were the largest, more than 50%, followed by Yuanzhou, accounting for about 25%, while the smallest proportion was Zhangshu, accounting for less than 5%. The range of the water consumption rate was 44.8–52.8%, while the counterpart of the water shortage rate was 10.8–14.3%. The proportions of COD and NH3-N discharge in Yushui were the largest in the basin, accounting for 58.2 and 52.6% of the total, respectively. The smallest proportions of COD and NH3-N were in Zhangshu, accounting for 4.6 and 4.4% of the total, respectively. A summary of the water regulations for the various regions is shown in Table 7.
For the sectors, the proportions of the water demand and water supply in the agricultural sector were the largest, at about 65%, followed by the industrial sector, accounting for about 24%, while the smallest proportion was for the living and instream ecological sectors, accounting for 10%. The water consumption rate of the agricultural and industrial sectors was 50.5 and 36.9%, respectively. The off-stream environmental water shortage rate was the largest, at about 16.7%, while the values in the living, industrial, and agricultural sectors were about 6.7, 9.0, and 15.1%, respectively. The proportions of COD and NH3-N discharge in the agricultural sector were the largest in the basin, accounting for 46.8 and 56.0% of the total, respectively, followed by the industrial sector, accounting for 40% and 31.7% of the total. The smallest proportions of COD and NH3-N were in the living sector, accounting for 12.7 and 12.2% of the total, respectively. A summary of the water regulation for the various sectors is shown in Table 8.

4.3.2. Effects of Instream Ecological Flow

In this study, six important instream sections (i.e., Luxi, Yuanzhou, Fenyi, Kongmujiang, Yushui and Yuanhe), shown in Figure 5, were selected to analyze the changes of the satisfaction degree of the instream ecological flow before and after the replenished operation of large- and middle-sized reservoirs. As mentioned above, 10% of the multi-year average runoff was used as the ecological flow of each section. Before the operation of large- and middle-sized reservoirs, the satisfaction degree of the instream ecological flow of each section was higher than 0.95, while the counterpart amount was improved to a certain extent after the operation under Scheme 5.
As shown in Figure 10, the ecological flow satisfaction degree of the Luxi section in the upstream area increased from 0.982 to 1.0 because of the replenishment of the Sankouyan reservoir. In the midstream area, the satisfaction degree of the Yuanzhou and Fenyi sections was 1.0 before the operation of large- and middle-sized reservoirs. The Yushui and Yuanhe sections were located in the downstream area of Jiangkou Reservoir, which greatly affected the river instream ecological flow. After the operation of Jiangkou Reservoir, the improvement degree of the Yushui section was the largest among the six sections, increasing from 0.956 to 0.998. There was no direct replenishment relationship between the reservoirs and the Yuanhe section located at the outlet section of the basin. Nevertheless, after increasing the instream ecological flow of the upstream area and tributaries, the satisfaction degree of the Yuanhe section increased from 0.978 to 1.0. In addition, the satisfaction degree of the Kongmujiang section in the largest tributary increased from 0.985 to 0.998 due to the operations of two middle-sized reservoirs (i.e., Shiniutan and Shizhikou). It is known that the satisfaction degree of the ecological flow can be improved by reasonable reservoir operation, which is closely related to the hydraulic network. Furthermore, although the basin water shortage can be alleviated by reservoir operation to a certain extent, more large- and middle-sized reservoirs need to be connected to expand the scope of the water supply in an extreme drought period.

4.3.3. Operating Process of Key Reservoir

In addition to reflecting the multi-objective improvement degree of water resources under each scheme, the WSR-QQ model can provide the operation process of reservoirs to comprehensively reflect the regulation effect on the basin water demand. Jiangkou Reservoir with a total storage capacity of 890 million, plays an important role in the regulation of water resources in the downstream basin. The reservoir is one of the important living water sources for Xinyu City, and supplies water for the downstream industry and the Yuanhuiqu Irrigation Area. The water supply composition and processes of Jiangkou Reservoir are shown in Figure 11.
For the water supply of sectors, Jiangkou Reservoir gave priority to the living water demand of Yushui District, with a total amount of 40 million m3. The ecological flow supply was concentrated from early September to late November, with a total amount of 0.42 million m3. The industrial water supply was concentrated from late July to early November, with a total amount of 20 million m3, where the water intakes were mainly distributed in the downstream area of the reservoir. The water supply for irrigation was 211 million m3 during the annual irrigation period (from April to October), while the counterpart was 109 million m3 during the annual irrigation peak period (from July to September). For the water supply process of Jiangkou Reservoir, the water supply from diversion and pumping works, ponds, and small-sized reservoirs could meet the water demands of the sectors and the off-stream environment during the main flood season (from April to June), while Jiangkou Reservoir was primarily used to supply for the living and agricultural sector water demands, with an irrigation supply of 59 million m3. During the irrigation peak period from July to October, the water demand of the downstream area could be met by increasing the water supply from Jiangkou Reservoir, where the water supply for the industrial and agricultural sectors was 19 million and 151 million m3, respectively. From November to March of the following year, Jiangkou Reservoir should supply about 50 million m3 to ensure the basic water amount of the Yuanhuiqu Irrigation Area.

4.3.4. Distribution of Water Shortage Rate

The spatial distribution of the water shortage rate of water use units in the Yuanhe River Basin is shown in Figure 12. The variation range of the water shortage rate was 9.7–28.8% with the average rate of 13.5%, where the largest and smallest water shortage rates were located in Xiacun and Wentang, respectively. There were 52 water use units in the basin accounting for 91.2% of the total units, and the water shortage rate was between 10 and 20%. The top four water use units with large rates were in Xiacun, Nanmiao, Baimu and Nanmu, with rates of 28.8, 24.9, 22.4, and 22.2%, respectively. Usually, the headwaters and tributaries are dominated by small projects while the midstream and downstream areas are controlled by large- and middle-sized projects in the Yuanhe River Basin. Therefore, although the water demand was not very large in the areas, the units located in the headwaters or some tributaries were still prone to water shortage due to no adequate water supply projects, such as water diversion and pumping works, ponds, and reservoirs. However, there were large water demands in Luxi, Yichun, Fenyi and Xinyu in the main stream, which are areas with high social and economic development, but the water shortage rate was low at about 10.3% because of the large capacity of water supply projects and abundant transit water amount. As a result, the water shortage characteristics were certainly different after water resource regulation in the basin.

5. Discussion and Conclusions

The basin water resources allocation system is mainly composed of large- and middle-sized reservoirs in series or in parallel, and the water supply relationship and scheduling rules are complicated. The regulation problem of water resources is characterized by multi-objectives, multi-constraints and multi-stages. Numerical simulation can be used to effectively improve the level of regional water supply security. Some models such as WEAP, and MIKE Basin with friendly interface and efficient operation have been applied in many basin water resources regulations. The multi-water source joint allocation model of Xiong’an New Area was established by using WEAP and rationally utilized Xiong’an reservoir to achieve the adjustment of abundance and drought, which could meet the water shortage plan of the dry year in 2035 [43]. the water resources allocation of the Guangdong–Hong Kong–Macao Greater Bay Area was constructed based on the WEAP, and the results showed that some regions could improve their water satisfaction by about 10% to 15% considering the priority order of water use in regions and industries [33]. Based on the industrial water demands as well as guarantee rate requirements, optimizing the water supply rules or scheduling order of reservoirs can not only play the role of joint compensation of water projects, but also improve the rationality and feasibility of the water resource allocation process. However, the three-cordons system of water resources management has been implemented since 2012 in China, which can make more reasonable regulation in most areas. Therefore, the basin-scale water resources simulation and regulation model considering the water quantity and quality was established in this study, highlighting the requirement of water resources management through the model objective function. Through its application in the Yuanhe River Basin, it was found that the model exhibited good performance in the regulation of water resources constrained by the requirements of the cordons of the total water use and pollution load limits. The following two conclusions were drawn.
(1) Based on point, line, and area elements, a topological hydraulic network of the water resources system was expanded to clearly map the relationships between various units, such as water supply units, drainage units, and water use units. Based on the basin hydraulic network relationship, the model can simulate the regulation process of water resources considering the impact of water use on the instream quality and quality restrictions on the water supply. The water amount and quality in the river could be simulated at the same time to provide a water quality judgement for the water supplies of different sectors. Meanwhile, by employing a water and pollutant load balance method, the processes of water supply, water consumption, and discharge of water users were objectively formulated to achieve the mutual feedback coupling with the water quantity and its quality. In addition, as important water supply projects, the operation process and their effect of large- and middle-sized reservoirs can be provided to guide actual management.
(2) In the Yuanhe River Basin, a water resources system was conceptualized with 57 off-stream units and 23 instream units as water use units as well as 62 river-type units and 17 reservoir-type units as water supply units, where the drainage units and river-type water supply units were consistent. Under the three cordons of China’s water resources management, the combination of a reduction in the water supply and pollutant loads can be considered to set candidate schemes based on the basin’s actual situation. By minimizing the objective function, the water demands of the living, industrial, and agricultural sectors decreased by 4, 9, and 13%, respectively, and the COD and NH3-N concentrations decreased by 13 and 15%, respectively, for the selected scheme. The model results showed that the water shortage was 212 million m3 with a rate of 13.5%, and the loads of COD and NH3-N were 29,100 tons and 0.26 million tons, respectively. The regulation result of the selected scheme can satisfy the cordons of the total water use and the pollution load limits in the basin.
In general, the model has the potential to support basin water resources allocation considering the water quantity and quality under new complex requirements faced by the three cordons of water resources management in China. Thus, there are two limitations of the model. Firstly, an important premise of the model is the “static hypothesis”, that is, the water quantity and quality in the calculated water resources system change slowly, and better results can be obtained in the analysis of basins with large spatial scales and longtime steps, but there is still a problem of cumulative error caused by the time difference of drainage. Secondly, the actual engineering layout is very complicated, and the simplification in the hydraulic network will show obvious differences in some plain water network areas, which would lead to unreasonable results. In the future, it will be necessary to use AI technology and deep learning to supplement the limitation of the model as presented above. In addition, combined with short-term runoff forecast, rolling regulation schemes of the model can effectively enhance the effectiveness of basin water resources management in practice.

Author Contributions

Conceptualization, T.W. and J.Y.; methodology, T.W. and J.Y.; software, T.W.; validation, L.Z., N.Z. and Z.M.; formal analysis, T.W.; investigation, X.L.; resources, L.Z.; data curation, N.Z.; writing—original draft preparation, T.W.; writing—review and editing, T.W., J.Y. and Z.M.; visualization, Z.M.; supervision, J.Y. and L.Z.; project administration, J.Y.; funding acquisition, T.W. and J.Y. All authors have read and agreed to the published version of the manuscript.

Funding

This study was supported by the National Key Research and Development Program of China [grant number 2023YFC3206002], the National Natural Science Foundation of China [grant number 52169001, 52079143], the Great Science and Technology Project of Ministry of Water Resources [grant number SKS-2022010], the Open Research Fund supported by the China Institute of Water Resources and Hydropower Research [grant number IWHR-SKL-202215], the Water Resources Science and Technology Project of Jiangxi, China [grant number 202325ZDKT14], and Jiangxi Provincial “Science and Technology + Water Conservancy” joint plan project [grant number 2022KSG01005].

Institutional Review Board Statement

Not applicable.

Informed Consent Statement

Not applicable.

Data Availability Statement

Data is contained within the article.

Conflicts of Interest

The authors declare no conflict of interest related to this work.

References

  1. Richard, C. Water for Prosperity and Peace—2024 United Nations World Water Development Report; WWAP: Perugia, Italy, 2024. [Google Scholar]
  2. Swain, S.; Mishra, A.; Sahoo, B.; Chatterjee, C. Water scarcity-risk assessment in data-scarce river basins under decadal climate change using a hydrological modelling approach. J. Hydrol. 2020, 590, 125260. [Google Scholar] [CrossRef]
  3. Mekonnen, M.; Hoekstra, A. Four billion people facing severe water scarcity. Sci. Adv. 2016, 2, 1500323. [Google Scholar] [CrossRef] [PubMed]
  4. Chen, D.N.; Cai, Y.; Wang, X.; Li, C.H.; Yin, X.; Liu, Q. An inexact modeling approach for supporting water resources allocation under natural and social complexities in a border city of China and Myanmar. Resour. Conserv. Recycl. 2021, 168, 105245. [Google Scholar] [CrossRef]
  5. Naghdi, S.; Bozorg-Haddad, O.; Khorsandi, M.; Chu, X. Multi-objective optimization for allocation of surface water and groundwater resources. Sci. Total. Environ. 2021, 776, 146026. [Google Scholar] [CrossRef]
  6. Ren, C.F.; Xie, Z.S.; Zhang, Y.; Wei, X.C.; Wang, Y.S.; Sun, D.Y. An improved interval multi-objective programming model for irrigation water allocation by considering energy consumption under multiple uncertainties. J. Hydrol. 2021, 602, 126699. [Google Scholar] [CrossRef]
  7. Deng, L.L.; Guo, S.L.; Yin, J.B.; Zeng, Y.J.; Chen, K.B. Multi-objective optimization of water resources allocation in Han River basin (China) integrating efficiency, equity and sustainability. Sci. Rep. 2022, 12, 798. [Google Scholar] [CrossRef]
  8. Yan, Z.H.; Mo, L.; Zhong, L. Efficient and Economical Allocation of Irrigation Water under a Changing Environment: A Stochastic Multi-Objective Nonlinear Programming Model. Irrig. Drain. 2020, 70, 103–116. [Google Scholar] [CrossRef]
  9. Li, J.; Shang, S.H.; Jiang, H.Z.; Song, J.; Rahman, K.; Adeloye, A. Simulation-based optimization for spatiotemporal allocation of irrigation water in arid region. Agric. Water Manag. 2021, 254, 106952. [Google Scholar] [CrossRef]
  10. Khosrojerdi, T.; MoosaviRad, S.; Ariafar, S.; Ghaeini-Hessaroeyeh, M. Optimal allocation of water resources using a two-stage stochastic programming method with interval and fuzzy parameters. Nat. Resour. Res. 2018, 28, 1107–1124. [Google Scholar] [CrossRef]
  11. Wei, F.L.; Zhang, X.; Xu, J.; Bing, J.P.; Pan, G.Y. Simulation of water resources allocation for sustainable urban development: An integrated optimization approach. J. Clean. Prod. 2020, 273, 122537. [Google Scholar] [CrossRef]
  12. Huang, Y.P.; Cai, Y.P.; Xie, Y.L.; Zhang, F.; He, Y.H.; Zhang, P.; Li, B.W.; Li, B.; Jia, Q.P.; Wang, Y.Y.; et al. An optimization model for water resources allocation in Dongjiang River Basin of Guangdong-Hong Kong-Macao Greater Bay Area under multiple complexities. Sci. Total Environ. 2022, 820, 153198. [Google Scholar] [CrossRef] [PubMed]
  13. Candido, L.; Coelho, G.; Autran, G.; DeMoraes, G.; Marcia, M.; Florêncio, L. Review of Decision Support Systems and Allocation Models for Integrated Water Resources Management Focusing on Joint Water Quantity-Quality. J. Water Resour. Plann. Manag. 2022, 148, 03121001. [Google Scholar] [CrossRef]
  14. Niu, C.; Wang, X.B.; Chang, J.X.; Wang, Y.M.; Guo, A.J.; Ye, X.M.; Wang, Q.W.; Li, Z.H. Integrated model for optimal scheduling and allocation of water resources considering fairness and efficiency: A case study of the Yellow River Basin. J. Hydrol. 2023, 626, 130236. [Google Scholar] [CrossRef]
  15. Shukla, S.; Gedam, S. Evaluating Hydrological Responses to Urbanization in a Tropical River Basin: A Water Resources Management Perspective. Nat. Resour. Res. 2018, 28, 327–347. [Google Scholar] [CrossRef]
  16. He, F.; Zhu, Y.N.; Jiang, S. An exploration of China’s practices in water conservation and water resources management. In Water Conservation and Wastewater Treatment in BRICS Nations; Elsevier: Amsterdam, The Netherlands, 2022; pp. 269–284. [Google Scholar]
  17. Geng, W.J.; Jiang, X.H.; Lei, Y.X.; Zhang, J.Y.; Zhao, H. The Allocation of Water Resources in the Midstream of Heihe River for the “97 Water Diversion Scheme” and the “Three Red Lines”. Int. J. Environ. Res. Public Health 2021, 18, 1887. [Google Scholar] [CrossRef]
  18. Ma, J.; Liu, H.L.; Wu, W.F.; Zhang, Y.Q.; Dong, S. Research on Optimal Allocation of Water Resources in Handan City Based on the Refined Water resources Allocation Model. Water 2023, 15, 154. [Google Scholar] [CrossRef]
  19. Wang, Z.Z.; Ye, A.L.; Liu, K.L.; Jin, J.L. Modeling of bilateral joint regulation of basin-wide water resources supply and demand. J. Hydraul. Eng. 2021, 52, 265–276. [Google Scholar]
  20. Wang, Z.Z.; Zhang, L.L.; Cheng, L.; Liu, K.L.; Ye, A.; Cai, X.M. Optimizing Operating Rules for a Reservoir System in Northern China Considering Ecological Flow Requirements and Water Use Priorities. J. Water Resour. Plann. Manag. 2020, 146, 04020051. [Google Scholar] [CrossRef]
  21. Wang, Y.M.; Yang, J.; Chang, J.X. Development of a coupled quantity-quality-environment water allocation model applying the optimization-simulation method. J. Clean. Prod. 2019, 213, 944–955. [Google Scholar] [CrossRef]
  22. You, J.J.; Lin, P.F.; Wang, J.; Liu, D.; Lou, L. Study on method for coupling water allocation with project operation for inter-basin water transfer project. Water Resour. Hydropower Eng. 2018, 49, 16–22. [Google Scholar]
  23. You, J.J.; Xue, Z.C.; Lin, P.F.; Jiang, Y.Z.; Wei, N. Study on the integrated riverbasin ecological operationon based on Two-layer structure I:Methodology and Model. J. Hydraul. Eng. 2021, 52, 1449–1457. [Google Scholar]
  24. Wang, H.; You, J.J. Progress of water resources allocation during the past 30 years in China. J. Hydraul. Eng. 2016, 47, 265–271 and 282. [Google Scholar]
  25. Kheireldin, K.; El-Dessouki, A. Object Oriented Programming: A Robust Tool for Water Resources Management. In Proceedings of the Seventh Nile 2002 Conference, Comprehensive Water Resources Development of the Nile Basin: The Vision for the Next Century, Cairo, Egypt, 15–19 March 1999; Volume 3, pp. 15–19. [Google Scholar]
  26. Fedra, K. GIS and simulation models for water resources management: A case study of the Kelantan River, Malaysia. GIS Dev. 2002, 6, 39–43. [Google Scholar]
  27. Thomas, C.; Gustavo, E.; Oli, G.B. Planning water allocation in river basin, AQUARIUS: A system’s approach. In Proceedings of the 2nd Federal Interagency Hydrologic Modeling Conference, Subcommittee on Hydrology of the Advisory Committee on Water Information, Las Vegas, NV, USA, 27 June–1 July 2002; Volume 6, pp. 28–81. [Google Scholar]
  28. Simons, M.; Podger, G.; Cooke, R. IQQM—A hydrologic modelling tool for water resources and salinity management. Enivorn. Modell. Softw. 1996, 11, 185–192. [Google Scholar] [CrossRef]
  29. Yates, D.; Sieber, J.; Purkey, D.; Huber-Lee, A.; Galbraith, H. WEAP21—A Demand, Priority, and Preference-Driven Water Planning Model Part 1: Model Characteristics. Water Int. 2005, 30, 487–500. [Google Scholar] [CrossRef]
  30. Vandewiele, G.; Xu, C.Y.; Win, N.L. Methodology and comparative study of monthly water balance models in Belgium, China and Burma. J. Hydrol. 1992, 134, 315–347. [Google Scholar] [CrossRef]
  31. Li, S.; Xiong, L.H.; Li, H.Y.; Leung, L.; Demissie, Y. Attributing runoff changes to climate variability and human activities: Uncertainty analysis using four monthly water balance models. Stochastic. Environ. Res. Risk. Assess. 2015, 30, 251–269. [Google Scholar] [CrossRef]
  32. Jones, R.; Lee, G. Eutrophication modeling for water quality management: An update of the Vollenweider-OECD model. World Health Organ. Water Qual. Bull. 1986, 11, 67–74. [Google Scholar]
  33. GB 3838-2002; Environmental Quality Standards for Surface Water. Ministry of Ecology and Environment PRC: Beijing, China, 2002.
  34. Jiangxi Provincial Department of Water Resources. Jiangxi River and Lake Ceremony; Changjiang Publishing House: Wuhan, China, 2009. [Google Scholar]
  35. Singh, K.; Stall, J. Hydrology of 7-Day 10-Yr Low Flows. J. Hydraul Div. 1974, 100, 1753–1771. [Google Scholar] [CrossRef]
  36. Tennant, D. Instream Flow Regimens for Fish, Wildlife, Recreation and Related Environmental Resources. Fisheries 1976, 1, 6–10. [Google Scholar] [CrossRef]
  37. Leathe, S.; Nelson, F. A Literature Evaluation of Montana’s Wetted Perimeter Inflection Point Method for Deriving Instream Flow Recommendations; Montana Department of Fish, Wildlife and Parks: Helena, MT, USA, 1986.
  38. Mosley, M. Analysis of the effect of changing discharge on channel morphology and instream uses in a Braided River, Ohau River, New Zealand. Water Resour. 1982, 18, 800–812. [Google Scholar] [CrossRef]
  39. Bovee, K. A guide to stream habitat analysis using the instream flow incremental methodology. ifip no. 12. Sci. Res. Essays 1982, 6, 6270–6284. [Google Scholar]
  40. Huang, B.B.; Tian, F.; Wu, S.F.; Kang, C.F. Estimation of ecological flow in the lower reaches of Ganjiang river based on several hydrological methods. Sci. Technol. Eng. 2018, 20, 7858–7864. [Google Scholar]
  41. Li, Q.; Wang, Q.Q.; Chen, H.L.; Qin, Y.L.; Zhang, M.F.; Liu, S.R. Progress and perspectives on ecological flow assessment methods in China. Acta Ecol. Sinica 2024, 44, 36–46. [Google Scholar]
  42. Hou, X.L.; Yang, R.X.; Hou, B.D.; Lu, F.; Zhao, Y.; Zhou, Y.Y.; Xiao, W.H. Joint allocation of multiple water sources in Xiongan New Area under complex and uncertain environment. Water Res. Hydropower. Eng. 2022, 53, 45–54. [Google Scholar]
  43. Zhang, Z.Y.; He, Y.H.; Tan, Q.; Chen, X.H. Water resources allocation model of urban ag-glomeration in Guangdong Hong Kong-Macao Greater Bay Area. J. Hydroeletr. Eng. 2022, 41, 31–43. [Google Scholar]
Figure 1. Conceptualized diagram of elements and processes of water resources systems.
Sustainability 17 03508 g001
Figure 2. Coupling process of the dualistic water cycle in water resources regulation systems.
Sustainability 17 03508 g002
Figure 3. Penalty coefficient regions under different schemes.
Sustainability 17 03508 g003
Figure 4. Calculation process of water resources in the model.
Sustainability 17 03508 g004
Figure 5. Yuanhe River Basin.
Sustainability 17 03508 g005
Figure 6. Main hydraulic network of the water resources in the Yuanhe River Basin.
Sustainability 17 03508 g006
Figure 7. Runoff series at Luxi station using VWMB from 1980 to 2006.
Sustainability 17 03508 g007
Figure 8. Comparison of COD values of (a) Shibei, (b) Kongmujiang, and (c) Hehuguan and NH3-N values of (d) Shibei between monthly observed and simulated values.
Sustainability 17 03508 g008aSustainability 17 03508 g008b
Figure 9. Water demand and water supply from (a) region and (b) sector.
Sustainability 17 03508 g009
Figure 10. Satisfaction degree of instream ecological flow at important sections before and after operation of large- and middle-sized reservoirs.
Sustainability 17 03508 g010
Figure 11. Water supply processes of Jiangkou Reservoir.
Sustainability 17 03508 g011
Figure 12. Spatial differences of water scarcity rates in the Yuanhe River Basin.
Sustainability 17 03508 g012
Table 1. Conceptual elements in water resources systems and their physical prototypes.
ElementTypeRepresented Physical Prototype
PointWater sourcesReservoir, diversion or pumping work, sewage treatment work
OutletSewage outlet, drainage outlet, terminal of flow
Water userWaterworks, enterprise, irrigate area, cross-section
LineDirected arcNatural river, water supply channel, sewage channel
AreaWater supply unitCongregation of water sources
Drainage unitCongregation of water outlets
Water use unitOff-stream unit or instream unit for water users
Table 2. Data sources used in this study.
TypeDataSpatial-Temporal ScaleSource
Geographical diversionAdministrative boundary, basin boundary, main rivers
  • County, township
  • Mainstream and 13 tributaries
Jiangxi Bureau of Surveying, Mapping, and Geoinformation, Hydrological Monitoring Centre of Jiangxi Province
Socio-economic statisticsPopulation, GDP, industrial added value
  • County, township
Statistical Yearbooks of Luxi, Yuanzhou, Fenyi Yushui, Zhangshu in 2018
Effective irrigation area, irrigation intake
  • Township
  • Yuanhuiqu Irrigation Area
Hydrological Yearbook of Jiangxi Province in 2018
Water supply projectsLocation, capacity of water supply, storage capacity
  • Township
  • Diversion works, pumping works, ponds, reservoirs
Location, characteristic water levels, stage–capacity curve, stage–discharge curve, operational rules
  • County, township
  • Four large-sized reservoirs
  • Twelve middle-sized reservoirs
Atlas of large and middle-sized reservoirs in Jiangxi Province
Runoff in and out of Jiangkou reservoir
  • 1959–2022
Operation Manual of Jiangkou Reservoir in 2022
Water use statisticsWater supply, water use
  • Living, industry, agriculture, environment
  • Diversion works, pumping works, ponds, and reservoirs
Water Resources Bulletin of Pingxiang, Yichun, Xinyu and Ji’an in 2018.
Coefficient of water consumption
  • Effective coefficient of irrigative water utilization, leakage percentage
  • Water consumption rate
Meteorology and hydrologyDaily data
  • Thirteen precipitation stations
  • two evaporation stations, one hydrologic station
  • 1980–2018
Hydrological Monitoring Centre of Jiangxi Province
Table 3. Results of simulated and statistical water use from districts.
Water Demand/108 m3Water Consumption/108 m3
Simulated ValueStatistical ValueRelated ErrorSimulated ValueStatistical ValueRelated Error
Luxi1.111.092.3%0.580.571.1%
Yuanzhou3.803.943.4%1.781.895.6%
Fengyi2.132.150.8%0.951.059.1%
Yushui5.485.785.2%2.342.454.6%
Zhangshu0.590.6610.4%0.310.349.0%
Yuanhuiqu2.802.841.4%1.401.421.4%
Total15.9216.463.3%7.367.724.6%
Table 4. Results of simulated and statistical water use from sectors.
Water Demand/108 m3Water Consumption/108 m3
Simulated ValueStatistical ValueRelated ErrorSimulated ValueStatistical ValueRelated Error
Living and Environment1.851.881.6%0.780.824.9%
Industry3.813.851.0%1.401.421.4%
Agriculture10.2610.734.4%5.185.485.5%
Total15.9216.463.3%7.367.724.7%
Table 5. Regulation schemes for the model.
SchemeReduction Ratio of Water SupplyReduction Ratio of Drainage ConcentrationDescription
CODNH3-N
0///Actual situation, namely, the reference scheme without any reduction ratio
12% for living, 8% for industry, 10% for agriculture, 10% for ecology and environment//Reduced water supply and normal drainage concentration
22% for living, 8% for industry, 10% for agriculture, 10% for ecology and environment4% for living, 4% for industry, 4% for agriculture4% for living, 4% for industry, 7% for agricultureReduced water supply and drainage concentration
34% for living, 9% for industry, 13% for agriculture, 14% for ecology and environment4% for living, 4% for industry, 4% for agriculture4% for living, 4% for industry, 7% for agricultureFurther reduced water supply and drainage concentration
44% for living, 9% for industry, 13% for agriculture, 14% for ecology and environment10% for living, 10% for industry, 10% for agriculture10% for living, 10% for industry, 10% for agricultureFurther reduced water supply and drainage concentration
54% for living, 9% for industry, 13% for agriculture, 14% for ecology and environment13% for living, 13% for industry, 13% for agriculture15% for living, 15% for industry, 15% for agricultureFurther reduced water supply and drainage concentration
64% for living, 9% for industry, 13% for agriculture, 14% for ecology and environment15% for living, 15% for industry, 15% for agriculture15% for living, 15% for industry, 15% for agricultureFurther reduced water supply and drainage concentration
Table 6. Comparison of results of water regulation under different schemes.
SchemeWater Quantity (108 m3)Water Quality (t)Objective Function
Water DemandWater SupplyWater ConsumptionWater DrainageWater ShortageCODNH3-NRSd
017.0516.55 (0.62)7.99 (0.62)8.560.5134,847.73136.554.55
117.0515.22 (0.61)7.35 (0.61)7.871.8333,487.53039.833.24
217.0515.26 (0.61)7.37 (0.61)7.891.7832,243.72879.815.37
317.0514.88 (0.60)6.58 (0.60)7.702.1532,012.32862.39.10
417.0514.92 (0.61)6.59 (0.61)7.722.1230,094.62739.47.87
517.0514.92 (0.60)6.59 (0.60)7.722.1229,096.72587.37.57
617.0514.92 (0.61)6.59 (0.61)7.732.1128,431.42587.37.59
Note: the outside water supply for Pingxiang City from Shankouyang Reservoir is shown in brackets.
Table 7. Summary of water regulation from regions.
RegionWater Quantity (108 m3)Water Quality (t)
Water DemandWater SupplyWater ConsumptionWater DrainageWater ShortageCODNH3-N
Luxi1.110.990.510.480.121991.1166.7
Yuanzhou4.013.451.611.840.565617.3640.3
Fengyi2.171.920.861.060.263242.9305.2
Yushui8.517.433.334.091.0816,921.11361.5
Zhangshu0.630.530.280.250.091324.3113.6
Total16.4314.326.597.722.1129,096.72587.3
Table 8. Summary of water regulation from sectors.
SectorWater Quantity (108 m3)Water Quality (t)
Water DemandWater SupplyWater ConsumptionWater DrainageWater ShortageCODNH3-N
Living1.491.390.530.860.103705.7316.7
Industrial3.873.521.302.220.3511,624.1819.3
Agricultural10.659.054.574.481.6113,609.01449.6
Ecological and environment 0.420.360.200.160.06157.91.6
Total16.4314.326.597.722.1129,096.72587.3
Disclaimer/Publisher’s Note: The statements, opinions and data contained in all publications are solely those of the individual author(s) and contributor(s) and not of MDPI and/or the editor(s). MDPI and/or the editor(s) disclaim responsibility for any injury to people or property resulting from any ideas, methods, instructions or products referred to in the content.

