1. Introduction
In recent years, escalating greenhouse gas emissions have triggered a series of climate crises [
1]. The United Nations Environment Programme (UNEP) warns that to achieve the Paris Agreement’s 1.5 °C temperature control target, global greenhouse gas emissions must be reduced by an additional 28–42% within the next seven years compared to current policy-mandated levels (
https://www.unep.org/resources/emissions-gap-report-2023 (accessed on 19 August 2024)). Confronted with these severe climate challenges, the mitigation potential of consumer behavior in low-carbon transitions cannot be overlooked. The Intergovernmental Panel on Climate Change (IPCC) demonstrates in “Climate Change 2022: Mitigation of Climate Change” (
https://www.ipcc.ch/report/ar6/wg3/ (accessed on 19 August 2024)) that transforming consumption patterns could reduce greenhouse gas emissions by 40–70% by 2050. The report of the 20th National Congress of the Communist Party of China explicitly emphasizes the need to drive the green transformation of production methods through green consumption. However, in reality, consumers are unable to access carbon emission information about products, making it difficult to apply low-carbon consumption concepts in actual purchasing decisions. To address this issue, the carbon labeling system has emerged. Carbon labels are a type of eco-label affixed to product packaging, designed to inform consumers about undesirable outputs (primarily CO
2) throughout the product’s lifecycle, either through numerical data or commitments. This system aims to encourage enterprises to adopt greener production practices and promote low-carbon consumption among the residents [
2]. Compared to other eco-labels, carbon labels place greater emphasis on comparability. Since the United Kingdom introduced the world’s first carbon reduction label in 2007, other developed countries, including Germany, Japan, and the United States, have launched their own national carbon labeling systems. As of 2023, more than 50 countries and regions worldwide have implemented carbon labeling schemes [
3]. Although still in its early stages, carbon labeling has already demonstrated significant benefits in enhancing consumer environmental awareness, increasing corporate profitability, improving social welfare, and boosting the international competitiveness of products [
4].
However, carbon label evaluation and labeling standards have yet to be unified globally. The same category of products may display different carbon reduction information under different carbon labels, affecting the effectiveness of consumer decision-making. Many countries have adopted voluntary carbon reduction agreement systems, where third-party organizations assess products or enterprises based on internationally recognized standards such as PAS 2050 (
http://www.carbonconstruct.com/pdf/pas_2050.pdf (accessed on 21 September 2024)), ISO 14067 (
https://www.iso.org/standard/71206.html (accessed on 21 September 2024)), and the GHG Protocol (
https://ghgprotocol.org/product-standard (accessed on 21 September 2024)). The results of these assessments are presented as quantified environmental claims in the carbon labeling field, conveying specific carbon footprint information of products or companies to consumers. Examples include the UK’s Verified CO
2 Footprint Label and Japan’s Carbon Footprint Mark. Meanwhile, under the dual pressures of emission reduction costs and industry competition, some enterprises, due to information asymmetry, opt for first-party declarations that align with their own emission reduction capabilities, emphasizing positive attributes of the company or product. These declarations do not provide numerical carbon footprint data and are instead expressed in qualitative and descriptive forms on carbon labels [
5], which may lead to consumer confusion. As a result, they are referred to as ambiguous labels [
6], such as France’s Casino Carbon Index and the U.S. Timberland Green Index.
On the other hand, different product markets and varying consumer preferences give rise to diverse competitive dynamics, leading to significant differences in corporate carbon reduction strategies. In markets where carbon labels are implemented, corporate decision-making may be influenced by both internal and external factors. Internal factors primarily include production and emission reduction costs, as well as the brand value of products. External factors encompass the company’s market share, the informational value conveyed by carbon labels to consumers, and the competitive environment the company faces, among others. For instance, among the more than 50 carbon-labeled products certified by the UK’s Carbon Trust, some belong to oligopolistic markets dominated by a few leading firms, such as the electronics and electrical appliances market (e.g., LG Electronics), the semiconductor market (e.g., Samsung), and the energy market (e.g., British Gas). Meanwhile, other products face more intense monopolistic competition, such as those in the food and beverage market (e.g., Danone, Nestlé), the agricultural market (e.g., Monaghan Mushrooms, Manor Farms), and the furniture market (e.g., Camden Windows). In oligopolistic markets, product pricing is significantly influenced by market leaders, and companies focus more on enhancing the green attributes and innovation capabilities of their products. For example, Tetra Pak introduced a new type of stainless steel material that reduced the carbon footprint of raw materials by 93%, while LG Electronics utilized advanced technologies to improve product recyclability and optimize carbon reduction efficiency in the recycling process. In monopolistic competition markets, where individual firms have limited influence on market prices, businesses prioritize cost control in the carbon reduction process. For instance, Accolade Wines and Monaghan Mushrooms reduced carbon emissions during transportation by minimizing product packaging weight and shortening transportation distances, respectively.
By adopting carbon labels, companies not only achieve environmental benefits but also create a price premium due to the enhanced green quality of their products. As a well-known electric two-wheeler manufacturer in China, Luyuan held a 4.2% market share in 2022, on par with the Sunra brand, positioning it in the industry’s second tier. The Luyuan TDT2093Z electric bicycle, after verification and assessment by a third-party institution, received China’s first carbon label certification for an electric bicycle product in 2022 (
https://www.tanbiaoqian.org.cn/detail-22 (accessed on 14 February 2025)). This model is benchmarked against the Sunra TDT9452Z electric bicycle in terms of technical specifications, with market prices of USD 543.75 and USD 452.25, respectively. Considering the additional carbon reduction costs associated with TDT2093Z’s liquid-cooled motor, its price premium over the TDT9452Z reaches USD 31.67. In terms of emission reduction benefits, the lifecycle carbon emissions of the TDT2093Z are approximately 725.7 kg CO
2, achieving a 38.4% reduction compared to the average lifecycle emissions of 1177.9 kg CO
2 for electric bicycles of the same power level, demonstrating significant environmental advantages.
Faced with differentiated standards and different product markets, China issued the “Opinions on Establishing a Unified Green Product Standard, Certification, and Labeling System” (
https://www.gov.cn/zhengce/content/2016-12/07/content_5144554.htm (accessed on 14 April 2024)) in 2016, providing guidance for the development of a green product standard system. As of 13 November 2023, China issued the “Guidelines on Accelerating the Establishment of a Product Carbon Footprint Management System.” (
https://www.gov.cn/zhengce/zhengceku/202311/content_6917087.htm (accessed on 14 April 2024)) This document explicitly outlined the development goals for establishing national carbon footprint accounting standards. Subsequently, on 20 March 2025, the “General Implementation Rules for Product Carbon Footprint Label Certification (Trial)” (
https://www.samr.gov.cn/xw/zj/art/2025/art_a7ac27c1282747b3841140bb9081df42.html (accessed on 26 March 2025)) was released, marking a significant step toward building a unified national product carbon labeling certification system. However, China’s carbon labeling management system development started relatively late. As of 2025, the country’s carbon footprint accounting standards have only been incorporated into certain group standards, with no well-established carbon labeling system or comprehensive carbon footprint accounting standards and methodologies being fully implemented yet.
Meanwhile, countries such as the UK, US, France, and Japan, which were early adopters of carbon labeling, introduced their respective representative carbon labels around 2008. Carbon labeling in these nations has now reached a high level of maturity and demonstrated significant returns. The UK pioneered the concept of a low-carbon economy as early as 2003. Its 2021 national strategy document “Net Zero Strategy: Build Back Greener” (
https://www.gov.uk/government/publications/net-zero-strategy (accessed on 5 January 2024)) repeatedly emphasized the role of carbon labeling in achieving “net-zero emissions.” By 2025, the Carbon Trust had launched its fifth-generation carbon label while providing certification services to global companies, helping relevant enterprises reduce product carbon emissions by 10% annually. A series of greenhouse gas accounting standards developed with participation from the British Standards Institution and the Carbon Trust are now recognized as international norms for carbon label accounting. France holds the distinction of being the first nation to codify carbon labeling into national legislation. This pioneering effort began with the 2010 “Grenelle II Act” (
https://climate-laws.org/document/grenelle-ii_9b8a (accessed on 5 January 2024)), which mandated comprehensive disclosure of full life-cycle carbon data for all commercial products. Building on this foundation, the 2018 “Low-Carbon Label Decree” (
https://label-bas-carbone.ecologie.gouv.fr (accessed on 5 January 2024)) implemented operational mechanisms that achieved over 15% emission reductions in participating enterprises through standardized carbon footprint accounting and production process optimization.
Addressing corporate challenges in the green transition, examining firms’ strategic green game behaviors has emerged as a prominent research focus [
7,
8]. In this paper, we develop a game model to explore the choice of carbon labels and low-carbon production decisions of green firms under different market scenarios. We delve deeper into the impact of label ambiguity, consumer environmental awareness (CEA), and other factors of the optimal decisions of heterogeneous manufacturers. These key factors operate through the following distinct mechanisms: (1) label ambiguity and CEA jointly determine the informational clarity of carbon labels and the consumers’ perception of such information, ultimately shaping the labels’ informational value and consequent product demand; (2) the market structure fundamentally constrains firms’ pricing flexibility, thereby conditioning their carbon abatement decisions. By systematically examining these influential factors, our research offers practical insights for green manufacturers operating in diverse product market environments.
Specifically, this paper provides new insights into the following questions:
- (1)
What is the additional value of adopting product carbon labels for green firms? Under profit maximization conditions, what type of carbon label will green firms choose, and is this choice beneficial for non-green firms and the overall social welfare?
- (2)
How can the heterogeneity of different types of carbon labels be measured? How does this characteristic affect the choice of carbon labels and social performance?
- (3)
Under different market competition conditions, how should the above questions be answered?
To answer these questions, we set multiple scenarios and examine the green firms’ carbon label selection, pricing, and emission reduction decisions when facing single or multiple competing products. In this set up, green firms are influenced by both the environmental benefits of carbon labels and the substitution effects with competing products. When green firms face a single competing product, the scenario aligns with a Stackelberg game, where the green firm acts as the follower, while the non-green product firm acts as the leader [
9]. When green firms face multiple competing enterprises, their decision-making sequence is parallel. After solving for the optimal decisions in various scenarios, we analyze the impact of key parameters on decision variables and performance functions. Furthermore, by introducing a baseline scenario, we estimate the corporate and social value of green firms adopting carbon labels and conduct a comparative analysis of performance results across different scenarios.
The remainder of the paper is structured as follows:
Section 2 provides a literature review. In
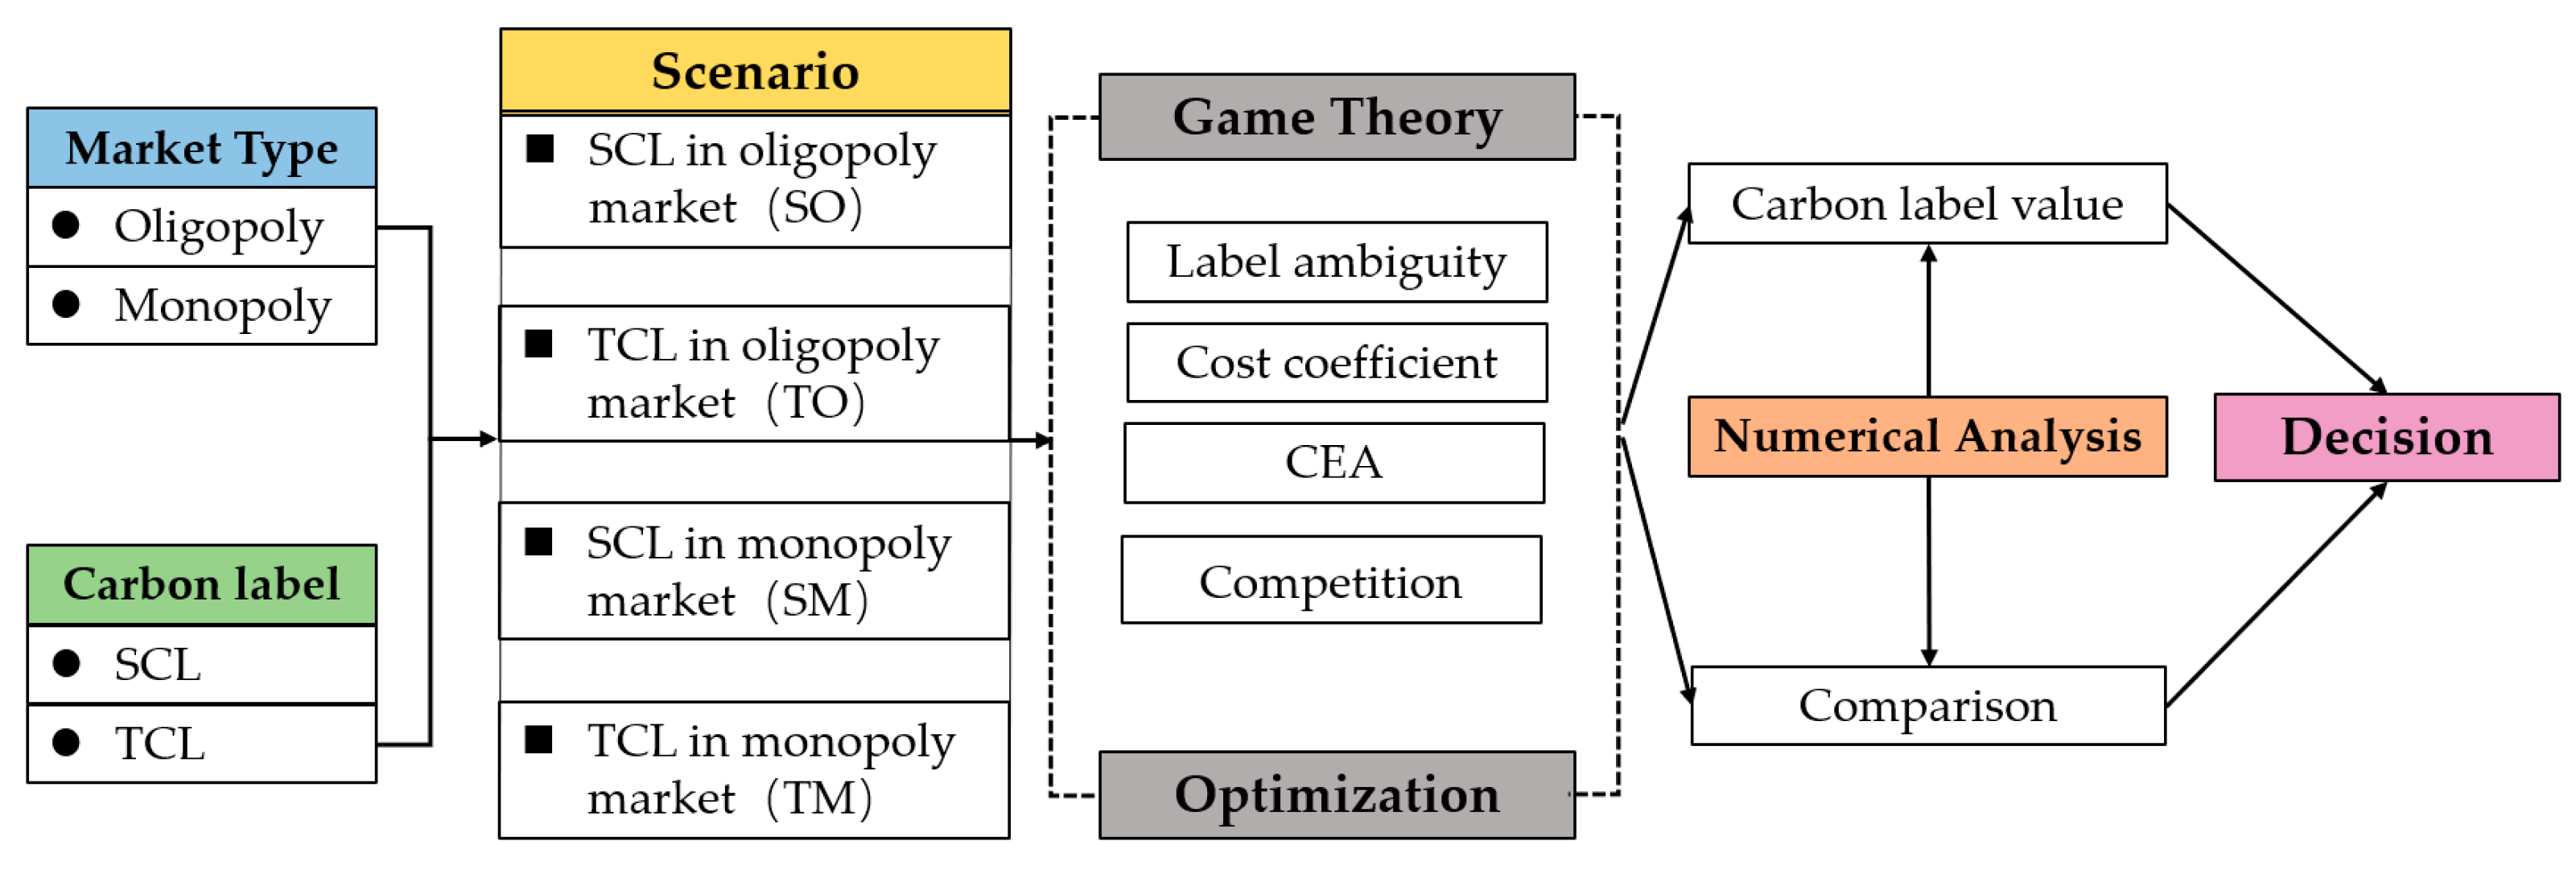
Section 3, we describe the research problem in detail, construct the model based on our description and assumptions, set four scenarios, and outline the research framework.
Section 4 calculates the optimal decisions under multiple scenarios and analyzes the impact of key parameters on decisions.
Section 5 introduces case studies and a benchmark scenario to calculate the social value of carbon labels and compares social performance across multiple scenarios. Finally,
Section 6 concludes the study.
4. Model Analyses
4.1. Scenario SO: SCL in an Oligopoly Market
In Scenario SO, the market consists of a single non-green product firm and a green firm, both offering products with similar uses and performance. With the introduction of carbon-labeled products, consumers are divided into two groups: those who only purchase non-green products and those who exclusively buy green products. The non-green firm holds a dominant market position and sets its product price first, while the green firm adjusts its pricing later based on market conditions and profit maximization principles. In this scenario, the green firm opts for a higher SCL with label ambiguity
. During the pricing phase, firms determine their product’s carbon emissions based on the available market information and profit maximization goals, using this as the carbon reduction standard for the carbon label. Given this context, the profit functions of the green and non-green firms are represented by Equations (9) and (10):
Lemma 1. The condition under which a green firm chooses SCL in an oligopoly market is .
The proof of Lemma 1 is included in the proof of Proposition 1. Lemma 1 indicates that when the carbon reduction coefficient and label ambiguity are high and consumer environmental awareness is low, the non-green firm may allow the green firm to enter the market using SCL.
The game sequence in Scenario SO is as follows: the non-green firm, possessing more market information, first determines the price of the non-green product under the profit-maximization objective. Then, the green firm simultaneously determines the product price and carbon reduction level based on profit maximization principles. The game model is solved using backward induction, and the equilibrium decisions are presented in Proposition 1.
Proposition 1. Define . When the green firm chooses the SCL strategy in an oligopoly market, the equilibrium solutions for all parties are: The proof of Proposition 1 can be found in the
Appendix A. By substituting the equilibrium solutions from Proposition 1 into the profit functions, the firms’ profits and SW under Scenario SO can be obtained. Taking the partial derivatives with respect to CEA (
), carbon reduction cost coefficient (
), and carbon label ambiguity (
), we obtain the following results:
As carbon label ambiguity and carbon reduction costs increase, profits (), and SW () all decrease. As consumer environmental awareness and product substitutability increase, they all increase.
Corollary 1 implies that for both firms, carbon label ambiguity and carbon reduction costs negatively impact their profits. In an environment promoting green consumption, increased label ambiguity reduces the consumers’ ability to obtain product carbon emission information, lowering the green purchasing behavior of environmentally conscious consumers. This, in turn, reduces the marginal benefits of carbon reduction measures and results in a decline in the price of carbon-labeled products under the new market equilibrium. Under the SCL scenario, higher carbon reduction costs drive firms to set lower carbon reduction standards, reducing product greenness and decreasing consumer demand. With rising consumer environmental awareness, carbon labels receive more attention, increasing the marginal benefits of firms’ carbon reduction efforts and encouraging them to reduce product carbon emissions. Environmentally conscious consumers are more inclined to purchase green products, which, under market-clearing conditions, drives up product prices. Product substitutability implies that changes in the price of carbon-labeled products affect the demand for non-green products, leading to a direct impact on the price of non-green products. Enhancing product substitutability diversifies purchasing channels, increases the demand for similar products, and positively impacts overall economic efficiency and SW.
Under this scenario, green manufacturers should ensure the clarity and accuracy of carbon label information while enhancing consumer awareness of carbon labels and green products through educational and promotional campaigns. This approach strengthens consumer trust and purchase intention toward eco-friendly products. This way, enterprises can achieve a win-win outcome that balances economic benefits with environmental performance, thereby driving the entire market toward more sustainable development.
4.2. Scenario TO: TCL in an Oligopoly Market
Similarly to Scenario SO, Scenario TO consists of a single non-green product firm and a green firm. In this scenario, the green firm selects a lower label ambiguity
under TCL. The objective functions for firms and the industry are given by Equations (9), (16), and (17):
Lemma 2. The condition under which a green firm chooses TCL in an oligopoly market is: .
The proof of Lemma 2 is included in the proof of Proposition 2. The game sequence in Scenario TO is as follows: the non-green firm, possessing more market information, first determines the price of the non-green product , while the industry sets the carbon reduction standard based on its optimization objective. Then, the green firm sets the carbon-labeled product price according to the given industry standard. The game model is solved using backward induction, and the equilibrium decisions are presented in Proposition 2.
Proposition 2. Let , . Under an oligopolistic competition market, the equilibrium solutions when green firms choose TCL are as follows: The proof of Proposition 2 can be found in
Appendix A. By substituting the equilibrium solutions from Proposition 2 into the profit function, we can derive the firms’ profits and SW under Scenario TO. Taking the partial derivatives with respect to the relevant parameters, we obtain the following results.
Corollary 2.1. - (1)
When
, the following relationships occur:
Performance indicators () decrease with the increasing label ambiguity () and increase with the rising consumer environmental awareness ().
- (2)
When
, the following relationships occur:
Performance indicators () increase with the rising label ambiguity () and decrease with the increasing consumer environmental awareness ().
Corollary 2.2. - (1)
When
, the following relationships occur:
Performance indicators () decrease with the increasing carbon reduction cost rate () and increase with the rising product substitution rate ().
- (2)
When
, the following relationships occur:
With the increase of carbon emission reduction cost rate (), performance indicators () will all increase, while the profit of green firms ) will decrease; as the product substitution rate () increases, performance indicators () will decrease, while the profit of green firms ) will increase.
Corollaries 2.1 and 2.2 indicate that when the product substitution rate is low, carbon label ambiguity and the carbon reduction cost coefficient negatively impact both firms’ decision variables and performance indicators. Conversely, consumer environmental awareness and product substitutability positively influence these variables. Similarly to Corollary 1, carbon label ambiguity and the carbon reduction cost coefficient influence consumer perception of product environmental attributes and firms’ emission reduction costs, which, through market competition, shape overall decisions and performance. Additionally, product competition increases the market demand for similar products, promoting overall economic benefits and SW. However, unlike Corollary 1, consumer environmental awareness and label ambiguity affect oligopolistic firms’ decisions at the initial stage, which further influence the entire decision chain through market competition and setting standards for green firms. Moreover, at the initial decision stage, non-green firms, upon understanding the carbon reduction cost information of green firms, adjust industry-wide carbon reduction standards under the objective of maximizing industry goals.
When product substitutability () is high and the carbon reduction coefficient () is extremely low, the situation becomes subtle. A lower carbon reduction coefficient reduces green firms’ costs and, given product substitutability, promotes green product demand. Setting a higher carbon label ambiguity can balance the market demand for both product types, achieving simultaneous growth in demand and price under highly competitive conditions. As consumer environmental awareness increases, market preference for carbon-labeled products grows, squeezing the profits of dominant non-green products and reducing overall industry performance. Intense market competition forces leading non-green firms to respond by setting higher industry carbon reduction standards, which not only increases the green firms’ emission reduction costs when the carbon reduction coefficient rises, but also compresses their overall profits. Changes in product substitution rate () lead to opposite effects of carbon reduction coefficient changes, as demand shifts due to substitution allow carbon-labeled products to gain market share, increasing their profits. However, this market dynamic does not achieve Pareto optimality.
Enterprises should achieve a balance between economic and environmental benefits during green transition by (1) optimizing carbon label design, (2) reducing carbon abatement costs, (3) leveraging CEA, and (4) dynamically adjusting industry emission reduction standards. Concurrently, under this scenario, governments and industry associations should play a coordinating role in steering the market toward more sustainable development while preventing efficiency losses caused by excessive competition.
4.3. Scenario SM: SCL in a Monopolistic Competition Market
In Scenario SM, the market consists of
non-green firms and one green firm. The market structure is that of monopolistic competition, where the green firm enters the market by choosing an SCL with a relatively high label ambiguity
. Compared to Scenario SO, non-green firms and the green firm are on equal footing and make decisions simultaneously. The profit functions of the green firm and non-green firm iii are given by Equations (23) and (24):
Since satisfies the second-order condition , and when satisfies the condition for an extremum , there exist optimal values for and .
As there is no game sequence, the model problem is reduced to an optimization problem for
decision-making entities. Under the second-order condition, solving the system of
first-order conditions:
yields
equilibrium solutions, as presented in Proposition 3.
Proposition 3. Let , . Under monopolistic competition, the equilibrium decisions when the green firm selects SCL are as follows: The proof of Proposition 3 can be found in
Appendix A. By calculating the partial derivatives of the parameters based on the above results, we obtain Corollary 3.
Corollary 3. - (1)
When
, i.e.,
then
- (2)
When
, then
Corollary 3 indicates that when the number of non-green firms () is large and product substitutability () is low, approaches the second-order condition of . In this case, consumer environmental awareness () positively influences all decision variables, whereas carbon label ambiguity () has the opposite effect. This is because, as the number of firms increases and product homogeneity decreases, carbon-labeled products more prominently display their environmental advantages, leading to increased green product purchases under rising environmental awareness. Meanwhile, due to substitutability, non-green product sales also rise. A high label ambiguity reduces consumers’ perception of a product’s environmental benefits, weakening the overall market impact of carbon labeling. When is small and is large, ensuring requires a low carbon reduction coefficient (). In this case, higher carbon label ambiguity () promotes all decision variables, while consumer environmental awareness (τ) has a suppressing effect. This is because lower mitigation costs and high substitutability cause excessive demand shifts toward labeled products, and increasing label ambiguity facilitates optimal resource allocation and market growth.
The findings under this scenario reveal that developing effective green product strategies requires enterprises to holistically evaluate three critical dimensions: the competitive landscape, degree of product substitutability, and CEA in relation to carbon label transparency. In fragmented markets with strong product differentiation (marked by numerous conventional competitors and low substitutability), firms should strategically leverage rising ecological consciousness by emphasizing their products’ environmental benefits while minimizing label ambiguity to enhance market positioning. Conversely, in concentrated markets with commoditized offerings (characterized by few non-green producers and high substitutability), intentionally maintaining moderate carbon label ambiguity can prevent market distortions caused by excessive demand polarization, thereby improving resource allocation efficiency. This necessitates adaptive carbon labeling strategies where managers dynamically calibrate information disclosure levels according to specific market structures. From a regulatory perspective, policymakers should implement context-sensitive governance frameworks that maintain the delicate balance between carbon labels’ market guidance function and competitive neutrality across diverse industrial environments.
4.4. Scenario TM: TCL in a Monopolistic Competition Market
In Scenario TM, the market consists of
n non-green firms and one green firm. The green firm chooses to enter the market with a transparent carbon label (TCL), where the label ambiguity is in the range of
. The carbon reduction standard is determined by the industry based on a profit-maximization principle. The objective functions of firms and the industry are given by Equations (24), (30), and (31):
The game sequence in Scenario TM is as follows: the industry first determines the carbon label’s emission reduction standard based on the principle of profit maximization, after which the green firm simultaneously sets prices along with the
non-green firms. Using backward induction, we obtain the equilibrium pricing for
n + 1 firms and the optimal carbon reduction standard,
. Given that
and
satisfy the second-order condition
, the condition for
to satisfy the second-order condition is as follows:
Under this condition, , and each attain a maximum with respect to , and , respectively. Since the resulting expressions are complex, this paper presents only the equilibrium solution for the carbon reduction standard in Proposition 4.
Proposition 4. Note that . under the monopolistic competition market, the optimal carbon emission reduction standard for green firms to choose TCL is as follows:
The proof of Proposition 4 is provided in
Appendix A. By taking the partial derivative of
with respect to the parameter, we obtain Corollary 4.
Corollary 4. In Scenario TM, the impact of relevant parameters on the optimal carbon reduction standard is as follows: Corollary 4 indicates that in Scenario TM, the industry’s carbon reduction standard increases as the consumers’ environmental awareness strengthens, but decreases as label ambiguity rises. This is because an increased environmental awareness boosts demand for carbon-labeled products, driving up the total market profits, whereas greater label ambiguity has the opposite effect. The corollary also shows that higher production costs of any non-green product, a greater market share, and a larger potential market for carbon-labeled products all encourage a higher carbon reduction standard. However, when the production cost of carbon-labeled products is high, the industry adopts a lower carbon reduction standard.
The results of this scenario indicate that enhancing the CEA can drive the elevation of industry carbon emission reduction standards. Therefore, both enterprises and policymakers should intensify environmental advocacy, guiding consumers to prioritize carbon-labeled products. This approach increases the market demand for green products and subsequently promotes an industry-wide carbon reduction. However, if the production costs of carbon-labeled products become excessively high, the industry may lower its emission reduction standards. Consequently, under the TM scenario, green manufacturers should focus on innovating green production technologies and controlling costs to prevent high expenses from undermining the overall industry momentum for emission reduction.
5. Numerical Analyses
The previous section analyzed the optimal decisions of stakeholders in various scenarios using decision optimization methods. Due to the complexity of the computational results, it is difficult to compare the model outcomes. Additionally, since the relevant parameters are challenging to obtain from real-world cases, this section adopts the common approach used in most optimization studies, which involves assigning specific values to parameters to determine their interrelationships. This study references the parameter values for market potential, production costs, and competition coefficients from Zhou et al. [
34], whose research, like ours, distinguishes low-carbon markets and whose parameter assignments align well with real-world carbon labeling market cases (e.g., in an oligopoly market, LG Electronics’ carbon-labeled products account for nearly half of the market potential, while in a monopolistic market, Wyke Farms cheese holds approximately a quarter of the market share). Considering that consumers have a high level of awareness and a high willingness to purchase carbon-labeled products [
13], we set a relatively high value for CEA within a reasonable range while making a conservative estimate for the emission reduction cost coefficient. Under the assumption that the parameter settings hold, the parameters are set as follows:
5.1. System Equilibrium
In this subsection, we estimate the product profits and social performance resulting from the carbon labeling system in an equilibrium state under optimal decision-making. To achieve this, we first introduce two benchmark scenarios: Scenario BO, where green firms do not adopt carbon labels in an oligopoly market, and Scenario BM, where green firms do not adopt carbon labels in a monopolistic competitive market.
Since firms cannot showcase their carbon reduction efforts to consumers through carbon labels, products cannot demonstrate their environmental benefits, and achieving emission reductions requires higher costs. Therefore, it is easy to infer that in the benchmark scenarios BO and BM, the emission reduction efforts of green firms are zero. By applying analytical methods similar to Propositions 1–3, we derive the equilibrium decisions of the firms as follows:
By substituting the parameters into Propositions 1–4 and Equations (32)–(34), we obtain the equilibrium prices of products and the carbon reduction levels of green firms under equilibrium conditions, which further allow us to derive firm profits and social welfare performance. The results are shown in
Table 3 below.
The results indicate that within the same market environment, the introduction of carbon labels increases the pricing and profitability of green firms’ products. Compared to the benchmark scenarios where carbon labels are not adopted, the adoption of SCLs increases the product price of green firms by 11.5% and their profits by 25.2% in an oligopoly market. This growth is even more pronounced in a monopolistic competitive market, with increases of 22.9% and 38.5%, respectively. Compared to SCLs, green firms adopting TCLs achieve even higher product pricing and profits in both market environments. In an oligopoly market, green firms’ profits under TCLs exceed those under SCLs by 40.8%, while in a monopolistic competitive market, the profit difference is 33.8%. In this case, green firms are also more willing to implement high-quality carbon reductions, with emission reductions increasing by 175% and 172% in the two market types, respectively. From an environmental perspective, TCLs are more beneficial for environmental improvement.
Additionally, due to price transmission in the market, non-green firms that do not participate in the carbon labeling program are also affected in terms of product prices and profits when the carbon labeling system is introduced. In an oligopoly market, the product prices and profits of non-green firms also increase when green firms adopt carbon labels, though the growth is significantly smaller than that of green firms. However, in a monopolistic market, adopting SCLs results in a slight increase in non-green firms’ profits, but when green firms adopt the TCL scheme, the prices and profits of non-green firms drop sharply. This suggests that after losing the profit-controlled leader-follower relationship, the economic benefits of carbon labels provide a stronger incentive for industry-wide adoption of green transformation.
For social welfare (SW), TCLs contribute more to SW growth, and compared to a monopolistic market, choosing TCLs in an oligopoly market is more beneficial for SW improvement. Furthermore, although the profits of non-green firms decline, the SW in Scenario TM remains higher than in the benchmark scenarios. The reason is that in a monopolistic market, consumers are more price-sensitive, and when all product prices increase, demand fluctuations are greater than those observed in an oligopoly scenario.
5.2. Carbon Label Valuation Under Different Market Structures
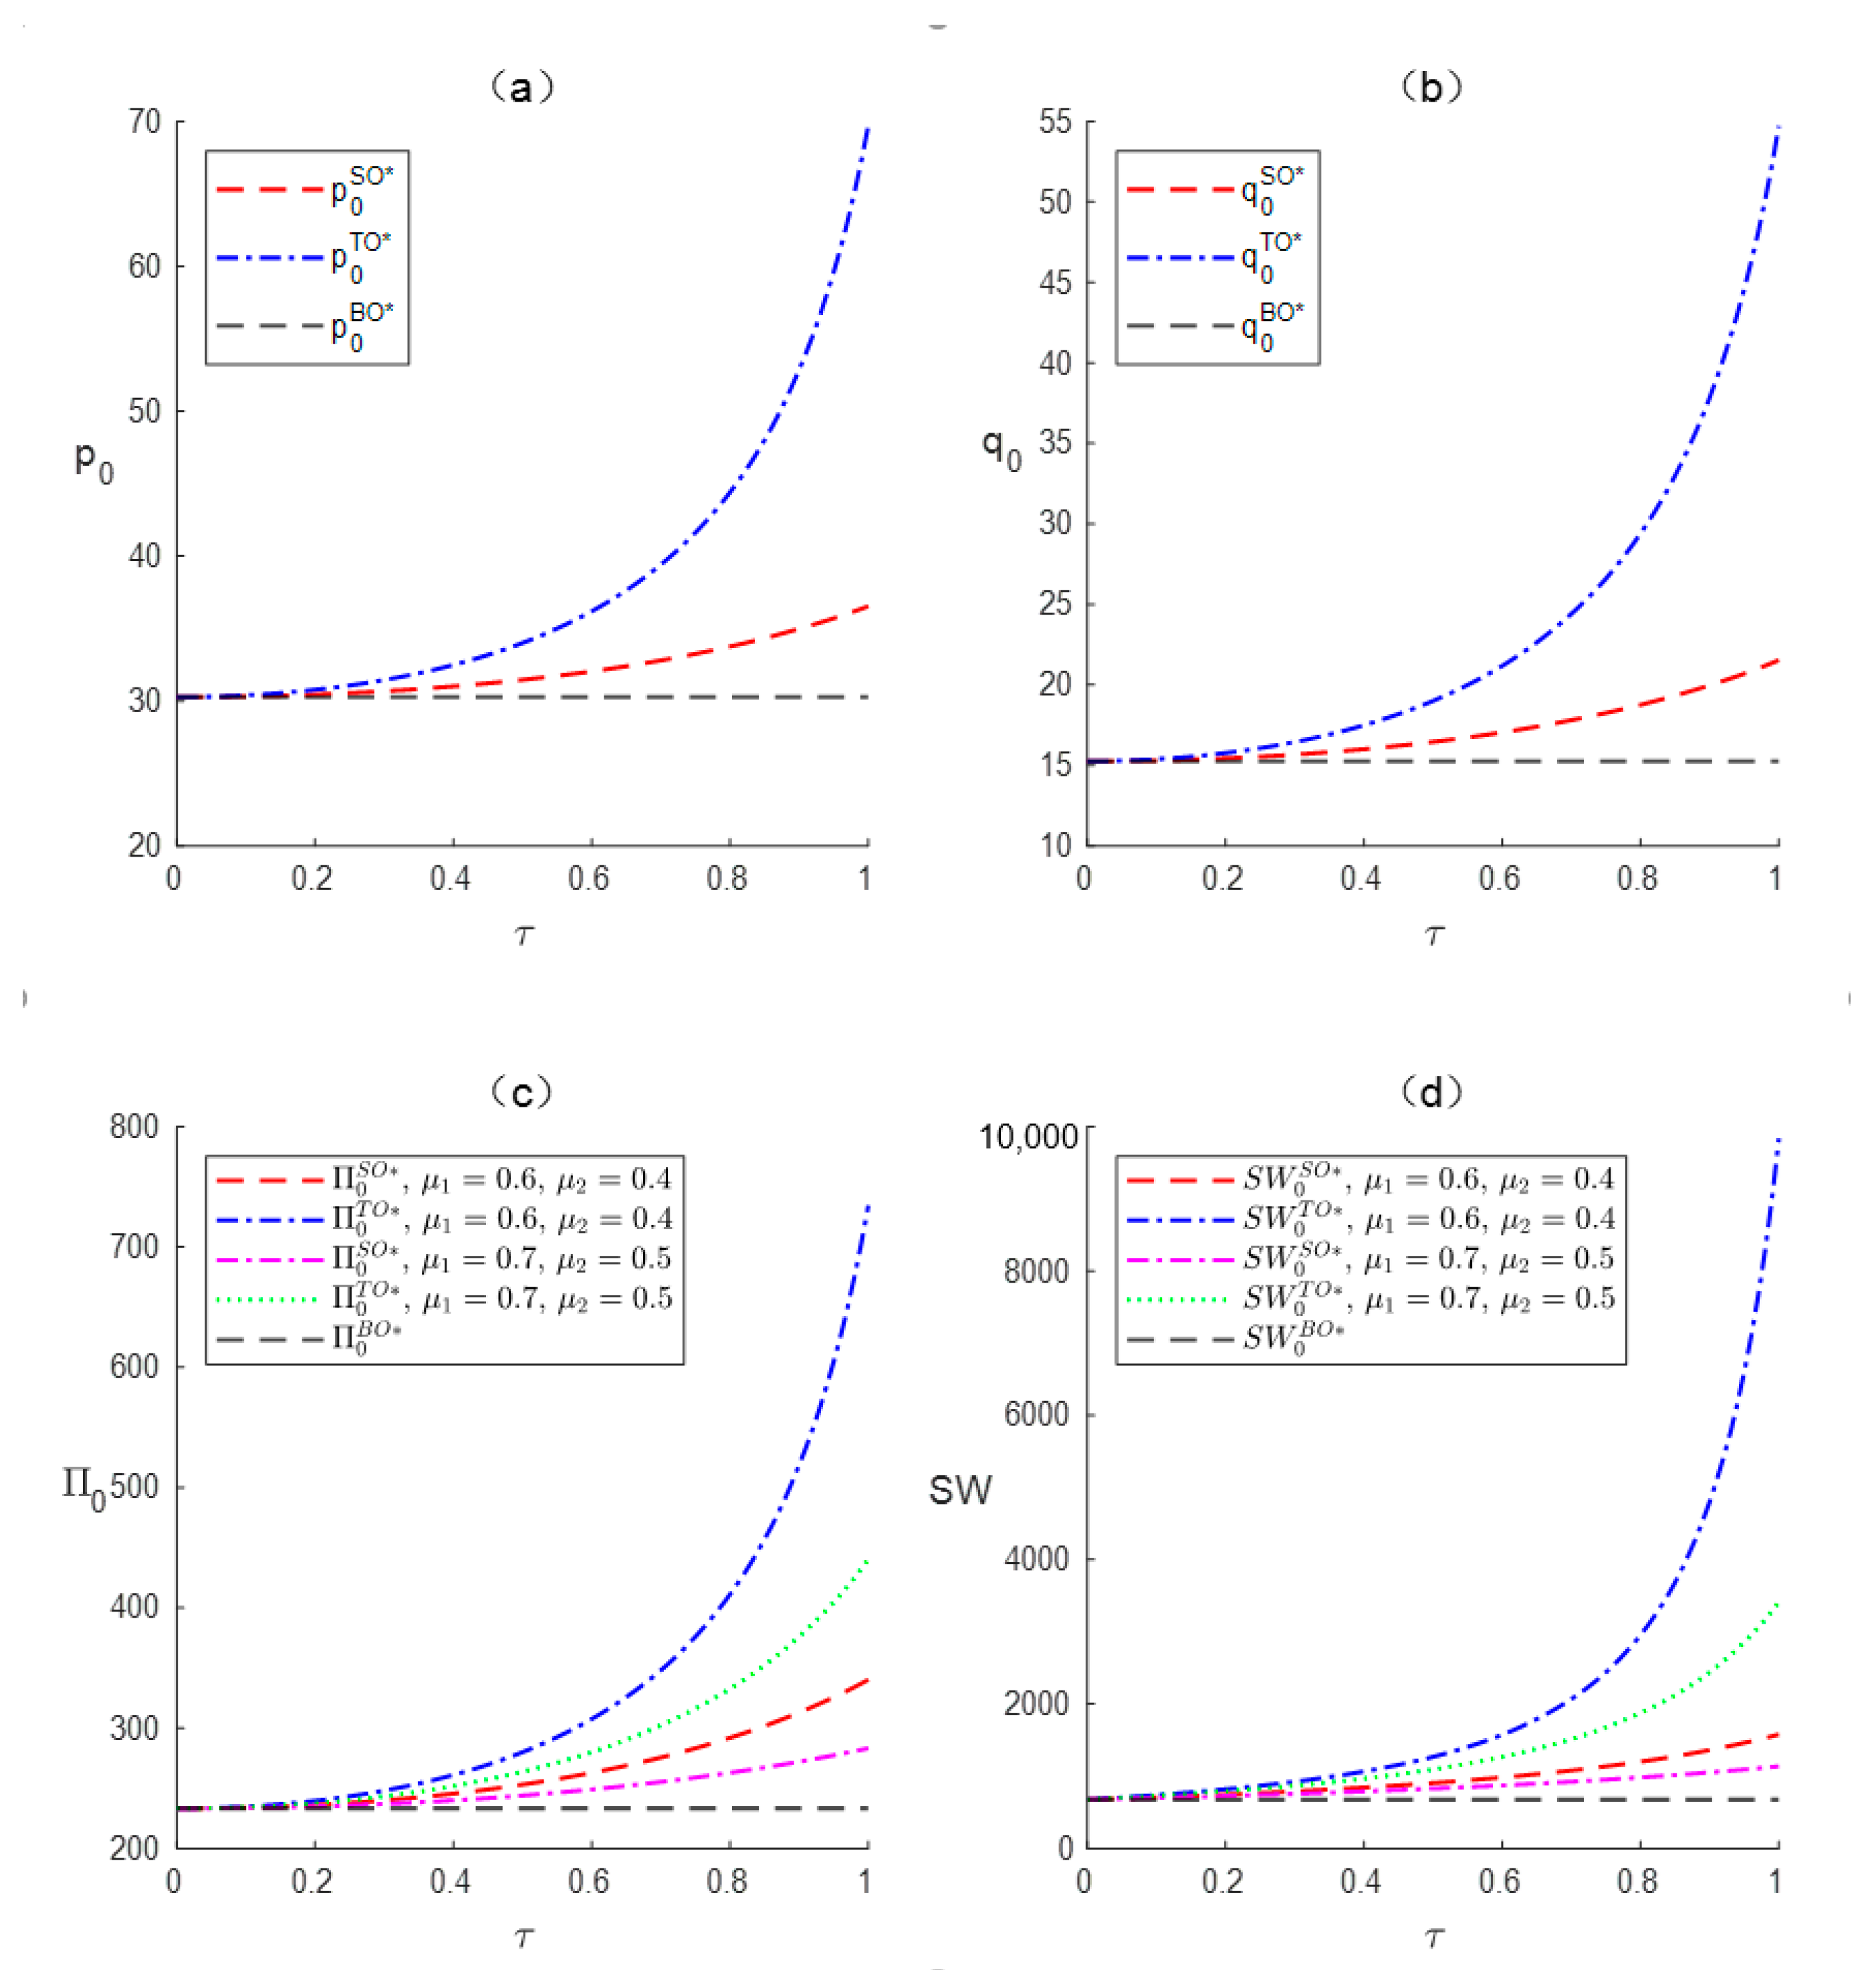
Figure 3 illustrates the dynamic trends of the equilibrium pricing, product demand, product profit, and social welfare of green firms under an oligopolistic market (i.e., scenarios SO, TO, BO) as CEA and carbon label ambiguity vary. The results show that regardless of the carbon label chosen, green firms can achieve increases in product pricing, profits, and overall social welfare. In an oligopolistic market, there is no clear negative correlation between price and demand. As CEA increases, pricing and demand rise simultaneously. Compared to theoretical predictions under equilibrium conditions, the figure more intuitively demonstrates the competitive advantage of TCLs over SCLs in an oligopolistic market. When CEA is relatively high, choosing TCLs can lead to product demand and pricing several times higher than when choosing SCLs, resulting in significantly greater profits. This further highlights the critical role of CEA in green marketing—higher CEA may drive exponential profit growth for green firms, while an excessively low CEA may cause low-carbon strategies to fail. In
Figure 3c,d, we introduce carbon label ambiguity as an additional comparison dimension based on the CEA variable. When the ambiguity of SCLs is higher than that of TCLs, increasing the ambiguity of both labels leads to a decline in overall performance. Additionally, under high-CEA conditions, changes in TCL ambiguity have a more pronounced impact on performance. Notably, when green firms choose SCLs, ambiguity has a relatively minor effect on performance, as SCLs rely more on the firm’s own profit dominance, whereas TCLs are driven by market standards.
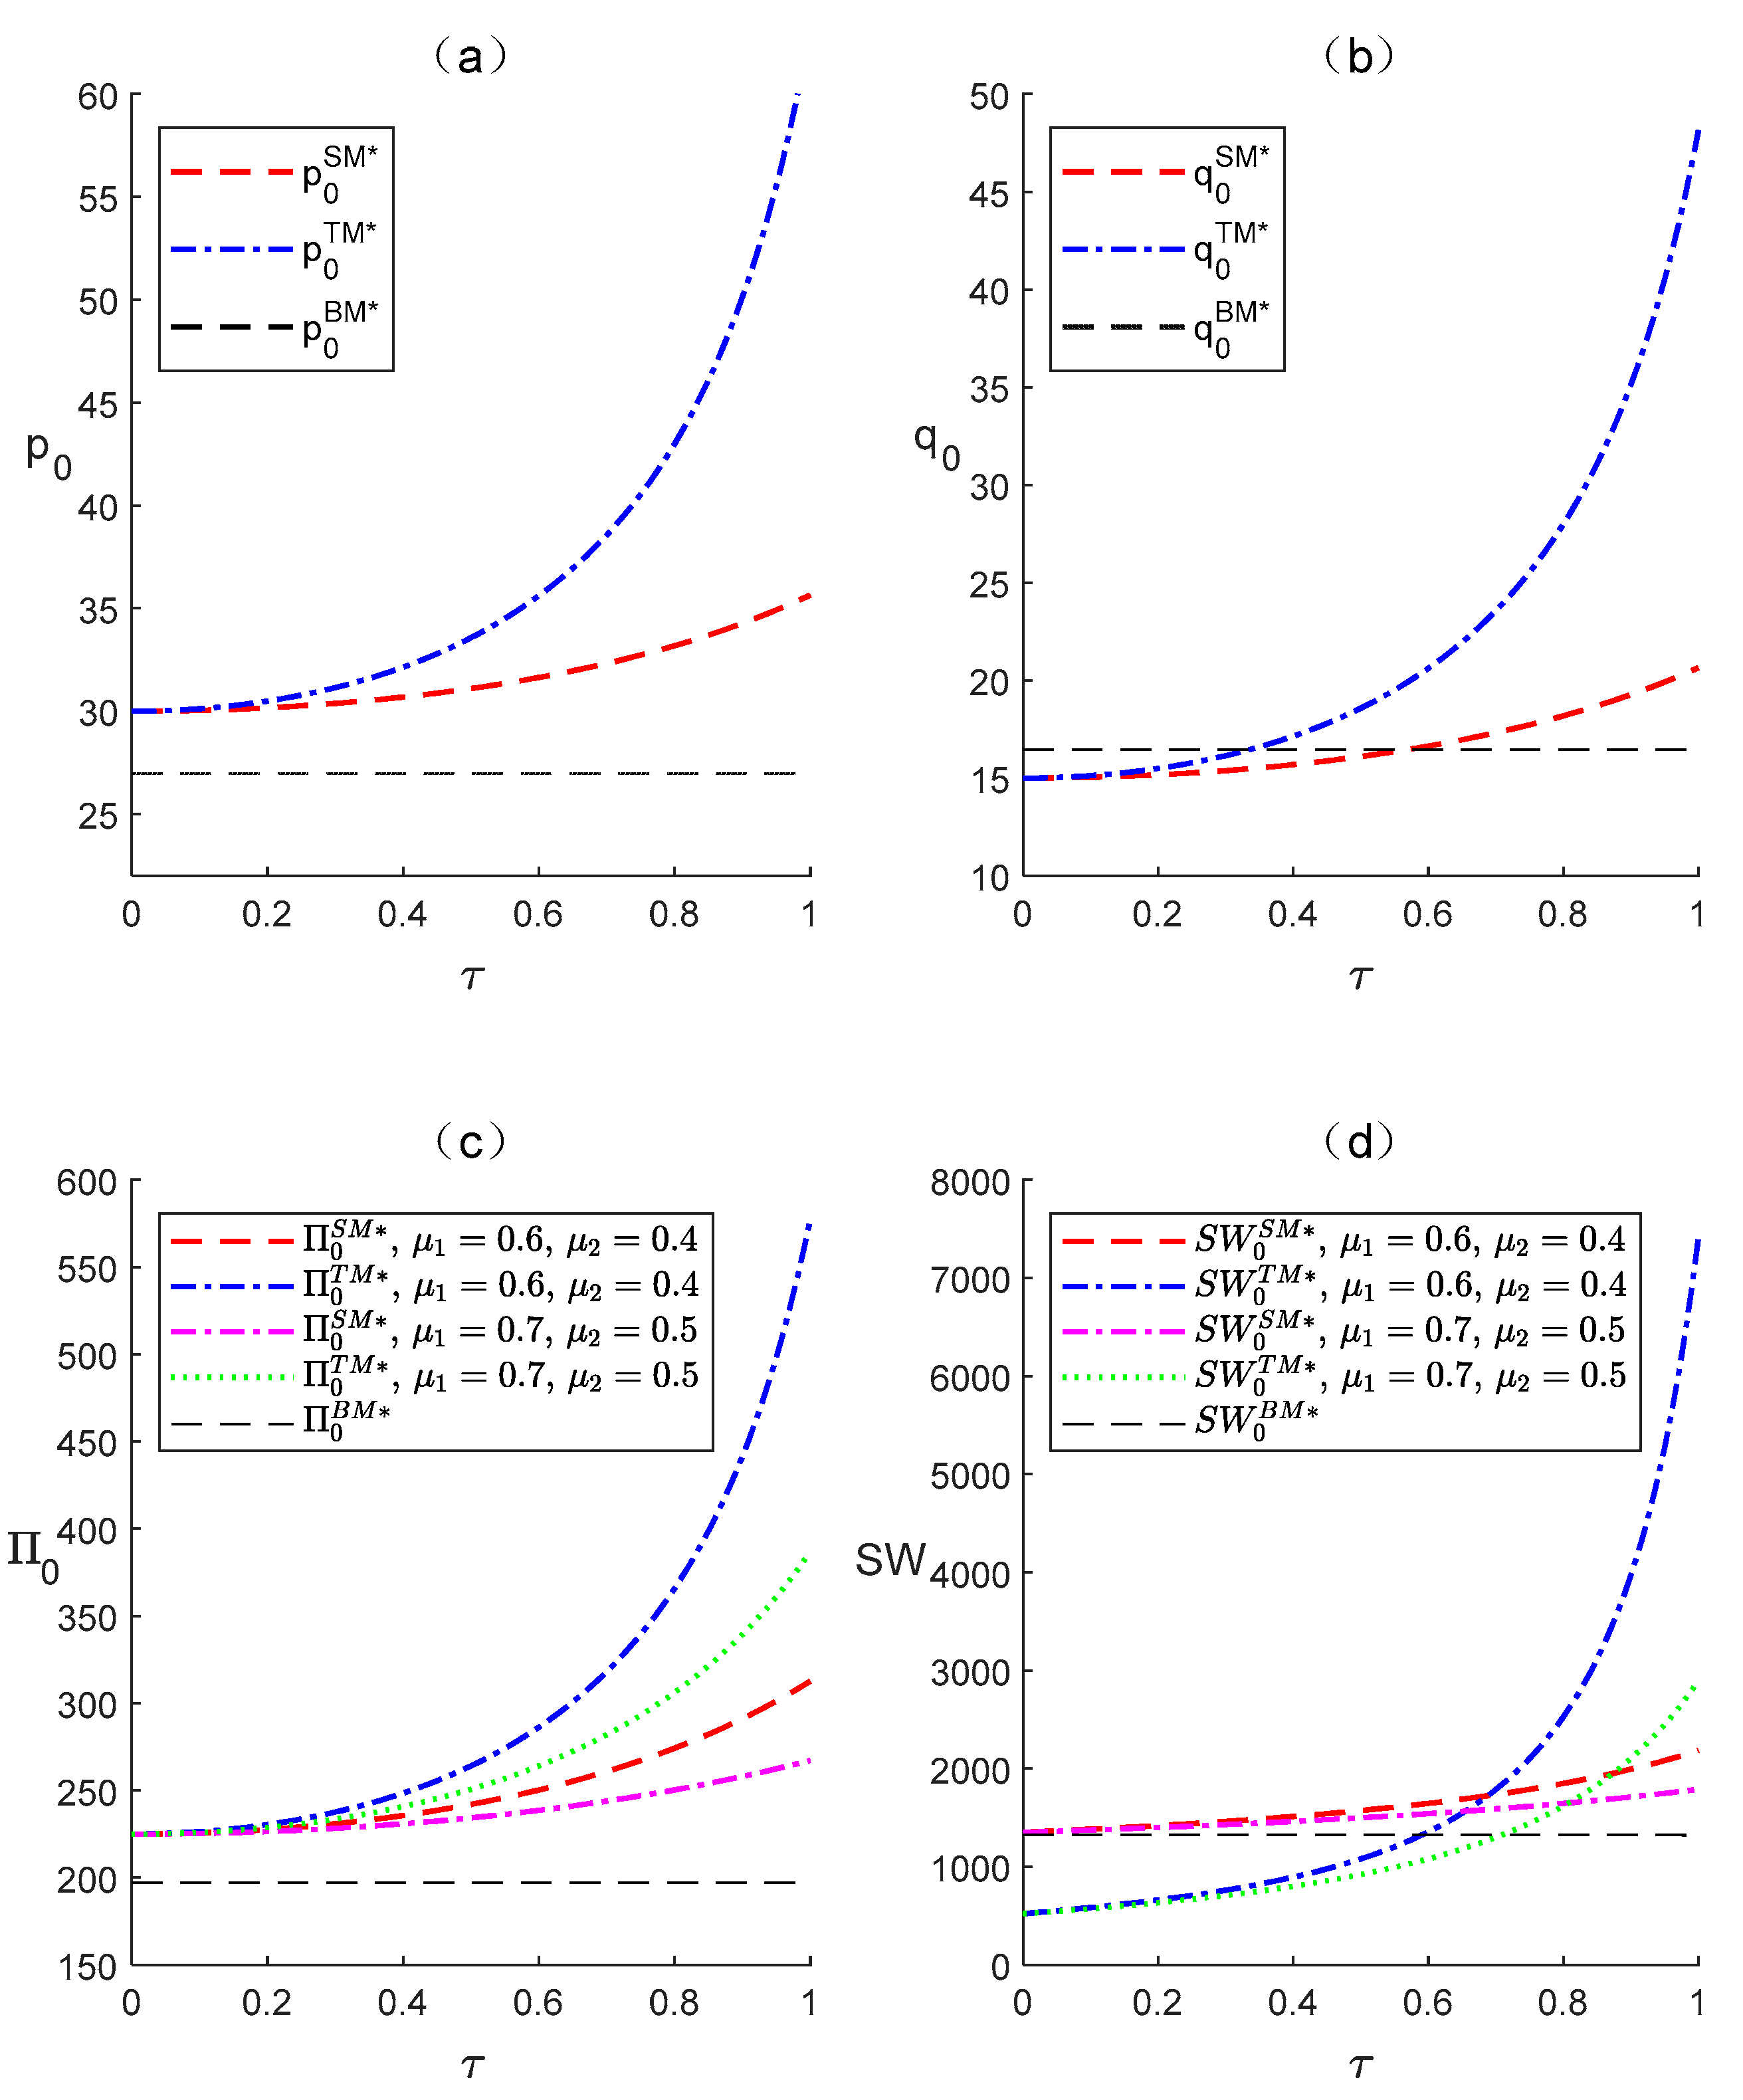
Figure 4 presents the decision-making and performance variables of green firms in a monopolistic competition market (scenarios SM, TM, BM).
Figure 4a,b indicate that, similarly to the relationship between TCLs and SCLs in an oligopolistic market, decision variables under TCLs are higher for green firms. However, there are differences when compared with the benchmark scenario. When CEA is very low, adopting a carbon labeling program still results in a relatively high increase in product prices, but demand is lower than in scenarios without carbon labeling, demonstrating the negative correlation between price and demand in monopolistic competition. However,
Figure 4c shows that the price–demand changes induced by carbon labels ultimately lead to increased profits. Although prices are higher under both TCLs and SCLs, when CEA exceeds approximately 0.35 and 0.55, the demand for carbon-labeled products surpasses that in the benchmark scenario (BM).
Figure 4c also reveals that increasing label ambiguity reduces green firms’ profits, consistent with findings in the oligopolistic market. However, unlike in the oligopolistic market, profits in monopolistic competition are less affected by CEA. Regarding SW (social welfare), the results differ in the monopolistic competition market. First, when CEA is not very high (below approximately 0.6), carbon labeling programs reduce overall SW. This may be because, while increasing green product prices, carbon labels also drive up non-green product prices, leading to a significant cost reduction for the latter when CEA is not high. Furthermore, regarding the impact of label ambiguity, both types of carbon labels show the same trend: a high ambiguity decreases SW. Finally, the effect of carbon label type also differs in this case. Under low ambiguity and low CEA (below approximately 0.7), SCLs perform better, whereas under high ambiguity, the conditions favoring TCLs are more stringent (CEA must exceed 0.8).
5.3. Comparative Analysis of Performance Across Scenarios
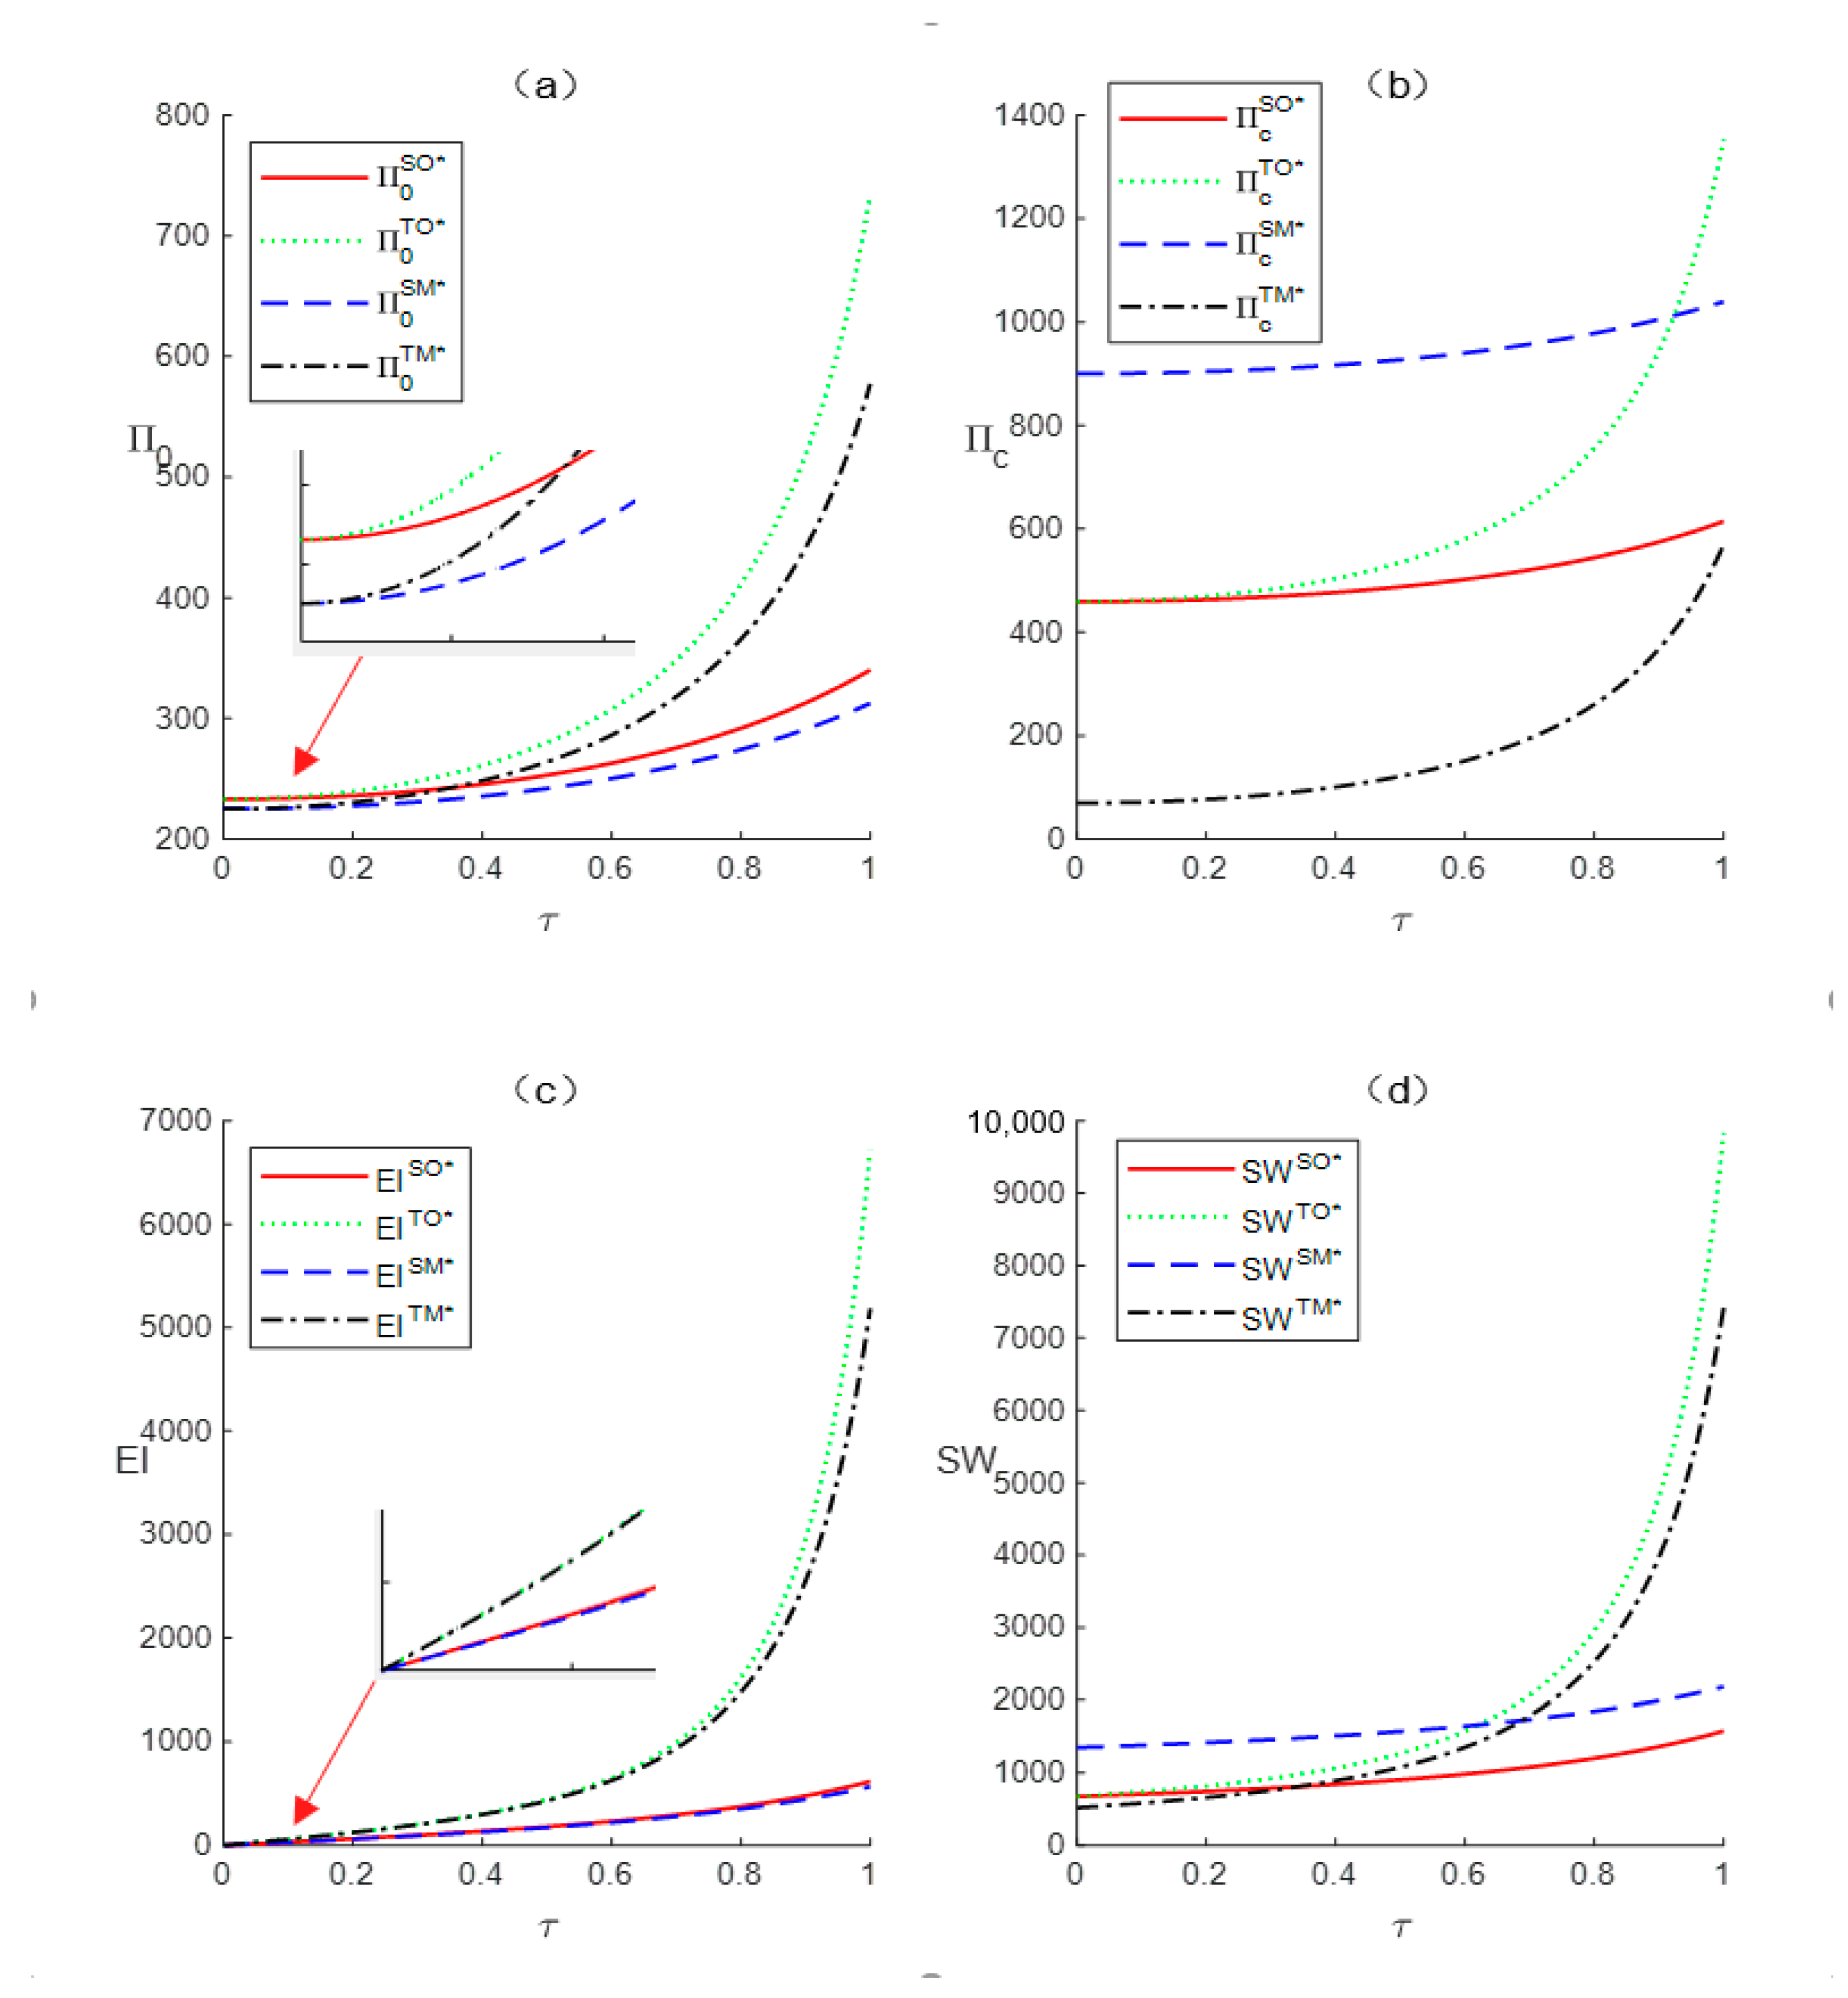
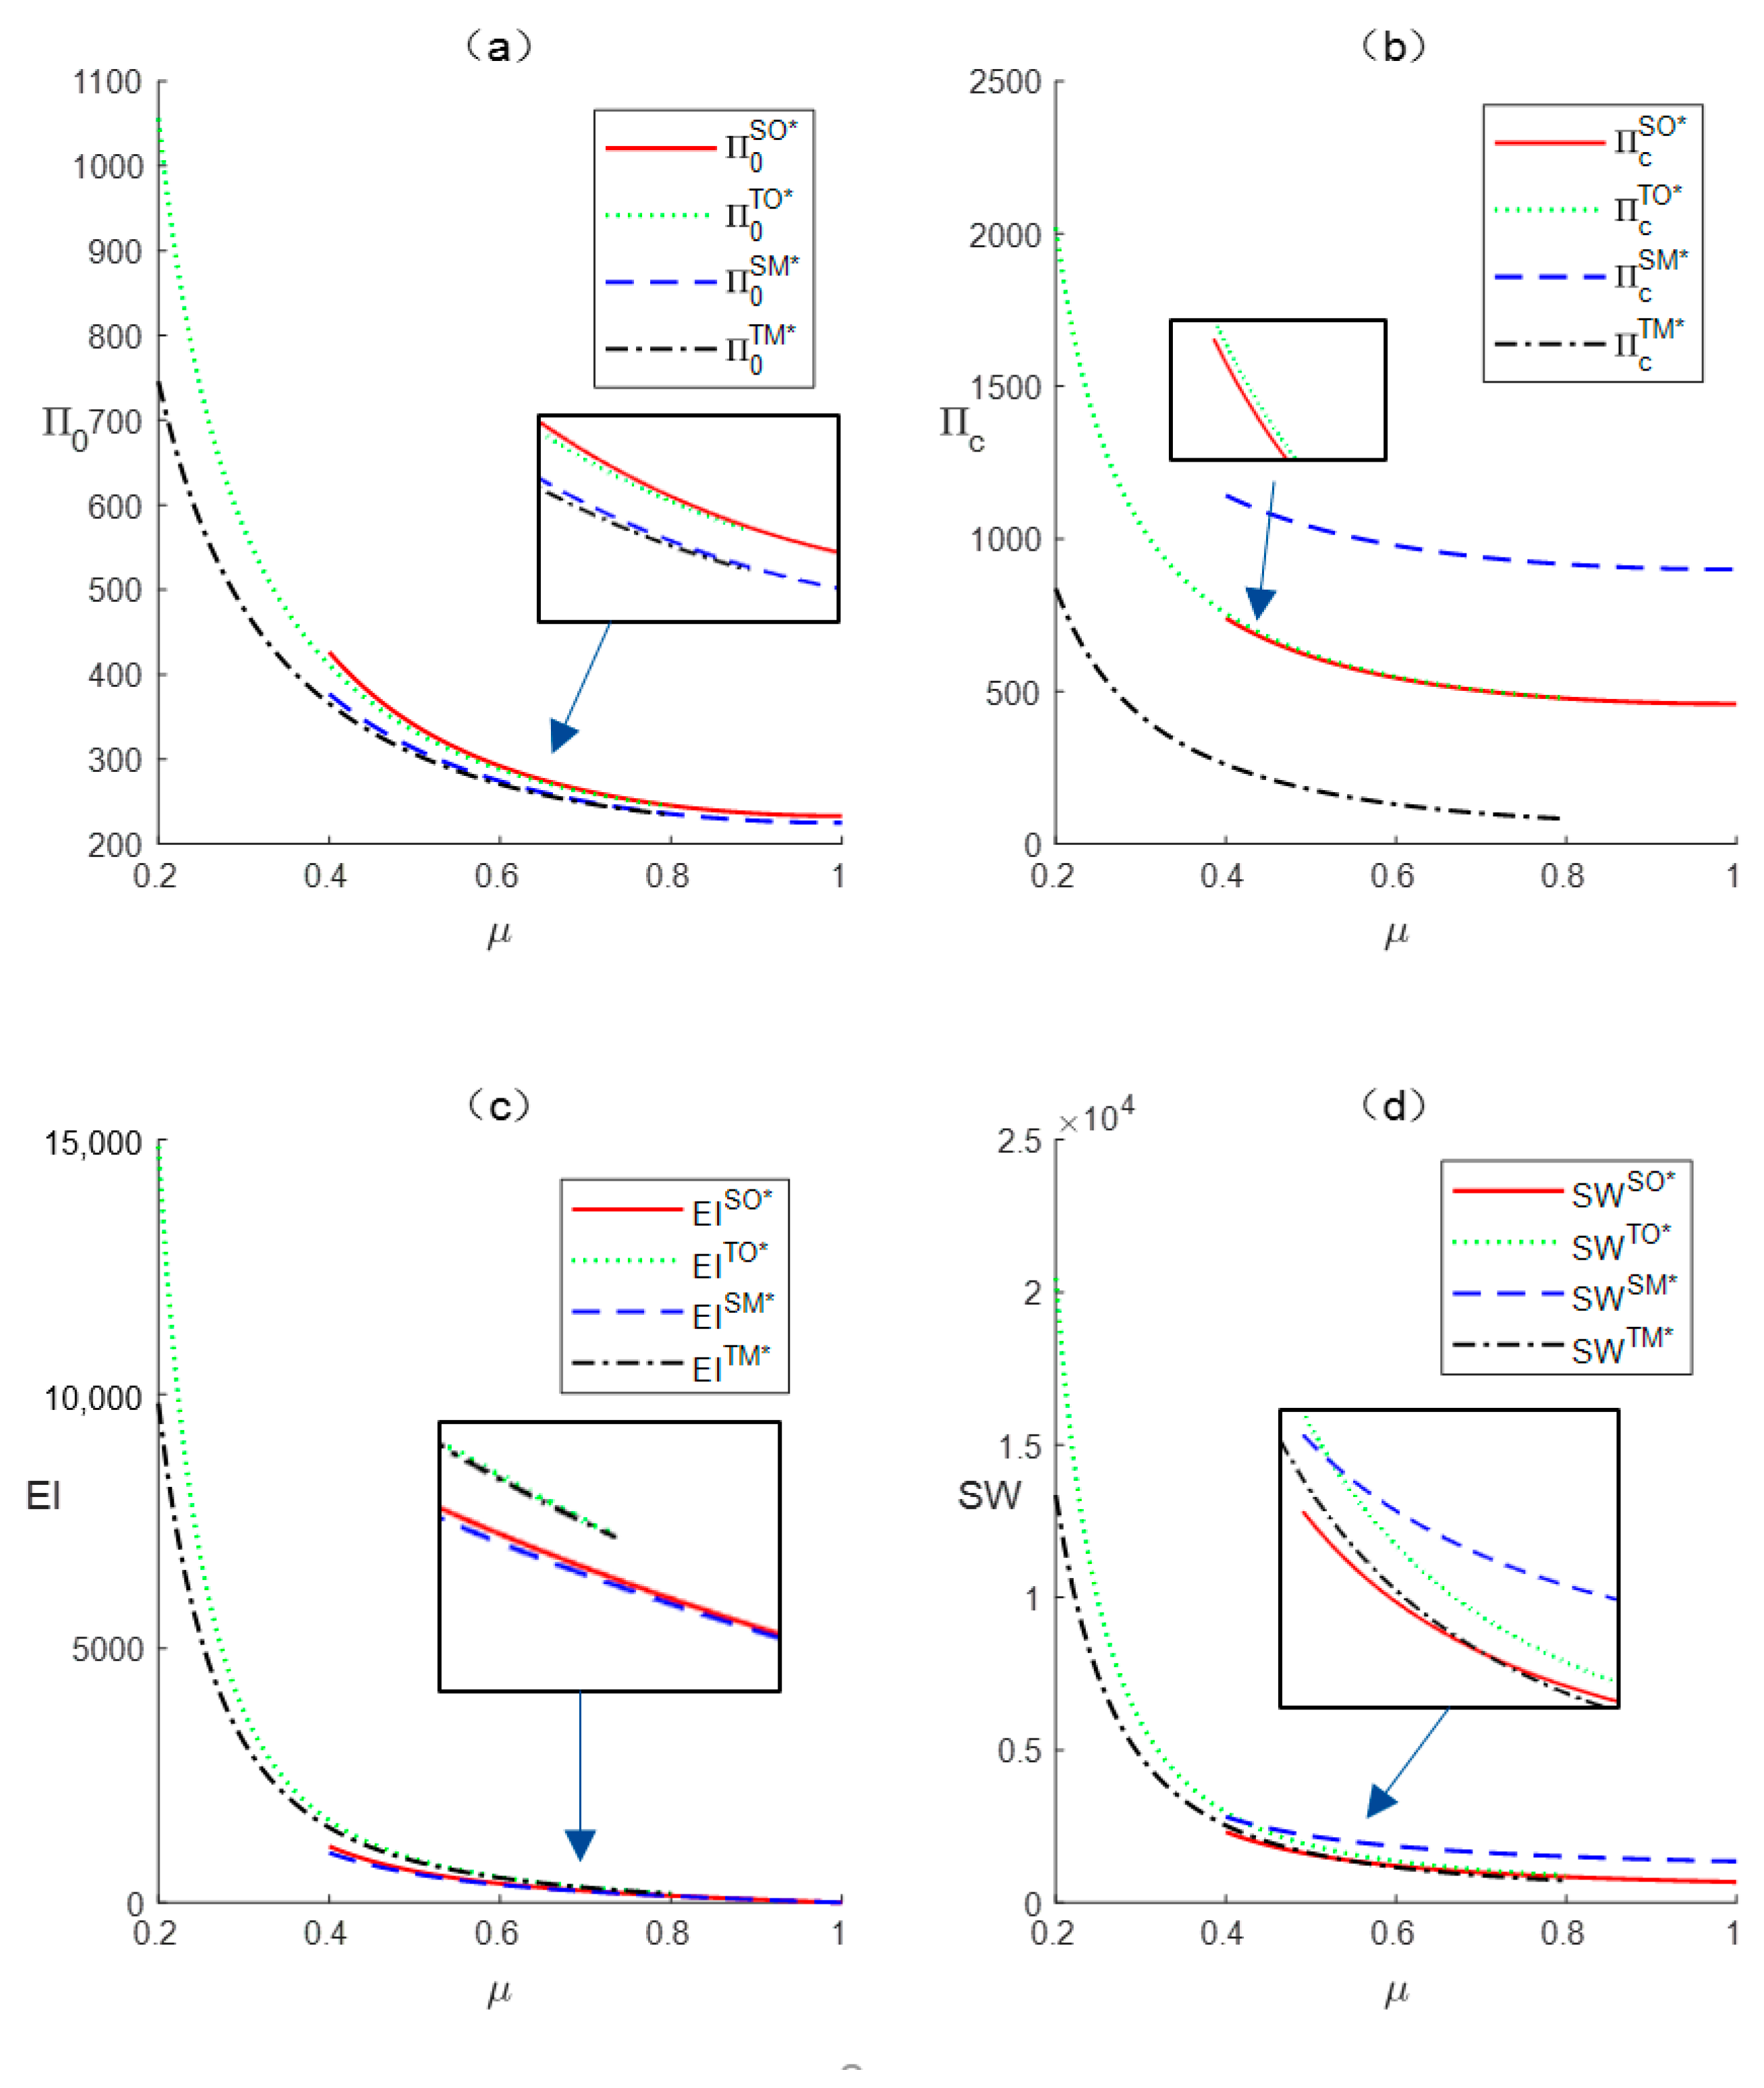
The relationship between CEA and various performance metrics is shown in
Figure 5. As seen in
Figure 5, consumer environmental awareness has a generally positive impact on green firms’ profits, total industry profits, environmental performance, and social welfare, though the extent of these effects varies across market contexts. Specifically, for green firms, when CEA is low, firm profits are primarily driven by the market structure and are less affected by label type. However, as CEA increases, firms adopting TCLs experience faster profit growth compared to those using SCLs, indicating that TCLs are more sensitive to changes in CEA. Counterintuitively, in monopolistic competition, industry performance under SCLs is higher than in the other three scenarios, despite relatively lower profits for green firms. This may be because product demand is higher in monopolistic competition, and SCLs have lower carbon reduction costs, thereby increasing overall profitability. In terms of emission reductions, TO and TM scenarios achieve higher reductions than SO and SM, suggesting that carbon label type significantly influences carbon reductions and environmental performance, whereas market structure has a relatively smaller impact. Additionally, consistent with previous analyses, CEA plays a more pronounced role in improving SW under TCL. In oligopolistic markets, TCLs outperform SCLs, aligning with the findings of Yang et al. [
28] on oligopolistic markets. However, in a monopolistic competition, SCLs demonstrate a superior performance.
The relationship between carbon label ambiguity and performance is illustrated in
Figure 6, where the ambiguity range for SCLs is set between 0.2 and 1, while for TCLs it ranges from 0 to 0.8.
Figure 3 indicates that carbon label ambiguity generally has a negative inhibitory effect on all performance metrics across different scenarios. Specifically, when carbon label ambiguity is low, green firms’ profits are more sensitive to changes in ambiguity. However, as the ambiguity increases, its negative impact on firm profits diminishes. Under the same ambiguity conditions, green firms using SCL typically achieve higher profits. Regarding total market profits, TCLs result in higher total profits in an oligopolistic market, while SCLs are superior in monopolistic competition. As label ambiguity increases, industry performance declines more significantly in monopolistic competition. The impact of carbon label ambiguity on environmental performance is primarily influenced by the type of carbon label. Among the four performance indicators examined, label ambiguity has the most substantial negative effect on environmental performance. From a market structure perspective, in monopolistic competition, SW under SCLs is generally higher than under TCLs. This may be because SCLs offer greater flexibility, making them more appealing to firms and enabling them to convert consumer trust into tangible social welfare improvements. In fact, according to a 2015 Carbon Trust consumer survey, over 67% of consumers prefer products labeled with carbon footprints, and the mutual selection between consumers and businesses forms a positive feedback loop for low-carbon development. On the other hand, in an oligopolistic market, the effect of label ambiguity is not absolute. Given the limited number of products available, TCLs, due to their accuracy and transparency, may better enhance social welfare. However, when firms set self-regulated standards for carbon labeling that exceed industry norms, the social benefits of SCLs can also take the lead.
Figure 7 reveals the relationship between product competition intensity and various performance indicators. Consistent with findings from many studies on green product competition [
9,
37], competition intensity has a generally positive effect on performance. Specifically, in an oligopolistic market environment, the impact of competition intensity on performance is more pronounced, primarily because a smaller number of market participants makes demand more sensitive to product substitutability. When competition intensity is high, green firms in oligopolistic markets achieve higher profits. Across different levels of competition intensity, the SM scenario yields the highest total market profits. However, as competition intensity increases, overall industry performance in the SM scenario may fall below that in the oligopolistic TO scenario. The impact of competition intensity on environmental performance is nonlinear, and this relationship is more influenced by carbon label type. Similarly to previous research [
28] on oligopolistic markets, green firms choosing TCLs generally yield higher SW. However, when product substitutability is excessively high (above 0.9), SCLs may be more effective in improving SW.


