Article

Tool for Greener Tourism: Evaluating Environmental Impacts

by
Cristina Campos Herrero
1,2,*,
Ana Cláudia Dias
3,
María Gallego
4,
David Gutiérrez
1,
Paula Quinteiro
3,
Pedro Villanueva-Rey
4,5,
Sara Oliveira
6,
Jaume Albertí
2,
Alba Bala
2,
Pere Fullana-i-Palmer
2,
Margalida Fullana Puig
7,
Lela Melón
2,
Ilija Sazdovski
2,
Eduardo Rodríguez
4,
Mercè Roca
2,8,
Ramon Xifré
2,8,9,
Jara Laso Cortabitarte
1,
María Margallo Blanco
1 and
Rubén Aldaco García
1
1
Department of Chemical and Biomolecular Engineering, University of Cantabria, 39005 Santander, Spain
2
UNESCO Chair in Life Cycle and Climate Change ESCI-UPF, 08003 Barcelona, Spain
3
Centre for Environmental and Marine Studies (CESAM), Department of Environment and Planning, University of Aveiro, Campus Universitário de Santiago, 3810-193 Aveiro, Portugal
4
EnergyLab, Campus Universidad de Vigo, 36310 Vigo, Spain
5
Galician Water Research Center Foundation (Cetaqua Galicia), AquaHub—A Vila da Auga, 15890 Santiago de Compostela, Spain
6
Laboratório da Paisagem, Rua da Ponte Romana, Creixomil, 4835-095 Guimarães, Portugal
7
LEPAMAP-PRODIS Research Group, University of Girona, 17003 Girona, Spain
8
UPF Barcelona School of Management, 08008 Barcelona, Spain
9
IQS School of Management, Universitat Ramon Llull, 08017 Barcelona, Spain
*
Author to whom correspondence should be addressed.
Sustainability 2025, 17(8), 3476; https://doi.org/10.3390/su17083476
Submission received: 14 December 2024 / Revised: 12 March 2025 / Accepted: 24 March 2025 / Published: 14 April 2025

Abstract

:
Travel and tourism are essential to global economies, generating social, economic, and environmental impacts. However, there is a lack of standardized methodologies to assess the environmental footprint of tourist destinations beyond carbon footprint analysis. This study introduces the Greentour tool, the first of its kind to evaluate the environmental impact of accommodation, restaurants, and tourism activities using nine environmental indicators from a life cycle assessment (LCA) perspective. The tool applies a hybrid bottom-up and top-down approach, integrating data from tourist establishments and destination managers. The tool was tested in four tourist destinations in Spain and Portugal (Rías Baixas, Camino Lebaniego, Lloret de Mar, and Guimarães), revealing that transportation is the primary contributor to environmental impacts, ranging from 60% to 96% of total emissions, particularly in air-travel-dependent destinations. Food and beverage services are the second-largest contributor, accounting for up to 26% of emissions, while accommodation ranks third (1–14%). This study highlights the significant role of electricity consumption and food choices (e.g., red meat and dairy) in greenhouse gas (GHG) emissions, emphasizing the need for sustainable alternatives. Despite challenges in data collection, particularly for food and transport statistics, the Greentour tool has demonstrated robustness and adaptability across diverse destinations, making it applicable worldwide. This tool provides key insights for policymakers, tourism stakeholders, and businesses, supporting the integration of sustainability strategies into public policies and industry best practices. Future research should focus on expanding its use to additional destinations to foster science-based decision-making and promote more sustainable tourism practices globally.

1. Introduction

Tourism can provide economic opportunities for the preservation or restoration of cultural structures and the conservation of natural resources. At the same time, tourism-related activities generate significant environmental impacts. Between 2009 and 2013, tourism’s global carbon footprint accounted for approximately 8% of global GHG emissions [1], with transportation being responsible for the largest share. More recent studies confirm this trend, highlighting that transportation still accounts for nearly 75% of the sector’s total emissions [2]. The concept of “Greener Tourism” refers to an approach that prioritizes minimizing environmental impacts while ensuring the sustainability of tourism-related activities [3]. This involves adopting strategies to reduce carbon emissions, improve resource efficiency, and promote environmentally responsible practices across various tourism sub-sectors, including accommodations, food services, leisure activities, and transportation [4].
For this reason, several global entities, such as the Organization for Economic Cooperation and Development (OECD), World Trade Organization (WTO), United Nations (UN) Environment, and the European Economic Area (EEA), have created numerous indicators to measure the environmental performance of tourism activities [5]. Due to this situation, there is a growing need for a more manageable set of indicators, along with detailed descriptions concerning their objectives, sources, and calculation tools [6].
Tourism is an economic activity that encompasses several interconnected sectors, such as accommodation, transportation, food, and leisure, each with its own environmental impact. It is understood as a value chain where different productive activities contribute to the overall environmental impact, both directly and indirectly. A tool is needed that adopts a holistic approach to measure these impacts, evaluating not only the carbon footprint but also water use, energy consumption, and waste generation, allowing for a comprehensive view of tourism’s environmental impact and identifying areas for improvement [7].
Before evaluating specific tools, it is crucial to understand the theoretical foundations of tourism environmental impact measurement methodologies. The measurement of tourism’s environmental impact can be approached using different methodologies, each grounded in distinct theoretical foundations. Life cycle assessment (LCA) is based on systems thinking and evaluates the entire life cycle of a tourism product or service, considering all environmental impacts from raw material extraction to disposal. It provides a comprehensive, holistic analysis but is data-intensive and complex. In contrast, footprint-based indicators, such as carbon footprint (CF), water footprint (WF), and ecological footprint (EF), focus on specific environmental issues like greenhouse gas emissions, water usage, and land consumption. These methods are more straightforward and easier to calculate, but they are less comprehensive than LCA. While LCA is suitable for a broad environmental assessment, footprint indicators offer more targeted insights, which are especially useful for specific impacts like emissions or water use. Previous studies have applied these methods to assess tourism’s environmental performance at various levels. For example, ref. [8] conducted a comprehensive review of footprint applications in tourism, highlighting the challenges of data availability, system boundary definitions, and methodological inconsistencies. Other studies have examined the carbon footprint of [9], the water footprint of tourist activities, and the ecological footprint of destinations [10]. Despite these efforts, there is still no consensus on a standardized methodology for assessing tourism’s environmental impact at a broader scale, with both LCA and footprint-based approaches facing challenges related to data availability, consistency, and sector-specific applications.
This lack of standardization has driven the development of new tools aimed at overcoming the limitations of traditional methods. In particular, more accessible and user-friendly solutions have been designed, prioritizing integration with commonly available data sources and smart devices, thus facilitating their implementation in the tourism industry.
To identify and address challenges effectively, foster consensus across the industry, and enable the monitoring of the efforts to combat climate change and reduce emissions in the upcoming years [11], it is essential to carry out a comprehensive assessment of the various tools currently used in the tourism industry. New tools and resources have emerged to address the weaknesses of the often difficult to use spreadsheet-based tools, which require comprehensive knowledge of numerous and diverse sources of emissions. In contrast, the newer tools prioritize user-friendliness by using readily accessible and comprehensible data sources, such as energy bills, and some even provide direct integration with smart devices.
Several methodologies target different aspects of environmental impact measurement in tourism, spanning hotels, destinations, and transportation systems. Some focus specifically on quantifying the carbon footprint of accommodations, such as the Hotel Carbon Measurement Initiative (HCMI) and the Net Zero Methodology for Hotels [12]. Examples of such tools include the Hotel Footprinting tool [13], Greenhouse Gas Abatement Cost Model [14], MyEarthcheck [15], and Weeva [16]. While these tools may apply different underlying methodologies, their primary purpose is to estimate GHG emissions from specific activities [17].
Broad methodologies, such as life cycle assessment (LCA), evaluate the environmental impact of entire destinations, as shown in studies from Australia [18] and New Zealand [19]. The versatility of LCA also enables the assessment of emissions from specific tourism-related activities, such as restaurant operations [20]. Tools like LCA and carbon footprint analysis have been effectively applied across various sectors of tourism, including accommodations [9], the food and beverage industry [21], leisure activities [22], and transportation [23]. However, there remains a lack of consensus on which metrics should be prioritized and the implications of such measurements. This discrepancy stems from variations in methodological frameworks, data availability, and regional differences, which affect how environmental impacts are assessed and compared across destinations. Studies such as [8,24] highlight the ongoing debate regarding system boundaries, impact categories, and the granularity of data required for meaningful assessments. Moreover, publicly available tools and methodologies to assess emissions and impacts at the destination level remain limited, as noted by [11], further complicating efforts to establish a standardized approach.
In sum, there are currently no software or tools available to estimate the environmental footprint considering a large number of environmental indicators at the tourism establishment and destination level and that of leisure activities. The designed tool has been specifically developed to fill the gaps in existing environmental assessment methodologies in tourism. Unlike previous tools that focus primarily on carbon footprint calculations, Greentour integrates a broader set of environmental impact indicators and evaluates tourism establishments and destinations holistically. By applying LCA principles, this tool provides a comprehensive framework for identifying environmental hotspots and supporting stakeholders in making more sustainable choices. Thereby, the objective of this article is to describe and test the robustness of a tool able to evaluate and quantify a broad range of environmental impacts of touristic establishments and destinations. The tool applies the LCA methodology and addresses the most relevant tourism sub-sectors (accommodation, eating and drinking, and leisure activities) and transport and waste management, and it was applied to four destinations, aiming to identify the main hotspots in order to support the choice of more sustainable alternatives. It is important to note that this is the first time that an environmental analysis has been conducted that considers the three sub-sectors and transport and waste management at the destination level.

2. Materials and Methods

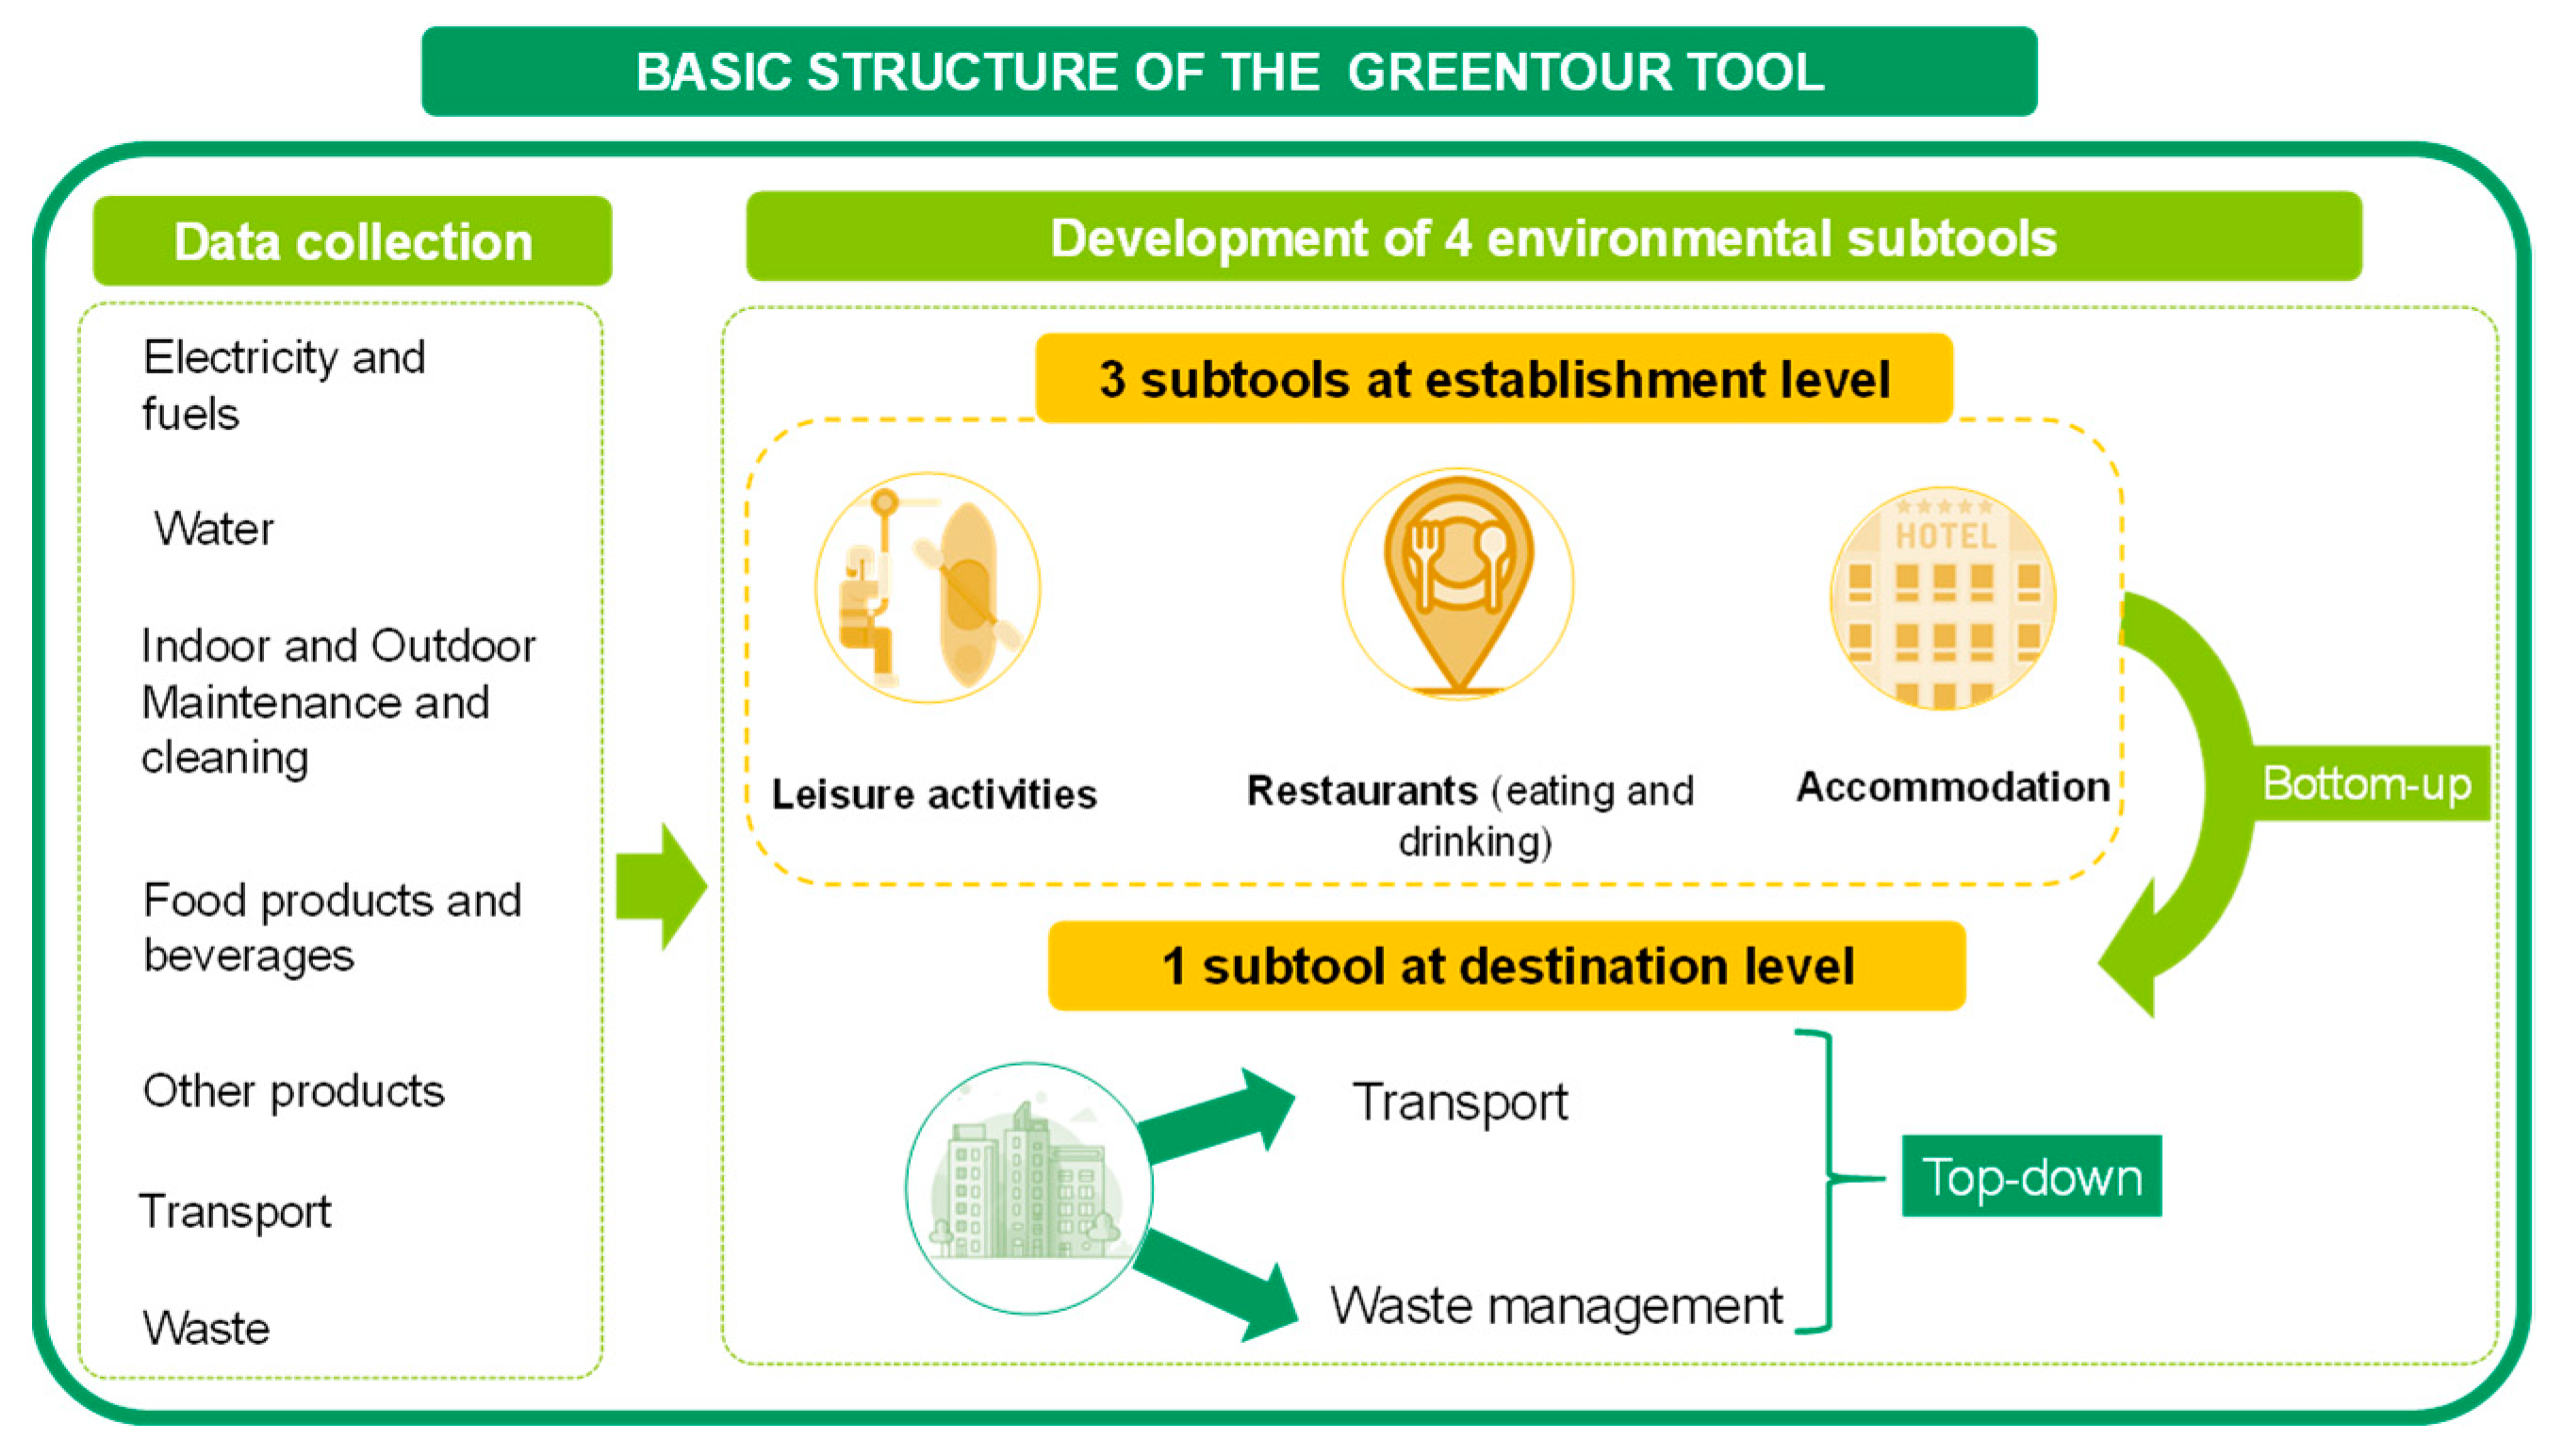
2.1. Tool Development: Basic Structure of the Tool

The tool proposed in this study, called the © 2021 Greentour tool, was developed under the framework of the project “Greentour: Circular Economy and Sustainable Tourism in Destinations of the SUDOE Space”. This project of the Interreg SUDOE Program, funded by the European Regional Development Fund (ERDF), addressed several innovative actions to define, evaluate, and modify strategies, balancing environmental, economic, and social value in the tourism sector. The Greentour tool encompasses three subtools focusing on the three tourism-related main sub-sectors: accommodation, eating and drinking, and leisure activities. In addition, it also entails a fourth subtool that determines the total environmental impacts at the destination level, including not only the three sub-sectors, but also waste management and the “origin-to-destination” transport of tourists. This latter subtool is based on an extrapolation of the impacts of a sample of touristic establishments in each sub-sector within the destination to the total population level (bottom-up approach). The bottom-up approach uses detailed, process-specific data collected from individual establishments in each sub-sector (e.g., accommodation, dining, leisure activities) to build an environmental inventory, which is then scaled up to estimate the total environmental impacts for the destination. This method is particularly useful when more granular data are available and when the goal is to assess localized, specific impacts. On the other hand, the top-down approach is applied for waste management and transport, where aggregated data or global models are used to estimate the environmental impacts. This approach provides a broader, more generalized perspective and is typically employed when individual-level data are difficult to obtain or when a higher-level overview of impacts is required. By using aggregated data or models, the top-down approach efficiently estimates impacts at the destination level. The bottom-up and top-down processes are shown in Figure 1, which illustrates the different sub-sectors analyzed [25].
The Greentour tool assists stakeholders in the sustainable tourism ecosystem. Its main target groups include owners of hotels, restaurants, accommodation, and tourism activities (cruises, museum visits, horse riding, among the most relevant). The selection of activities was based on official tourism records, which document the most frequent and economically significant tourist activities in each destination. We prioritized activities that are characteristic of the destination type (e.g., coastal, mountainous) and that exhibit notable environmental impact potential. This selection process was guided by quantitative data on visitor participation rates, as well as qualitative assessments of each activity’s environmental burden, ensuring a robust and reproducible methodology that is applicable across different tourism contexts. Tourism offices and local and regional authorities are also key users, along with partners in tourism development and environmental management.
This completely free tool is available in seven languages (English, French, Spanish, Portuguese, Catalan, and Galician). In addition, the webpage where the tool is located contains information about the project (what it is about, which partners are involved, and its budget), a section on results and progress, communication, networking, and a sustainable tourism network that includes European legislation on sustainable tourism and environmental protection, national and local legislation, European directives, and the best sector practices.
Finally the tool has a user registration section (for establishment owners) where they create their profile on the tool with a username and password. Once registered, they can add their establishment’s data, edit them, and finally, obtain results automatically on the tool’s website (Figure 2).

2.1.1. Data Requested in the Tool

The use stage of accommodation stands out as a pivotal component in the evaluation of tourist destinations. This stage involves the consumption of electricity, fossil fuels, water, cleaning products, and other consumables for both indoor and outdoor maintenance use, and, in hotels with dining facilities, the consumption of food and beverages during breakfast, lunch, and dinner. The analysis excludes the production of infrastructures and their maintenance, including necessary construction work or repairs. This exclusion is justified by the study [27], showing that these processes typically have a minimal impact on the overall environmental assessment when compared to other stages, such as energy consumption or waste generation. Additionally, the focus of this study is on operational impacts, which are more directly related to the day-to-day activities of tourism establishments. Furthermore, the types of fossil fuels considered in the analysis are specified as natural gas, coal, and petroleum, which are the primary sources of energy in the tourism sector. The end-of-life stage of the infrastructures was also not included for the same reason, taking into account the long life of hotels. Regarding the leisure sub-sector, the activities are very diverse (cruises, visits to museums, concerts, horse riding, etc.), but broadly, the main inputs are electricity, food and drink.
Primary data needed to compile the inventory are collected through an online questionnaire, which is accessible through the establishment owner’s registration on the Greentour platform [26] (Figure 3). Users must register on the platform using a username and password to create a secure profile. Once registered, they can input and update data regarding the establishment, including general information such as its name, type, category, year of data collection, capacity, and days of operation, as well as details about its facilities, months of operation, and other relevant aspects. The platform ensures that all personal data are stored securely in compliance with data protection regulations, with access restricted to authorized personnel only. The questionnaire also includes a specific section for collecting environmental data, such as the generation and consumption of energy, water, cleaning products for maintenance, food, beverages, and other products used in leisure activities. All these inputs and emissions have been determined based on previous studies and assessments carried out in different establishments, in order to identify the key aspects to be considered according to the type of accommodation. The statistical basis of the data follows internationally recognized sustainability assessment methodologies, including the life cycle assessment [28,29] and the Product Environmental Footprint (PEF) method. In addition, the questionnaire is in line with standards for environmental reporting in tourism, allowing comparability between different establishments. The results of each establishment are presented in relation to other establishments in the same destination and other destinations analyzed, thus enabling a comparative assessment. To ensure the consistency and reliability of the data, several validation mechanisms have been implemented. Firstly, the questionnaire incorporates predefined ranges and reference values based on previous studies and current regulations. Internal checks are applied to detect discrepancies, and if any inconsistencies are found, the data are reviewed by technicians to verify their accuracy. The data validation process ensures the accuracy and reliability of the information before proceeding with the environmental impact assessment. These validation steps are in place to ensure that only high-quality, reliable data are used in the evaluation. In addition to these internal validation mechanisms, the questionnaire was pretested in the pilot destination of Lloret de Mar. This pilot phase allowed us to assess the reliability and consistency of the questions, as well as to identify any issues related to the clarity of the questions and the data obtained. The results from the pilot were analyzed to ensure that the questions effectively captured the necessary information and provided reliable data for the environmental impact assessment. The feedback from the pilot phase led to adjustments in the questionnaire, ensuring that it would be suitable for use in other destinations. Additionally, the platform’s secure data management system guarantees that all collected data are handled with confidentiality and in accordance with privacy protection standards.
Secondary or background data on the production of energy, materials, and food were obtained using the databases Agrybalyse 3.0, Ecoinvent v3.7.1, and World food LCA. Since inventory data collection is the most challenging stage of this tool’s methodology—often due to the lack of available data faced by technicians responsible for calculating environmental impacts [30]—a series of assumptions have been made to develop the most detailed inventory possible. While these assumptions may increase the level of uncertainty in the LCA, they are necessary to fill the gaps in the data provided by the facilities.
  • Indoor maintenance and cleaning products
The impact factors for these products were taken from Ecoinvent. In this database, chemicals were always expressed as 100% active substances, while the quantities of chemicals to be filled by the tourist establishments in the tool were in some cases expressed as diluted solution. Therefore, for those cases, the impact factors were adjusted by considering the concentration of the active substance in the chemicals. The product compositions were based on reports defining European Ecolabel criteria [31,32,33]. This method ensured the consistent modeling of environmental impacts across different cleaning products based on their specific compositions. Table 1 presents the information adopted to derive the impacts of products used in indoor maintenance and cleaning.
  • Outdoor maintenance and cleaning products
The impact factors were derived from the Ecoinvent database and adjusted for the concentration of active substances. For fertilizers, a typical composition of 15% nitrogen (N), 5% phosphorus pentoxide (P2O5), and 10% potassium oxide (K2O) was used. The sources of N, P2O5, and K2O were ammonium sulfate, triple superphosphate, and potassium chloride, respectively. Direct emissions from fertilizer application were estimated using the literature emission factors [34]. Specifically, the application of N-containing fertilizers was considered to emit dinitrogen oxide (N2O) and ammonia (NH3) into the atmosphere and nitrates (NO3) into water, with respective emission factors of 0.01 kg N2O-N, 0.1 kg NH3-N, and 0.3 kg NO3N per kg N in fertilizer [35]. The application of phosphorus (P)-containing fertilizers was considered to release P into water, adopting an emission factor of 0.024 kg P per kg P in fertilizer [36]. Table 2 provides information on the impacts of outdoor maintenance and cleaning products.
  • The electricity mix
The electricity mixes of each country were modeled as marginal, accounting for the energy available after deducting renewable energy sold under the Guarantee of Origin (GO) system. This reduces the share of renewables in the actual consumption mix. Accurate modeling requires tracking electricity from production to consumption and using a residual mix to prevent double counting. The GO system informs consumers about the source of electricity, but a residual mix is essential to reflect the generation remaining after GO allocations and avoid duplicating renewable energy claims.
Given the international character of energy markets and electricity monitoring systems, the volume of energy available in the domestic residual mix is different from the volume of untracked consumption (i.e., electricity consumption whose energy source is not revealed by monitoring instruments). Therefore, it is necessary to calculate a residual mix in a coordinated and central way, developing a common pool aimed at balancing the attributes of electricity generation. The latter can be achieved through the European Attribute Mix (EAM). The EAM acts as an equal repository for the generation attributes of national residual mixes. After attribute balancing across the EAM, the volume of generation attributes available in the residual mix is equal to the untracked consumption in each country. Therefore, the EAM is used to balance surpluses and deficits in the national residual mixes caused by international trade in electricity and GO.
This study is based on the Product Environmental Footprint (PEF) methodology, but it does not fully follow the PEF recommendations due to assumptions, limitations, and modelling choices. The proposed approach to carrying out the LCI of electricity consumption follows the guidelines developed for the PEF method. Two types of electricity mixes were identified: (i) the consumption grid mix (country production mix) that reflects the total mix of electricity transferred through a defined grid, including declared or tracked green electricity, and (ii) the residual grid mix that characterizes electricity that is unclaimed, untracked, or not publicly shared. In line with the PEF methodology and to avoid double counting at the energy source, electricity was modeled using the following hierarchical order:
  • The specific electrical product from the supplier.
  • The total energy mix specific to the supplier.
  • The country-specific residual mix.
  • The average combination of residual mixes for the EU (EU-2u + EFTA) or the combination of representative residual mixes for the region.
A supplier-specific electricity mix can only be used in cases where several criteria are met: (i) the environmental attributes are conveyed and an explanation is given on the calculation method used to determine the mix and (ii) it is the only instrument that carries the environmental attribute associated with that generated electricity. In this case, these criteria were not met; thus, the country-specific residual electricity mix was modeled for the LCI.
The country-specific residual electricity mix was modeled according to data from the Association of Issuing Bodies (AIB—https://www.aib-net.org/, accessed on 13 March 2025), which publishes national residual mixes for 32 European countries. The aim of the AIB is to develop, use, and promote a standardized energy certification system for energy carriers. The energy sources in the residual mixes were divided into three main categories: (i) renewable, including biomass, solar, geothermal, wind, hydro, and non-specific renewable; (ii) nuclear; and (iii) fossil, lignite coal, oil, gas, and non-specific fossil. Figure 4 shows the share of energy sources when comparing the production of the residual mixes. In this respect, the share of renewable energy is considerably lower for the residual mixes, while nuclear and fossil energy sources increase their share. The reason behind the latter is the extraction of renewable energy that is claimed and sold as GO at national or international levels.
Data providers make available environmental inventories of residual mix, consumption mix, by energy type, by country, and by voltage. If a suitable inventory is not available, the following approach should be used: determine the country’s consumption mix (e.g., X% of MWh produced with hydropower, Y% of MWh produced with coal-fired power plants) and combine it with the LCI by energy type and country/region. In this way, the different energy mixes of each country were modeled.
  • Stationary and mobile fuels
Emissions from the combustion of stationary and mobile fuels were modeled using the emission factors from the EMEP CORINAIR emission inventory guidebook [38]. These fuels were classified into four groups, which are detailed in the following sections of the guidebook. Table 3 specifies the Ecoinvent background and foreground processes.
  • Stationary Source Emissions: Part B: Sectoral Guidance Chapters. 1. Energy. A. Combustion. 4 Small combustion 2019.
  • Emissions from road mobile means of transport: Part B: sectorally oriented chapters. 1. 1. Energy. A. Combustion. 3. b. i–iv Road transport 2019.
  • Emissions from waterborne transport: Part B: Sectoral guidance chapters. 1. 1. Energy. A. Combustion. 3. d. Shipping (maritime transport) 2019.
  • Emissions from non-road mobile machinery: Part B: Sectoral guidance chapters. 1. 1. Energy. A. Combustion. 4. Non-road mobile machinery 2019.
This comprehensive and transparent approach not only addresses data limitations but also supports sustainability decisions in the tourism sector by using the latest Ecoinvent database. This database considers regional variations in energy and transport practices, making the results more applicable across Europe. The detailed, Europe-specific data ensure that emission factors and processes reflect European regulations and practices, accounting for regional variability. By incorporating the most recent versions of Ecoinvent and the ‘2019 EMEP CORINAIR emissions guide’, the data remain up-to-date and relevant, providing a robust basis for decision-making in the tourism sector [38].
For the development of this tool, different reference flows were used depending on the sub-sector (accommodation, eating and drinking, leisure activities). The reference flow used for hotels was ‘guest stay per day’, for restaurants ‘number of meals served’, and for leisure activities ‘number of activities (entries)’.
Finally, it is important to highlight that the Greentour tool, accessible via the web, is based on an Excel file that contains all the processes and emission factors of Agribalyse 3.0, Ecoinvent v3.7.1, and World Food LCA. To calculate environmental impacts, the previously mentioned inventory data are used alongside the emission factors provided by these databases, all of which are available in the Excel file.

2.1.2. Environmental Indicators of the Tool

The Environmental Footprint (EF) 3.0 method was used in order to quantify the environmental impacts of the goods and services included in the tool. This method was chosen because it provides a comprehensive and standardized approach for assessing environmental performance across multiple impact categories, ensuring comparability and reliability. EF 3.0 is based on life cycle assessment (LCA) principles, incorporating specific characterization factors that allow for the detailed quantification of environmental impacts. This ensures that the results are both scientifically robust and aligned with EU methodological recommendations. In the tourism sector, where diverse activities and supply chains contribute to environmental impacts, EF 3.0 enables a more holistic evaluation by considering both direct and indirect impacts throughout the life cycle of goods and services used in tourism establishments. Its structured approach facilitates the identification of key environmental hotspots, providing actionable insights for decision-makers. Furthermore, its sector-specific applicability and compatibility with environmental certification schemes enhance its relevance for measuring and improving sustainability in tourism businesses.
For the selection of the environmental impact categories, we follow the procedure set out in the PEFCR (Product Environmental Footprint category rules) guidance. This approach connects directly to natural capital and sustainability by addressing key environmental pressures while aligning with SDGs, particularly climate action, water management, and responsible consumption. The PEFCR guidance provides a list of the 16 recommended impact categories to be used in order to estimate the EF of a product. Then, several criteria of the PEFCR guidance should be considered to choose the most relevant impact categories. The tool excluded toxicity categories (human toxicity-cancer, human toxicity-non-cancer, and freshwater ecotoxicity), as they are typically more relevant to industrial sectors with direct emissions and chemical processes, rather than the tourism sector. Previous studies, such as those by [22,23], have shown that the environmental impacts of tourism are predominantly linked to resource consumption (energy, water) and waste generation, with significantly lower relevance of toxicity-related impacts in comparison to sectors like manufacturing or agriculture.
Tourism tends to generate impacts in areas such as climate change, water use, and waste generation, while toxicity tends to be more related to intensive industrial processes. Moreover, four other impact categories were also excluded (ionizing radiation, eutrophication terrestrial, land use, and resource use: minerals and metals) because they are not very relevant to the tourism sector [39].
In addition, the tool seeks to reach the Sustainable Development Goals (SDGs), as tourism has a significant influence on the global economy and can positively or negatively impact local communities, the environment, and the economy in general [7]. To quantify this ‘significant influence’, the tool evaluates a range of key indicators that are aligned with the SDGs, including but not limited to environmental impacts (such as carbon footprint, water usage, and waste generation) and social-economic factors (such as employment, income generation, and community engagement). These indicators are derived from established methodologies such as life cycle assessment (LCA) and follow internationally recognized guidelines and standards, ensuring that the impact measurement is comprehensive, reproducible, and consistent with global sustainability frameworks.
Figure 5 illustrates the connection of the selected impact categories with the SDGs, highlighting the strategic importance of their integration in the tourism industry.
In this way, the tool developed calculates the environmental impact generated in these three sub-sectors, considering nine impact categories: acidification (AP); climate change (CC); eutrophication, freshwater (FEP); eutrophication, marine (MEP); ozone layer depletion (ODP); particulate matter (Ri); photochemical ozone formation, human health (POF); resource use, fossil (FRD); and water use (WDP).

2.1.3. Calculation of the Environmental Impacts of the Three Sub-Sectors in the Greentour Tool

The impact of these sub-sectors is obtained automatically from the Greentour inventories and the emission factors (EFs) of the commercial database. These EFs have been linked from an excel file to the Greentour tool by means of the project’s computer equipment, and thus, the environmental impacts have been obtained directly for each establishment of the three sub-sectors analyzed. In the tool, environmental results are generated directly from inventory data, which include accommodation, restaurants, and tourist activities, along with the corresponding impact categories. The calculations account for the number of tourists per establishment, providing results both at the total level and per visitor. The tool is linked to an Excel database with predefined emission factors, which, combined with input data, allows for automated impact assessment. It also incorporates geographical differences, such as variations in energy mixes and food-related processes in Spain and Portugal. Rather than applying uniform coefficients, the tool integrates location-specific variables and follows life cycle assessment (LCA) methodologies to ensure a comprehensive evaluation of tourism-related environmental impacts. These results are presented in detail through both bar charts and tables, allowing for a thorough analysis of each impact category. These results are also presented by the contribution of each process (energy sources; water; indoor and outdoor maintenance and cleaning; food and beverages; and other products). Establishment managers can visually access their environmental results by entering their username and password into the tool.
The results obtained on the website are obtained on an annual basis and by functional units (reference unit), which are different depending on the sub-sector, as explained above. Figure 6 shows how the owner of the establishment obtains the results in the tool by accessing the website.

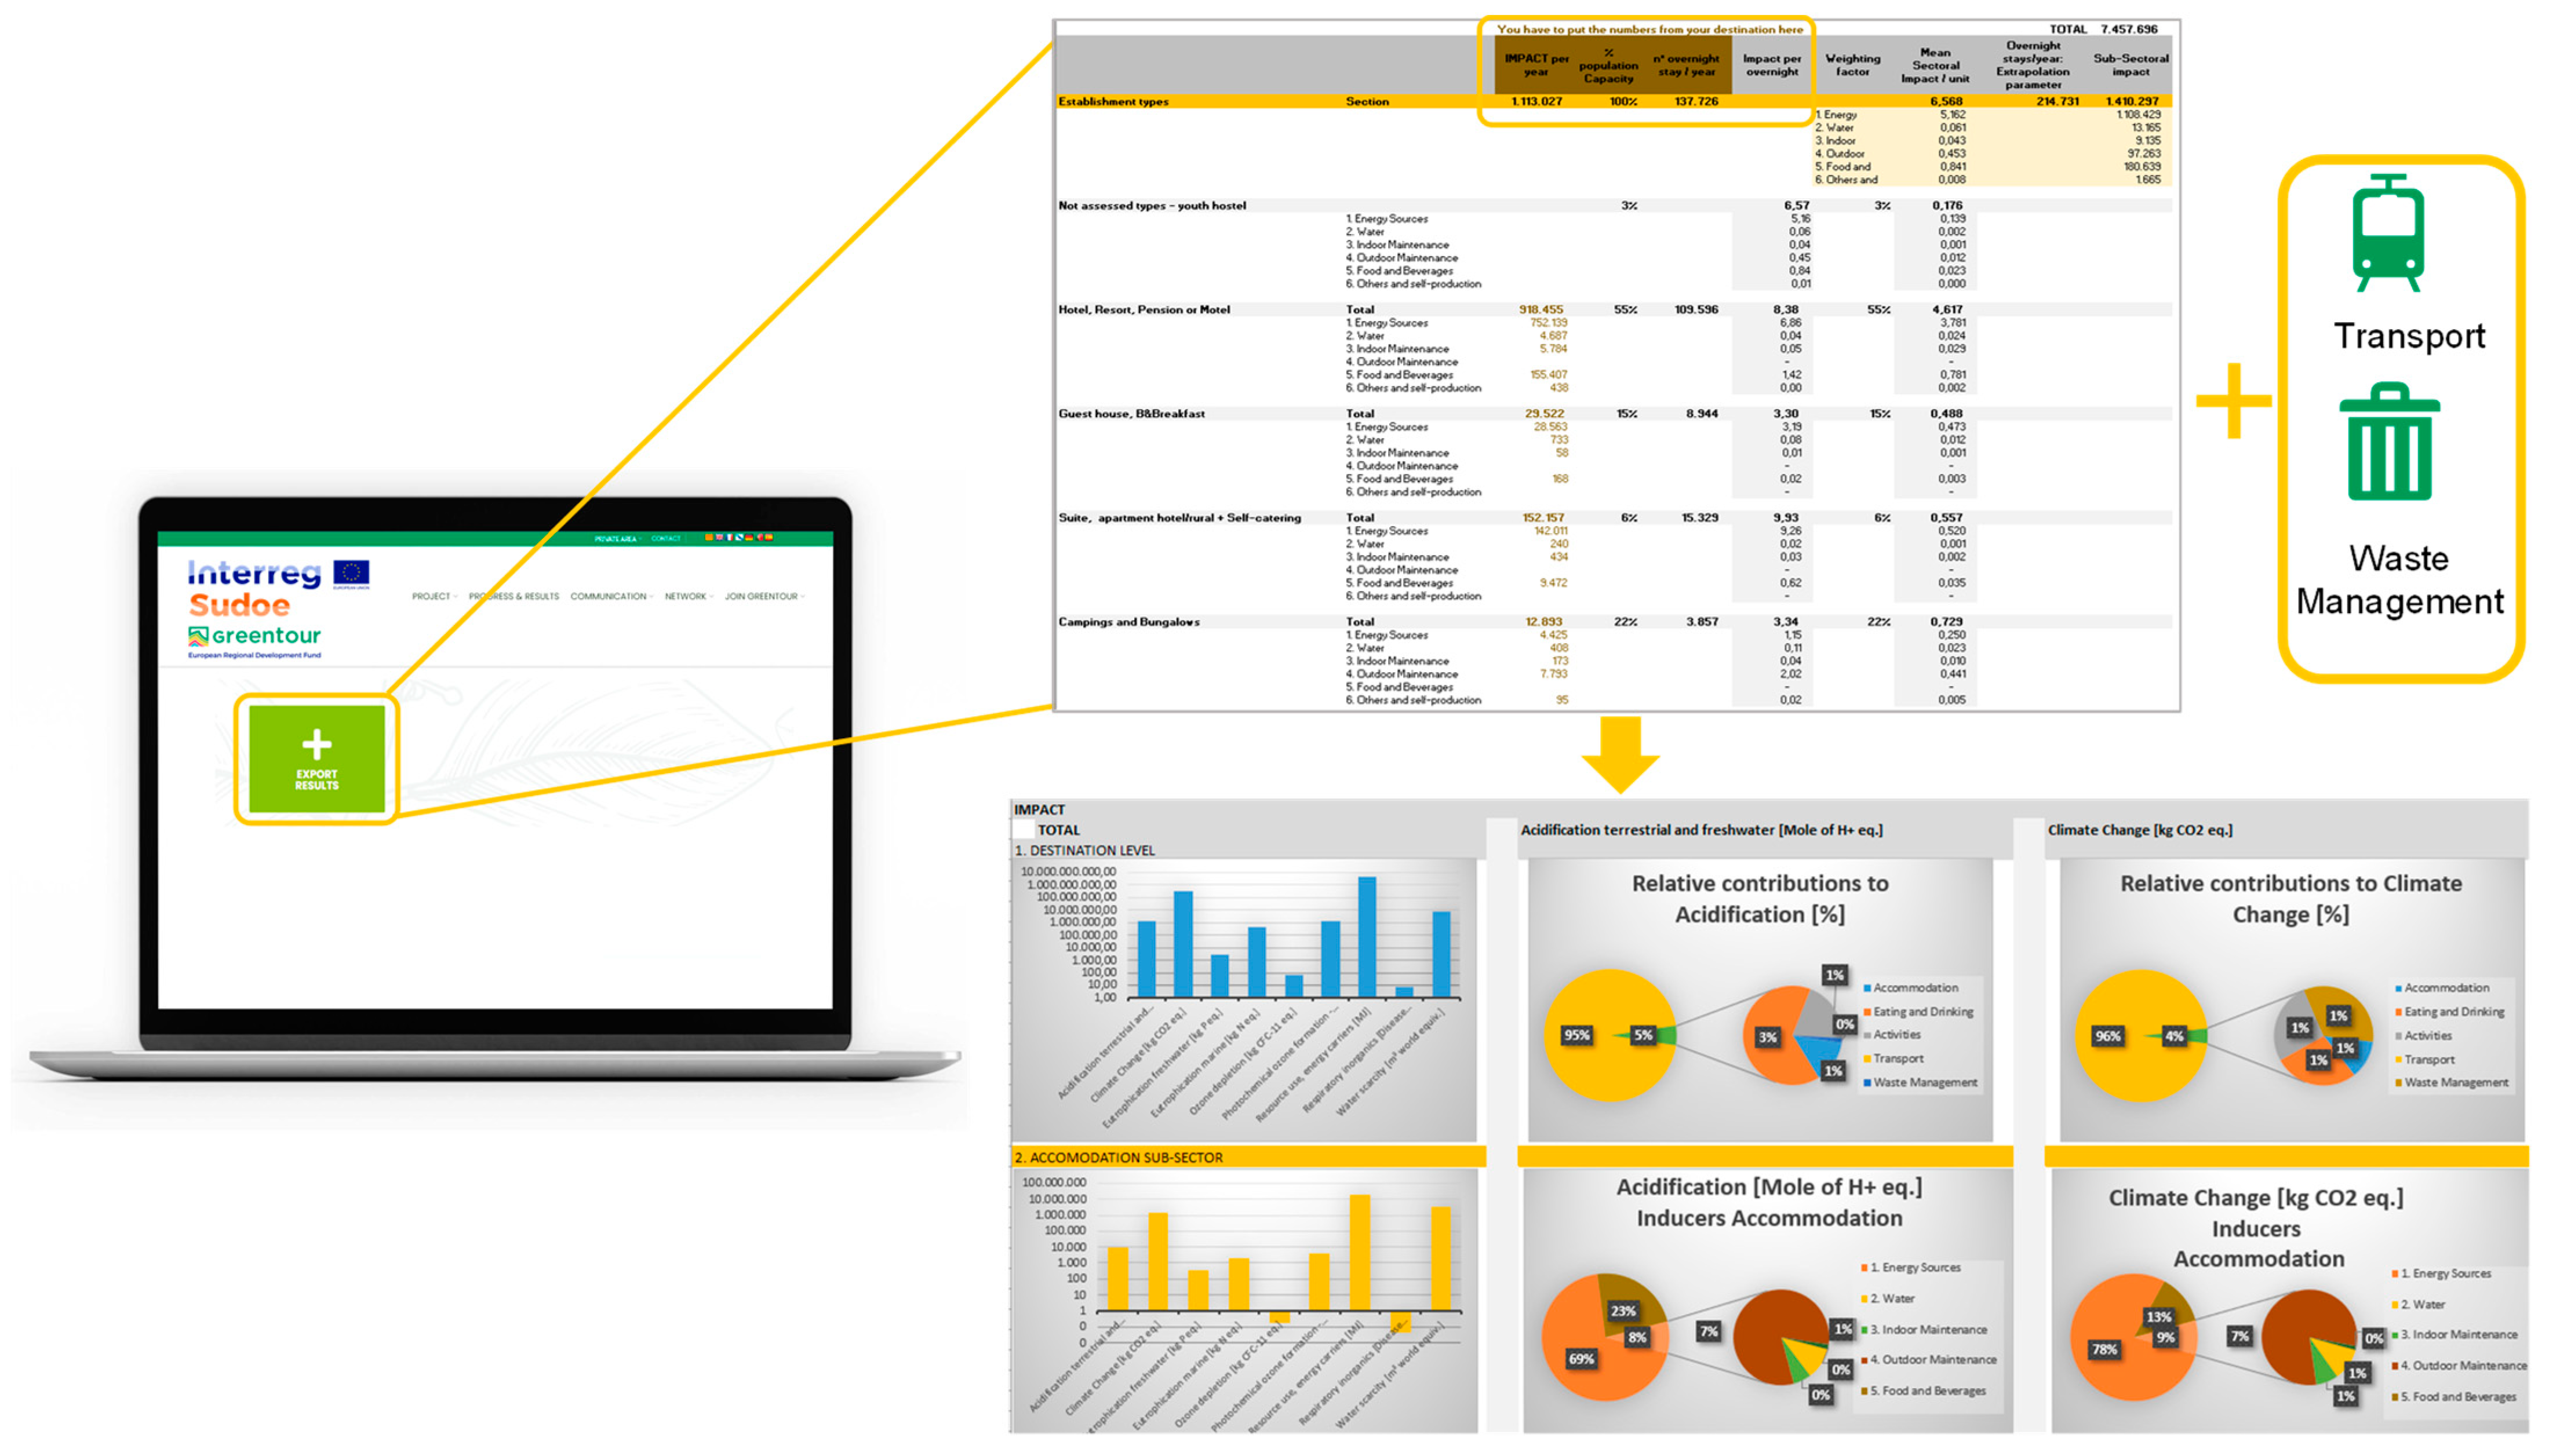
2.2. Extrapolation Procedure: Environmental Impacts of Destinations

In addition to assessing the environmental impacts of individual establishments, the tool enables impact estimation at the destination level through an extrapolation procedure that is not performed directly within the tool but must be carried out manually by a technical partner to ensure accuracy and consistency. To achieve this, the environmental impacts of accommodations, restaurants, and tourist activities are exported to an Excel file via the Greentour website, including data for the nine environmental impact indicators, as well as information on the capacity of each establishment and the number of customers, measured in overnight stays for accommodations. Additionally, tourism offices provide key data on the total number of accommodations, restaurants, and tourist activities within each destination, which are essential for assessing the representativeness of the sample included in the designed tool, as it may not cover all establishments within a given destination.
It is important to highlight that, when analyzing individual establishments, the environmental tool does not account for tourist transportation from their place of origin to the hotel, restaurant, or activity, nor does it assess the waste management practices of each establishment. However, at the destination level, these aspects are considered using data provided by tourism offices, including monthly waste generation and transportation statistics for tourists arriving and departing. All this information is detailed in Section 2.2.1 and Section 2.2.2. The results are standardized using a common reference unit—the tourist—ensuring consistency in evaluating the three sub-sectors: accommodations, restaurants, and leisure activities.
For the extrapolation process, predefined emission factors from various sources, such as Ecoinvent and EMEP/CORINAIR, are used, adjusted based on the specific characteristics of each destination and combined using a statistical approach represented mathematically by the following equation:
F E f i n a l = ( F E i ·   P i )
where:
  • F E f i n a l   is the resulting emission factor.
  • F E i represents the emission factor from each data source.
  • P i   is the weight or relative contribution of each source in the final calculation.
This equation is applied in the Excel file where emission factors for the nine environmental impact indicators are compiled, and the final extrapolated results are obtained based on the emission factors, the population capacity of accommodations, restaurants, and leisure activities in each destination, and the number of customers or overnight stays.
Once these elements are integrated, the environmental impacts for the nine indicators are calculated in Excel and not in the environmental tool, after which the processed data are uploaded to the web platform for destination-wide environmental impact assessment.
By following rigorous validation steps and criteria, the data used in the analysis remain robust, reliable, and consistent with recognized methodologies, ensuring that the results obtained are coherent and comparable across different destinations (Figure 7).
A key limitation of the tool is that, while establishments can automatically obtain their environmental impact results, destination-level assessments require additional calculations and external data, as the impacts of transport and waste management are not directly available at the establishment level and must be estimated using supplementary methodologies that require technical personnel to process data from local authorities, such as tourism offices and municipalities, making destination-level calculations more complex and dependent on external data availability.
However, despite these challenges, the methodologies applied have been validated across multiple tourism destinations with distinct characteristics, and the results obtained are consistent with findings from the relevant literature and previous environmental studies, confirming their reliability and applicability across diverse tourism contexts.

2.2.1. Transport of the Destinations

One of the most significant environmental concerns in the tourism sector is origin–destination–origin travel. The International Air Transport Association (IATA) reports that the aviation industry accounts for between 2% and 3% of global carbon dioxide (CO2) emissions [40]. Similarly, the International Transport Forum (ITF) notes that road transport is responsible for a substantial portion of tourism-related emissions, including air pollution and noise pollution [41].
For the calculation of the environmental impact of the transport of tourists, the transport to the destination, the origin of the tourists, and the means of transport used (car, bus, train, plane, or boat) must be reported and sent in by the tourist offices or similar organizations. In the case of the car, the distance is calculated assuming that tourists depart from the centroid (geometric center of the country/region) of the country/region of origin using the Google Maps application [42]. To determine the distances by plane and by boat (in km or nautical miles), the websites “Distance calculator” [43] and “Distance to sea” [44], respectively, are used. The distances have to be multiplied by two, as the tourist’s outbound and return journeys are accounted for. The environmental footprint of the transport of tourists is calculated using the emission factors from the Ecoinvent database.

2.2.2. Waste Treatment of the Destinations

Establishments such as hotels and restaurants normally do not measure their solid waste generation. The only available waste data are limited to the municipal level for inhabitants and tourists. Therefore, the additional volume of municipal solid waste (MSW) generated annually due to tourism was calculated based on the concept of “equivalent tourist”. According to this methodology, “equivalent tourist” is defined as a tourist whose one-day stay represents the fraction of a full-time resident (1/365), which is a standard way of converting the impact of tourists on an annual basis to facilitate its comparison with the resident population. In this way, different methods for calculating the number of tourists can be employed, distinguishing between direct and indirect methods. The former uses several data sources, such as population censuses and tourism and mobility statistics. The indirect approach relies on data related to the behavior of residents and its variation over time, such as the consumption of drinking water or the waste generation, depending on the high, medium, and low season [45].
In this case, we employ an indirect method in which the generation of municipal waste is used to calculate, as a proxy, the total number of people staying in a location, including visitors who do not spend the night there. To employ this method, we evaluate the monthly generation of per capita MSW, taking as reference the month with the lowest amount of MSW. This criterion assumes that the reference month, with the lowest waste generation, had “no tourists”, with all waste being generated by permanent residents. In this sense, the total number of inhabitants is obtained by dividing the MSW quantity of each month by the reference per capita MSW. Additionally, the equivalent number of tourists is given by the difference between the total inhabitants per month and inhabitants in total.
Once the ratio between tourists and the total population is calculated, it is possible to estimate the amount of waste corresponding to the tourists. Consequently, the higher the waste generation at a specific time in relation to the reference month, the greater the number of tourists during that period.
In summary, this methodology gauges the number of tourists visiting a site by examining fluctuations in the volume of waste generated over the course of the year. Figure 8 offers a schematic representation of the aforementioned steps.

3. Application of the Tool to Four Case Studies of SUDOE Area

3.1. Description of the Destinations to Test the Functionality of the Tool

Within the framework of the Greentour project, four quite different tourist destinations were chosen to test the tool (Figure 9). The SUDOE region, which includes Spain and Portugal, among other destinations, was chosen as a pilot area due to its geographic, economic, and environmental diversity. This region represents a variety of tourism contexts—ranging from pilgrimage routes to historic cities and coastal destinations—allowing for a comprehensive assessment of the tool’s applicability.
  • Camino Lebaniego (Cantabria, Spain): This 72.73 km pilgrimage route has gained increasing popularity, attracting around 75,000 pilgrims annually from around the world to the Monastery of Santo Toribio de Liébana, where the “Lignum Crucis”, the largest surviving fragment of the Cross of Christ, is located. Recognized as a UNESCO World Heritage Site since 2015, the route generates over EUR 10 million annually in economic spillover, with pilgrims spending between EUR 40 and EUR 60 per day. This economic impact contributes significantly to approximately 3.5% of Cantabria’s regional GDP [46].
  • Guimarães (Braga, Portugal): Guimarães, recognized as the “cradle of Portugal”, attracts around 1.5 million tourists annually, with a significant influx of international visitors. The city’s tourism-generated economic spillover is estimated at EUR 150 million per year, contributing to about 6% of Braga’s local GDP. As a UNESCO World Heritage Site since 2001, Guimarães is a key economic driver for the region, particularly in cultural tourism, thanks to its well-preserved medieval architecture and vibrant historical character [47].
  • Rías Baixas (Galicia, Spain): The inner and coastal areas of the province of Pontevedra, which include its three bays—Vigo, Pontevedra, and Arousa—are a highly visited destination in Galicia, Spain. With over 3 million tourists annually, Rías Baixas is one of the region’s most popular tourist destinations. The primary motivation for 39.7% of visitors is to explore the region’s natural landscapes, beaches, and cultural attractions like museums, festivals, and the renowned Saint James Way. The economic spillover from tourism in the region is estimated at EUR 1.5 billion annually, with an average tourist spending EUR 55. Tourism contributes around 5% to the GDP of the province of Pontevedra, with the region’s offerings in nature, gastronomy, and culture playing a crucial role in its economic success [48].
  • Lloret de Mar (Catalonia, Spain): Lloret de Mar is a lively Mediterranean beach town in the Costa Brava, located just 75 km from Barcelona and 40 km from Girona. The town is renowned for its excellent beaches, coves, and vibrant nightlife, including bars, nightclubs, and restaurants. Receiving over 2.5 million tourists annually, Lloret de Mar is one of the most popular destinations on the Costa Brava. The economic impact generated by tourism reaches EUR 1.2 billion per year, with an average tourist spending EUR. Tourism accounts for approximately 7% of the GDP of the Girona region, with beach tourism driving the economy year-round [49].
Table 4 shows the total number of establishments in accommodation, food and beverage services, and leisure activities evaluated for each touristic destination. On one hand, the 163 establishments were used in the tool to verify its functionality. The inventory data from these establishments were also used to extrapolate information for each destination and to calculate the environmental impacts of these four destinations.
To improve the representativeness of the sample and based on the assumption that different types of establishments within the same category may generate varying environmental impacts, a set of categories and subcategories for the establishments has been considered, depending on their positioning in terms of quality–price (Table 5).
In the Camino Lebaniego destination, the sample of accommodation included six categories. Campsites were over-represented, while hotels and self-catering were under-represented. In the food sector, the sample had more bars/cafés (57.8%) than restaurants (42.2%), reflecting the difficulties in collecting data on restaurants. Adventure tourism predominated. Overall, the representation of accommodation and leisure was acceptable, although there was a bias in the food sector due to the under-representation of restaurants.
In the Rías Baixas, the sample covered most accommodation categories, with hotels (54.2%) and campsites (42.6%) being well represented. In the food sector, the sample focused on restaurants (98%). Leisure activities showed a high representation of recreational activities (95.2%) and a very low representation of cultural and natural activities (4.7%). In general, accommodation and food categories were well represented, but there was a bias towards recreational activities.
In Lloret de Mar, the sample included hotels (86.9%) and campsites (13.1%). However, categories like self-catering were not represented. In the food sector, only bars/cafés were included. The leisure sector lacked representation of recreational tourism and focused mainly on cultural tourism. Overall, accommodation was well represented, but the food and leisure categories had significant gaps.
In Guimarães, four of the five accommodation categories were represented. In the food category, restaurants were well represented. In leisure activities, recreational and health tourism were under-represented, while events and conventions were over-represented. In general, accommodation and food were well represented, but leisure activities showed some bias.
The representativeness analysis indicated an overall acceptable representation in the accommodation and food sectors across the studied destinations, with notable biases in certain subcategories, particularly in the leisure sector.
In the Greentour tool, there is a progress and results section where the results of the four analyzed destinations are shown. This is possible thanks to the Greentour tool and the subsequent extrapolation for the calculation of the environmental impact of the transport and waste management of each destination (Figure 9). The results obtained correspond to 2019. The developed tool is now being applied to 2023 and 2024 to assess year-over-year changes in the same establishments and to determine if their environmental performance has improved. Some establishments have already started using it for this purpose, and a future project will focus on comparing results across multiple years and expanding its application to more countries worldwide. For the rest of the years, these data will be different, and it will be necessary to carry out this data collection process again for the destinations to be evaluated. This could be applied to any other destination that would have data on accommodation, catering and tourist activities, as well as transport and waste management.
Additionally, it is important to highlight that the tool allows establishments to view their automatic results in both table and bar chart formats. Furthermore, it offers a radar chart that compares the environmental impacts of the establishment with those of another within the same destination, as well as with the SUDOE destination average. This enables a clear assessment of the establishment’s environmental profile in relation to similar establishments, both within the same destination and in other destinations (Figure 10).
The tool was tested to calculate the nine environmental impacts mentioned above for the three sub-sectors (accommodation, eating and drinking, leisure activities) and at a destination level, including those sub-sectors and also transport and waste management. In this way, the environmental results of each tourist destination are addressed and it helps to verify that the tool has worked for these four different tourist destinations. The results of the of the four destinations (Rias Baixas, Camino Lebaniego, Guimarães, and Lloret de Mar) were normalized based on the emissions of an average European citizen in 2019 according to the EF 3.0 data to make easier to create their graphical comparison (Figure 11).
The results indicate that the FRD (fossil resource depletion) category exhibits the highest impact across all destinations, highlighting a significant reliance on non-renewable energy sources. This suggests that tourism-related activities in these areas are heavily dependent on fossil fuels, which could be linked to transportation, energy consumption in accommodations, and general infrastructure operations. In contrast, ODP (ozone depletion potential) impacts remain relatively similar across all destinations, aligning with the European average. This consistency indicates that tourism-related activities do not significantly influence this category compared to other sectors. When analyzing individual destinations, Lloret de Mar consistently shows the highest environmental impact across most categories, particularly in AP (acidification potential), FEP (freshwater eutrophication potential), MEP (marine eutrophication potential), Ri (resource impact), WDP (water deprivation potential), and FRD. These elevated values suggest intensive resource consumption and emissions, likely due to high tourist density, infrastructure demands, and water consumption patterns. Camino Lebaniego follows a similar trend, but with slightly lower impacts than Lloret de Mar. However, its values in CC (climate change), POF (photochemical ozone formation), and FRD remain above average, indicating a notable carbon footprint. This is attributed to the energy demands associated with transportation and accommodation along the pilgrimage route. Conversely, Rías Baixas and Guimarães present lower environmental impacts across most categories, generally approaching the European average. This suggests a different resource management strategy, potentially due to lower tourism intensity, sustainable infrastructure, or different tourist profiles with less resource-intensive behaviors. To contextualize these results, the environmental impact profile of an average European citizen in 2019, derived from the Ecoinvent database, is used as a benchmark. This allows for a comparison between the environmental footprint of a tourist visiting these destinations and that of a resident in Europe. The detailed numerical values supporting this comparison can be found in Table S1 of the Supplementary Materials. In the following section, a more in-depth analysis of the carbon footprint of each destination provides further insights into their specific contributions to environmental impacts.

3.2. Analysis of the CC Indicator for the Four Destinations

Table 6 presents the impacts on the CC impact category for four destinations in the SUDOE area: Camino Lebaniego, Cantabria, Spain; Guimarães, Portugal; Rias Baixas, Galicia, Spain; and Lloret de Mar, Catalonia, Spain, per year and tourist.
In the year 2019, 126,222 tourists visited Cantabria and completed the Camino Lebaniego. Transportation was the main contributor to CC, accounting for 76% of CO2 eq. emissions. Among these journeys, tourists arriving in Spain by plane from Australia (44.8%) or the United States of America (21.08%), due to their distance, made a greater contribution. Within road transport, Spain (59.14%), France (21.65%), and Portugal (19.21%) were the countries contributing the most. Similar smaller contributions of around 8% were seen for the accommodation, eating and drinking, and leisure activities (6%) sub-sectors. Finally, waste management made the smallest contribution to CC in this destination (2%).
For the calculation of the impact per tourist in Guimarães, we employed the total amount of tourists, which was 941,803 in 2019. Transportation was by far the largest contributor, with 96% of the total impact, of which 61% was due to air transport, mainly from countries such as Brazil and the United States of America. Within road transport, Spain and France were the countries contributing the most, with 15 and 10% of the total impact, respectively. The remaining sub-sectors had relatively small contributions of around 1% each. The impact of waste management came mainly from mixed urban waste landfilling.
In Rias Baixas, there were 1,758,054 tourists in the year 2019. One of the most significant findings of this study underlines the key role of transport in the assessment of the impact of the tourism sector on CC. Transport appeared as the main contributor, accounting for a substantial 79% of the total impact and standing as the predominant source of CO2 emissions associated with tourism. It is noteworthy that 86% of visits to the region stemmed from domestic tourism, predominantly relying on cars as the mode of transportation. The remaining percentage comprised international tourism, with France (2%) and Portugal (2%) being the main contributors, primarily reliant on air travel for their visits. In addition, the study identified a significant impact of the eating and drinking sub-sector, although to a lesser extent, accounting for 11% of the overall impact. Accommodation and leisure activities also played an important role, contributing 6% and 4%, respectively, to the overall impact. Finally, waste management made a negligible contribution to the overall impact.
Finally, in Lloret de Mar in 2019, the total number of tourists amounted to 1,303,651. Transportation was the largest contributor, with 60% of the total impact, and 67% of this impact was due to air transport mainly from countries such as Russia, with a contribution of 47.25%. Within road transport, Spain and Belgium were the countries contributing the most, with 77% and 16% of the total impact, respectively. The accommodation sub-sector represented 14% of the total impact, and eating and drinking accounted for 26%. Finally, the waste management stage and leisure activities had the smallest contributions to CC impact in this destination (less than 1%).
The differences in the carbon footprint between the destinations Camino Lebaniego (176.94 kg CO2), Guimarães (323.20 kg CO2), Rías Baixas (152.46 kg CO2), and Lloret de Mar (221.05 kg CO2) are largely due to the different types of tourism that each place attracts and the available infrastructure. Camino Lebaniego is focused on hiking and contact with nature, which explains its smaller footprint. Guimarães, with its urban cultural tourism and a higher influx of visitors, generates a larger carbon footprint due to the increased demand for transportation, energy consumption in historic buildings, and dense urban infrastructure. In contrast, Lloret de Mar, despite hosting mass sun-and-beach tourism, likely benefits from infrastructure optimized to handle large volumes of tourists more efficiently, which helps to moderate its carbon impact. Additionally, tourists in coastal destinations like Lloret de Mar may rely more on walking or cycling, reducing transportation-related emissions compared to urban areas like Guimarães, where transport options contribute significantly to the overall footprint.

3.2.1. Camino Lebaniego Destination

For the Camino Lebaniego destination, in the accommodation sector, energy consumption is the primary contributor (56.67%) due to electricity demand within establishments (48.52% of the total impact) and, to a lesser extent, diesel use from vehicles (6% of the total impact). Food consumption, particularly dairy products, accounts for 40.53% of the impact, with other items showing negligible contributions. For the eating and drinking sub-sector, food and beverages represent 69.69% of the impact, while electricity consumption contributes 24.31%. Beef, as part of red meat, emerges as the primary hotspot (40.16% of the total impact), mainly due to methane emissions from ruminants’ enteric fermentation and the significant energy and water consumption involved in livestock rearing. Beverages contribute an additional 21.20% to the food and drink impact, with other items contributing minimally. In the leisure activities, five tourist activities were evaluated in the Camino Lebaniego area. Four involved climbing and active tourism, while one focused on horseback riding. The analysis highlights that food and drink consumption is the main concern due to the outdoor nature of the activities, especially horseback riding. Animal feed contributes to 77.89% of the total impact. Energy consumption results in an emission of 299,546 kg CO2 eq./year, accounting for 21.87% of the impact. Tables S2–S4 (Supplementary Materials) show in detail the inventory data for each sub-sector and for each input of the climate change impact category.

3.2.2. Guimarães Destination

In the accommodation sub-sector, the main impact is the consumption of energy (78.60% of the impact), mostly electricity, followed by the consumption of food and beverages (12.81% of the impact), mainly dairy products, red meat, and beverages. Outdoor maintenance accounts for 6.90% of the CC impact, whereas the remaining items have negligible contributions. In the eating and drinking sub-sector, the consumption of food and beverages accounts for 91.82% of the CC impact, mainly red meat (53.85%), fish and shellfish (24.32%), and milk and dairy (6.03%). The consumption of energy, mainly electricity, contributes to 7.99% of the CC impact. The other items have negligible contributions. Finally, leisure activities in Guimarães include art museums, sightseeing tours of the city, thermal baths, and a festival in a sports pavilion in the city. In this sector, 97.18% of the CC impact of leisure activities is due to energy consumption, representing electricity demand as 54.18% of the total impact, and natural gas and gasoline consumption as 34.34% and 8.66%, respectively. The remaining items have negligible contributions. Detailed inventory data for each sub-sector and input related to the climate change category are presented in Tables S5–S7 (Supplementary Material).

3.2.3. Rias Baixas Destination

The analysis of the accommodation, eating and drinking, and activities sub-sectors reveals the primary hotspots of their environmental impact. In the accommodation sub-sector, energy consumption is the dominant contributor, accounting for 76.52% of the total impact, with fossil fuel dependency, particularly electricity (42.57%), being the main hotspot. Stationary fuels like propane (18.23%) and natural gas (14.17%) also have significant impacts. Additionally, food and beverage consumption (14.97%), especially meat in catering services and water usage (7.17%), are notable contributors, whereas maintenance and cleaning have a negligible effect. In the eating and drinking sub-sector, 89.97% of the impact is due to food and beverage consumption, with red meat being the largest contributor (58.53%), followed by white fish (10.62%) and dairy products (9.56%). Energy use, primarily electricity, adds around 10%, while water consumption and maintenance have minimal effects. For leisure activities, energy sources dominate, contributing 84.30% of the total impact. Electricity is the largest factor (57.39%), with natural gas (19.99%) and diesel (6.41%) also contributing. Food and beverages (8.63%), especially drinks at festivals, are also impactful, while water consumption and maintenance have little effect on the overall impact. This analysis highlights the reliance on non-renewable energy as a significant factor across all sectors, contributing to carbon emissions.
Tables S8–S10 (Supplementary Materials) show in detail the inventory data for each sub-sector and for each input of the CC impact category.

3.2.4. Lloret de Mar Destination

Accommodation plays a significant role in the overall impact, contributing 14% to the total environmental impact. The main sources of environmental impact for accommodation establishments are the consumption of food and beverages (49.65%), highlighting the milk and dairy products category and energy sources (46%), mostly electricity with 27.27% of the impact and diesel with 12.25%. The remaining items have negligible contributions. The study reveals that eating and drinking contribute significantly to the carbon footprint of tourism, comprising 26% of the overall impact. This is mainly due to emissions associated with the production, distribution, and preparation of food and beverages consumed by tourists, which represents 88.35% of the total impact. Notably, dairy products, fermented beverages (wine, beer, cider), and single-use products (napkins) have a noteworthy impact within this category. The other items have negligible contributions. Finally, energy consumption dominated the CC impact for leisure activities (archaeology and sea museums and visits to the city gardens), which contribute 97.78% of this impact. Electricity consumption plays a major role in this impact, representing 49.84% of the total impact. The remaining items have negligible contributions. Tables S11–S13 (Supplementary Materials) provide detailed inventory data for each sub-sector and each input in climate change category.

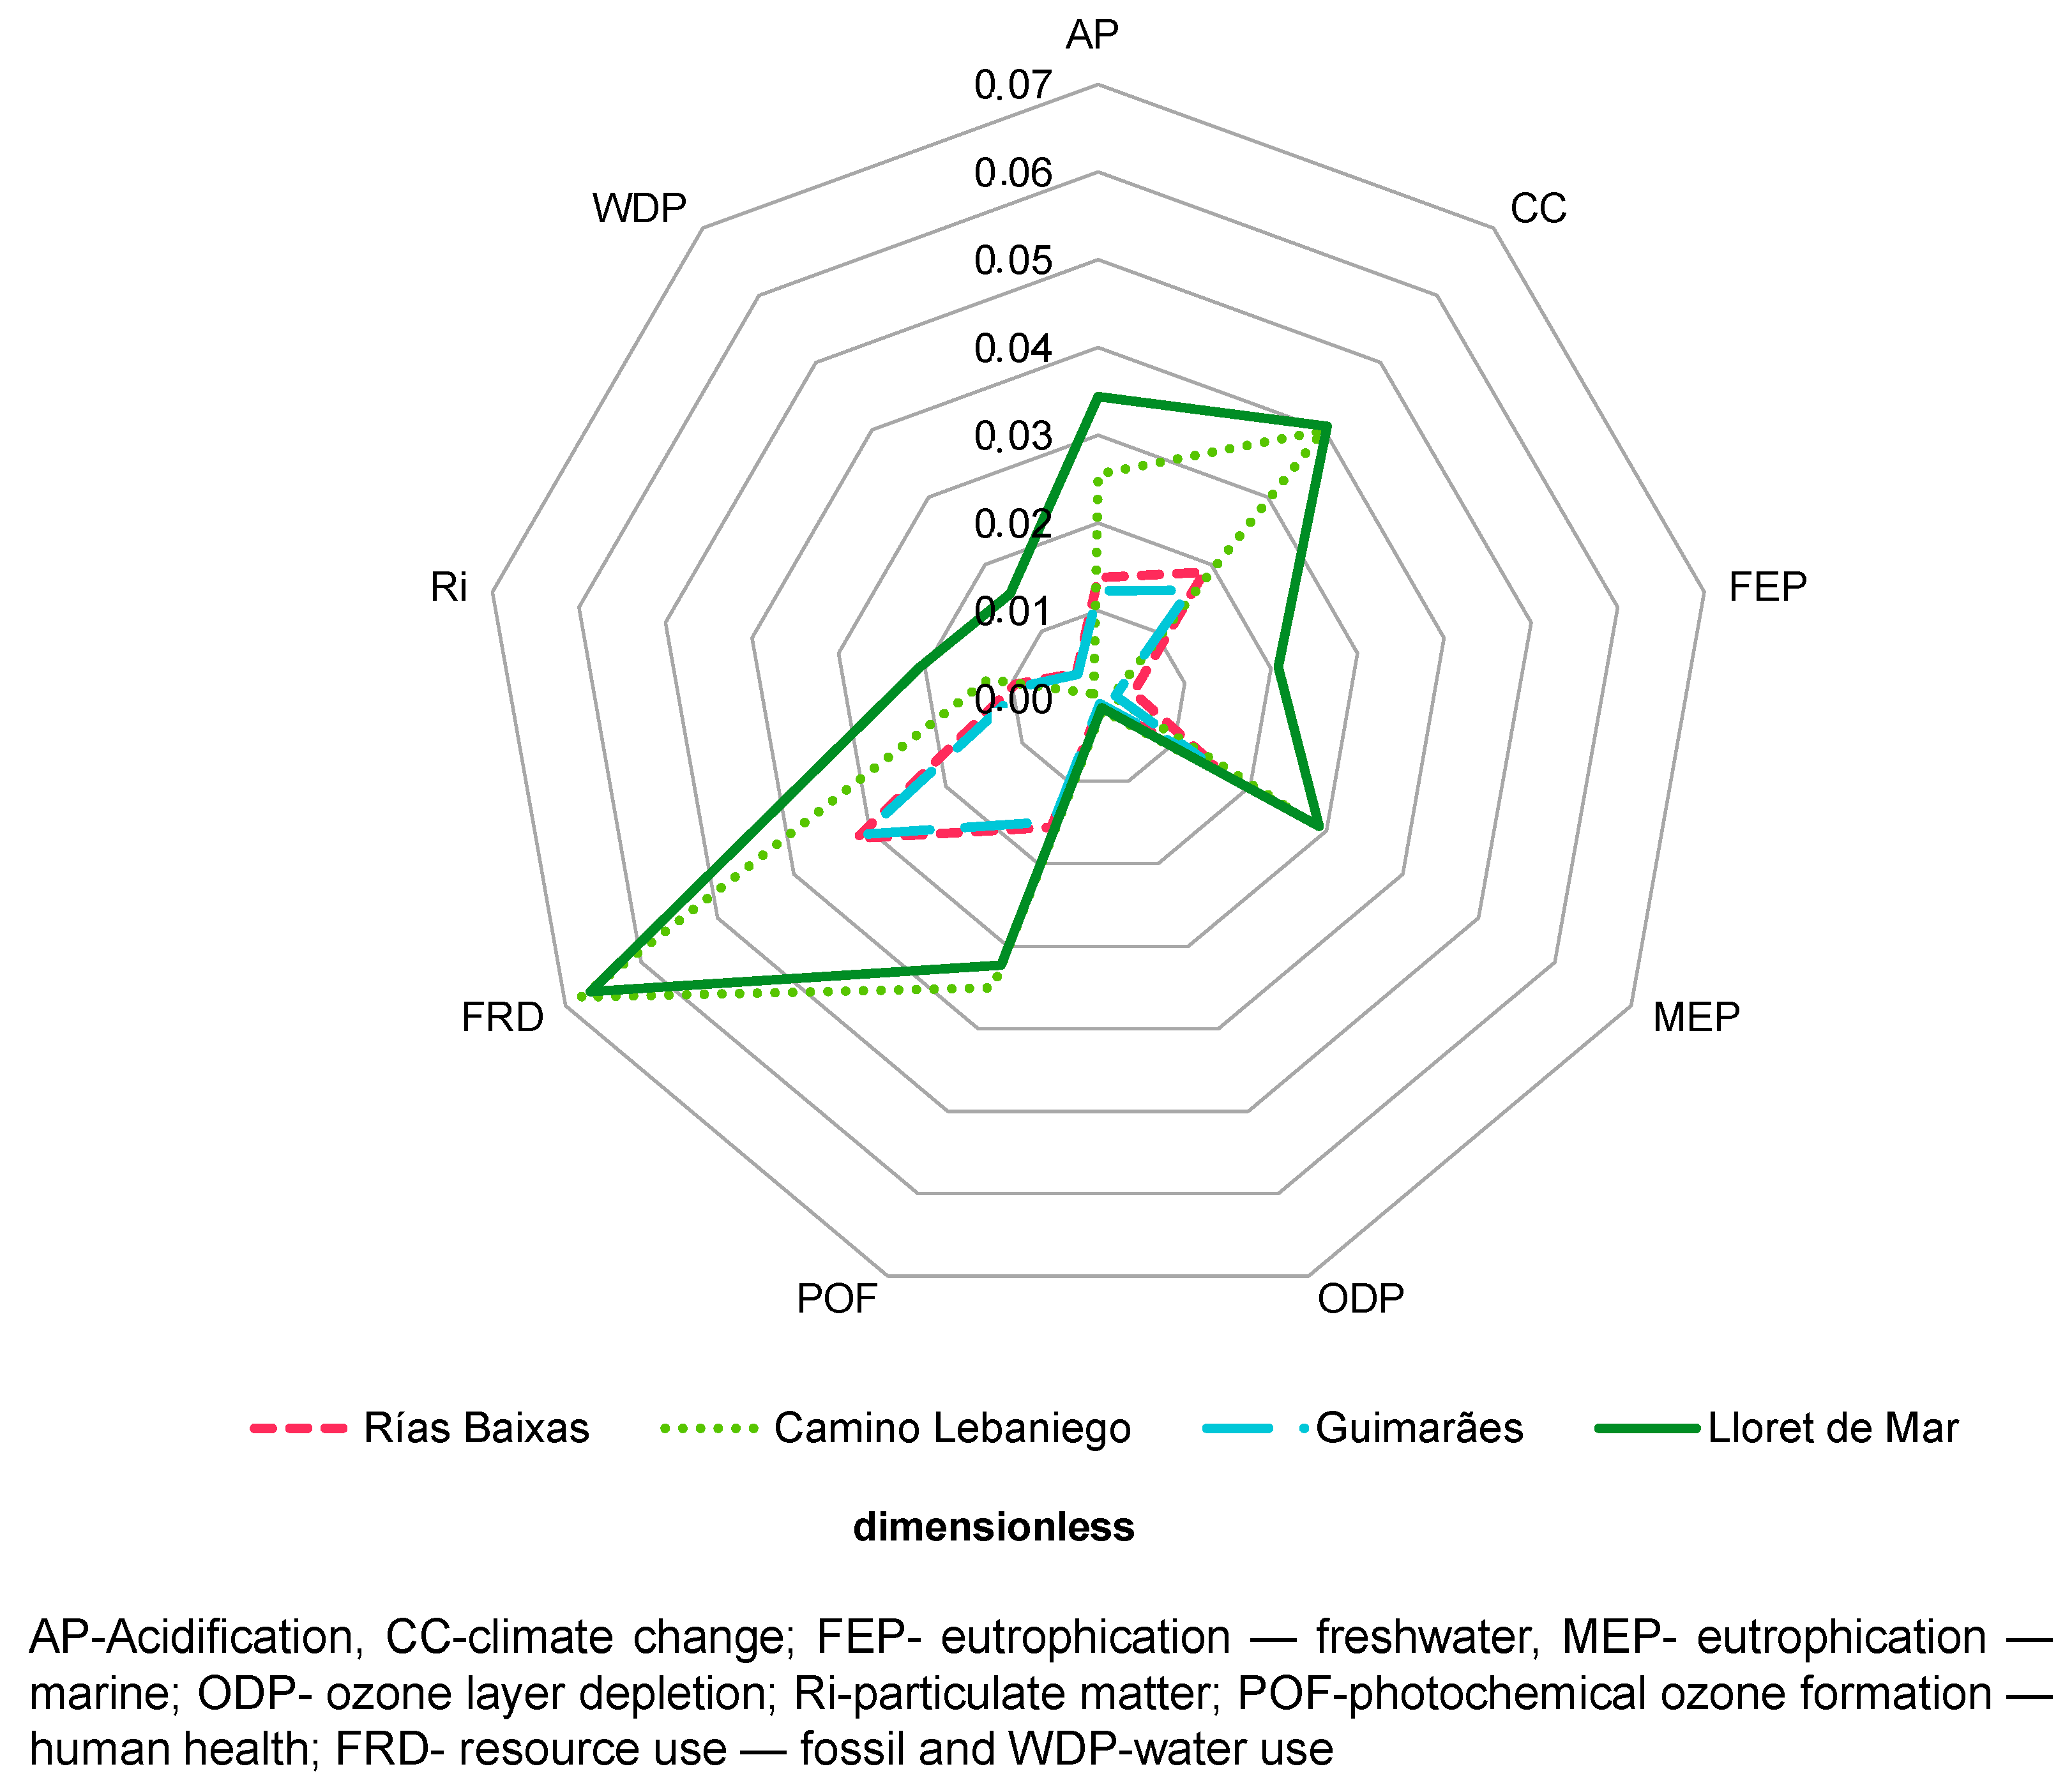
3.3. Comparison of the Results Obtained in the Destinations with the Bibliography

To further compare the results obtained with the Greentour tool to the more recent literature, the findings are consistent with broader research on tourism’s environmental impact, especially in the areas of transportation, food, and accommodation. Most studies agree that transportation, particularly air travel, is the largest contributor to the carbon footprint of tourists, which matches Greentour’s findings, where transportation accounts for 60–96% of the total environmental impact. This has been highlighted in recent studies, such as those by [23,50], which underscore that, despite advances in other areas, the high carbon intensity of air travel remains a significant challenge for reducing tourism’s overall carbon footprint.
Additionally, the significant contribution of catering to the overall footprint, ranging from 26% in destinations like Lloret de Mar to 8% in Camino Lebaniego, is also well supported in the literature. Research by [51] emphasizes that food and beverage services, particularly those involving high-impact foods like red meat and dairy, are major sources of greenhouse gas emissions. The results from Greentour further align with this, suggesting that focusing on more sustainable menu options and reducing food waste could significantly lower emissions in this sector.
The footprint contribution from accommodation, varying between 1% and 14%, also mirrors trends in recent studies, which advocate for the adoption of energy-efficient practices and the use of renewable energy in hotels and other accommodations. The literature suggests that implementing sustainable infrastructure, such as improved insulation, solar energy, and water-saving technologies, can greatly reduce emissions from this sector. This is particularly relevant in the context of studies like those from the World Tourism Organization (UNWTO) and UNEP, which have called for greater sustainability efforts within the hospitality industry.
Overall, the values and trends observed using the Greentour tool are consistent with those found in the most up-to-date research, reinforcing the tool’s reliability. The results demonstrate that Greentour can provide accurate and relevant insights into the environmental profile of different tourist destinations, and its findings reflect the major contributors to tourism’s carbon footprint that are well-documented in the literature.

4. Tool Limitations

The development of the Greentour tool faced a number of constraints, most notably the difficulty of data collection for its development. One of the main limitations was the COVID-19 pandemic, since the restrictions derived from the pandemic forced us to delay all data collection from establishments (approximately 6 months), since many had to be in person. This delay, in turn, negatively impacted the operation of the destination data extrapolation tool, the effectiveness of which depended on the completion of data collection.
One of the limitations of the tool is that it does not allow for the direct calculation of the impact of transportation and waste management in tourist destinations. These aspects must be evaluated separately in an Excel file. It would be a significant improvement if tourism offices or the relevant destination administrations could input transportation and waste data directly into the tool, automatically calculating the environmental impact, as is already done with the three current sub-sectors: accommodation, restaurants, and tourist activities.
Finally, another limitation of the Greentour tool is its ability to ensure the durability of the product. Although it has been proven that it is valid for any destination and sub-sector (accommodation, catering and tourist activities), its continuity largely depends on technical support and the validity of the data. Despite the commitment of web designers to the maintenance of the page, it is essential to have a technical team that monitors and solves possible computer problems. Although alliances have been established with tourist offices, tourist destinations, and national and international organizations (such as municipalities, councils, deputations, and research centers) that work on sustainable tourism and environmental protection, a continuous effort is still required to ensure the prolonged use of the tool. Without adequate technical and financial support, the validity and functioning of Greentour could be compromised, despite its potential applicability to any destination.

5. Conclusions

This is the first time that a tool has been developed to calculate the environmental impact of the accommodation, restaurants, and tourism activities sub-sectors using nine environmental indicators (not only the carbon footprint indicator). In addition, this Greentour tool also allows for the calculation of the environmental impact of a tourist destination. For this purpose, a bottom-up approach combined with a top-down approach was applied, applying an extrapolation of the data entered by the tourist establishments and using data provided by the owners of the establishments and tourist offices of the destinations.
The evaluation of four destinations within the SUDOE area, as part of the Greentour project, revealed differences in the carbon footprint per tourist and stay in 2019. The results showed that Rías Baixas had the lowest footprint (152 kg CO2 eq.), followed by Camino Lebaniego (177 kg CO2 eq.), Lloret de Mar (221 kg CO2 eq.), and Guimarães with the highest (323 kg CO2 eq.). These variations are linked to the types of tourism each destination attracts. Camino Lebaniego, focused on sustainable tourism like hiking, has the lowest impact. In contrast, Guimarães, with urban cultural tourism and higher visitor influx, generates a higher carbon footprint. Rías Baixas, with its coastal tourism, maintains a relatively low impact, while Lloret de Mar, known for mass sun-and-beach tourism, falls in the middle due to its higher resource use. According to the Greentour tool, transport has the largest carbon footprint, contributing from 60% to 96% of the total environmental impact, especially in air travel destinations. After transport, catering (food and drink) is the next major contributor, ranging from 26% in Lloret de Mar to 8% in Camino Lebaniego. Accommodation ranks third, with emissions between 1% and 14%. Leisure activities and waste management have a smaller impact, contributing less than 7% and 2%, respectively. Excluding transport, the average carbon footprint across the four destinations is 25.2 kg CO2 eq. per tourist per stay. Electricity also has a significant impact, suggesting that a shift to renewable energy could reduce emissions. Foods like red meat, dairy products, and alcoholic beverages are major contributors to GHG emissions, highlighting the need to explore more sustainable alternatives.
A key limitation in developing this tool was data collection, as large amounts of data were required. While water and electricity consumption were relatively easy to gather, many establishments lacked organized statistics for other areas like food consumption. This limitation introduced a degree of uncertainty in the results, particularly in impact categories where extrapolations were necessary. For example, the reliance on estimated values for food-related emissions may have led to an underestimation or overestimation of the contribution of catering services to the total carbon footprint. Similarly, the absence of standardized data on transportation usage required assumptions based on available information, which could influence the variability observed between destinations. Despite these challenges, the methodology employed—combining a bottom-up approach with a top-down extrapolation—ensures a structured and coherent estimation process. However, the potential discrepancies highlight the need for more granular and systematically collected data in future applications of the tool. Addressing these limitations would enhance the precision of the impact assessments and allow for the incorporation of statistical confidence intervals in future research. Additionally, improving data collection mechanisms, such as direct integration with transportation and waste management systems, could minimize the reliance on assumptions and strengthen the accuracy of results.
Despite this fact, the development of this tool has been achieved, which has made it possible to obtain unprecedented environmental impact data, marking a step towards more sustainable tourism. The resulting strategic tool provides valuable information for both tourism establishments and destination managers (public authorities), facilitating the targeting of efficient strategies to reduce environmental impacts. In addition, it demonstrates that international collaboration can lead to ambitious and effective actions to address the environmental challenges of tourism and promote more sustainable practices. In addition, the tool is robust and flexible, and it is adaptable to any destination or tourist establishment, whether it is accommodation, restaurant, or activity. Its validity has been proven in very diverse destinations, which demonstrates its ability to be applied anywhere in the world and generate its environmental profile through Greentour. This highlights its universal usefulness for assessing the environmental impact in different tourism contexts.
Future research should focus on enhancing the use of this tool beyond the current four destinations, as sustainable tourism has been gaining momentum over the last decade. Specifically, research could explore expanding the geographical coverage to include destinations with varied tourism profiles, enabling a more robust assessment of the tool’s adaptability. Hotels, tour operators, and destinations now have access to a unified, free tool that can facilitate the implementation of science-backed sustainable initiatives and allow for public sharing of their impact data. This would make it easier for travelers to make responsible choices. Additionally, future research could explore integrating advanced data collection methods, such as IoT sensors or automated tracking systems, to capture real-time consumption data. This would minimize the need for extrapolation and improve the accuracy of the tool’s impact estimates. Another promising direction is the application of machine learning models to refine impact predictions based on user data, helping to forecast future trends and assess the impact of various tourism scenarios. Furthermore, research could focus on the development of a framework that ties sustainable practices in tourism to local environmental goals and regulations, ensuring that the Greentour tool remains adaptable to diverse sustainability frameworks. The integration of localized standards would further enhance the practical applicability and impact of the tool. In this regard, key partners in the tourism sector—such as hotels, other accommodation providers, restaurants, local governments, and tourist offices—will play a fundamental role in promoting and adopting the developed products. Specifically, these partners will assist in the integration of the Greentour tool into their operational processes, ensuring that sustainability practices are implemented at the local and industry levels. Hotels and accommodation providers will benefit from the tool by using its data to improve their environmental practices, while restaurants can focus on sustainable sourcing and waste management. Local governments and tourist offices, on the other hand, will act as facilitators in spreading awareness and encouraging the adoption of the tool through policy initiatives, incentives, and supporting programs. These partners will also be instrumental in identifying opportunities for integrating the tool into public policies and broader sustainability frameworks, ensuring a long-term, collective impact on the tourism sector. In this regard, the environmental tool offers valuable insights that can directly inform policymakers, tourism stakeholders, and industry best practices. Given that tourism contributes significantly to global greenhouse gas emissions [52], integrating scientifically backed environmental impact assessments into decision-making is crucial. The tool’s ability to quantify impacts beyond carbon footprint, including water scarcity, eutrophication, and resource depletion, provides a more holistic understanding of tourism’s environmental footprint [53]. For policymakers, the findings suggest the necessity of regulatory frameworks that encourage sustainable tourism practices. Destination managers could implement differentiated tax incentives for establishments that demonstrate lower environmental impact through Greentour’s metrics [54]. Similarly, municipalities could mandate the integration of environmental performance reporting into tourism development plans, ensuring alignment with broader climate commitments, such as the EU Green Deal [55]. For businesses, particularly accommodations and restaurants, the tool highlights key areas for improvement, such as energy efficiency, waste reduction, and sustainable sourcing of food and materials [56]. Establishments could use the tool to set reduction targets and publicly disclose their performance, fostering transparency and consumer trust [46]. This aligns with the growing consumer demand for sustainable travel options, as seen in industry reports indicating that over 70% of travelers prefer environmentally responsible tourism services [57]. Finally, for tourists, the tool offers a data-driven approach to responsible travel choices. Public access to destination-specific environmental profiles could encourage travelers to select lower-impact accommodations and activities, reinforcing market-driven sustainability [58]. Encouraging sustainable tourism certifications based on Greentour’s methodology could further standardize best practices across the industry [59].
Incorporating these recommendations into policy frameworks and business strategies would enhance the practical impact of Greentour, facilitating a shift toward more sustainable and profitable tourism operations worldwide.
In conclusion, with the proper implementation of the developed plan and the necessary investment in the first years, the Greentour tool will have the potential to transform the tourism sector towards more sustainable and profitable practices, with an offer of products adapted to the needs of the companies that benefits the client of the tourism sector and differentiates it from its competition.

Supplementary Materials

The following supporting information can be downloaded at: https://www.mdpi.com/article/10.3390/su17083476/s1.

Author Contributions

C.C.: methodology, investigation, software, validation, formal analysis, data curation, writing—original draft, visualization. A.C.D.: conceptualization, software, formal analysis, methodology, data curation, investigation, visualization, validation, writing—review and editing. M.G.: software, formal analysis, methodology, data curation, investigation, validation. D.G.: methodology, investigation, formal analysis, data curation, writing—original draft, visualization. P.Q.: methodology, data curation, investigation, validation, writing—review and editing. P.V.-R.: methodology, investigation, formal analysis, data curation, visualization, writing—review and editing. S.O.: data curation, writing—review and editing. J.A.: conceptualization, writing—review and editing. A.B.: formal analysis. P.F.-i.-P.: funding acquisition, project administration. M.F.: writing—review and editing. L.M.: project administration. I.S.: project administration. E.R.: data curation, writing—review and editing. M.R.: writing—review and editing. R.X.: writing—review and editing. J.L.: data curation, investigation, validation, writing—review and editing. M.M.: data curation, writing—review and editing, supervision, visualization, validation. R.A.: conceptualization, methodology, resources, writing—review and editing, supervision, project administration. All authors have read and agreed to the published version of the manuscript.

Funding

This research was funded by the INTERREG SUDOE Program, grant number GREENTOUR: Circular Economy and Sustainable Tourism in Destinations of the SUDOE space (SOE4/P5/E1089). The authors of CESAM acknowledge the Portuguese Foundation for Science and Technology (FCT) for the contract 2023.06946.CEECIND/CP2840/CT0013, DOI https://doi.org/10.54499/2023.06946.CEECIND/CP2840/CT0013, and for the financial support to CESAM (UID Centro de Estudos do Ambiente e Mar (CESAM) + LA/P/0094/2020), through national funds. The author of Galician Water Research Foundation (Cetaqua Galicia) belongs to the Galician Competitive Research Group GRC (IN845A-2), a program co-funded by FEDER.

Institutional Review Board Statement

The study was conducted in accordance with the Declaration of ethical compliance provided by the UNESCO Chair in Life Cycle and Climate Change, confirming that no formal ethical approval was required and that all research activities adhered to the highest standards of transparency, integrity, and responsible data use.

Informed Consent Statement

Patient consent was waived because the study exclusively used non-confidential, aggregated data related to tourism services, with no personally identifiable information involved. The research was conducted under the ethical guidelines established in the Code of Ethics for Public Procurement, which was provided and applied throughout the GREENTOUR Project. This framework ensured responsible data usage, transparency, and adherence to high ethical standards across all stages of the study.

Data Availability Statement

Data is contained within the article and Supplementary Materials.

Acknowledgments

The UNESCO Chair authors wish to clarify that they bear full responsibility for the selection and presentation of information in this paper, along with the opinions expressed. It should be noted that these views do not necessarily align with those of UNESCO and do not imply any endorsement or commitment from the organization.

Conflicts of Interest

The authors declare no conflicts of interests.

References

  1. Campos, C.; Gallego, M.; Villanueva, P.; Laso, J.; Días, A.C.; Quinteiro, P.; Oliveira, S.; Albertí, J.; Fullana-i-Palmer, P.; Mélon, L.; et al. Life cycle assessment to address the environmental impacts of tourism in a Spanish tourist destination: The case of Rias Baixas (Galicia) holidays. Sci. Total Environ. 2023, 896, 166242. [Google Scholar] [CrossRef] [PubMed]
  2. Gössling, S.; Humpe, A. The global scale, distribution and growth of aviation: Implications for climate change. Glob. Environ. Change 2020, 65, 102194. [Google Scholar] [CrossRef]
  3. Gössling, S.; Peeters, P. Assessing tourism’s global environmental impact 1900–2050. J. Sustain. Tour. 2015, 23, 639–659. [Google Scholar] [CrossRef]
  4. Bramwell, B.; Higham, J.; Lane, B.; Miller, G. Twenty-five years of sustainable tourism and the Journal of Sustainable Tourism: Looking back and moving forward. J. Sustain. Tour. 2017, 25, 1–9. [Google Scholar] [CrossRef]
  5. Shurland, D.; Fullana i Palmer, P.; De Camillis, C.; Albertí, J. Recommended Key Environmental Indicators for the Tourism Private Sector. Consultation Document; UN Environment (Economy Division), Tourism & Environment Programme, Consumption & Production Unit (CPU): Paris, France, 2017. [Google Scholar]
  6. EPRS, 2017. European Parliamentary Research Service. Vivienne Halleux Members’ Research Service. Sustainable Tourism. The Environmental Dimension. Available online: https://www.europarl.europa.eu/RegData/etudes/BRIE/2017/599327/EPRS_BRI(2017)599327_EN.pdf (accessed on 10 January 2024).
  7. UNWTO, 2020. Tourism and the Sustainable Development Goals. Available online: https://www.e-un-wto.org/doi/pdf/10.18111/9789284419401 (accessed on 26 January 2024).
  8. Miralles, C.C.; Barioni, D.; Mancini, M.S.; Jordà, J.C.; Roura, M.B.; Salas, S.P.; Argelaguet, L.L.; Galli, A. The footprint of tourism: A review of water, carbon, and ecological footprint applications to the tourism sector. J. Clean. Prod. 2023, 422, 138568. [Google Scholar] [CrossRef]
  9. Puig, R.; Kilic, E.; Navarro, S.; Albertí, J.; Chacón, L.; Fullana i Palmer, P. Inventory analysis and Carbon footprint of coastland-hotel services: A Spanish case study. Sci. Total Environ. 2017, 595, 244–254. [Google Scholar] [CrossRef] [PubMed]
  10. Hunter, C.; Shaw, J. The ecological footprint of destinations. Tour. Manag. 2007, 28, 46–57. [Google Scholar] [CrossRef]
  11. UNWTO, 2023. Climate Action in the Tourism Sector—An Overview of Methodologies and Tools to Measure Greenhouse Gas Emissions. Available online: https://www.e-unwto.org/doi/epdf/10.18111/9789284423927 (accessed on 12 August 2023).
  12. Sustainable, Hospitality Alliance, 2024. Net Positive Hospitality for a Better World. Available online: https://sustainablehospitalityalliance.org/?gad_source=1&gclid=Cj0KCQjwncWvBhD_ARIsAEb2HW-xQ-HEVb8mHgVwJ3_UbT9GFaMWKX6UNcWgheJVWmtQS_FdIjEbrrwaAjQYEALw_wcB (accessed on 13 March 2024).
  13. Greenview, 2024. Hotel Footprinting Tool. Available online: https://www.hotelfootprints.org/ (accessed on 14 March 2024).
  14. GACMO, 2024. Greenhouse Gas Abatement Cost Model. Available online: https://www.unep.org/ndc/resources/toolkit-manual-and-guide/greenhouse-gas-abatement-cost-model-gacmo (accessed on 13 March 2024).
  15. Earthcheck, 2024. MyEarthcheck. Available online: https://earthcheck.org/ (accessed on 10 March 2024).
  16. Weeva, 2024. Business Sustainability Management Platform. Available online: https://www.gstcouncil.org/weeva-sustainability-management-standard-gains-gstc-recognized-standard-status/?lang=es (accessed on 15 February 2024).
  17. Mulrow, J.; Machaj, K.; Deanes, J.; Derrible, S. The state of carbon footprint calculators: An evaluation of calculator design and user interaction features. Sust. Prod. Cons. 2019, 18, 33–40. [Google Scholar] [CrossRef]
  18. Pham, T.; Meng, X.; Becken, S. Measuring tourism emissions at destination level: Australia case. Ann. Tour. Res. 2022, 3, 100062. [Google Scholar] [CrossRef]
  19. Haid, M.; Albrecht, J.N.; Finkler, W. Sustainability implementation in destination management. J. Clean. Prod. 2021, 312, 127718. [Google Scholar] [CrossRef]
  20. Blanca-Alcubilla, G.; Bala, A.; De-Castro, N.; Colomé, R.; Fullana-i-Palmer, P. Is the reusable tableware the best option? Analysis for the aviation catering sector with a Life Cycle Approach. Sci. Total Environ. 2020, 708, 135121. [Google Scholar] [CrossRef] [PubMed]
  21. Batlle-Bayer, L.; Bala, A.; Roca, M.; Lemaire, E.; Aldaco, R.; Fullana-i-Palmer, P. Nutritional and environmental co-benefits of shifting to “Planetary Health” Spanish tapas. J. Clean. Prod. 2020, 271, 122561. [Google Scholar] [CrossRef]
  22. Smetschka, B.; Wiedenhofer, D.; Egger, C.; Haselsteiner, E.; Moran, D.; Gaube, V. Time Matters: The Carbon Footprint of Everyday Activities in Austria. Ecol. Econ. 2019, 164, 106357. [Google Scholar] [CrossRef]
  23. Lenzen, M.; Sun, Y.Y.; Faturay, F.; Ting, Y.P.; Geschke, A.; Malik, A. The carbon footprint of global tourism. Nat. Clim. Chang. 2018, 8, 522–528. [Google Scholar] [CrossRef]
  24. Campos, C.; Laso, J.; Cristóbal, J.; Albertí, J.; Bala, A.; Fullana, M.; Fullana-i-Palmer, P.; Margallo, M.; Aldaco, R. Towards more sustainable tourism under a carbon footprint approach: The Camino Lebaniego case study. J. Clean. Prod. 2022, 369, 133222. [Google Scholar] [CrossRef]
  25. Shinde, R.; Kim, A.; Hellweg, S. Bottom-up LCA building stock model: Tool for future building-management scenarios. Clean. Prod. 2024, 434, 140272. [Google Scholar] [CrossRef]
  26. Greentour, 2024. Circular Economy and Sustainable Tourism in Destinations of the SUDOE Space. Available online: https://greentour-project.eu/ (accessed on 13 January 2024).
  27. Žigart, M.; Kovačič, L.; Premrov, M.; Žegarac, V. Environmental impact assessment of building envelope components for low-rise buildings. Energy 2018, 163, 501–512. [Google Scholar] [CrossRef]
  28. ISO 14040:2006; Environmental Management—Life Cycle Assessment—Principles and Framework. ISO: Geneva, Switzerland, 2006.
  29. ISO 14044:2006; Environmental Management—Life Cycle Assessment—Requirements and Guidelines. ISO: Geneva, Switzerland, 2006.
  30. Parvatker, A.G.; Tunceroglu, H.; Sherman, J.D.; Coish, P.; Anastas, P.; Zimmerman, J.B.; Eckelman, M.J. Cradle-to-Gate greenhouse gas emissions for twenty anesthetic active pharmaceutical ingredients based on process scale-up and process design calculations. ACS Sustain. Chem. Eng. 2019, 7, 6580–6591. [Google Scholar] [CrossRef]
  31. Medina, G.; Boyano, A.; Kaps, R.; Arendorf, J.; Bojczuk, K.; Sims, E.; Menkveld, R.; Golsteijn, L.; Gaasbeek, A. Revision of the European Ecolabel Criteria for: All-Purpose Cleaners, Sanitary Cleaners and Window Cleaners; EUR 27379 EN; European Union: Brussels, Belgium, 2015. [Google Scholar] [CrossRef]
  32. Medina, G.; Boyano, A.; Kaps, R.; Arendorf, J.; Bojczuk, K.; Golsteijn, L.; Gaasbeek, A.; Skinner, D. Preliminary Report for the Revision of the European Ecolabel Criteria for Hand Dishwashing Detergents, Preliminary Report; EUR 27381 EN; European Union: Brussels, Belgium, 2015. [Google Scholar] [CrossRef]
  33. Medina, G.; Boyano, A.; Kaps, R.; Arendorf, J.; Bojczuk, K.; Sims, E.; Menkveld, R.; Golsteijn, L.; Gaasbeek, A. Revision of the European Ecolabel Criteria for: Laundry Detergents and Industrial and Institutional Laundry Detergents; EUR 27380 EN; European Union: Brussels, Belgium, 2015. [Google Scholar] [CrossRef]
  34. Wallinga, E.; Vaneeckhaute, C. Greenhouse gas emissions from inorganic and organic fertilizer production and use: A review of emission factors and their variability. J. Environ. Manag. 2020, 276, 111211. [Google Scholar] [CrossRef]
  35. IPCC Guidelines for National Greenhouse Gas Inventories. Intergovernmental Panel on Climate Change, Hayama. EFDB Emission Factor Database. Available online: https://www.ipccnggip.iges.or.jp/EFDB/main.php (accessed on 13 March 2025).
  36. Audsley, E.; Alber, S.; Clift, R.; Cowell, S.; Crettaz, P.; Gaillard, G.; Hausheer, J.; Jolliett, O.; Kleijn, R.; Mortensen, B.; et al. Harmonisation of Environmental Life Cycle Assessment for Agriculture. In Final Report; Concerted Action AIR-CT94-2028; European Commission: Brussels, Belgium, 1997. [Google Scholar]
  37. AIB, 2024. Association of Issuing Bodies: Guaranteeing the Origin of European Energy. Available online: https://www.aib-net.org/ (accessed on 13 September 2024).
  38. EMEP CORINAIR, 2019. Guide EMEP CORINAIR Emission Inventory Guidebook. Available online: https://www.eea.europa.eu/themes/air/air-pollution-sources-1/emep-eea-air-pollutant-emission-inventory-guidebook/emep (accessed on 20 March 2024).
  39. Mikosch, N.; Dettmer, T.; Plaga, B.; Gernuks, M.; Finkbeiner, M. Relevance of Impact Categories and Applicability of Life Cycle Impact Assessment Methods from an Automotive Industry Perspective. Sustainability 2022, 14, 8837. [Google Scholar] [CrossRef]
  40. IATA (International Air Transport Association), 2020. Environmental Responsibility. Available online: https://www.iata.org/ (accessed on 13 December 2024).
  41. ITF (International Transport Forum), 2018. Transport and Tourism: Global Perspectives and Policies. Available online: https://www.itf-oecd.org/ (accessed on 14 February 2024).
  42. Google Maps, 2024. Available online: https://www.google.es/maps/preview (accessed on 14 April 2024).
  43. Distance Calculator, 2024. Available online: https://www.distance.to/ (accessed on 10 February 2024).
  44. Distance to Sea, 2024. Available online: https://sea-distances.org/ (accessed on 10 February 2024).
  45. Fernández, M.; Lazovski, O. Estimation of the equivalent tourist population trough indirect methods. J. Tour. Anal. Rev. Análisis Turístico 2020, 27, 81–95. [Google Scholar] [CrossRef]
  46. Fundación Camino Lebaniego. 2023. UNESCO World Heritage. Available online: https://www.caminolebaniego.com/historia-y-cultura/patrimonio-mundial-de-la-unesco?ref=e-html (accessed on 7 January 2024).
  47. Guimarães Turismo, 2024. Guimarães, Lugares Que Conquistan. Available online: https://www.visitguimaraes.travel/ (accessed on 11 January 2024).
  48. Galicia Tourism, 2024. Area of Research and Study of Tourism of Galicia. Available online: http://www.turismo.gal/aei/portal/index.php (accessed on 11 January 2024).
  49. Lloret de Mar Tourism, 2022. Available online: https://www.spain.info/es/destino/lloret-mar/ (accessed on 10 January 2024).
  50. Font, X.; McCabe, S. Sustainability and marketing in tourism: Its contexts, paradoxes, approaches, challenges and potential. J. Sustain. Tour. 2017, 25, 869–883. [Google Scholar] [CrossRef]
  51. Zhang, P.; Xie, Y.; Wang, Y.; Li, B.; Li, B.; Jia, Q.; Yang, Z.; Cai, Y. Water-Energy-Food system in typical cities of the world and China under zero-waste: Commonalities and asynchronous experiences support sustainable development. Ecol. Indic. 2021, 132, 108221. [Google Scholar] [CrossRef]
  52. UNWTO, 2022. Tourism and Climate Change Report 2022. Available online: https://doi.org/10.18111/9789284423965 (accessed on 13 December 2024).
  53. Gössling, S.; Higham, J. The Low-Carbon Imperative: Destination Management under Urgent Climate Change. J. Travel Res. 2021, 60, 1167–1179. [Google Scholar] [CrossRef]
  54. Scott, D.; Gössling, S.; Hall, C.M. The evolving climate change and tourism relationship: An update to Hall, Scott and Gössling (2015). J. Sustain. Tour. 2019, 27, 205–225. [Google Scholar] [CrossRef]
  55. European Commission. 2020. The European Green Deal. Available online: https://ec.europa.eu/info/strategy/priorities-2019-2024/european-green-deal_en (accessed on 13 December 2024).
  56. Peeters, P.; Gössling, S.; Becken, S. Innovation towards tourism sustainability: Climate change and aviation. Tour. Hosp. Res. 2018, 18, 99–107. [Google Scholar] [CrossRef]
  57. Booking.com, 2023. Sustainable Travel Report 2023. Available online: https://globalnews.booking.com/sustainable-travel-report-2023 (accessed on 13 December 2024).
  58. Dubois, G.; Peeters, P.; Ceron, J.P.; Gössling, S. The future tourism mobility of the world population: Emission growth versus climate policy. Transp. Res. Part A Policy Pract. 2011, 45, 1031–1042. [Google Scholar] [CrossRef]
  59. WTTC (World Travel & Tourism Council), 2021. A Net Zero Roadmap for Travel & Tourism. Available online: https://wttc.org/Research/Net-Zero-Roadmap (accessed on 13 December 2024).
Figure 1. Process for developing the environmental tool (four environmental subtools).
Sustainability 17 03476 g001
Figure 2. Structure of the webpage of the Greentour tool (homepage, registration, log-in) [26].
Sustainability 17 03476 g002
Figure 3. Greentour tool questionnaires accessed from the website.
Sustainability 17 03476 g003
Figure 4. Production mix and final residual mix in 2019. European residual mix [37].
Sustainability 17 03476 g004
Figure 5. Connection between the selected impact categories in Greentour and the SDGs broken down by category.
Sustainability 17 03476 g005
Figure 6. Results obtained automatically from the Greentour tool website.
Sustainability 17 03476 g006
Figure 7. Process of obtaining the results of a tourist destination through the Greentour tool.
Sustainability 17 03476 g007
Figure 8. Steps to calculating waste generation corresponding to tourists based on the “equivalent tourist” method.
Sustainability 17 03476 g008
Figure 9. Destinations evaluated with the Greentour tool.
Sustainability 17 03476 g009
Figure 10. Results obtained for the four destinations used as an example to test the functionality of the Greentour tool.
Sustainability 17 03476 g010
Figure 11. Results for the nine environmental impact categories normalized with the emissions of an average European citizen in 2019, expressed per tourist (FU).
Sustainability 17 03476 g011
Table 1. Adopted information of indoor cleaning and maintenance products. U: ‘Unit process’.
Product CategoryProductEcoinvent Processes
DesinfectantsAmmoniaAmmonia, liquid {RER}|market for|Cut-off, U
Hydrochloric acidHydrochloric acid, without water, in 30% solution state {RER}|market for|Cut-off, U
AlcoholEthanol, without water, in 99.7% solution state, from ethylene {RER}|market for ethanol, without water, in 99.7% solution state, from ethylene|Cut-off, U
Hydrogen peroxideHydrogen peroxide, without water, in 50% solution state {RER}|market for hydrogen peroxide, without water, in 50% solution state|Cut-off, U
CleanersMulti-purpose spray, kitchen and carpet sprayModelling with Ecoinvent processes based on European Ecolabel composition
Hand soapSoap {GLO}|market for|Cut-off, U
DusterTextile, woven cotton {GLO}|market for|Cut-off, U
Descaling agentsHydrochloric acidHydrochloric acid, without water, in 30% solution state {RER}|market for|Cut-off, U
CleanersFood bleachSodium hypochlorite, without water, in 15% solution state {RER}|market for sodium hypochlorite, without water, in 15% solution state|Cut-off, U
Cleaning bleachSodium hypochlorite, without water, in 15% solution state {RER}|market for sodium hypochlorite, without water, in 15% solution state|Cut-off, U
CleanersManual and machine dishwasher, rinse agentEcoinvent processes based on European Ecolabel composition
Detergents, fabric softenerEcoinvent processes based on European Ecolabel composition
Table 2. Adopted information of outdoor cleaning and maintenance products.
ProductEcoinvent Processes
Chloride tabletsTrichloroisocyanuric {GLO}|production|Cut-off, U
PH ReducerSodium hydrogen sulfate {GLO}|market for sodium hydrogen sulfate|Cut-off, U
Sodium chlorideSodium chloride, powder {GLO}|market for|Cut-off, U
AlgaecidesCopper sulfate {GLO}|production|Cut-off, U
FertilizersModeled with ecoinvent processes based on the following composition: 15% N (ammonium sulfate) + 5% P2O5 (triple superphosphate) + 10% K2O (potassium chloride). Direct emissions from fertilizer application modeled with emission factors from literature.
PesticidesPesticide, unspecified {GLO}|market for|Cut-off, U
OthersAverage of all products considered
Table 3. Types and fuel-related processes: Ecoinvent background process and EMEP CORINAIR foreground processes.
Type of CombustionFuelBackground Processes EcoinventForeground Processes Guide EMEP CORINAIR
StationaryNatural gasNatural gas, high pressure {Europe without Switzerland}|market group for|Cut-off, UTable 3.8 (sheet ‘Stationary emissions’)
StationaryDieselDiesel, low-sulfur {RER}|market group for|Cut-off, UTable 3.9 (sheet ‘Stationary emissions’)
BiomassWood pellet, measured as dry mass {RER}|market for wood pellet|Cut-off, U/Wood chips, dry, measured as dry mass {RER}|market for|Cut-off, U/Cleft timber, measured as dry mass {Europe without Switzerland}|market for|Cut-off, UTable 3.10 (sheet ‘Stationary emissions’)
CoalCharcoal {GLO}|market for|Cut-off, U
Road mobiles (various categories)PetrolPetrol, unleaded {RER}|market for|Cut-off, USheet ‘Mobile road transportation’
DieselDiesel, low-sulfur {RER}|market group for|Cut-off, U
Road mobiles (various categories)GLPLiquefied petroleum gas {Europe without Switzerland}|market for liquefied petroleum gas|Cut-off, USheet ‘Mobile road transportation’
NGCNatural gas, high pressure {ES}|market for|Cut-off, U
Non-road mobileDieselDiesel, low-sulfur {RER}|market group for|Cut-off, USheet ‘Non road mobile combustion’
Water transport DieselDiesel, low-sulfur {RER}|market group for|Cut-off, USheet ‘Water transportation’
PetrolPetrol, unleaded {RER}|market for|Cut-off, U
Table 4. Number of evaluated establishments, by sub-sector and destination.
Camino LebaniegoGuimarãesLloret de MarRías Baixas
Accommodation32181539
Eating and drinking (restaurants)71155
Leisure activities510412
Total establishments44392456
Table 5. Categories and subcategories for establishments of the destinations.
Accommodation
Campings and bungalowsMedium (3-star) or equivalent
Premium (4-star) or equivalent
Hotel, resort, pension, motelBudget (0–2 stars) or equivalent
Medium (3-star) or equivalent
Premium (4-star) or equivalent
Self-catering (holiday homes, time-share or chalets, rural homes)Medium (3-star) or equivalent
Premium (4-star) or equivalent
Suite, apartment, hotelBudget (0–2 stars) or equivalent
Medium (3-star) or equivalent
Youth hostels and mountain refuges, sheltersMedium (3-star) or equivalent
Food and services
Eating and drinking—restaurant
Bar/pub/café
Leisure activities
Heritage(Religion/pilgrimages; sightseeing; visiting natural or man-made sites)
Table 6. Climate change of the four destinations (Camino Lebaniego, Guimarães, Rias Baixas, and Lloret de Mar) per year and per tourist.
Impact per Year (kg CO2 eq./Year) and Relative Contribution (%)
Camino Lebaniego
Cantabria, Spain
Guimarães
Braga, Portugal
Rias Baixas
Galicia, Spain
Lloret de Mar
Catalonia, Spain
Accommodation1,030,862
(8%)
1,410,297
(1%)
16,811,758
(6%)
58,232,332
(14%)
Eating and drinking1,778,374
(8%)
3,067,461
(1%)
28,227,842
(11%)
111,240,040
(26%)
Leisure activities1,369,903
(6%)
2,979,938
(1%)
10,258,380
(4%)
179,485
(0%)
Transport17,624,666
(76%)
293,205,783
(96%)
211,620,999
(79%)
257,719,268
(60%)
Waste management531,797
(2%)
3,722,648
(1%)
1,117,077
(0%)
629,976
(0%)
TOTAL23,293,588304,386,127268,036,056428,001,101
Impact per Tourist (kg CO2 eq./tourist)
Camino LebaniegoGuimarãesRias BaixasLloret de Mar
Accommodation8.161.509.5610.04
Eating and drinking14.093.2616.0612.78
Leisure activities10.853.165.840.06
Transport139.63311.32120.37197.69
Waste management4.213.950.640.48
TOTAL176.94323.20152.46221.05
Disclaimer/Publisher’s Note: The statements, opinions and data contained in all publications are solely those of the individual author(s) and contributor(s) and not of MDPI and/or the editor(s). MDPI and/or the editor(s) disclaim responsibility for any injury to people or property resulting from any ideas, methods, instructions or products referred to in the content.

