Abstract
With the advancement of the global Sustainable Development Goals (SDGs), residents’ green perception has become a key factor in driving green behavior and the implementation of environmental policies. However, due to differences in socio-economic environments, policy enforcement, and resource accessibility between urban and rural areas, residents’ levels of green perception exhibit significant regional disparities. Based on the Social Ecological Model, this study constructs an analytical framework encompassing the individual, social relationships, community, policy, and organizational levels to systematically explore the multi-level factors influencing urban and rural residents’ green perception. This study collects data through questionnaire surveys and employs Structural Equation Modeling (SEM) to validate the relationships between variables at different levels. The findings indicate that residents’ green perception is influenced by multiple interacting factors, among which environmental knowledge and attitudes at the individual level, family support and social networks at the social relationship level, as well as community atmosphere and policy advocacy play particularly significant roles in enhancing green perception. Furthermore, there are distinct differences in the mechanisms of green perception formation between urban and rural residents; urban residents rely more on government policies and green infrastructure, whereas rural residents’ green perception is primarily influenced by community atmosphere and direct environmental experiences. This study deepens the understanding of urban–rural differences in green perception and their driving factors, providing region-specific policy recommendations to promote widespread green behavior, advance ecological civilization construction in both urban and rural areas, and facilitate the achievement of sustainable development goals.
1. Introduction
Green perception, as residents’ understanding and recognition of environmental issues and sustainable development concepts, is a key factor in driving green behavior and policy implementation [1]. In recent years, with the intensification of the global ecological crisis, enhancing residents’ green perception has become one of the core concerns of academia and policymakers [2]. However, significant differences in green perception often exist between urban and rural residents, which are influenced not only by economic, social, and cultural factors but also by their living environment and social support [3].
Under the promotion of the global Sustainable Development Goals (SDGs), how to enhance residents’ green perception and thereby encourage green behavior and low-carbon lifestyles has become a key focus for governments and researchers worldwide [4]. Meanwhile, due to differences in resource allocation, environmental governance capacity, and policy enforcement, there are significant disparities in green perception between urban and rural residents. For example, urban residents are more likely to have access to environmental education, policy advocacy, and green technologies, whereas rural residents’ green perception is more influenced by community atmosphere and practical life experiences [5]. These urban–rural differences not only affect individual environmental behaviors but may also exacerbate the imbalance in sustainable development between urban and rural areas. Therefore, exploring the mechanisms shaping urban and rural residents’ green perception is of great significance for formulating region-specific environmental policies and optimizing sustainable development models for both urban and rural areas.
The Social Ecological Model provides a theoretical framework for exploring the mechanisms underlying the formation of green perception. This model emphasizes that behavior is shaped by the interplay of multiple environmental factors at different levels, including the individual level (e.g., knowledge, attitudes), the social relationship level (e.g., family support, social networks), the community level (e.g., community atmosphere, infrastructure), the policy level, and the organizational level [6]. This framework is well-suited for analyzing the complex mechanisms underlying the formation of green perception among urban and rural residents, as well as their regional differences. It systematically reveals how individuals develop green awareness under the influence of multi-level environmental factors and how this awareness ultimately translates into concrete environmental behaviors.
1.1. Research Status and Limitations
In recent years, research on green perception has increasingly attracted the attention of academia and policymakers. The existing literature suggests that green perception is a crucial psychological factor driving individual green behavior and is shaped by the interplay of multi-level environmental factors [7]. Based on different theoretical frameworks, researchers have explored the influencing factors of green perception from various perspectives, including the individual level (e.g., knowledge, attitudes, values), the social relationship level (e.g., social networks, family support), the community level (e.g., infrastructure, community culture), and the policy level (e.g., government incentives, regulatory enforcement). However, current research still has certain limitations.
Existing research mainly focuses on the single-dimensional influencing factors of green perception, such as individuals’ environmental knowledge and government policy promotion [8], but there is limited research on how factors at different levels interact and jointly shape residents’ green perception. Especially in terms of urban–rural comparisons, there is still a lack of comprehensive analysis based on a systematic framework. For example, urban residents may be more influenced by policies, regulations, and media campaigns, while rural residents may rely more on environmental information dissemination through family and community networks [5]. Furthermore, research on green perception is continuously integrating interdisciplinary findings from materials science, environmental behavior, and social psychology, gradually expanding its dimensional scope. For example, Thiruchitrambalam et al. [9] in their study on natural fiber composites (such as banana hemp fiber) highlighted the importance of material green attributes in public perception, suggesting the diverse impacts of green material cognition on perception formation. Karuppiah et al. [10] explored the selection of sustainable thermoplastic materials using multi-criteria decision-making methods, pointing out that green perception is not only a subjective preference but also shaped by external factors such as technical performance, application scenarios, and policy regulations. These studies suggest that green perception is not merely a psychological cognition, but a result of multi-dimensional socio-technical system interactions. Therefore, further exploration is needed on how multi-level factors interact to influence the green perception of urban and rural residents.
Although existing studies have examined the differences in green perception between urban and rural residents [3], most remain at the descriptive analysis level and lack in-depth exploration of the influencing pathways. For instance, some studies indicate that urban residents are more influenced by policy advocacy, while rural residents rely more on community interactions [11]. However, these studies have not systematically quantified the mechanisms underlying urban–rural green perception formation, nor have they examined how urban and rural socio-ecological systems shape residents’ green awareness and behavior. Moreover, the key mechanisms through which urban and rural residents acquire information, trust policies, and translate perception into action have yet to be fully explored.
Research on green perception mostly relies on qualitative interviews or cross-sectional surveys. While these methods effectively capture residents’ subjective perceptions of the environment, they have certain limitations. First, self-reported questionnaires may be influenced by social desirability bias, leading respondents to report more positive attitudes toward environmental protection [12]. Second, current studies rarely integrate big data, experimental research, or longitudinal studies to more accurately capture trends in green perception. For example, social media data analysis can provide insights into individuals’ actual interactions with environmental information, while longitudinal studies can track how green perception adjusts in response to policy or environmental changes [13]. Moreover, existing studies rarely employ causal pathway analysis methods such as Structural Equation Modeling (SEM), leaving the driving factors of urban–rural green perception and their interaction mechanisms insufficiently understood.
1.2. Research Objectives and Contributions
This study aims to systematically explore the multi-level driving factors of urban and rural residents’ green perception based on the Social Ecological Model and to validate the applicability of the theoretical framework using Structural Equation Modeling (SEM). Compared with previous studies, the innovation of this research lies in three aspects.
Based on previous research on green perception, this study introduces the Social Ecological Model as the theoretical foundation and systematically divides green perception into five structural levels for the first time: individual, social relations, community, organization, and policy. This integrated framework overcomes the limitations of “single perspective” or “fragmented variables” in previous research, emphasizing the interactive mechanisms between levels, which helps to comprehensively understand the formation path of green perception from macro to micro. This structured, multi-dimensional theoretical construct is innovative in green behavior research and contributes to the theoretical deepening of green consumption and green governance studies.
Compared to previous green perception studies that primarily used descriptive statistics or multiple regression, this study uses Structural Equation Modeling (SEM) for path analysis, which can simultaneously handle causal relationships between multiple latent variables and perform group comparisons within urban and rural samples. This analytical method not only enhances the explanatory power of the model but also reveals the underlying mechanisms and mediating paths behind urban–rural differences in green perception, providing empirical tool support for understanding complex social cognitive structures. By using Structural Equation Modeling to layer and quantify urban–rural heterogeneity, this study represents a significant methodological advancement in similar research.
Innovative rural sample acquisition strategy: To address the issue of low internet access rates in rural areas, this study employed multiple strategies during the questionnaire collection process to ensure the representativeness of the rural sample. First, the researchers used the network of older relatives within family members and, through their familiar local relationships, distributed the questionnaire in multiple rural WeChat groups, especially in the “WeChat elderly group” often used by middle-aged and elderly people, thereby reaching groups with lower digital usage but who genuinely live in rural areas. Secondly, given the rapid urbanization in the coastal areas of eastern China, some rural areas have become highly urbanized, making them unrepresentative of a typical rural ecosystem; this study primarily selected rural samples from underdeveloped areas in the central and western regions, where the socio-economic structure, infrastructure level, and green perception formation mechanism are more typical of rural areas, better representing the characteristics of rural populations in current China.
The ultimate goal of this study is not limited to the construction of academic theory, but also emphasizes the role of research results in promoting green transformation practices. Based on the significance analysis of the five factors and empirical findings on urban–rural path differences, this paper proposes a series of targeted urban–rural differentiated policy recommendations, including green education, information guidance, organizational mobilization, and community participation mechanism construction. This research logic of mechanism analysis—data validation—policy response enhances the practical guiding significance of the research, helping to effectively transform academic research findings into action plans for promoting green social construction.
This study not only deepens the understanding of the mechanism behind the formation of green perception but also provides a scientific basis and practical guidance for promoting urban–rural green development and ecological civilization construction.
2. Support for Theories and Hypotheses
2.1. Definition and Theoretical Foundation of Green Perception
Green perception, as an important psychological mechanism driving individual green behavior, has long received widespread attention from the academic community. With the continuous deepening of the concept of sustainable development, research on green perception has gradually expanded into multiple fields and levels, involving individual knowledge and attitudes, social relationship networks, community environmental quality, policy guidance, and organizational behavior, among other dimensions [14]. A deeper understanding of the connotation and formation mechanism of green perception helps in formulating more targeted green transformation policies and enhancing public environmental awareness, especially in the context of significant urban–rural differences.
Green perception primarily refers to an individual’s cognition and attitude toward environmental issues, ecological protection, and behaviors and policies related to sustainable development [15]. Some studies regard it as the core component of environmental awareness [16], covering the judgment of environmental degradation severity, the acceptance of green behaviors, and the willingness to support environmental protection policies [17].
In recent years, the emotional dimension of green perception has also received attention, with studies finding that psychological mechanisms such as environmental guilt significantly affect the occurrence and sustainability of individual green behavior [18]. Green perception also involves an individual’s cognitive acceptance and value judgment of green lifestyles, such as low-carbon consumption, green transportation, and waste sorting [19]. Relevant research further indicates that the formation of green perception not only stems from the cognitive structure at the individual level but also is deeply influenced by social and environmental interactions, including social norms, organizational advocacy, community atmosphere, and public policies [20]. For example, Lankyung Kim et al. [14] pointed out that the perception of urban green space imagery helps strengthen the green identity of urban residents; Pasca et al. [17] discovered that green pride and environmental guilt jointly influence environmental protection intentions from the perspective of the self–nature connection.
To further analyze the formation mechanism of green perception, this study introduces the Social Ecological Model as the theoretical framework, which emphasizes the interaction of multi-level factors, including individual, social, community, and policy dimensions. The model was first proposed by Bronfenbrenner [21], emphasizing that individual behavior and cognition are influenced by the interaction of multi-level environmental factors, including the individual level, interpersonal level, community level, policy level, and organizational level [22].
Based on this, this study constructs a multi-level analysis model of urban–rural green perception, aiming to systematically analyze the driving effect of different hierarchical variables on green perception. It hypothesizes that there are significant differences in the formation of green perception between urban and rural residents and reveals the underlying mechanisms behind these urban–rural differences.
2.2. The Impact of the Individual Level on Green Perception
The formation of green perception at the individual level is mainly influenced by environmental knowledge and environmental attitudes. Environmental knowledge refers to an individual’s level of awareness of environmental issues, green behaviors, and policies related to sustainable development, directly affecting their understanding and ability to respond to environmental risks [23]. Studies show that there is a significant positive correlation between environmental knowledge and green perception, with individuals with higher levels of knowledge typically showing stronger tendencies for green behavior [24]. Gaopeng Zhang et al. pointed out that environmental knowledge plays a moderating role in green fashion consumption behavior [25]. Anubha Goel et al. further proposed that the relationship between green brand perception and green loyalty is more stable among consumers with stronger environmental knowledge [26].
According to the Theory of Planned Behavior (TPB), an individual’s level of cognition influences their attitudes and behavioral intentions, serving as an important prerequisite for stimulating pro-environmental behavior [27]. The Knowledge-Deficit Model also emphasizes that cognition is the key link in the transformation of behavior [28]. Yue et al. [29] empirically found that the higher the cognitive level, the more individuals are aware of the urgency of environmental deterioration, leading to green emotions and pro-environmental behavior. Hlaváček et al. [30] pointed out that, especially among highly educated individuals, the positive relationship between environmental knowledge and green attitudes and behaviors is more pronounced.
Environmental attitude is another key variable, typically composed of environmental values, sense of responsibility, and behavioral motives. The Value–Belief–Norm (VBN) theory posits that an individual’s environmental beliefs and sense of responsibility determine whether they have sustained green perception and behavioral tendencies [31]. When individuals believe that their actions have a positive impact on the environment, their level of green perception is higher. Gifford and Nilsson [32] noted in their summary of multiple studies that environmental attitude is a direct driving factor of green perception. S.M. Imran Hossain et al. [33] also pointed out that consumers with strong environmental attitudes are more likely to choose energy-saving products and have high trust in environmental labels. Taufique et al. [34] found that environmental attitude has a particularly significant effect on green perception among Asian youth, and this effect is moderated by cultural background. Furthermore, demographic characteristics also influence the formation of green perception to some extent. Hoffmann and Muttarak [35] found that the higher the level of education, the stronger the green perception exhibited by individuals. Encho et al. [36] pointed out that the youth group performs better than the elderly group in green space perception and environmental behavior.
In summary, environmental knowledge and environmental attitude at the individual level are the core antecedent variables in the formation of green perception. Based on the above theories and empirical research, this study proposes the following hypothesis:
H1.
The individual level positively influences green perception.
2.3. The Impact of the Interpersonal Level on Green Perception
At the interpersonal level, the interaction between individuals and their social relationship networks—including family members, friends, social networks, and community neighbors—is considered an important social influence factor in the formation of green perception [37]. Through daily communication, behavioral demonstration, and information sharing, interpersonal relationships not only affect an individual’s cognition of environmental issues but also significantly shape their intentions and value orientation toward green behavior.
Research shows that the family is the primary space for the dissemination of green awareness. The role of family members as role models in environmental protection behavior can effectively enhance an individual’s sense of identity with green values and willingness to participate. For example, Wang, H. et al. [38] found that in rural areas, family members jointly participating in waste sorting not only has direct benefits for the environment but also enhances individual environmental concern, thereby promoting green consumption behavior. Nuryazmin Ahmat Zainuri et al. [39] pointed out that consistency in family environmental values and collective participation behaviors has a significant positive effect on green perception.
Social networks, especially online social media platforms in the digital age, have become an important medium for the dissemination of environmental protection information. Meng et al. [40] found that frequent exposure to environmental protection information and discussions on social media can enhance individuals’ cognitive sensitivity to green issues. Nivedhitha et al. [41] further proposed that the interactivity of green social networks (such as liking, commenting, and sharing) enhances users’ social identity with green behavior, thereby improving their level of green perception. The mechanism of interpersonal influence also differs between urban and rural residents. Bjarnason et al. [42] found that urban residents’ green perception is more influenced by family members’ identification and value orientation, while rural residents rely more on community group atmosphere and neighborhood interaction. Wu, Z. et al. [43] also emphasized that community trust and family participation jointly influence rural residents’ willingness for sustainable development.
At the theoretical level, Social Learning Theory suggests that individuals observe and imitate the behaviors of others in their social environment, internalizing behavioral norms and adjusting their own behavior [44]. When family members, friends, or social circles commonly adopt green behaviors, individuals are more likely to identify with and adopt similar actions. Social Identity Theory further suggests that individuals tend to align with their group, and when green behavior is seen as “mainstream” or “appropriate”, individuals’ green perception will also increase [45].
Therefore, family support and social networks together form the important social relationship foundation for the formation of green perception. Based on the above theories and research evidence, this study proposes the following hypothesis:
H2.
The interpersonal level positively influences green perception.
2.4. The Impact of the Community Level on Green Perception
Family support and social networks are important external influencing factors of green perception. Studies have shown that family members’ demonstration of environmentally friendly behavior can significantly enhance an individual’s green perception. Social networks (such as interactions with friends and family, community communication, and social media) play a key role in the formation of individual green perception through information dissemination and interactive communication [46].
Huiling Wang et al. [47] pointed out that family waste sorting behavior not only directly benefits the environment but also promotes green consumption behavior by stimulating environmental awareness. F. Jia et al. [48] emphasized that family members’ joint participation in environmental protection activities significantly enhances individuals’ environmental awareness and willingness to engage in green behavior. Katz-Gerro et al. [49] also pointed out that the family atmosphere has a profound impact on green cognition, especially during children’s growth, where parents’ environmental values influence their behavior through intergenerational transmission. Cope et al. [50] found that in urban families, the recognition of environmental values by family members has a greater impact, while in rural areas, the community atmosphere is an important source influencing green perception.
From a theoretical perspective, Social Learning Theory suggests that individuals’ cognition and behavior are influenced by the social environment, particularly by the behavior of others [51]. Social Capital Theory emphasizes that interaction and trust within the family contribute to the formation of green perception [48]. Moreover, as an information dissemination platform, social networks, based on the Diffusion of Innovations Theory and Social Identity Theory, can enhance individuals’ green cognition through the spread of environmental topics and the strengthening of social identity [11,52,53]. Nivedhitha et al. [41] further pointed out that the function of green social networks can significantly enhance individuals’ pro-environmental behavior.
As an important place for individuals’ daily interactions, the community’s green advocacy also strengthens green perception. Place Attachment Theory suggests that an individual’s emotional connection to the community enhances their willingness to engage in environmental protection activities, thereby improving green perception [54]. Collective Action Theory points out that when the community advocates for green development, it is easier to stimulate residents’ environmental protection beliefs [55]. Relevant studies also support the positive effect of the community on green perception. Zhiyu Feng et al. [56] found that community public spaces in rural areas promote green interaction and environmental awareness; Jinsong Wang et al. [57] emphasized that urban green public spaces and environmental protection activities enhance residents’ environmental awareness; and Hang Yin et al. [58] argued that green community construction (such as increasing greening and promoting waste sorting) is a key way to enhance residents’ green cognition.
At the community level, the community atmosphere and sub-community facilities are important core variables in the formation of green perception. Based on the above theories and empirical research, this study proposes the following hypothesis:
H3.
The community level positively influences green perception.
2.5. The Impact of the Policy Level on Green Perception
Policy promotion and implementation are important external forces in enhancing residents’ green perception. Institutional Theory suggests that the government can effectively shape individuals’ cognition and behavior through policy intervention [59]. Norm Activation Theory further points out that policies can activate individuals’ environmental responsibility, thereby enhancing their green perception [60]. Research shows that effective policy promotion can enhance public awareness of environmental issues and stimulate willingness for green action [61]. Through multi-channel dissemination (such as television, social media, and government announcements), green information can permeate public life more widely, thereby deepening green cognition [62]. Information transparency is also crucial. Zhiwei Wang et al. [63] found that high-quality environmental policy information (transparent, timely, and accurate) can enhance public environmental awareness.
Policy fairness and inclusivity significantly affect residents’ identification with policies and their green perception. Zhanjie Wang et al. [64] pointed out that in the promotion of “dual-carbon” policies, residents’ green perception significantly increased in cities with strong policy implementation. Shengyue Fan et al. [65] found that in rural areas, where information mainly comes from government channels, policy promotion has a more significant effect on enhancing green perception. In addition to promotion, the type of policy tools also influences the formation of green perception. Studies have found that compared to single promotion, a combination of legal constraints (such as plastic bans and waste sorting) and economic incentives (such as carbon trading and environmental subsidies) is more effective in enhancing public environmental awareness [66].
The local government’s implementation capacity and enthusiasm are also key factors influencing the effectiveness of policies. Muhammad Azam et al. [67] believe that the quality of local governance (such as the strictness of policy implementation and the breadth of promotion) is positively correlated with residents’ green perception. Yangyang Fan et al. [65] pointed out that the “signaling effect” of policy implementation can effectively convey the government’s governance intentions, thereby enhancing environmental risk awareness. Moreover, policy sustainability is also crucial. Short-term policies (such as surprise inspections) may bring temporary improvements but have limited effects, while long-term and stable policies (such as integrating into the education system or setting long-term emission reduction goals) are more helpful in cultivating sustainable green cognition and behavior [68].
In conclusion, the way policies are promoted, the intensity of their implementation, fairness, incentive measures, as well as the local government’s governance capacity and policy sustainability, all interact at different levels to determine the depth and breadth of residents’ green perception. Based on the above theories and empirical research, this study proposes the following hypothesis:
H4.
Policy positively influences green perception.
2.6. The Impact of the Organizational Level on Green Perception
The organizational level includes the role of government agencies, enterprises, and social organizations in promoting green perception. Through policy support, infrastructure development, corporate sustainability strategies, and public awareness campaigns, the organizational level can effectively influence individual and societal green cognition and behavior [69]. The government shapes the green perception of residents through policy regulation and urban planning, of enterprises through sustainable development practices, and of social organizations through environmental protection advocacy.
Research shows that improvement in urbanization significantly enhances residents’ green cognition. Urban residents are usually exposed to more environmental protection information and technologies, and their green perception level is generally higher than that of rural residents [70]. Green infrastructure in cities (such as low-carbon public transportation, green buildings, and green spaces) provides residents with direct environmental protection experiences, further enhancing their green perception [71]. Additionally, urban green development policies (such as green points systems and carbon trading pilots) can motivate residents to engage in green behaviors, strengthening their green perception [72].
An increasing number of enterprises are adopting sustainable development strategies (such as green supply chains, carbon neutrality plans, and corporate social responsibility), which not only enhance the organization’s environmental protection image but also have a positive impact on residents’ green cognition and behavior [73]. Environmental advocacy activities by non-governmental organizations (NGOs) and social organizations, such as environmental education programs, waste sorting campaigns, and low-carbon lifestyle advocacy, have also played an important role in shaping residents’ green perception [74]. Urban Sustainability Theory points out that government agencies, enterprises, and social organizations play an important role in infrastructure construction, environmental governance, and sustainable development policies, directly influencing residents’ green cognition [75]. Environmental Psychology suggests that individuals’ experiences with organizations and their sustainable development practices can significantly affect their green cognition [76].
Research shows that green infrastructure (such as low-carbon public transportation and green buildings) significantly enhances residents’ green cognition and awareness of sustainable development [77,78]. F. Aram et al. [79] found that government environmental protection policies, corporate sustainability strategies, and green advocacy by social organizations can effectively promote the enhancement of residents’ green perception. Through these organizational-level influences, residents can gain more green information and environmental protection experiences in their daily lives, thereby increasing their concern for environmental issues and willingness to engage in green actions.
Overall, organizational-level policy regulation, infrastructure construction, corporate sustainability, social organization advocacy, policy incentives, and information dissemination methods jointly determine the level of residents’ green perception and interact with individual, community, and policy levels to form a comprehensive system influencing green perception. Based on the above theories and empirical research, this study proposes the following hypothesis:
H5.
The organizational level positively influences green perception.
2.7. Differences in Green Perception Between Urban and Rural Residents
Differences in green perception between urban and rural residents have become a research focus [3]. Chen, C. et al. confirmed that green perception plays a crucial role in the sustainability of consumers’ environmental behaviors [80]. Liu et al. found that urban residents generally have a higher level of green perception due to better access to resources and more effective policy advocacy [70]. Thapa et al. pointed out that rural residents’ green perception relies more on direct environmental experiences and community influences [81]. Urban residents are more likely to acquire green information through education and the market, whereas rural residents rely on word-of-mouth within familiar networks [82]. Urban residents are exposed to more green policies, while policy implementation in rural areas may experience delays [83]. Rural residents are more inclined toward traditional, unconscious green behaviors (e.g., resource conservation), whereas urban residents exhibit a stronger awareness of green consumption [84].
A structural model can be constructed based on the above hypotheses. Five-Layer Social Ecological Model: individual, interpersonal, community, policy, and organization (See Figure 1).
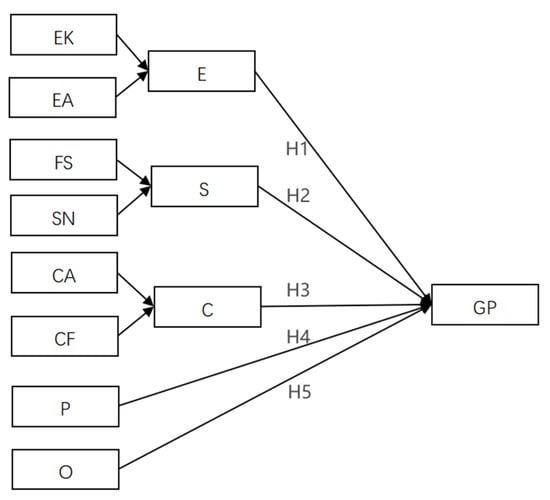
Figure 1.
Five-Layer Social Ecological Model: individual, interpersonal, community, policy, and organization (EK = environmental knowledge, EA = environmental attitude, FS = family support, SN = social network, CA = community atmosphere, CF = community facilities, E = individual level, S = interpersonal level, C = community level, P = policy, O = organization, GP = green perception).
3. Empirical Analysis
3.1. Research Method
To explore the multi-level influencing mechanisms of green perception among urban and rural residents, this study constructs a theoretical framework based on the Social Ecological Model and conducts an empirical analysis of the relationships between variables using Structural Equation Modeling (SEM). The questionnaire design uses a five-point Likert scale (1 = strongly disagree, 5 = strongly agree) to measure each latent variable. All measurement items are adapted from the existing literature and moderately revised to fit the Chinese context.
Environmental Knowledge: Includes knowledge of low-carbon living, waste sorting, climate change, etc. The items are sourced from Zhao et al. [24].
Environmental Attitude: Measures an individual’s environmental responsibility, willingness to bear costs, and recognition of environmental values. The items are adapted from Li et al. [47].
Family Support: Measures the influence of family members on individuals’ environmental behavior in terms of behavior and attitude. The items are adapted from Wang et al. [38].
Social Network: Assesses the impact of social media platforms and information sharing among friends on environmental cognition. The items are sourced from Meng et al. [40].
Community Atmosphere and Facilities: Reflects the environmental awareness of community residents and the physical environment construction of the community. The items are referenced from Zhang et al. [8] and Shengyue Fan et al. [65].
Policy Influence: Assesses the perceptibility, rationality, and transparency of government environmental policies; based on Wang et al. [63].
Organizational Factors: Includes green management practices of enterprises or organizations, employee environmental awareness training, green supply chains, etc. The items are adapted from Bag, S. et al. [73].
Green Perception: Measures an individual’s subjective attitude and self-identity in green consumption and participation in green behavior; based on Chen et al. [80].
All variables include 3–6 items. The original data were collected through the Wenjuanxing platform and social networks, with a total of 700 samples collected. After data cleaning, 301 urban and 301 rural samples were retained for subsequent analysis.
The data analysis process is as follows: first, reliability testing (Cronbach’s α) and validity verification (KMO test, Bartlett’s test of sphericity) are conducted. Confirmatory factor analysis (CFA) and structural model construction are performed using AMOS 26.0.
Model estimation uses the Maximum Likelihood (ML) method, and model fit is evaluated through fit indices such as χ2/df, RMSEA, CFI, and TLI.
In traditional urban–rural comparative studies, rural populations are typically dominated by elderly individuals and are relatively small in number [85]. However, due to the nature of online survey data, most respondents are under the age of 60, which differs significantly from the demographic structure of rural populations.
The classification of cities follows China’s latest urban scale classification standard, which categorizes cities into several levels—super first-tier, first-tier, second-tier, third-tier, and lower—based on permanent population and economic development level [86].
This classification provides a scientific basis for describing the distribution and background of the research sample, ensuring data representativeness and broad applicability.
China’s household registration system underwent a major reform in 2014, abolishing the distinction between agricultural and non-agricultural household registrations. However, due to the long-term accumulation of socio-economic conditions in urban and rural areas, significant differences remain in housing, employment, and social welfare between urban and rural populations. Therefore, in urban–rural comparative studies, respondents’ household registration origins (i.e., whether they were born into an agricultural household) can still be used to measure their socio-economic background.
The Regulations on the Statistical Division of Urban and Rural Areas clearly state that “based on China’s administrative divisions, using the jurisdictions of residents’ committees and village committees confirmed by the civil affairs department as the division objects, and actual construction as the division criterion, China is divided into urban and rural areas”.
Among them, “urban areas include urban districts and town districts. Urban districts refer to areas in municipal districts and county-level cities where actual construction is connected to residents’ committees and other areas within the jurisdiction of the district or city government”. “Town districts refer to areas outside urban districts, including county government seats and other towns where actual construction is connected to residents’ committees and other areas within the jurisdiction of the town government”. “Rural areas refer to regions outside the urban areas as defined by these regulations”.
Therefore, this study adopts a classification scheme that distinguishes between agricultural households based on rural areas and non-agricultural households based on urban and town districts as an alternative approach to urban–rural comparison. This classification method is reasonable and valid.
In the questionnaire samples collected for this study, urban residents accounted for 57%, slightly lower than the proportion of the urban population (65.22%) published by the National Bureau of Statistics in 2022 [Source: “China Statistical Yearbook [87]”]. Although it is generally believed that questionnaire collection in rural areas is more difficult, in this study, the efficiency of collecting rural samples was slightly higher than that of urban samples. This phenomenon is mainly due to differences in questionnaire distribution strategies; urban residents, due to frequent exposure to online questionnaires, generally experience participation fatigue or information filtering tendencies [87], while rural residents receive questionnaires through familiar social networks such as “WeChat Elderly Groups”, leading to higher participation willingness and better completion rates [88]. At the same time, some rural respondents reported that the environmental protection topics covered in the questionnaire were closely related to their daily lives, especially in the context of increasingly significant changes in the rural ecological environment, which triggered a stronger sense of identification and motivation to complete the questionnaire. In contrast, while urban residents have more extensive information channels, the distribution of questionnaires is more random, and coupled with information overload, the response rate is relatively lower. Based on the research objective of comparing urban and rural green perception pathways, this study ultimately selected 301 questionnaire samples from urban and rural areas, respectively, in accordance with the principle of urban–rural balance from all valid samples, for Structural Equation Modeling analysis, and to ensure the stability of model estimation and the feasibility of comparing urban and rural samples.
After questionnaire collection, samples were manually classified based on urban–rural divisions into two categories: agricultural households based on rural areas and non-agricultural households based on urban and town districts. The questionnaire covers multi-level influencing factors of green perception, including the individual level (e.g., environmental knowledge, environmental attitudes), social relationship level (e.g., family support, social networks), community level (e.g., community atmosphere, community facilities), policy level, and organizational level.
Data collection took place from December 2024 to February 2025, with a total of 700 questionnaires distributed and 602 valid responses collected, yielding a response rate of 86%. This exceeds the typical social science research standard, which requires a valid response rate of no less than 70% [89], providing a reliable basis for analyzing differences in green perception between urban and rural areas (See Table A1 and Figure 2).
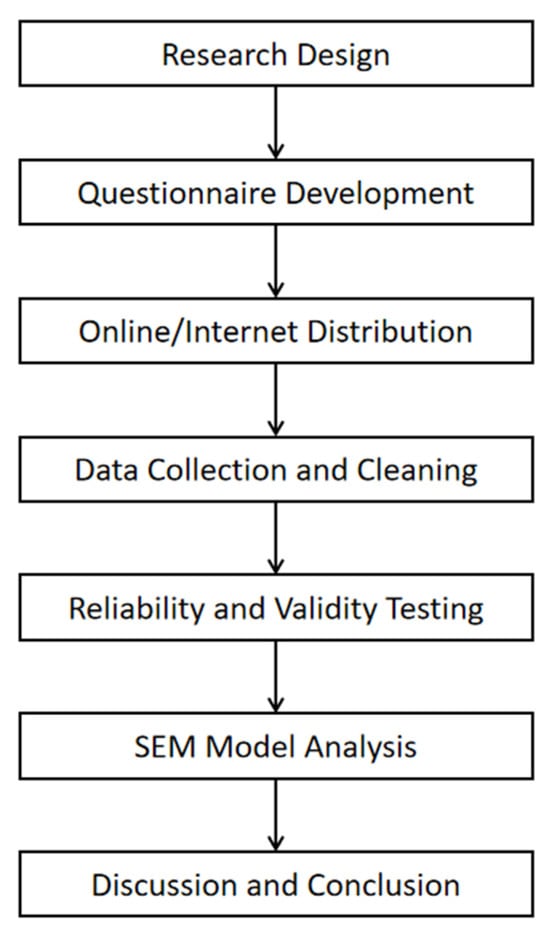
Figure 2.
Research flowchart.
3.2. Description of Sample Characteristics Distribution
This study collected 700 valid samples, covering groups with diverse genders, ages, education levels, occupations, income levels, and urban–rural backgrounds, ensuring a certain degree of representativeness.
The sample primarily consists of young and middle-aged individuals, with a slightly higher proportion of males than females. The education level is generally high, with occupations mainly concentrated in corporate employees, government/public institutions, and students. Income levels are predominantly in the middle to low range.
In terms of urban–rural household registration distribution, urban residents account for a slightly higher proportion (57%). Additionally, 66.1% of respondents have received environmental-related training or education, indicating that most participants have a certain level of environmental knowledge, providing a solid foundation for subsequent research on environmental perception, attitudes, and behaviors (See Table 1).

Table 1.
Descriptive statistics of population sample.
3.3. Reliability Analysis
The internal consistency of each dimension was analyzed using Cronbach’s alpha, with reliability coefficients ranging from 0.825 to 1, indicating good internal consistency and the high reliability of the scale. The data quality in this study is reliable, and the scale design is scientifically sound (See Table 2).
Table 2.
Reliability statistics analysis.
3.4. Validity Analysis
This study measured key factors using a scale and conducted reliability analysis on the questionnaire with SPSS Statistics 22.0. The KMO value was 0.925 (>0.8), and Bartlett’s test of sphericity was significant at 0.000 (<0.001), indicating that the data were suitable for factor analysis, supporting further factor extraction and model validation.
According to Ahrens et al. the KMO test and Bartlett’s test of sphericity are critical steps for verifying data suitability and construct validity, ensuring the scientific rigor and robustness of factor analysis results [90] (See Table 3).
Table 3.
KMO and Bartlett’s test.
Through principal component analysis and Kaiser-normalized maximum variance rotation, six distinct components were extracted, with high factor loadings (>0.7) and low cross-loadings, indicating good component independence, a stable model structure, and strong explanatory power.
This is consistent with the findings of Xiong, M. et al., who stated that KMO and Bartlett’s tests in factor analysis are effective methods for ensuring variable independence and suitability [91] (See Table 4).
Table 4.
Rotated component matrix.
Based on the good fit of the exploratory factor analysis results, a further model fit test was conducted. According to the model fit test results in the table, CMIN/DF (Chi-square to degrees of freedom ratio) = 1.760, which falls within the acceptable range of 1 to 3. RMSEA (Root Mean Square Error of Approximation) = 0.036, which falls within the good fit range of less than 0.05. Additionally, the results of IFI, TLI, CFI, and GFI all exceed 0.9, indicating an excellent fit. Therefore, based on the overall analysis results, the CFA model demonstrates good fit [92] (See Table 5).
Table 5.
Fit indices results for CFA model.
Additionally, the CFA results indicate that this study utilized Structural Equation Modeling (SEM) to validate the measurement model, with the results presented in the table. The table illustrates the convergent validity and composite reliability of the study variables, which are used to assess the reliability and validity of the measurement model.
First, convergent validity is evaluated using the Average Variance Extracted (AVE). AVE reflects the average level of variance in the measurement variables that can be explained by the latent variable. Typically, an AVE value greater than 0.5 indicates that the measurement items can adequately explain the variance of the latent variable.
As seen in the table, the AVE values for all variables range from 0.613 to 0.692, exceeding the 0.5 threshold. This indicates that the measurement model has good convergent validity, meaning the measurement items are strongly correlated and effectively measure their corresponding latent variables.
Second, composite reliability (CR) is used to assess the internal consistency of the measurement model and evaluate the overall reliability of the measurement items for each latent variable. A CR value greater than 0.7 is generally required to indicate that the scale has sufficient internal consistency.
The table shows that the CR values for all variables range from 0.826 to 0.911, meeting this standard. This indicates that the measurement items for each variable exhibit good consistency and stability, confirming the high internal consistency of the scale.
Additionally, the table includes standardized factor loadings (Estimate), which measure the correlation between each measurement item and its corresponding latent variable. Typically, a standardized factor loading greater than 0.7 is required to ensure the reliability of a measurement item.
As shown in the table, all measurement items have factor loadings greater than 0.75, meeting the standard. This indicates that these items effectively measure their respective latent variables, further supporting the convergent validity of the measurement model.
According to Bollen’s theoretical standards, the composite reliability (CR) and average variance extracted (AVE) for each latent variable were calculated [93]. The results show that all indicators meet or exceed the recommended thresholds, confirming that the scale has good convergent validity and discriminant validity.
Therefore, in summary, the measurement model in this study meets high standards for both convergent validity and composite reliability, demonstrating that the measurement of research variables is reliable and valid, providing a solid foundation for subsequent Structural Equation Modeling (SEM) analysis (See Table 6 and Figure 3).
Table 6.
Convergent validity and composite reliability.
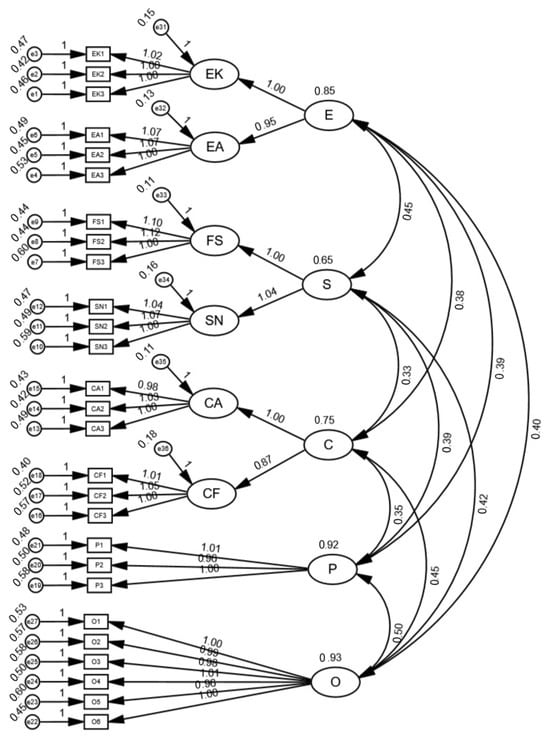
Figure 3.
CFA analysis model diagram—Five-Layer Social Ecological Model: individual, interpersonal, community, policy, and organization (EK = environmental knowledge, EA = environmental attitude, FS = family support, SN = social network, CA = community atmosphere, CF = community facilities, E = individual level, S = interpersonal level, C = community level, P = policy, O = organization, GP = green perception).
The formulas for calculating AVE and CR are as follows:
AVE (Average Variance Extracted):
CR (Composite Reliability):
This study employs the HTMT (Heterotrait–Monotrait Ratio) method to test discriminant validity, avoiding the applicability issues of the traditional Fornell–Larcker criterion in Higher-Order Factor Models [94].
Since this study’s model includes second-order latent variables, AMOS only provides the correlation matrix for second-order latent variables, making it difficult for the Fornell–Larcker method to calculate the AVE (Average Variance Extracted) for all latent variables, thereby affecting the assessment of discriminant validity.
Therefore, the HTMT method is adopted to measure the correlation between measurement items of different latent variables and calculate the Heterotrait–Monotrait Ratio, providing a more accurate evaluation of discriminant validity among latent variables.
The formula for HTMT calculation is
According to the HTMT evaluation criteria, when the HTMT value is below 0.85 (strict standard) or 0.90 (lenient standard), the measurement model is considered to have good discriminant validity. In this study, the HTMT values were calculated based on the standardized correlation matrix output by AMOS, and all HTMT values were below 0.85, indicating sufficient discriminant validity among the latent variables in the model. Therefore, the HTMT method provides a more reliable discriminant validity test for the measurement model in this study, ensuring the construct validity of the model (See Table 7).
Table 7.
HTMT discriminant validity test results for each dimension of the scale.
According to the standard proposed by Kline, if the absolute value of the skewness coefficient is within 3 and the absolute value of the kurtosis coefficient is within 8, the data can be considered to meet the requirement of approximate normal distribution [95].
This study presents the descriptive statistical analysis and normality test results for the factors used. According to the descriptive statistical analysis results, the table presents the descriptive statistical analysis and normality test results for each measurement item, including mean (Mean), standard deviation (Standard Deviation, SD), variance (Variance), skewness (Skewness), and kurtosis (Kurtosis).
Overall, the mean values for most measurement items range from 3.4 to 3.9, indicating that respondents’ attitudes toward the measured variables are moderately positive. The standard deviation ranges from 1.07 to 1.23, indicating a certain degree of data dispersion.
In terms of skewness, all measurement items have negative skewness values, indicating a left-skewed distribution overall, meaning respondents’ ratings are more concentrated in the higher score range. Most kurtosis values are close to 0 or negative, suggesting that the data distribution is relatively flat, without severe kurtosis issues. This indicates that the data generally meet the assumption of normal distribution.
The overall mean (Overall M) and overall standard deviation (Overall SD) provide a summary of each dimension, which is consistent with the mean and standard deviation of individual measurement items, indicating that the data within each dimension are relatively stable.
Based on these results, the data distribution appears reasonable and meets the normality assumptions required for subsequent Structural Equation Modeling (SEM) or regression analysis, making it suitable for further empirical analysis (See Table 8).
Table 8.
Descriptive statistics and tests of normality for each dimension.
3.5. Multicollinearity Test
To test whether there is multicollinearity among the explanatory variables in the model, this study conducted Pearson correlation analysis and calculated the Variance Inflation Factor (VIF) for the first-order latent variables. Considering that second-order latent variables are abstract aggregations of multiple first-order variables, their values are typically estimated through the structural model, making them difficult to directly use for linear correlation tests. Therefore, this study uses first-order variables directly observed from the measurement items as the basis for analysis. The results show that the correlation coefficients between all variables are significant, and there is a positive correlation at the 99% significance level. However, the correlation coefficients are all below 0.75, indicating no severe multicollinearity issues [96]. Meanwhile, the VIF values for each variable range from 1.431 to 2.343, which are well below the critical threshold for multicollinearity risk (generally recommended to be below 5) [97].
Therefore, it can be concluded that there is no serious multicollinearity issue among the explanatory variables in the model, making it suitable for subsequent structural equation modeling analysis (See Table 9).
Table 9.
Multicollinearity test.
3.6. Structural Equation Modeling (SEM)
In the quantitative analysis phase, this study employs Structural Equation Modeling (SEM) to test the path relationships between hypotheses. SEM is a statistical method capable of simultaneously analyzing complex relationships among multiple variables, making it suitable for both exploratory and confirmatory research.
Following the SEM modeling guidelines and model fit criteria proposed by Hair et al., this study utilizes AMOS 26.0 software for model estimation to ensure the significance of path coefficients and the overall model fit [98].
To ensure the rationality of the Structural Equation Model (SEM), this study conducts a model fit test using key fit indices, including CMIN/DF, GFI, TLI, CFI, RMSEA, and IFI. According to model fit standards, a CMIN/DF value between 1 and 3, GFI, TLI, CFI, and IFI values above 0.9, and an RMSEA value below 0.05 indicate a well-fitting model. The SEM fit test results in this study are CMIN/DF = 1.899, GFI = 0.922, TLI = 0.964, CFI = 0.968, RMSEA = 0.039, and IFI = 0.968, all meeting the excellent fit criteria, indicating a high overall model fit. Therefore, the SEM constructed in this study is well-structured and effectively explains the relationships between variables (See Table 10).
Table 10.
Model and data.
This study employs Structural Equation Modeling (SEM) to verify the effects of latent variables on green perception (GP). The path analysis results include standardized path coefficients (Estimate), standard errors (S.E.), critical ratios (C.R.), and significance levels (p-values). According to statistical standards, a path relationship is considered significant when p < 0.05.
The results of this study show that the individual level (E), interpersonal level (S), community level (C), policy level (P), and organizational level (O) all have significant positive effects on green perception (GP) (p < 0.05), confirming all proposed hypotheses. Among them, the interpersonal level (S) has the most significant effect on green perception (β = 0.252, p < 0.001), indicating that interpersonal relationship factors play a key role in shaping individual green perception. In addition, the individual level (β = 0.158, p < 0.001), community level (β = 0.158, p < 0.001), policy level (β = 0.140, p < 0.001), and organizational level (β = 0.145, p < 0.001) also have positive effects on green perception, although the magnitudes of these effects vary slightly.
Overall, the SEM results of this study support the theoretical hypotheses and confirm the promoting effects of the individual, interpersonal, community, policy, and organizational levels on green perception, thus supporting hypotheses H1, H2, H3, H4, and H5.
This finding provides empirical support for a deeper understanding of the formation mechanism of individual green perception and offers insights for policy-making and practical applications (See Table 11 and Figure 4).
Table 11.
Path coefficient estimates and significance analysis.
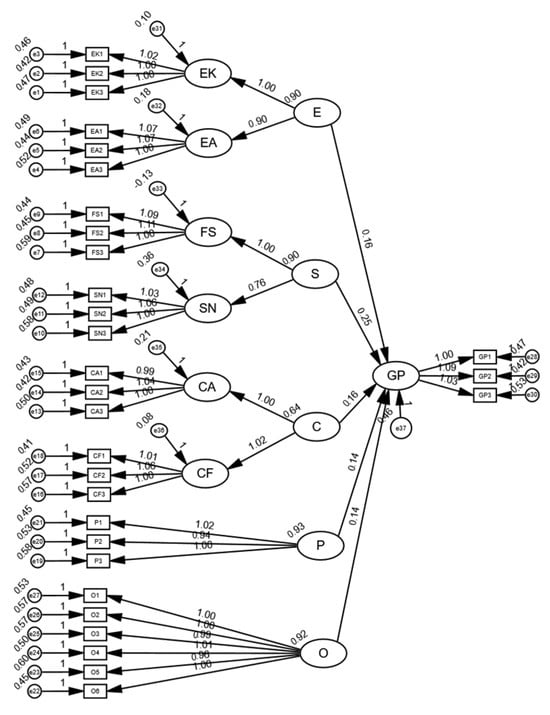
Figure 4.
SEM analysis model diagram—Five-Layer Social Ecological Model: individual, interpersonal, community, policy, and organization (EK = environmental knowledge, EA = environmental attitude, FS = family support, SN = social network, CA = community atmosphere, CF = community facilities, E = individual level, S = interpersonal level, C = community level, P = policy, O = organization, GP = green perception).
3.7. Urban–Rural Comparative Analysis
This study used Structural Equation Modeling (SEM) to separately examine the influencing factors of green perception (GP) among urban and rural residents and conducted a comparative analysis of their path relationships. Overall, there are certain similarities in the mechanisms influencing green perception between urban and rural areas, but structural differences are also evident.
In both the urban and rural models, the interpersonal level (S) has a significant positive effect on green perception (urban: β = 0.260, p < 0.001; rural: β = 0.214, p = 0.005). This indicates that, whether in urban or rural areas, individuals’ social interactions and support from family, friends, or communities enhance residents’ green perception to a certain extent [39].
Moreover, the policy level (P) has a significant effect on green perception in the rural model (β = 0.298, p < 0.001), but is not significant in the urban model (p = 0.533), which may be related to the directness of policy implementation and stronger government-led promotion in rural areas [65].
The individual level (E) has a significant positive effect on green perception in the urban model (β = 0.256, p < 0.001), but is not significant in the rural model (p = 0.062). This reflects that urban residents are more likely to access environmental knowledge through education, media, and social networks, thereby enhancing green perception, whereas rural residents may face limitations in information dissemination channels and have relatively less access to environmental knowledge, affecting their cognitive level [32].
The community level (C) has a significant impact on green perception in the urban model (β = 0.102, p = 0.057), while the impact is weaker in the rural model (β = 0.205, p = 0.011). This is because urban communities have more developed environmental atmospheres, public facilities, and the promotion of sustainable lifestyles, which help foster green awareness, whereas rural community influence may be more dispersed and weaker [49].
The organizational level (O) significantly affects green perception in the urban model (β = 0.204, p = 0.006) but is not significant in the rural model (p = 0.133). This suggests that urban environmental development, green infrastructure, and city-level development policies contribute more to enhancing residents’ green perception, while rural residents’ green cognition is less influenced by organizational factors [79].
3.8. Urban SEM Model Fit Test Results and Path Relationship Hypothesis Testing Results
The model test results show that CMIN/DF = 1.666, GFI = 0.871, TLI = 0.948, CFI = 0.954, RMSEA = 0.047, and IFI = 0.955. Among these, CMIN/DF, TLI, CFI, IFI, and RMSEA all meet the excellent fit criteria, while GFI is 0.871, falling within the acceptable fit range. Overall, the model demonstrates a high level of fit, meeting the SEM fit standards, which indicates that the model structure is reasonable and effectively explains the data (See Table 12).
Table 12.
Urban model and data.
The results show that the individual level (E), interpersonal level (S), and organizational level (O) all have significant positive effects on green perception (GP) (p < 0.01), supporting the corresponding hypotheses. Among these, the individual level (β = 0.256, p < 0.001) and the interpersonal level (β = 0.260, p < 0.001) have more pronounced effects on green perception, indicating that personal environmental knowledge and social interaction play a key role in enhancing green perception. In addition, the organizational level (β = 0.204, p < 0.001) also influences green perception to some extent, suggesting that the urban environment may affect individuals’ formation of green cognition, thus supporting hypotheses H1, H2, and H5.
However, the community level (C) and policy level (P) do not have significant effects on green perception (p > 0.05), and the corresponding hypotheses are not supported. This suggests that in the urban model, community atmosphere and policy factors may not significantly influence individual green perception, which could be related to specific urban governance patterns, the strength of policy implementation, or individual perception differences. In summary, the SEM results of this study partially support the theoretical hypotheses, indicating that environmental knowledge, social support, and organizational factors are important influences on green perception, while the impacts of community atmosphere and policy factors were not significantly confirmed in this study. These findings provide empirical support for further optimizing urban sustainable development strategies (See Table 13 and Figure 5).
Table 13.
Urban path coefficient estimates and significance analysis.
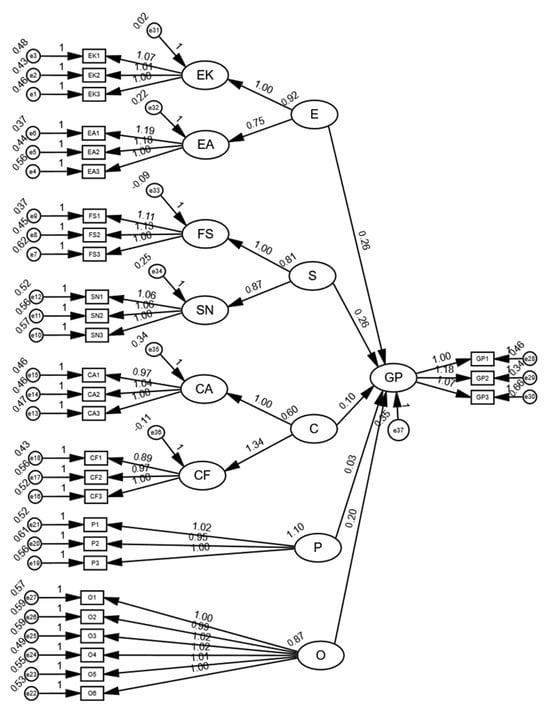
Figure 5.
Urban SEM analysis model diagram—Five-Layer Social Ecological Model: individual, interpersonal, community, policy, and organization (EK = environmental knowledge, EA = environmental attitude, FS = family support, SN = social network, CA = community atmosphere, CF = community facilities, E = individual level, S = interpersonal level, C = community level, P = policy, O = organization, GP = green perception).
3.9. Rural SEM Model Fit Test Results and Path Relationship Hypothesis Testing Results
The rural SEM model fit test results in this study are CMIN/DF = 1.445, GFI = 0.894, TLI = 0.964, CFI = 0.968, RMSEA = 0.047, and IFI = 0.968. Among these, CMIN/DF, TLI, CFI, IFI, and RMSEA all meet the excellent fit criteria, while GFI is 0.894, which is close to the excellent fit standard but still within the acceptable fit range. Overall, the model demonstrates a high level of fit, meeting the fit standards of Structural Equation Modeling (SEM), indicating that the model effectively explains the relationships between variables and provides a reliable theoretical foundation for subsequent path analysis (See Table 14)
Table 14.
Rural model and data.
The model results indicate that the interpersonal level (S) and policy level (P) have significant positive effects on green perception (GP) (p < 0.01), supporting the corresponding hypotheses. Among them, the policy level (β = 0.298, p < 0.001) and interpersonal level (β = 0.214, p = 0.005) are key influencing factors of rural residents’ green perception, indicating that policy measures and social interaction play crucial roles in fostering green awareness in rural areas. Additionally, the community level (C) has a significant effect on green perception at the P = 0.011 level, suggesting that community atmosphere exerts a certain influence on green perception, thus supporting hypotheses H2, H3, and H4.
However, the individual level (E) and organizational level (O) do not significantly influence green perception (p > 0.05), and the corresponding hypotheses are not supported. This suggests that in rural contexts, individual environmental knowledge and organizational factors may not directly affect green perception, which could be related to rural residents’ lifestyles, information access channels, and mechanisms of environmental cognition formation. Overall, the SEM results for rural areas partially support the theoretical hypotheses, confirming the important role of social support and policy in promoting green perception among rural residents, while the effects of environmental knowledge and organizational factors were not significantly validated. This finding provides important empirical evidence for the formulation of rural sustainable development policies (See Table 15 and Figure 6).
Table 15.
Rural path coefficient estimates and significance analysis.
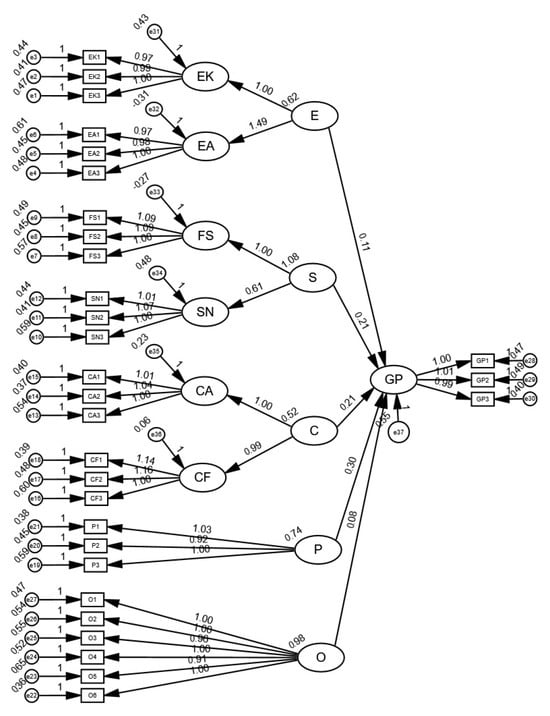
Figure 6.
Rural SEM analysis model diagram—Five-Layer Social Ecological Model: individual, interpersonal, community, policy, and organization (EK = environmental knowledge, EA = environmental attitude, FS = family support, SN = social network, CA = community atmosphere, CF = community facilities, E = individual level, S = interpersonal level, C = community level, P = policy, O = organization, GP = green perception).
4. Discussion
This study used Structural Equation Modeling (SEM) to analyze the factors influencing urban and rural residents’ green perception (GP) and compared the differences in their path relationships. The results indicate that social support (S) is a common factor influencing green perception in both urban and rural areas, while the impact patterns of environmental knowledge (E), community atmosphere (C), policy (P), and organizational factors (O) differ significantly between urban and rural environments.
First, social support (S) is a significant positive factor influencing green perception in both urban and rural models. This suggests that regardless of location, support networks from family, friends, and the community effectively enhance individuals’ green perception. This finding is consistent with previous studies indicating that social interactions and community atmosphere strengthen residents’ environmental awareness and green behaviors [25]. For governments and social organizations, promoting green lifestyles in both urban and rural contexts should involve enhancing community cooperation and social network development to foster green perception and sustainable behavior through interpersonal interactions.
Second, environmental knowledge (E) has a significant impact on urban residents but is not significant for rural residents. This may be related to differences in information access channels, education levels, and environmental awareness. Urban residents can easily access environmental knowledge through the internet, media, and educational institutions, thereby enhancing green perception [54]. In contrast, rural areas have limited information dissemination, reducing the impact of environmental knowledge on rural residents.
Additionally, the community level (C) plays a significant role in the formation of green perception among urban residents, while its impact is weaker among rural residents. This finding is somewhat inconsistent with previous studies, which may be due to the more developed infrastructure, public services, and green development atmosphere in urban communities, while rural communities have fewer green activities, and rural residents pay less attention to their community environment. Therefore, rural areas should improve community environments, strengthen public infrastructure, and promote green community activities to enhance residents’ green perception levels [48].
Policy (P) has a significant impact on rural residents’ green perception but is not significant for urban residents. This suggests that in rural areas, government policies and intervention measures directly shape residents’ green perception, whereas urban residents are more influenced by personal and social environmental factors [63]. This finding highlights the need for targeted policy interventions in rural areas, such as green subsidies, environmental project support, and green industry promotion, to effectively enhance residents’ green perception.
Finally, organizational factors (O) significantly influence green perception in the urban model but are not significant in the rural model. This may indicate that urban development, infrastructure, and green policies play a more substantial role in shaping urban residents’ green perception, whereas rural residents pay less attention to these factors [79]. Therefore, in advancing urban–rural green development, cities should focus more on green infrastructure, while rural areas should strengthen community and policy guidance to bridge the urban–rural green development gap.
5. Conclusions and Recommendations
5.1. Conclusions
In this study, urban residents’ green perception is less influenced by policies. This phenomenon may be related to the frequency and prevalence of urban residents’ long-term exposure to green policies, environmental protection technologies, and media campaigns. Green policies, environmental technology promotion, and environmental education activities are increasingly popular in urban areas. Urban residents are exposed to a variety of sources of green information in their daily lives, and green behavior has become a reflection of social identity and consumer culture. For example, low-carbon consumption, environmentally friendly travel, green buildings, and other practices have gradually integrated into urban residents’ lifestyles, becoming part of social and cultural identity. These green behaviors are more likely to spread through social networks, such as peer effects and social media dissemination, rather than relying solely on the promotion of government policies. In this case, urban residents’ green behavior shows a stronger drive for self-actualization; that is, they reflect personal environmental values and social responsibility by choosing sustainable lifestyles, rather than merely complying with policy requirements [29]. This aligns with the research of Dalin Li et al. [99], who pointed out that moral identity plays a particularly prominent role in green consumption. Green consumption is more a reflection of personal values rather than just a response to policy actions. This phenomenon suggests that urban residents’ green perception is more driven by consumer culture and social interaction, rather than mere policy compliance.
In contrast, rural residents’ green perception is more dependent on policy implementation and community identification. In rural areas, environmental cognition is often less influenced by external green information and more dependent on government subsidy policies, policy promotion, and collective community actions. In rural areas, due to a social structure that emphasizes collectivism and community identity, the government plays a particularly important role in green promotion. Government green incentive policies, environmental protection subsidies, and sustainable agricultural technology support often become the direct driving forces behind residents’ green behavior. This mechanism indicates that rural residents’ green perception formation is more inclined toward an institutional dependency model, meaning their environmental behavior largely depends on government policy incentives, subsidies, and community activities, rather than improvements in personal cognition or autonomous awareness [72]. For example, Songze Wu et al. [100] in their research pointed out that the promotion of green production in rural areas often relies on the dual drive of government subsidies and technical support. This model is particularly evident in rural areas, where policy implementation not only provides financial support for green production but also enhances farmers’ environmental awareness through technical guidance. However, the sustainability of rural green perception faces significant challenges because once this policy-dependent green behavior loses policy support, residents’ green practices may quickly fade. Green behavior in rural areas lacks sufficient autonomy and long-term dimensionality, and therefore, its sustainability and spontaneity are often weak.
Overall, the differences in the mechanisms of green perception formation between urban and rural areas reflect the imbalance in urban and rural green development. Urban green perception is driven by the continuous influence of policies and interactions within social networks, while rural green perception is more dependent on the combined effect of policy support and community actions. The differences in green perception between the two are not only reflected in behavioral patterns but also in the differentiated implementation and effects of green policies in urban and rural areas. In future green policy design, considering the differences in urban and rural green perception, the government should formulate region-specific policies to ensure that green development in different areas can promote the sustained development of green behaviors through the dual influence of individual cognition and social support.
Organizational factors play different roles in urban and rural green perception. In urban areas, green perception is strongly influenced by corporate green behavior and organizational advocacy. Green behavior in urban areas is usually closely related to the market economy, with businesses influencing consumers’ environmental attitudes and behavior through green marketing, product promotion, and brand shaping. These methods intertwine green cognition with market mechanisms, gradually guiding green products and environmental concepts as consumption trends for the middle and upper-income classes. In this environment, urban residents’ green cognition tends to be more commercialized, becoming part of consumer culture and rapidly expanding through dissemination channels like social networks and advertisements. However, this market-driven green perception also brings the problem of over-commercialization, where “green consumption” gradually becomes a social privilege of the middle- and upper-income classes, marginalizing low-income groups in green consumption. Research shows that green consumption has high entry barriers. Low-income groups, due to economic burdens, are unable to afford high-cost sustainable products, often leading to their exclusion and an increasing gap in environmental protection behaviors between income groups. For example, Xiong et al. [101] pointed out that the disparity in the benefits of green infrastructure and environmental protection measures often leads to an increase in social inequality, rather than narrowing the participation gap in environmental protection.
In rural areas, green cognition is more dependent on government policy incentives and external pushes from local cooperatives, village collectives, and friends and family networks. Since green behavior in rural areas is often realized through small-scale community activities or local policy influences, these impacts are usually localized and spread more slowly. Therefore, rural residents’ green behavior relies less on market mechanisms and is influenced more by external factors such as policy incentives and social support. Rural residents are more inclined to respond to government subsidies and policy incentives in their environmental protection behavior, rather than proactively taking on environmental responsibilities. This policy dependency model also reflects the path dependency of rural green perception, meaning that residents’ green behavior is more reliant on external incentives rather than internalizing environmental protection values. Qi-Song Yan et al. [102] pointed out that green behavior in rural areas demonstrates short-term behaviorism, where residents’ environmental actions are often in response to external factors such as government subsidies. When policy support weakens, green behavior is hard to sustain.
This path dependency and policy reliance model reveals the differences in the mechanisms of green cognition and behavior formation between urban and rural areas, further exposing the contradictions in urban–rural sustainable development. In urban areas, market-driven green behavior often promotes the popularity of green consumption, but this model also exacerbates social inequality, as low-income groups struggle to enjoy the benefits of environmental products. In contrast, in rural areas, policy-driven green behavior can more directly promote environmental protection technologies and green production, but this dependency makes the sustainability of green behavior uncertain. Once policy support is withdrawn, environmental behavior may fade. Therefore, the contradictions in urban and rural development models, especially the differences in the sustainability of green behavior, present new challenges for the formulation of sustainable development policies.
5.2. Policy Recommendations and Insights
The findings of this study indicate that there are significant differences in the mechanisms of green cognition formation between urban and rural areas, which raises higher demands for the implementation of sustainable development policies. In the future, attention should be focused on the following strategies to bridge the gap in green cognition between urban and rural areas and build a more inclusive green development system.
Through subsidies and preferential policies, make green consumption more inclusive, and prevent environmental protection behaviors from becoming exclusive labels for the wealthy. Encourage enterprises to adopt more affordable green product strategies to attract a wider consumer base. The government can provide subsidies or tax incentives for green products to low-income groups, reducing the cost of their participation in green consumption, thereby achieving the popularization and fairness of green consumption.
Based on policy support, guide residents to form autonomous environmental awareness. The government should strengthen environmental protection education to enhance the public’s intrinsic awareness of environmental protection, so that green behavior no longer relies solely on external policy incentives. At the same time, promote the localized application of green technologies, enabling them to be effectively spread and implemented between urban and rural areas, promoting green development that does not rely on short-term policy stimuli but becomes an endogenous driving force for community development.
Through cooperation between the government, communities, and enterprises, increase the dissemination of green technologies and reduce reliance on policies for environmental behaviors. Promote interaction between urban and rural areas in terms of green resources, technologies, and information dissemination. The government should encourage urban enterprises to invest in sustainable agriculture in rural areas, promoting the sharing and cooperation of green technologies and knowledge between urban and rural areas.
By establishing a “green symbiotic economy” model, such as developing low-carbon supply chains, combining urban green consumption demands with rural environmentally friendly agricultural production, and creating a mutually beneficial green economic model. This can not only enhance the synergistic effect of urban and rural green development but also promote the bidirectional participation of urban and rural residents in green consumption and production.
6. Research Limitations and Future Prospects
Although this study conducted a comparative analysis of generational differences, no significant results were found. Possible reasons include the following: First, the impact mechanisms of generational differences may be influenced by culture, social identity, and regional differences, which are difficult to capture through a simple questionnaire survey. The integrated method proposed by Thakuriah et al. [103], which combines surveys with real-time sensor data, can provide a more detailed understanding, capturing environmental interactions and flow patterns, thus offering a more precise analysis of generational behavior. Second, the impact of generational differences may require more detailed stratified research, such as combining different age groups with factors such as their social background and education level for deeper analysis. Although this study did not reveal significant impacts of generational differences, this issue warrants further attention in future research. Future research should consider expanding the sample size, refining generational groups, and incorporating more complex socio-economic factors to explore the potential impact of generational differences on green behavior.
Exposure to environmental pollution may also have a significant impact on green perception, but this study’s questionnaire design did not include quantitative measures related to exposure to environmental pollution. Since the focus of the study was on the mechanisms and influencing factors of green perception in urban and rural areas, the survey design focused more on variables such as environmental knowledge, social support, and policy influence, and did not fully consider the role of environmental pollution exposure as an independent variable. Additionally, due to limitations in sample design and the scope of the study, this research did not explore pollution exposure experiences in detail. Future research can further explore the potential impact of environmental pollution exposure on green perception by adding relevant measurement items and incorporating respondents’ experiences with environmental pollution exposure.
Moreover, this study is based on urban and rural samples from China and did not explore the role of cultural differences in green perception. China’s collectivist culture has a profound influence on social behavior, especially in rural areas, where green perception may be more influenced by community collective activities and family identity, while urban residents are more driven by individualism and autonomous decision-making. Therefore, future research should further explore the role of cultural differences (such as collectivism and individualism) in green perception to help understand the differences in green behavior across different cultural backgrounds.
In conclusion, although this study provides valuable insights into urban and rural green perception, future research can incorporate factors such as generational differences, environmental pollution exposure, and cultural differences to provide a more comprehensive and detailed theoretical basis for promoting green behavior and policy-making.
Author Contributions
Conceptualization, Y.F. (Yi Feng); Methodology, Y.F. (Yi Feng); Software, Y.F. (Yi Feng); Validation, Y.F. (Yi Feng); Formal analysis, Y.F. (Yi Feng); Investigation, Y.F. (Yi Feng); Resources, Y.F. (Yi Feng); Data curation, Y.F. (Yu Feng); Writing—original draft, Y.F. (Yu Feng); Writing—review & editing, Y.F. (Yu Feng); Visualization, Y.F. (Yu Feng); Supervision, Y.F. (Yu Feng) and Z.L.; Project administration, Y.F. (Yu Feng); Funding acquisition, Y.F. (Yu Feng). All authors have read and agreed to the published version of the manuscript.
Funding
This research received no external funding.
Institutional Review Board Statement
According to China’s regulations, ethical approval can be exempted since this research involves de-identified, anonymous data and poses minimal risk to participants, in accordance with the Ethical Review Methods for Life Sciences and Medical Research Involving Humans, issued by the National Health Commission in February 2023. The full text of the regulation can be accessed at: https://www.gov.cn/zhengce/2023-02/28/content_5743660.htm (accessed on 8 April 2025).
Informed Consent Statement
Informed consent was obtained from all subjects involved in the study.
Data Availability Statement
The raw data supporting the conclusions of this article will be made available by the authors on request.
Conflicts of Interest
The authors declare no conflict of interest.
Abbreviations
The following abbreviations are used in this manuscript:
| SEM | Structural Equation Modeling |
| SPSS | Statistical Package for the Social Sciences |
| AMOS | Analysis of Moment Structures |
| CR | Composite Reliability |
| AVE | Average Variance Extracted |
| VIF | Variance Inflation Factor |
| EK | Environmental Knowledge |
| EA | Environmental Attitude |
| FS | Family Support |
| SN | Social Network |
| CA | Community Atmosphere |
| CF | Community Facilities |
| E | Individual Level |
| S | Interpersonal Level |
| C | Community Level |
| P | Policy |
| O | Organization |
| GP | Green Perception |
Appendix A
Table A1.
Questionnaire.
Table A1.
Questionnaire.
| Variable | Code | Item | Source |
|---|---|---|---|
| Environmental Knowledge | EK1 | I understand the specific connotations of a low-carbon lifestyle. | Zhao, R. et al. [24] |
| EK2 | I know the specific classification methods for different types of waste in waste sorting. | ||
| EK3 | I understand the impact of greenhouse gas emissions on global climate. | ||
| Environmental Attitude | EA1 | I believe that everyone has a responsibility to protect the environment. | Li, S. et al. [47] |
| EA2 | Even if environmental protection behaviors increase living costs, I am still willing to support them. | ||
| EA3 | Improving the environment is an important prerequisite for enhancing quality of life. | ||
| Family Support | FS1 | My family members usually participate in environmental protection activities such as waste sorting. | Wang, H. et al. [38] |
| FS2 | Someone in my family encourages me to choose green consumption or a low-carbon lifestyle. | ||
| FS3 | My family often reminds me to conserve energy, such as reducing electricity or water usage. | ||
| Social Network | SN1 | I often see discussions or promotions about environmental protection on social media platforms. | Meng, Y. et al. [40] |
| SN 2 | My friends frequently share information or news related to environmental protection. | ||
| SN 3 | I have learned about government environmental policies through Moments or WeChat groups. | ||
| Community Atmosphere | CA1 | My community frequently organizes environmental-themed activities, such as tree planting or Clean-up Days. | Zhang, Y. et al. [8] |
| CA2 | Community residents generally support environmental behaviors such as waste sorting. | ||
| CA3 | I feel that residents in my community have a high level of concern for environmental protection. | ||
| Community Facilities | CF1 | The waste sorting facilities in my community are well-planned, making it convenient for residents to sort their waste. | Shengyue Fan et al. [65] |
| CF2 | My community provides ample green public spaces (such as parks and green areas), which help improve residents’ quality of life. | ||
| CF2 | My community has promoted energy-saving facilities (such as solar-powered streetlights and water-saving devices), and residents support and recognize these initiatives. | ||
| Policies | P1 | I believe that the environmental policies implemented by the government (such as waste sorting) are reasonable. | Wang, Z. et al. [63] |
| P2 | I can perceive the effects of environmental policies in daily life. | ||
| P3 | The government demonstrates a high level of transparency when promoting environmental policies. | ||
| Organization | O1 | My organization actively promotes green production or service models to reduce negative environmental impacts. | Zhu, C. et al. [73] |
| O2 | My organization prioritizes green supply chain management, choosing low-carbon or environmentally friendly suppliers for collaboration. | ||
| O3 | My organization promotes green office practices internally, such as energy conservation and paperless operations. | ||
| O4 | My organization regularly provides environmental training or activities for employees to enhance overall green awareness. | ||
| O5 | My organization publicly discloses environmental practices and achievements, such as publishing green development reports or promoting corporate environmental initiatives. | ||
| O6 | My organization is willing to invest more resources in technology and funding to achieve green transformation and low-carbon development. | ||
| Green Perception | GP1 | I am willing to actively change my daily behavior to reduce environmental pollution, such as reducing the use of single-use plastic products. | Chen, C. et al. [80] |
| GP2 | I often prioritize purchasing products with environmental certifications or low-carbon labels when shopping. | ||
| GP3 | I actively participate in community-organized environmental activities, such as waste sorting campaigns or tree planting events. |
References
- Yttredal, E.; Homlong, N. Perception of Sustainable Development in a Local World Heritage Perspective. Sustainability 2020, 12, 8825. [Google Scholar] [CrossRef]
- Mastria, S.; Vezzil, A.; De Cesarei, A. Going Green: A Review on the Role of Motivation in Sustainable Behavior. Sustainability 2023, 15, 15429. [Google Scholar] [CrossRef]
- Qu, S.; Liu, J.; Li, B.; Chen, D.; Xie, H.; Li, W. Unveiling the Driver behind China’s Greening Trend: Urban vs. Rural Areas. Environ. Res. Lett. 2023, 18, 084027. [Google Scholar] [CrossRef]
- Qi, A.; Ji, Z.; Gong, Y.; Yang, B.; Sun, Y. The Impact of the Gain-Loss Frame on College Students’ Willingness to Participate in the Individual Low-Carbon Behavior Rewarding System (ILBRS): The Mediating Role of Environmental Risk Perception. Int. J. Environ. Res. Public Health 2022, 19, 11008. [Google Scholar] [CrossRef] [PubMed]
- Cheng, H.; Mao, C. Disparities in Environmental Behavior from Urban–Rural Perspectives: How Socioeconomic Status Structures Influence Residents’ Environmental Actions—Based on the 2021 China General Social Survey Data. Sustainability 2024, 16, 7886. [Google Scholar] [CrossRef]
- van Tol, J.; Miller, K.G.; Ardoin, N.M. A Social Ecological Model of Education: Economic Problems, Citizenship Solutions. J. Environ. Educ. 2023, 55, 249–266. [Google Scholar] [CrossRef]
- Kim, T.; Choi, S.; Kim, J.; Heo, C.Y. An Investigation of Customer Psychological Perceptions of Green Consciousness in a Green Hotel Context: Applying an Extended Theory of Planned Behavior. Int. J. Environ. Res. Public Health 2022, 19, 6795. [Google Scholar] [CrossRef]
- Zhang, Y.; Chabay, I. How “Green Knowledge” Influences Sustainability through Behavior Change: Theory and Policy Implications. Sustainability 2020, 12, 6448. [Google Scholar] [CrossRef]
- Thiruchitrambalam, M.; Alavudeen, A.; Athijayamani, A.; Purushothaman, D.; Rajini, N. Physico-Mechanical Property Evaluation and Morphology Study of Moisture-Treated Hemp–Banana Natural-Fiber-Reinforced Green Composites. J. Compos. Sci. 2023, 7, 266. [Google Scholar] [CrossRef]
- Karuppiah, S.; Ramakrishnan, K.; Sankaranarayanan, B.; Duraisamy, R.; Mani, M.; Jawahar, A. Sustainable Thermoplastic Material Selection for Hybrid Vehicle Battery Packs in the Automotive Industry: A Comparative Multi-Criteria Decision-Making Approach. Polymers 2024, 16, 2768. [Google Scholar] [CrossRef]
- Ocaña-Ortiz, A.; Gea-Caballero, V.; Juárez-Vela, R.; Peiró, R.; Pérez-Sanz, E.; Santolalla-Arnedo, I.; Sufrate-Sorzano, T.; Garrote-Cámara, M.E.; Paredes-Carbonell, J.J. Health Equity in Urban and Rural Settings: Implementation of the Place Standard Tool in Spain. Front. Public Health 2024, 12, 1292032. [Google Scholar] [CrossRef]
- Vesely, S.; Klöckner, C.A. Social Desirability in Environmental Psychology Research: Three Meta-Analyses. Front. Psychol. 2020, 11, 1395. [Google Scholar] [CrossRef] [PubMed]
- Xie, S.; Madni, G.R. Impact of Social Media on Young Generation’s Green Consumption Behavior through Subjective Norms and Perceived Green Value. Sustainability 2023, 15, 3739. [Google Scholar] [CrossRef]
- Kim, L.; Li, C. Attraction and Retention Green Place Images of Taipei City. Forests 2024, 15, 710. [Google Scholar] [CrossRef]
- Duque Oliva, E.J.; Sánchez-Torres, J.A.; Arroyo-Cañada, F.-J.; Argila-Irurita, A.; Fuente, J.G.-L.; Palacio-López, S.-M.; Arrubla-Zapata, J.-P. Green Buying Behaviour: An Integrated Model. Sustainability 2024, 16, 4441. [Google Scholar] [CrossRef]
- Fu, L.; Sun, Z.; Zha, L.; Liu, F.; He, L.; Sun, X.; Jing, X. Environmental Awareness and Pro-Environmental Behavior within China’s Road Freight Transportation Industry: Moderating Role of Perceived Policy Effectiveness. J. Clean. Prod. 2020, 252, 119796. [Google Scholar] [CrossRef]
- Pasca, L.; Aragonés, J.I.; Coello, M.T. Pride and Guilt as Mediators in the Relationship between Connection to Nature and Pro-Environmental Intention. Clim. Change 2022, 175, 5. [Google Scholar] [CrossRef]
- Zafar, H.; Tian, F.; Ho, J.A.; Roh, T.; Latif, B. Understanding Voluntary Pro-Environmental Behavior among Colleagues: Roles of Green Crafting, Psychological Empowerment, and Green Organizational Climate. Bus. Strat. Environ. 2025, 34, 468–482. [Google Scholar] [CrossRef]
- Yue, T.; Zhang, L.; Long, R.; Chen, H.; Liu, B. Will Low-Carbon Purchasing Behavior Make Residents’ Behaviors Greener? Research Based on Spillover Effects. Front. Environ. Sci. 2021, 9, 783486. [Google Scholar] [CrossRef]
- Wu, M.; Long, R. How Do Perceptions of Information Usefulness and Green Trust Influence Intentions Toward Eco-Friendly Purchases in a Social Media Context? Front. Psychol. 2024, 15, 1429454. [Google Scholar] [CrossRef]
- Bronfenbrenner, U. The Ecology of Human Development: Experiments by Nature and Design; Harvard University Press: Cambridge, MA, USA, 1979. [Google Scholar]
- Nonyel, N.P.; Wisseh, C.; Riley, A.C.; Campbell, H.E.; Butler, L.M.; Shaw, T. Conceptualizing Social Ecological Model in Pharmacy to Address Racism as a Social Determinant of Health. Am. J. Pharm. Educ. 2021, 85, 8584. [Google Scholar] [CrossRef] [PubMed]
- Jalu, G.; Dasalegn, G.; Japee, G.; Tangl, A.; Boros, A. Investigating the Effect of Green Brand Innovation and Green Perceived Value on Green Brand Loyalty: Examining the Moderating Role of Green Knowledge. Sustainability 2024, 16, 341. [Google Scholar] [CrossRef]
- Zhao, R.; Li, X.; Zhang, Y.; Wang, L.; Liu, G. Greenhouse Gas Emissions Analysis Working toward Zero-Waste and Its Indication to Low Carbon City Development. Energies 2021, 14, 6644. [Google Scholar] [CrossRef]
- Zhang, G.; Wang, L.; Meng, H. Environmental Knowledge Level and Consumer Behavior Regarding Green Fashion: A Moderated Mediation Model. Asia Pac. J. Mark. Logist. 2023, 35, 977–992. [Google Scholar] [CrossRef]
- Goel, A.; Iyer-Raniga, U.; Jain, S.; Addya, A.; Srivastava, S.; Pandey, R.; Rathi, S. Student Perceptions of Environmental Education in India. Sustainability 2023, 15, 15346. [Google Scholar] [CrossRef]
- Ajzen, I. The Theory of Planned Behavior. Organ. Behav. Hum. Decis. Process. 1991, 50, 179–211. [Google Scholar] [CrossRef]
- Kollmuss, A.; Agyeman, J. Mind the Gap: Why Do People Act Environmentally and What Are the Barriers to Pro-Environmental Behavior? Environ. Educ. Res. 2002, 8, 239–260. [Google Scholar] [CrossRef]
- Yue, T.; Wang, Q.; Long, R.; Chen, H.; Li, M.; Liu, H. Impact of Urban Residents’ Environmental Cognition on Voluntary Carbon-Reduction Behavior: The Mediating Role of Environmental Emotion. Int. J. Environ. Res. Public Health 2022, 19, 15710. [Google Scholar] [CrossRef]
- Hlaváček, M.; Čábelková, I.; Brož, D.; Smutka, L.; Prochazka, P. Examining Green Purchasing: The Role of Environmental Concerns, Perceptions on Climate Change, Preferences for EU Integration, and Media Exposure. Front. Environ. Sci. 2023, 11, 1130533. [Google Scholar] [CrossRef]
- Stern, P.C. Toward a Coherent Theory of Environmentally Significant Behavior. J. Soc. Issues 2000, 56, 407–424. [Google Scholar] [CrossRef]
- Gifford, R.; Nilsson, A. Personal and Social Factors That Influence Pro-Environmental Concern and Behaviour: A Review. Int. J. Psychol. 2014, 49, 141–157. [Google Scholar] [CrossRef] [PubMed]
- Hossain, S.M.I.; Nekmahmud, M.; Fekete-Farkas, M. How Do Environmental Knowledge, Eco-Label Knowledge, and Green Trust Impact Consumers’ Pro-Environmental Behaviour for Energy-Efficient Household Appliances? Sustainability 2022, 14, 6513. [Google Scholar] [CrossRef]
- Taufique, K.M.R.; Islam, S. Green Marketing in Emerging Asia: Antecedents of Green Consumer Behavior among Younger Millennials. J. Asia Bus. Stud. 2021, 15, 541–558. [Google Scholar] [CrossRef]
- Hoffmann, R.; Muttarak, R. Greening through Schooling: Understanding the Link between Education and Pro-Environmental Behavior in the Philippines. Environ. Res. Lett. 2020, 15, 014009. [Google Scholar] [CrossRef]
- Encho, H.; Murayama, H.; Taguchi, A.; Otsuka, K.; Murashima, S.; Fujiwara, Y. Walking and Perception of Green Space among Older Adults in Japan: Subgroup Analysis Based on Self-Efficacy. Health Promot. Int. 2023, 38, daac175. [Google Scholar] [CrossRef] [PubMed]
- Hu, G.; Wang, J.; Laila, U.; Fahad, S.; Li, J. Evaluating Households’ Community Participation: Does Community Trust Play Any Role in Sustainable Development? Front. Environ. Sci. 2022, 10, 951262. [Google Scholar] [CrossRef]
- Wang, H.; Zhang, S.; Wang, S.; Zou, L. The Spillover Influence of Household Waste Sorting on Green Consumption Behavior by Mediation of Environmental Concern: Evidence from Rural China. Int. J. Environ. Res. Public Health 2020, 17, 9110. [Google Scholar] [CrossRef]
- Ahmat Zainuri, N.; Abd-Rahman, N.; Halim, L.; Chan, M.Y.; Mohd Bazari, N.N. Measuring Pro-Environmental Behavior Triggered by Environmental Values. Int. J. Environ. Res. Public Health 2022, 19, 16013. [Google Scholar] [CrossRef]
- Meng, Y.; Chung, D.; Zhang, A. The Effect of Social Media Environmental Information Exposure on the Intention to Participate in Pro-Environmental Behavior. PLoS ONE 2023, 18, e0294577. [Google Scholar] [CrossRef]
- Nivedhitha, K.; Sajeetha, S.; Vasantha, S. How Green Social Network Affordances Enhance Pro-Environmental Behaviour? Int. J. Consum. Stud. 2024, 48, e13038. [Google Scholar] [CrossRef]
- Bjarnason, T.; Olafsson, K.; Arnarsson, A.M. Closest Family in the Household or in the Community? The Role of Family in Residential Satisfaction among Intended Stayers in Iceland. Popul. Space Place 2023, 29, e2714. [Google Scholar] [CrossRef]
- Wu, Z.; Jin, M.; Cao, H. Residents’ Environmental Behavior in Eco-Community Development and Its Influencing Factors: Evidence from Dongying City, Shandong Province in China. Sustain. Dev. 2024, 32, 4338–4353. [Google Scholar] [CrossRef]
- Bandura, A. Social Learning Theory; Prentice-Hall: Englewood Cliffs, NJ, USA, 1977. [Google Scholar]
- Tajfel, H.; Turner, J.C. The Social Identity Theory of Intergroup Behavior. In Psychology of Intergroup Relations; Worchel, S., Austin, W.G., Eds.; Nelson-Hall: Chicago, IL, USA, 1986; pp. 7–24. [Google Scholar]
- Netuveli, G.; Watts, P. Pro-Environmental Behaviours and Attitudes Are Associated with Health, Wellbeing and Life Satisfaction in Multiple Occupancy Households in the UK Household Longitudinal Study. Popul. Environ. 2020, 41, 347–371. [Google Scholar] [CrossRef]
- Li, S.; Xia, Y.; Xiao, R.; Jiang, H. Residents’ Behavioral Intention of Environmental Governance and Its Influencing Factors: Based on a Multidimensional Willingness Measure Perspective. Int. J. Environ. Res. Public Health 2022, 19, 14734. [Google Scholar] [CrossRef]
- Jia, F.; Li, Y.; Zhang, B.; Li, J.; Li, Y.; Zhang, Y. Parental Participation in the Environment: Scale Validation Across Parental Role, Income, and Region. Front. Psychol. 2022, 13, 788306. [Google Scholar] [CrossRef]
- Katz-Gerro, T.; Greenspan, I.; Handy, F.; Lee, H.Y.; Frey, J.L. Environmental Behavior in Three Countries: The Role of Intergenerational Transmission and Domains of Socialization. J. Environ. Psychol. 2019, 71, 101343. [Google Scholar] [CrossRef]
- Cope, M.R.; Slack, T.; Blanchard, T.C.; Lee, M.R. Social Sustainability? Exploring the Relationship between Community Experience and Perceptions of the Environment. Sustainability 2022, 14, 1935. [Google Scholar] [CrossRef]
- Putnam, R.D. Bowling Alone: The Collapse and Revival of American Community; Simon & Schuster: New York, NY, USA, 2000. [Google Scholar]
- Rogers, E.M. Diffusion of Innovations, 5th ed.; Free Press: New York, NY, USA, 2003. [Google Scholar]
- Weenig, M.W.H.; Midden, C.J.H. Communication Network Influences on Information Diffusion and Persuasion. J. Pers. Soc. Psychol. 1991, 61, 734–742. [Google Scholar] [CrossRef]
- Scannell, L.; Gifford, R. Defining Place Attachment: A Tripartite Organizing Framework. J. Environ. Psychol. 2010, 30, 1–10. [Google Scholar] [CrossRef]
- Ostrom, E. Governing the Commons: The Evolution of Institutions for Collective Action; Cambridge University Press: Cambridge, UK, 1990. [Google Scholar]
- Feng, Z.; Zhang, L.; Zhang, Y.; Zhang, Y. Towards a Communication Ecology in the Life of Rural Senior Citizens: How Rural Public Spaces Influence Community Engagement. Sustainability 2024, 16, 4256. [Google Scholar] [CrossRef]
- Wang, J.; Li, Z.; Zhang, H.; Liu, Y. The Health Perception of Urban Green Spaces and Its Emotional Impact on Young Adults: An Empirical Study from Three Cities in China. Front. Public Health 2023, 11, 1232216. [Google Scholar] [CrossRef] [PubMed]
- Yin, H.; Zhang, X.; Li, Q.; Wang, Y. How Do Environmental Concerns and Governance Performance Affect Public Environmental Participation: A Case Study of Waste Sorting in Urban China. Int. J. Environ. Res. Public Health 2021, 18, 9947. [Google Scholar] [CrossRef]
- North, D.C. Institutions, Institutional Change and Economic Performance; Cambridge University Press: Cambridge, UK, 1990. [Google Scholar]
- Wang, Y.-P.; Li, W.; Li, X.; Wang, X.; Zhang, Y. The Impact of Municipal Solid Waste Sorting Policy on Air Pollution: Evidence from Shanghai, China. PLoS ONE 2022, 17, e0277035. [Google Scholar] [CrossRef]
- Terzi, A.; Krüger, K.; Lehmann, R.; Matthes, J. Crafting an Effective Narrative on the Green Transition. Energy Policy 2020, 147, 111883. [Google Scholar] [CrossRef]
- Crapa, G.; Latino, M.E.; Roma, P. The Performance of Green Communication across Social Media: Evidence from Large-Scale Retail Industry in Italy. Corp. Soc. Responsib. Environ. Manag. 2024, 31, 493–513. [Google Scholar] [CrossRef]
- Wang, Z.; Liu, Q.; Hou, B. How Does Government Information Service Quality Influence Public Environmental Awareness? Int. J. Environ. Res. Public Health 2023, 20, 177. [Google Scholar] [CrossRef]
- Wang, Z.; Wang, X.; Wang, Z.; Mai, S. The Impact of Green Low-Carbon Development on Public Health: A Quasi-Natural Experimental Study of Low-Carbon Pilot Cities in China. Front. Public Health 2024, 12, 1470592. [Google Scholar] [CrossRef]
- Fan, S.; Zhang, X.; Li, J.; Zhang, L.; Li, Y.; Liu, H. Study on Strategic Interaction between Government and Farmers in Rural Passive Energy Transformation. Int. J. Environ. Res. Public Health 2022, 19, 14862. [Google Scholar] [CrossRef]
- Sun, W.; Liu, L.; Chen, X.; Szolnoki, A.; Vasconcelos, V.V. Combination of Institutional Incentives for Cooperative Governance of Risky Commons. iScience 2021, 24, 102844. [Google Scholar] [CrossRef]
- Azam, M.; Hunjra, A.I.; Bouri, E.; Tan, Y.; Ullah, I. Impact of Institutional Quality on Sustainable Development: Evidence from Developing Countries. J. Environ. Manag. 2021, 298, 113465. [Google Scholar] [CrossRef]
- Villoria, M.; Cerrillo-Martínez, A.; Ponce-Solé, J. Implementation of the Transparency Laws in Catalonia. Prof. Inf. 2023, 32, 1–17. [Google Scholar] [CrossRef]
- O’Donnell, E.C.; Netusil, N.R.; Chan, F.K.S.; Dolman, N.J.; Gosling, S.N. International Perceptions of Urban Blue-Green Infrastructure: A Comparison across Four Cities. Water 2021, 13, 544. [Google Scholar] [CrossRef]
- Stangierska, D.; Kowalczuk, I.; Juszczak-Szelągowska, K.; Widera, K.; Ferenc, W. Urban Environment, Green Urban Areas, and Life Quality of Citizens—The Case of Warsaw. Int. J. Environ. Res. Public Health 2022, 19, 10943. [Google Scholar] [CrossRef]
- Shan, W.; Xiu, C.; Meng, Y. How to Design Greenway on Urban Land Utilization: Linking Place Preference, Perceived Health Benefit, and Environmental Perception. Int. J. Environ. Res. Public Health 2022, 19, 13640. [Google Scholar] [CrossRef]
- Yang, Y.; Zhu, Y.; Wang, X.; Li, Y. The Perception of Environmental Information Disclosure on Rural Residents’ Pro-Environmental Behavior. Int. J. Environ. Res. Public Health 2022, 19, 7851. [Google Scholar] [CrossRef]
- Bag, S.; Wood, L.C.; Xu, L.; Dhamija, P.; Kayikci, Y. Big Data Analytics as an Operational Excellence Approach to Enhance Sustainable Supply Chain Performance. Resour. Conserv. Recycl. 2020, 153, 104559. [Google Scholar] [CrossRef]
- Wu, Y.; Wan, J.; Yu, W. Impact of Environmental Education on Environmental Quality under the Background of Low-Carbon Economy. Front. Public Health 2023, 11, 1128791. [Google Scholar] [CrossRef]
- Newman, P.; Kenworthy, J. Sustainability and Cities: Overcoming Automobile Dependence; Island Press: Washington, DC, USA, 1999. [Google Scholar]
- Zhang, D.; Zhang, R.; Zhang, W. Green Building, Pro-Environmental Behavior and Well-Being: Evidence from Singapore. Cities 2021, 108, 102980. [Google Scholar] [CrossRef]
- He, Z.; Zhang, L.; Li, Y.; Wang, Y.; Wang, Y. Influence of Multi-Dimensional Environmental Knowledge on Residents’ Waste Sorting Intention: Moderating Effect of Environmental Concern. Front. Psychol. 2022, 13, 957683. [Google Scholar] [CrossRef]
- Su, H.; Li, X.; Chen, Y.; Zhang, Y. The Synergistic Effect of Urban Economic, Social and Space Factors on Residential Carbon Emissions: A Case Study on Provincial Capitals in China. Sustainability 2024, 16, 5153. [Google Scholar] [CrossRef]
- Aram, F.; Solgi, E.; Holden, G.; Mollaert, L.; Mohammadi, A. Editorial: Impacts of Urban Green Spaces on Environmental Perceptions and Social Life. Front. Environ. Sci. 2022, 10, 1050597. [Google Scholar] [CrossRef]
- Chen, C.; Li, D.; Qian, J.; Li, Z. The Impact of Green Purchase Intention on Compensatory Consumption: The Regulatory Role of Pro-Environmental Behavior. Sustainability 2024, 16, 8183. [Google Scholar] [CrossRef]
- Thapa, P.; Nagendra, H.; Sen, S. Green in Grey: Ecosystem Services and Disservices Perceptions from Small-Scale Green Infrastructure along a Rural-Urban Gradient in Bengaluru, India. Ecosyst. People 2023, 19, 2223307. [Google Scholar] [CrossRef]
- Belanche, D.; Casaló, L.V.; Rubio, M.Á. Local Place Identity: A Comparison between Residents of Rural and Urban Communities. J. Rural Stud. 2021, 82, 242–252. [Google Scholar] [CrossRef]
- Lin, Y.-Y.; Lin, Y.-P.; Lin, C.-J.; Wang, Y.-C. Green Space Optimization for Rural Vitality: Insights for Planning and Policy. Land Use Policy 2021, 108, 105545. [Google Scholar] [CrossRef]
- Hua, K.; Liu, J.; Zhang, Y.; Zhang, Y.; Zhang, Y. Investigation into the Factors Affecting the Green Consumption Behavior of China Rural Residents in the Context of Dual Carbon. Sustainability 2024, 16, 5797. [Google Scholar] [CrossRef]
- Chen, C.; Li, J.; Huang, J. Spatial–Temporal Patterns of Population Aging in Rural China. Int. J. Environ. Res. Public Health 2022, 19, 15631. [Google Scholar] [CrossRef]
- Wei, Q.; Shenghe, L.; Haoran, J. Applicability of the New Standard of City-Size Classification in China. Geogr. Res. 2016, 35, 56. [Google Scholar] [CrossRef]
- Li, Y.; Guo, L. Research on the Development Strategy of Low Carbon Economy Based on Big Data and Internet of Things. Adv. Soc. Sci. Humanit. Educ. Res. 2023, 7, 857. [Google Scholar] [CrossRef]
- Larmarange, J.; Mossong, J.; Bärnighausen, T.; Newell, M. Participation Dynamics in Population-Based Longitudinal HIV Surveillance in Rural South Africa. PLoS ONE 2015, 10, e0123345. [Google Scholar] [CrossRef]
- Holtom, B.; Baruch, Y.; Aguinis, H.; Ballinger, G.A. Survey Response Rates: Trends and a Validity Assessment Framework. Hum. Relat. 2022, 75, 1560–1584. [Google Scholar] [CrossRef]
- de Barros Ahrens, R.; da Silva Lirani, L.; de Francisco, A.C. Construct Validity and Reliability of the Work Environment Assessment Instrument WE-10. Int. J. Environ. Res. Public Health 2020, 17, 7364. [Google Scholar] [CrossRef]
- Xiong, M.; Li, Y. A Strategic Study on Improving Targeting Accuracy of Marketing Campaigns Using Factor Analysis. Appl. Math. Nonlinear Sci. 2024, 9, 1–20. [Google Scholar] [CrossRef]
- Peugh, J.; Feldon, D.F. “How Well Does Your Structural Equation Model Fit Your Data?”: Is Marcoulides and Yuan’s Equivalence Test the Answer? CBE—Life Sci. Educ. 2020, 19, es5. [Google Scholar] [CrossRef]
- Bollen, K.A. Structural Equations with Latent Variables; Wiley-Interscience: New York, NY, USA, 1989; ISBN 978-0-471-01171-2. [Google Scholar]
- Panahi, S.; Bazrafshani, A.; Mirzaie, A. Development and Validation of a Modified LibQUAL Scale in Health Sciences Libraries: Application of Structural Equation Modeling. J. Med. Libr. Assoc. 2023, 111, 792–801. [Google Scholar] [CrossRef]
- Kline, R.B. Principles and Practice of Structural Equation Modeling; Guilford Press: New York, NY, USA, 1998; ISBN 978-1-57230-135-5. [Google Scholar]
- Janse, R.J.; Hoekstra, T.; Jager, K.J.; Zoccali, C.; Tripepi, G.; Dekker, F.W.; van Diepen, M. Conducting Correlation Analysis: Important Limitations and Pitfalls. Clin. Kidney J. 2021, 14, 2332–2337. [Google Scholar] [CrossRef]
- Csizovszky, A.; Buzási, A. Analysis of Community Resilience in Hungary—An Adaptation of the Basic Resilience Indicators for Communities (BRIC), 2020. Reg. Stat. 2023, 13, 752–778. [Google Scholar] [CrossRef]
- Hair, J.F.; Anderson, R.E.; Babin, B.J.; Black, W.C. Multivariate Data Analysis, 7th ed.; Pearson International: London, UK, 2013; Available online: https://elibrary.pearson.de/book/99.150005/9781292035116 (accessed on 8 April 2025).
- Li, D.; Cheng, G.; Wang, C. The Influence of Moral Identity on Green Consumption. Front. Psychol. 2022, 13, 1020333. [Google Scholar] [CrossRef]
- Wu, S.; Xie, J.; Tian, F.; Chen, Q.; Liu, Y. Dual-Wheel Drive of Government Subsidies and Technical Support: A Study on the Mechanism of Promoting Rural Residents’ Green Production. Sustainability 2024, 16, 5574. [Google Scholar] [CrossRef]
- Xiong, G.; Li, X.; Li, W.; Zhou, J.; Zhang, H. Environmental Inequalities in Ecosystem Services Benefits of Green Infrastructure: A Case Study from China. Forests 2023, 15, 73. [Google Scholar] [CrossRef]
- Yan, Q.-S.; Zhang, Z.-Q.; Er, C.-X.; Wang, W.-Q. The Mechanism of Internal and External Efficacy Influences Residents’ Pro-Environmental Behavior through Environmental Willingness. PLoS ONE 2024, 19, e0298378. [Google Scholar] [CrossRef]
- Thakuriah, P.V.; Sila-Nowicka, K.; Hong, J.; Boididou, C.; Osborne, M.; Lido, C.; McHugh, A. Integrated Multimedia City Data (iMCD): A Composite Survey and Sensing Approach to Understanding Urban Living and Mobility. Comput. Environ. Urban Syst. 2020, 80, 101427. [Google Scholar] [CrossRef]
Disclaimer/Publisher’s Note: The statements, opinions and data contained in all publications are solely those of the individual author(s) and contributor(s) and not of MDPI and/or the editor(s). MDPI and/or the editor(s) disclaim responsibility for any injury to people or property resulting from any ideas, methods, instructions or products referred to in the content. |
© 2025 by the authors. Licensee MDPI, Basel, Switzerland. This article is an open access article distributed under the terms and conditions of the Creative Commons Attribution (CC BY) license (https://creativecommons.org/licenses/by/4.0/).