1. Introduction
Air quality deterioration is a significant environmental issue for urban areas in developing countries. The primary cause of this problem is rapid urbanisation, which has led to increased construction, higher traffic volumes, greater energy consumption, and industrial expansion [
1]. Consequently, harmful gaseous pollutants such as nitrogen oxide (NO), nitrogen dioxide (NO
2), sulfur dioxide (SO
2), ozone (O
3), carbon dioxide (CO
2), carbon monoxide (CO), and volatile organic compounds (VOCs) are released into the atmosphere, posing serious health risks [
2]. Additionally, fine particulate matter, specifically PM10 [
3] and PM2.5 [
4,
5], is particularly dangerous as it can harm the respiratory system. Atmospheric pollution also contributes to the increased allergenic activity of pollen, which often reaches critical levels in urban areas [
6]. These pollutants are not confined to the outdoor environment; they can infiltrate the indoor air of buildings through ventilation or diffusion, leading to serious health consequences for residents and further diminishing their quality of life [
7].
Modern air purification technologies are based on physicochemical methods and include a variety of approaches, such as filtration, adsorption, photocatalysis, combustion, ozonation and ionisation [
2]. Filtration is one of the most common methods of air purification, but its effectiveness decreases significantly over time, especially in conditions of high pollution. As fine particles accumulate in filters, their cleaning efficiency decreases, requiring regular filter replacement and reducing their durability while increasing costs [
8]. Adsorption methods, such as the use of gel materials and molecular sieves, are effective in removing 70–80% of contaminants. However, to maintain a stable cleaning efficiency, these methods require periodic replacement of adsorbents, which leads to increased operating costs [
9]. Electrostatic precipitation is another popular air purification method that effectively removes particles from the air. However, this method has a significant drawback—it generates charged particles that can pose a health hazard and require additional measures to neutralise the harmful effects [
10]. Electrostatic precipitators do not clean the air from gas pollution but can cause certain reactions in the corona discharge.
In recent years, phytoremediation of air has become a recognised sustainable and cost-effective method of improving air quality. Plants, from the simplest marine organisms to complex forest ecosystems, are constantly involved in two interconnected processes: photosynthesis, which involves the absorption of CO
2 and the release of oxygen (O
2), and respiration, which involves the reverse process of absorbing O
2 and releasing CO
2. In addition to these basic functions, studies show that the use of green spaces in buildings has several other benefits: regulating the temperature inside the building, maintaining optimal indoor humidity, absorbing moisture through osmosis, purifying the air, reducing noise and vibration, and creating an aesthetic environment for work and living, which has a positive effect on people’s emotional state and reduces social stress [
11]. Appropriately designed and managed green infrastructure, such as trees, hedges, and green walls and roofs, can effectively serve as a passive system to reduce air pollution and contribute to environmental sustainability by improving environmental conditions in urban areas [
12].
The approach to selecting plants for phytoremediation involves assessing their ability to effectively absorb pollutants and adapt to specific environmental conditions, which helps to optimise the clean-up process [
13]. Each plant species uses specific biochemical mechanisms that ensure their effectiveness in reducing pollution. Understanding these mechanisms is key to the correct selection of plant species that are most suitable for specific phytoremediation tasks. Plants reduce the mobility, toxicity, and concentration of pollutants through a variety of mechanisms, such as accumulation, volatilisation, and biological degradation. These processes require energy derived from light, which makes phytoremediation a more cost-effective method compared to engineered cleanup technologies [
14].
Particulate matter can settle on the surface of plant crowns, be absorbed through their stomata, or dissolve in the waxy coating of the leaves of trees, shrubs, and herbaceous plants [
15]. Researchers from different countries have developed wind tunnels [
16] and models [
17] at different scales to study the removal of particulate matter of different fractions by plants. Most of the studies were conducted in open space and yielded several important results that can serve as a basis for the practice of urban greening. It was found [
18] that the concentration of PM under the canopy of trees is usually lower compared to open urban areas, which indicates the ability of urban vegetation to reduce the level of particulate matter in the environment.
Despite these results, there is currently a lack of studies evaluating the effectiveness of potted plants in reducing indoor particulate matter concentrations. One such study is [
19], which conducted a series of experiments to assess the ability of different types of potted plants to reduce the level of fine particulate matter PM2.5. The analysis of the impact of plants was carried out by taking into account three parameters: species, morphological characteristics of leaves, and relative humidity. The researchers selected six species of indoor plants:
Chlorophytum comosum,
Spathiphyllum floribundum,
Epipremnum aureum,
Ficus elastica,
Sansevieria, and
Aloe vera. To ensure comparability of results, the plants were of the same age and height (25–35 cm). The source of contamination was tobacco smoke, and the testing was carried out in sealed chambers with a volume of 60 dm
3. It was found that the presence of plants in the room intensifies the process of PM2.5 deposition. The additional efficiency of their removal (excluding the natural deposition of particles) was 5.2% for
Aloe vera and 30% for
Epipremnum aureum at an initial PM2.5 concentration of about 200 µg/m
3. At the same time, work [
19] does not provide a detailed quantitative analysis of the impact of each of the factors considered, which is necessary for a comprehensive determination of the role of individual plant species in the process of air purification from PM2.5.
Gaseous pollutants, such as NO
x, CO
2, CO, and VOCs, can be absorbed through leaf stomata in the process of gas exchange, the efficiency of which depends on the physiological state of plants, as well as on the chemical and physical properties of pollutants [
20]. Plants absorb VOCs through stomata and cuticle wax during photosynthesis, after which these compounds are converted to amino acids through the Calvin cycle [
21]. Pollutants that penetrate the intercellular spaces of plants can accumulate or interact with the inner surface of leaves and the water film, after which they are decomposed or released into the air [
22].
Most studies on the potential of plants to clean the air from VOCs focus on the use of specific types of indoor plants. According to the results of a study [
23], it was found that plants of the species
Chlorophytum comosum and
Spathiphyllum wallisii are able to effectively reduce the concentration of formaldehyde in the air to below 0.1 ppm. The combination of these two plant species proved to be more effective than using only one species. On average, the reduction in formaldehyde levels within 24 h with one pot of
Chlorophytum comosum is 0.0071 mg/m
3, while with one pot of
Spathiphyllum wallisii it is 0.0058 mg/m
3.
Sana et al. [
24] evaluated the potential of phytoremediation of four plant species:
Chlorophytum comosum,
Rhapis excelsa,
Spathiphyllum wallisii, and
Ficus benjamina. The experimental setup included a sealed chamber for placing potted plants connected to a car exhaust pipe to simulate air pollution.
C. comosum demonstrated the highest efficiency in VOC removal (90%). The highest level of efficiency in the removal of nitrogen oxides (NO
x) was observed in
F. benjamina (77%).
C. comosum had the highest efficiency in reducing CO and NO
x concentrations (80% and 89%, respectively).
R. excelsa showed the best results in reducing ammonia concentrations (77%).
Given these results of phytoremediation, an important component is the accurate measurement of gas exchange processes in plants, which allows us to assess their ability to clean the air. For a long time, methods of studying the gas exchange properties of plants have been widely used mainly to determine the fluxes of CO
2, O
2, and H
2O in the photosynthetic structures of plants, in particular in leaf tissue. Such measurements allow us to evaluate the functional characteristics of the leaf surface and compare their biochemical performance in photosynthesis. Studies of gas exchange at the level of the leaf surface reveal the molecular mechanisms that determine carbon and water fluxes and provide data for assessing the functioning of plant systems in real conditions [
25].
Several methods allow the study of gas exchange processes in plants both at the level of individual leaves and at the level of the entire crown. Recently, new high-precision technologies for assessing photosynthetic activity have been actively developed, allowing for more detailed information on the efficiency of photosynthesis and gas exchange in plants [
26]. Measurements of gas exchange processes can be carried out at different levels of spatial scales, ranging from large ecosystems to limited areas such as individual plants or plant parts, including both areas as small as 1 m
2 and individual leaves or other organs. Various methods have been used to study plant gas exchange processes, including eddy covariance technology [
27] and systems with sealed chambers for gas composition analysis (gas analysers) [
28]. These approaches are based on strict methodological principles and allow the recording of changes in gas concentrations at different spatial scales, ensuring high measurement accuracy.
The eddy covariance method effectively determines CO
2 fluxes at the ecosystem level, allowing us to obtain data on the overall balance of gas exchange without disrupting natural air circulation [
29]. At the same time, this method is not suitable for assessing local differences between plants growing in different conditions or subjected to different types of treatment. In turn, the chamber method is more suitable for determining the rate of photosynthetic CO
2 uptake at the level of individual plots [
28]. However, the use of multi-chamber systems that allow automated measurement of photosynthetic activity during the growing season has certain disadvantages, in particular the impact of the chamber design on the microclimate of experimental plants due to changes in airflow and partial shading.
Depending on the research tasks and the required level of isolation from the external environment, both closed and open-type gas analysers are used, each of which has its characteristics and limitations. Closed-type gas analysers provide isolation from the external environment by restricting air access. In such systems, the gas is continuously drawn from the chamber where the CO
2 and water vapour concentrations are analysed. The variation in CO
2 concentration is calculated using linear regression, modified rate, or quadratic regression methods, which allows for the calculation of plant photosynthesis [
30]. At the same time, open-type systems provide continuous analysis of gas exchange by measuring the CO
2 concentration at the inlet and outlet of the chamber, as well as the airflow rate in a controlled environment.
Modern gas exchange systems are characterised by high accuracy, mobility, and ease of use. They allow for field measurements of CO
2 assimilation rates and stomatal conductance in a wide range of ecosystems and different types of vegetation cover [
31].
The analysis of CO
2, O
2, and H
2O fluxes between the leaf surface and air allows us to assess how gas exchange changes under the influence of variable environmental parameters in a controlled gas exchange chamber. In addition, studies of the long-term effects of various environmental conditions demonstrate their role in changing the rate of photosynthetic processes, biochemical potential, and diffusion barriers to photosynthesis [
32]. Gas exchange measurements have also significantly expanded the understanding of the physiological characteristics of plants with different carbon fixation pathways, such as C
3, C
4, and CAM photosynthesis [
33].
Modern gas exchange analysis systems typically operate on the principle of ‘open’ circulation, which implies a constant flow of air through the measurement chamber in which the leaf sample is located. The concentration of the main gas components, in particular CO
2 and H
2O, is determined mainly by infrared gas analysers [
34]. One analyser records the parameters of the gas mixture before it enters the chamber, and the other (the standard) records the parameters after it passes through the chamber with the test leaf. By determining the volumetric airflow and surface area of the leaf in the chamber, the intensity of photosynthetic CO
2 absorption and transpiration rate can be calculated based on the difference in CO
2 and H
2O concentrations between the reference and sample analysers [
34].
The main disadvantage of infrared gas analysers used in gas exchange systems is their limited ability to study only individual leaves, not the whole plant or complex plant structures such as shrubs or multi-level plantations. This creates difficulties in determining the overall impact of plants on the gas composition of the air, since the processes of photosynthesis, transpiration, and adsorption of pollutants depend on the plant architecture, its physiological state, and interaction with the environment.
Another significant limitation is that such gas analysers mainly measure CO2 and H2O concentrations, sometimes O2, but do not allow simultaneous study of the dynamics of other important atmospheric pollutants such as PM or VOCs. Since plants can not only regulate gas exchange but also adsorb or chemically transform VOCs and retain PM on their surfaces, a comprehensive approach to analysing their ecological function requires additional equipment and techniques that combine gas analysis with the study of other types of pollution.
Assessing the gas exchange characteristics of plants is challenging for several reasons. Firstly, the intensity of gas exchange largely depends on factors such as illumination, temperature, humidity, and gas concentration in the environment [
35]. Therefore, it is important to carefully control these parameters during measurements to ensure the accuracy of the results. Secondly, gas analysers record an integrated gas exchange, which makes it difficult to separate the contribution of photosynthesis, respiration, and transpiration to the overall balance [
36]. Third, daily changes have a significant impact on plant gas exchange processes. Previous studies have shown that the intensity of photosynthetic activity varies throughout the day, which is due, in particular, to the circadian regulation of metabolic processes associated with CO
2 fixation [
37], as well as changes in the degree of stomatal opening, which determines the efficiency of gas transport through the leaf surface [
38]. The use of a gas analyser allows us to record these fluctuations and quantify the daily dynamics of the main parameters of gas exchange, which is important for studying plant adaptation mechanisms in changing environmental conditions.
The scientific literature presents several methodological guides on the analysis of gas exchange characteristics of plants, focusing on the specifics of using certain measurement techniques [
39,
40]. Even though modern gas analysers provide high accuracy in recording gas exchange parameters in plants, the results obtained require detailed analysis for correct interpretation. It is important not only to choose the right measurement methods but also to process the data properly, as this is what determines the reliability of conclusions about the physiological processes taking place in plants.
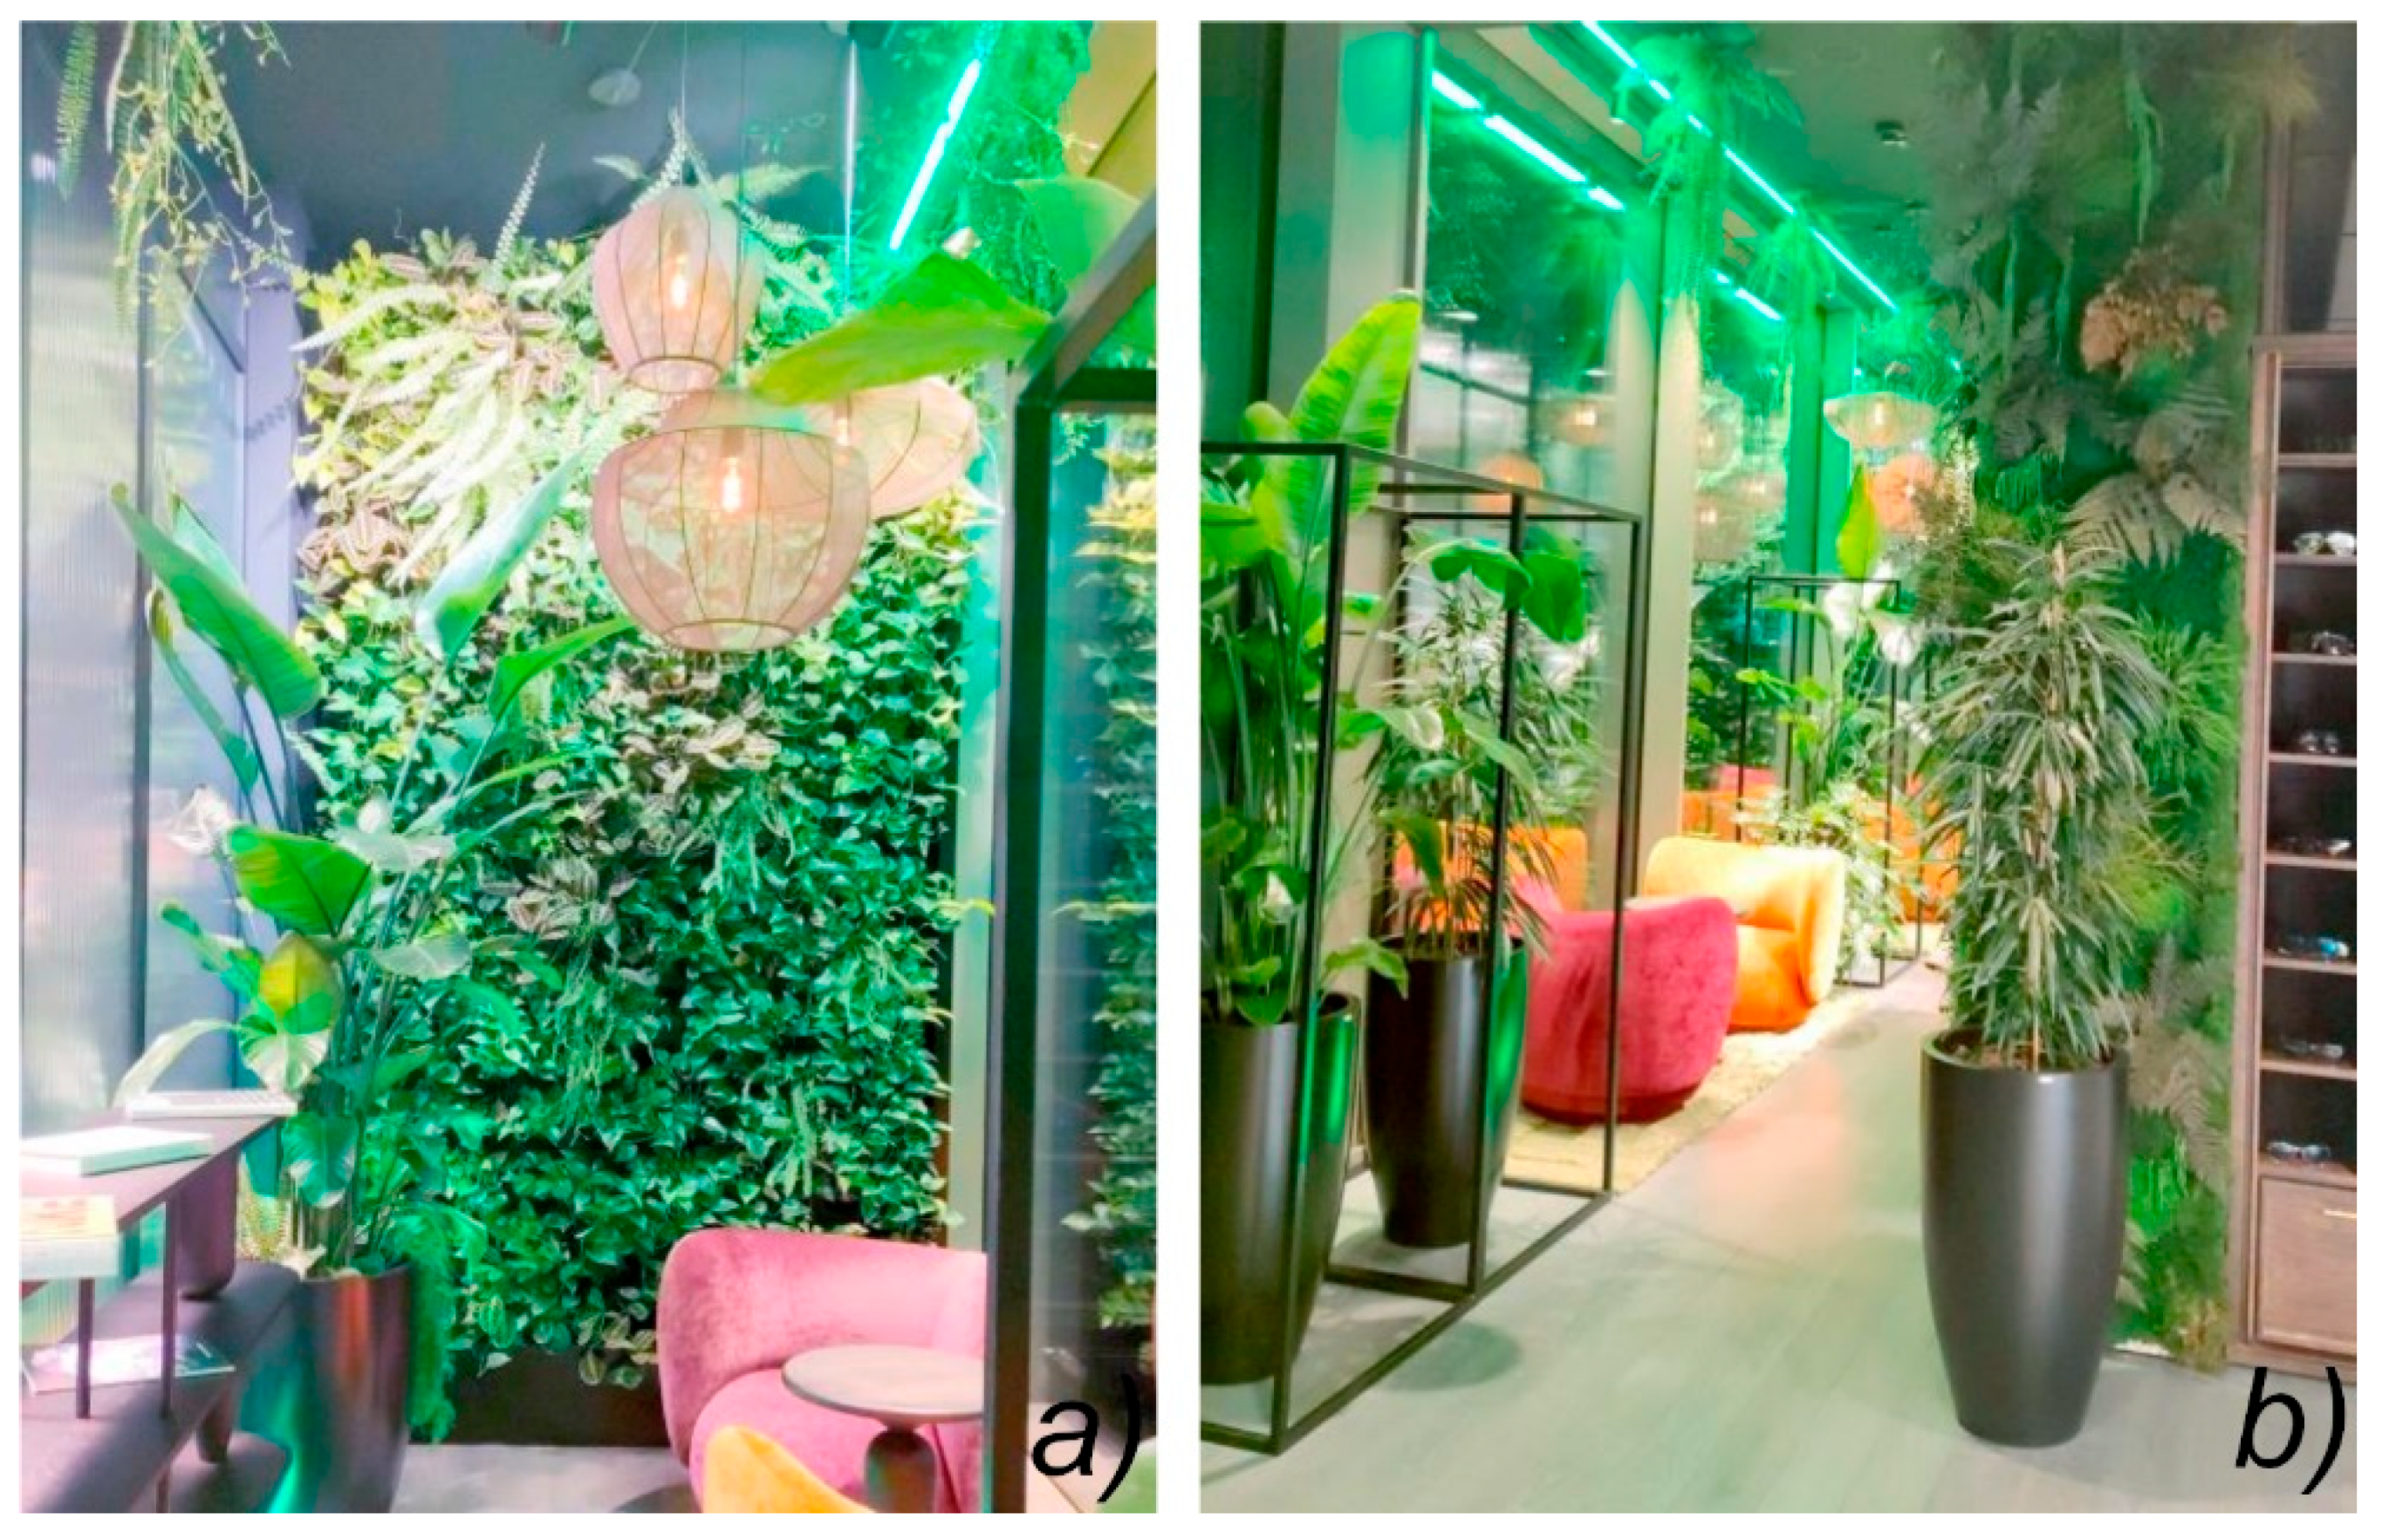
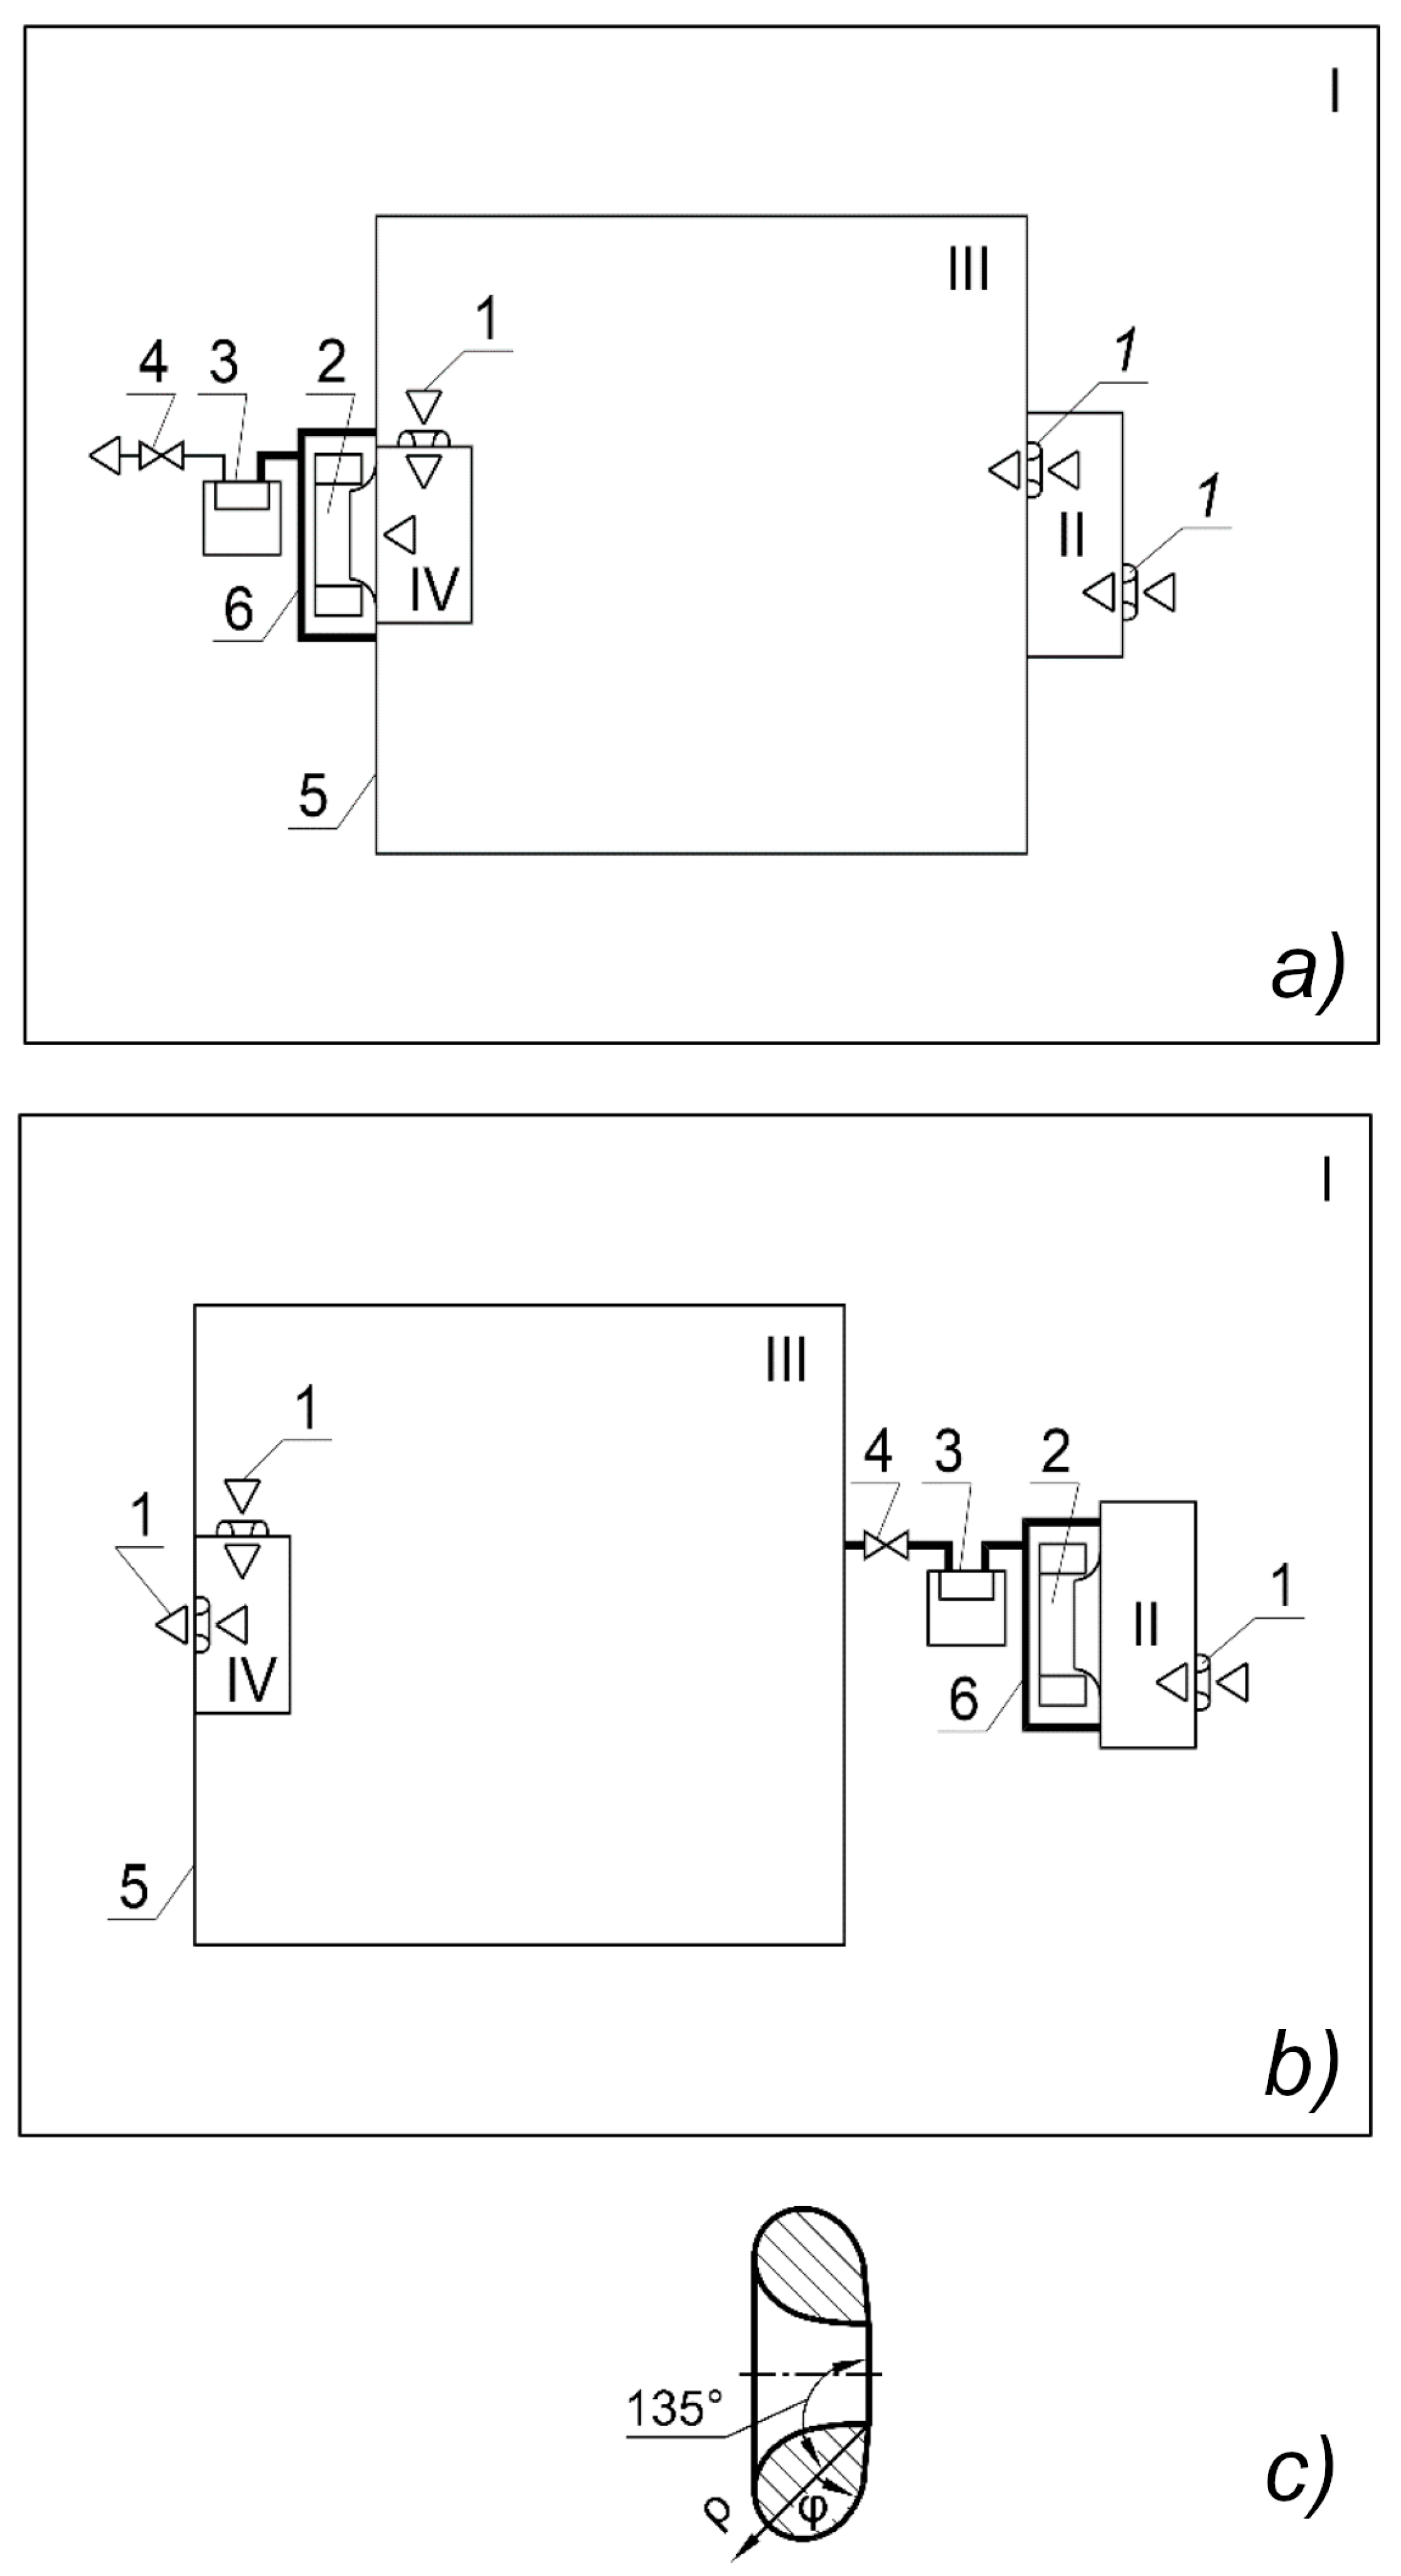
Thus, under natural conditions, the processes of gas exchange in plants are studied in depth and allow us to constantly improve our knowledge of the physiological processes in plants under natural conditions. However, rapid urbanisation is displacing the natural environment from urban areas. A common practice in greening densely built-up cities is the use of green structures, i.e., a combination of living plants and building structures. Internal green structures, such as green walls (
Figure 1a) and intensive internal landscaping (
Figure 1b), are becoming increasingly popular.
The examples shown in
Figure 1 use natural light, such as in the work [
41], and in the dark, green lighting has a minimal biological impact. The vast majority of rooms require artificial plant lighting [
42]. Due to the irritating effect of pink light, energy-efficient phytolamps should not be used in public areas or should be combined with green light [
42]. The authors observed serious problems when, during night lighting with phytolamps, the daytime respiration of plants was superimposed on the breathing of visitors, resulting in harmful concentrations of carbon dioxide.
Another possibility for air improvement is the ventilation phytofilter [
43], for the integration into ventilation systems. For this, the gas exchange properties should be known to calculate the necessary biomass.
The proposed approaches to the study of gas exchange in plants have not been tested in indoor landscaping, especially if the entire aerial part (Chlorophytum comosum) is involved in photosynthesis. Soil bacteria also have a significant impact on gas exchange, which must be taken into account. A significant disadvantage of single-leaf chambers is the need to constantly monitor the carbon dioxide in the vicinity of the leaf. Together with the agitators, this results in a significant internal volume compared to the volume of the leaf. Since gas exchange in a single leaf is not highly intensive, the inertia of the stand itself can significantly affect the results (as the authors encountered during their research).
Thus, there is a problem of adapting the methods of studying gas exchange in plants to the conditions of green structures and interior landscaping.
The aim of this study is to develop a method for laboratory research of gas exchange processes in plants for use in engineering design of green structures and interior landscaping. The tasks are to develop the principles of constructing a test bench, testing it, identifying and eliminating the causes of false results, including inertia, paradoxical stratification of carbon dioxide by height, etc., as well as performing the final series of experimental studies to obtain dependencies for engineering calculations and selecting the range and number of plants.
The scientific novelty lies in the improvement of the method for studying instantaneous gas exchange in plants and the identification of the dependence of gas exchange in the Chlorophytum comosum plant on illumination and carbon dioxide content in the air.
The practical value is to ensure the possibility of certifying plants for phytoremediation green structures and interior landscaping, as well as obtaining dependencies for engineering calculations and the selection of the range and number of plants.
2. Materials and Methods
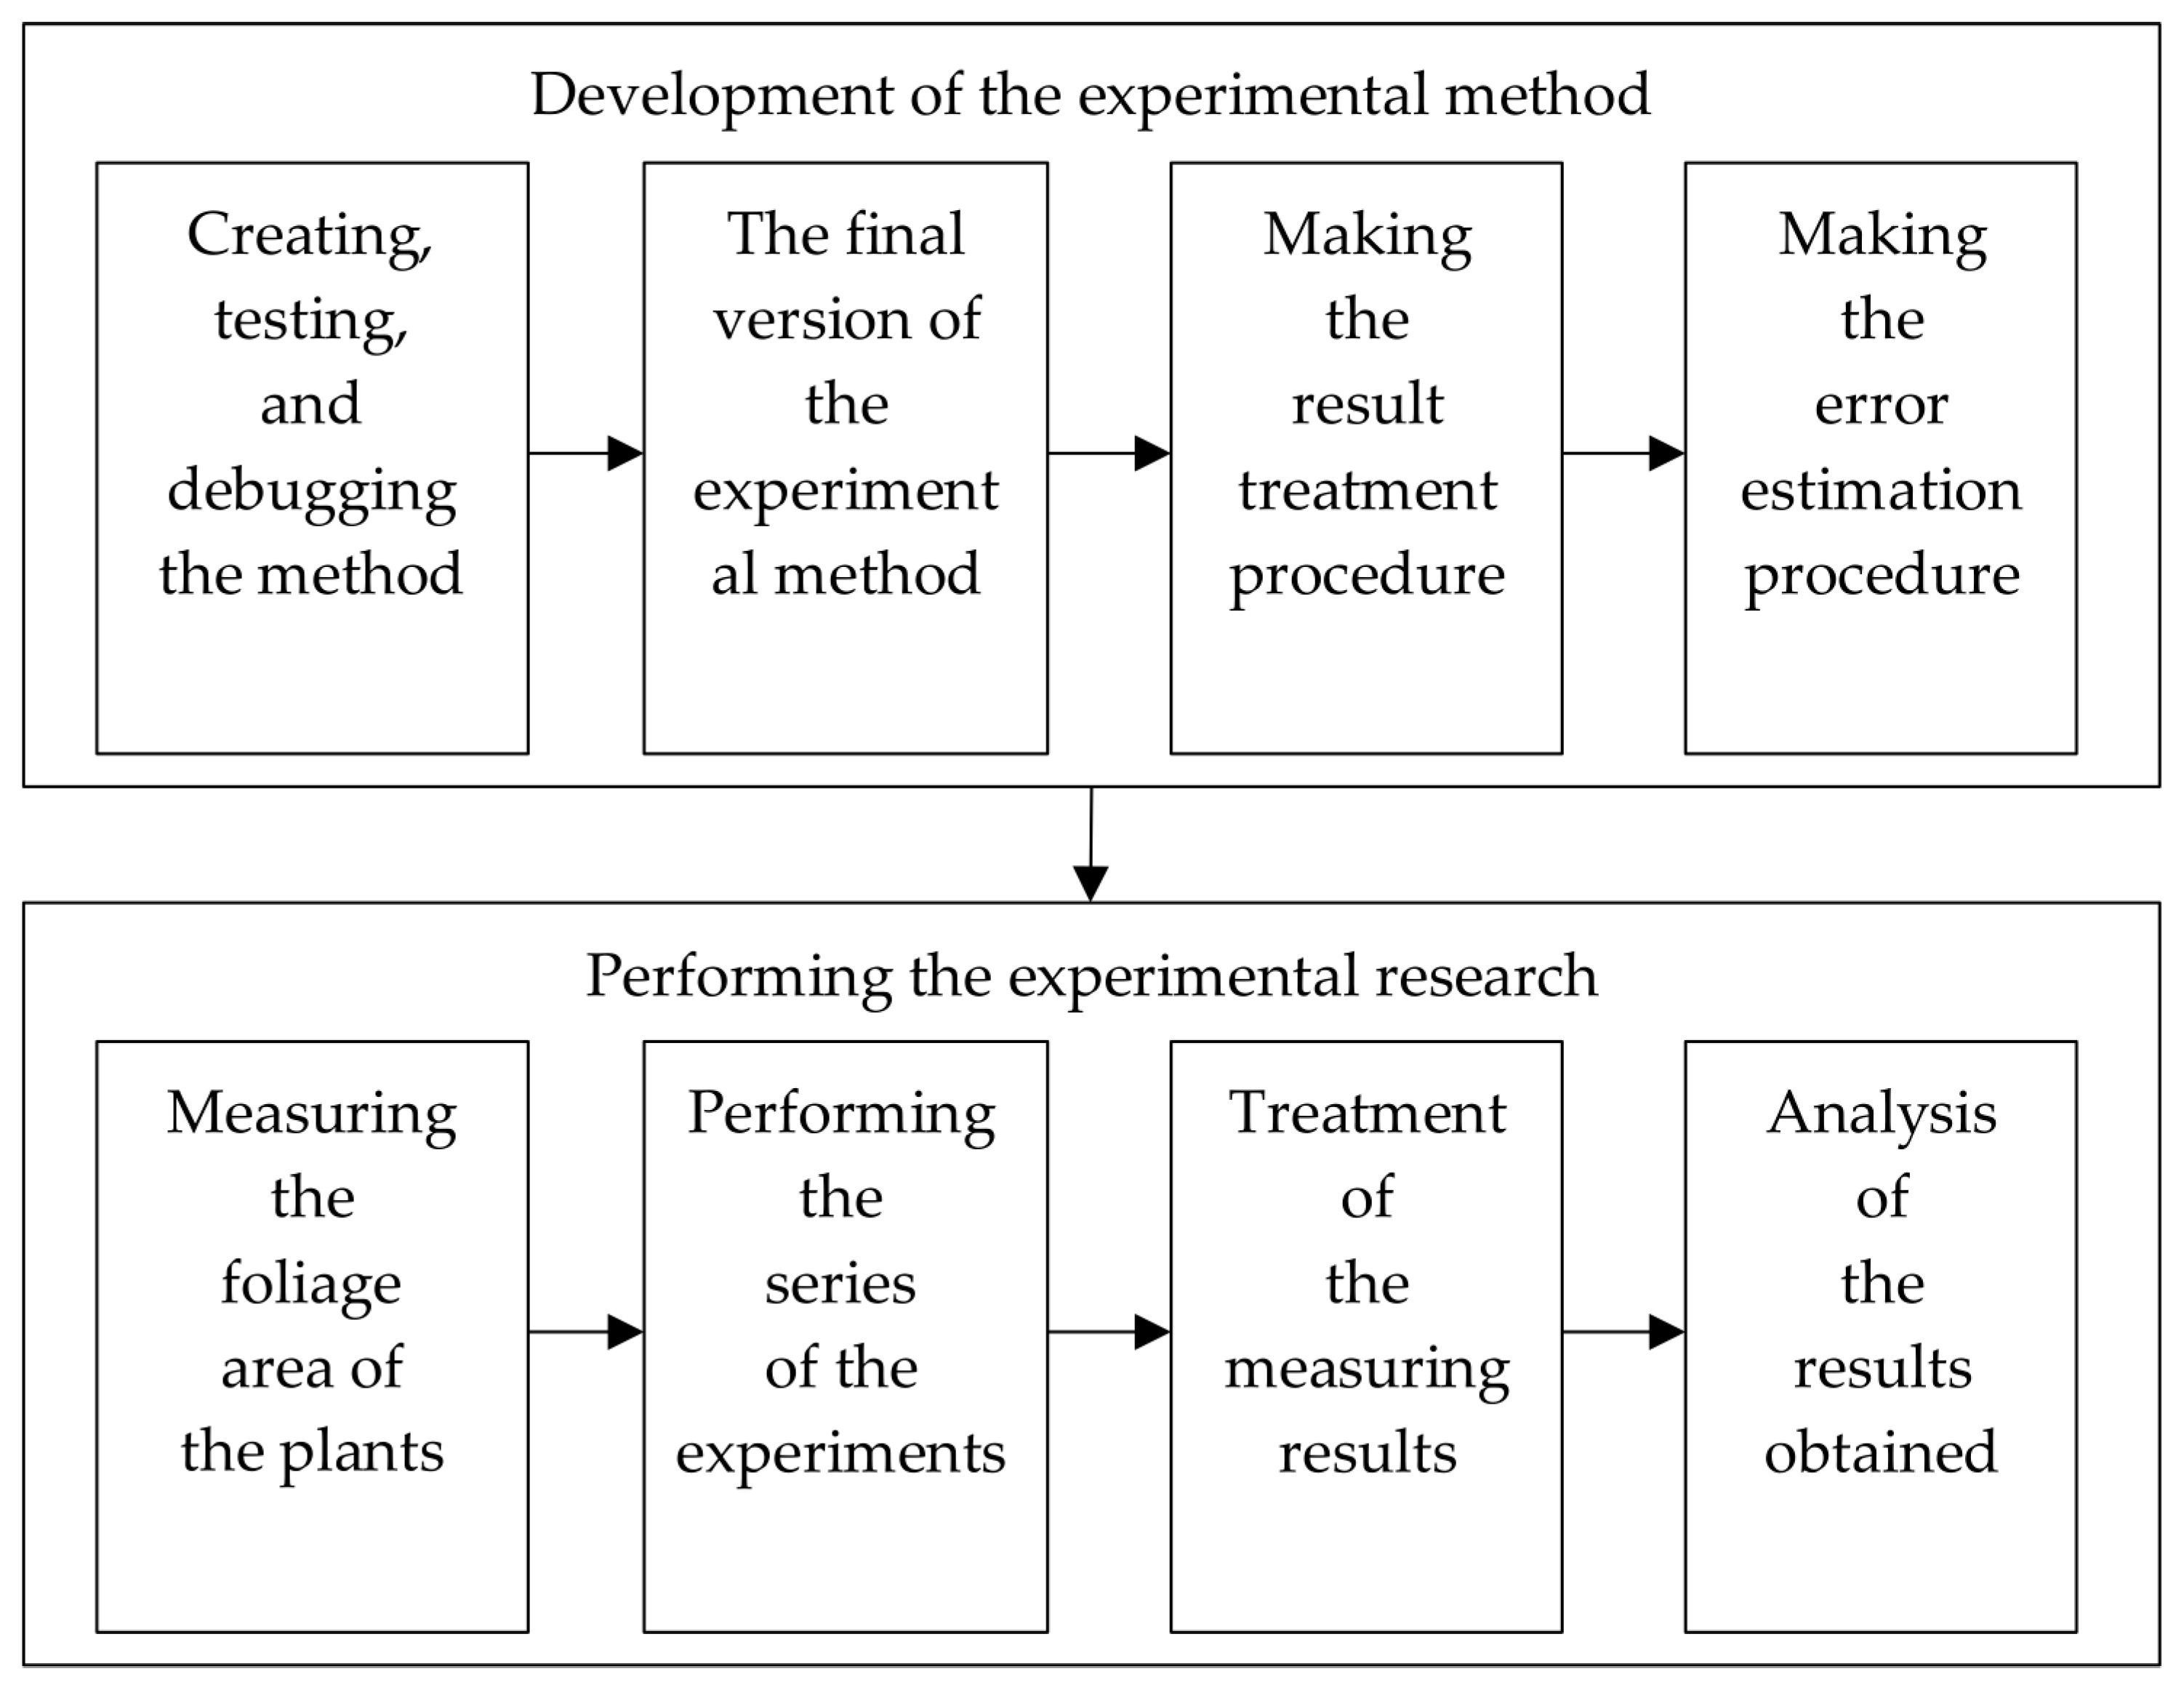
The research design is shown in
Figure 2.
2.1. Improving the Research Method
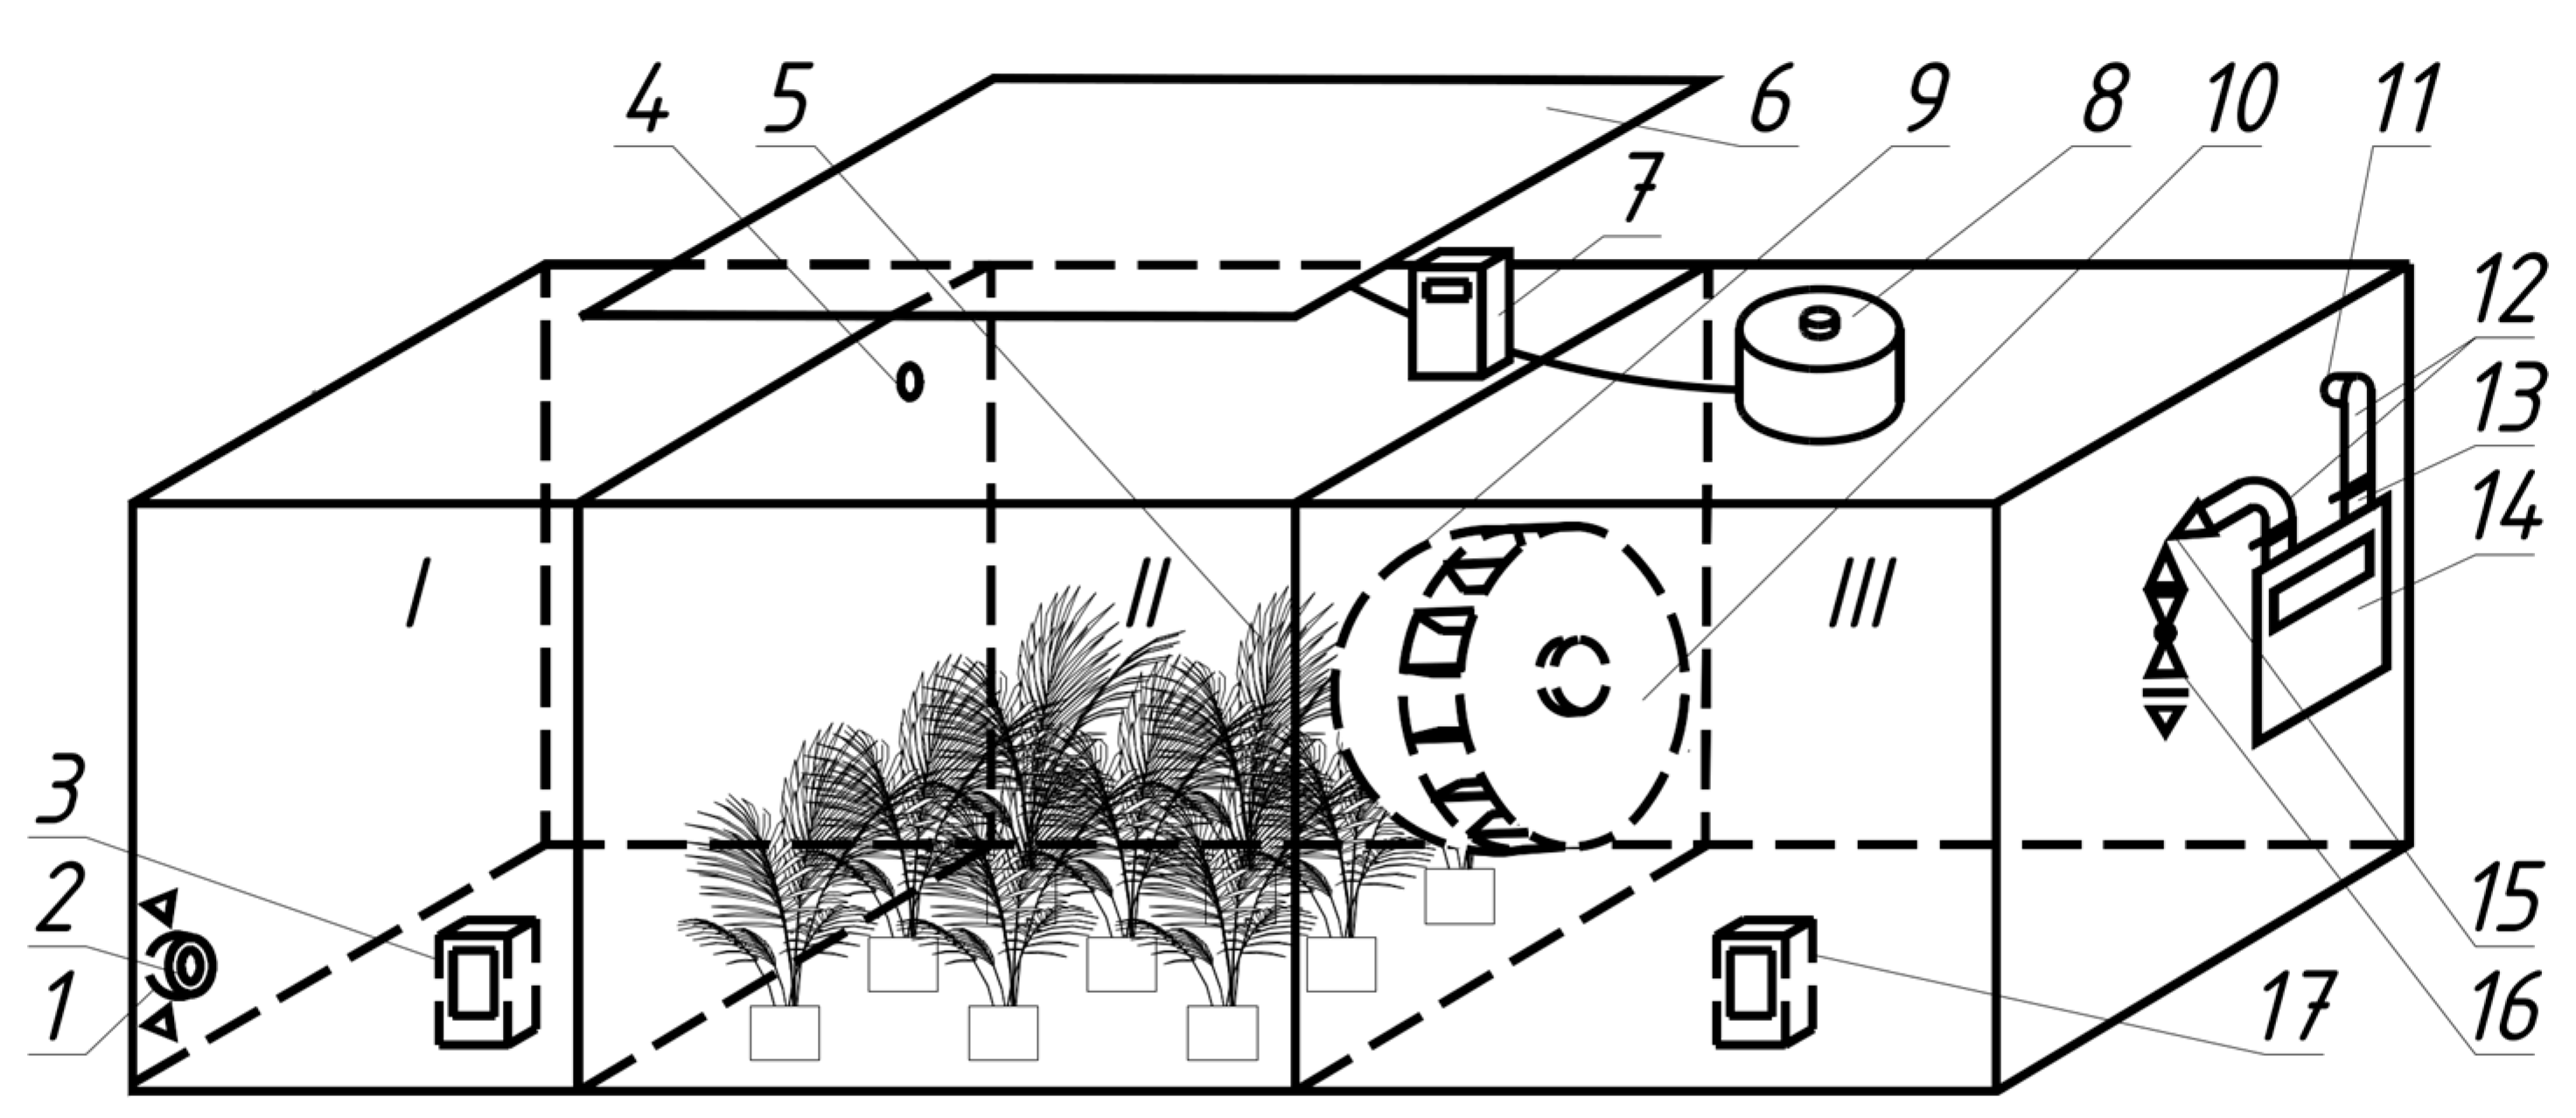
To determine the possibilities of reducing the carbon dioxide content in the premises and to assess the impact of plants on the need for outdoor air, a method and experimental setup (
Figure 3) were developed to study gas exchange in plants. The frame is developed by VentService Factory, Kyiv, Ukraine.
The bench operates as follows: air enters through the protective grid 1 and the inlet 2 into the receiving chamber I with a gas analyser 3. Through the flow hole 4, it passes to the gas exchange chamber II with the plants under study 5. This chamber is illuminated by a lighting panel with LED phytolamps 6 based on ZVision Growing LEDs (Beijing, China), the actual voltage of which is controlled by a voltage relay with a volt and ampermeter 7 (Digitop VA-protector 40 A, Kyiv, Ukraine), and the brightness of which is set by the regulator 8. After gas exchange, the air is forced through the protective grid 9 by the fan-mixer 10 (VentService, Kyiv, Ukraine) to the outlet chamber III. The fan-mixer 10 provides intensive mixing of air in this chamber to avoid the influence of uneven distribution of gases in chamber II. From this chamber, the air exits through an opening 11 to the piping system 12, which contains a filter 13 (Sandi Plus, Ukraine), a gas meter 14 (Oktava G1,6-2, Generator plant, Kyiv, Ukraine), a control 15 (VT.007.LN.04, Valtec, Italy), and a shut-off valve 16 (VT.214 Dn 15, Valtec, Italy). The latter is used to prevent dust from entering when the plant is not in operation and can be closed without changing the position of the control valve 15.
The outlet gas content is controlled by a gas analyser 16 in chamber III. To measure the illumination, we used a Mastech MS6610 luxmeter (Mastech, Taipei City, Taiwan), which was introduced after the experiments and moved slowly to cover the entire area of the chamber at the plant level and to average the illumination.
The flow ports are designed to provide a significant flow rate to avoid back-diffusion of gases. Since the mixing fan 9 performs the mixing function, it is not advisable to adjust its speed.
The regulator 8 must not cause electromagnetic interference that could affect the gas analysers or the luxmeter. Therefore, a laboratory-adjustable autotransformer (AOSN-8-220-82-UKHL4, Uman, Ukraine) is used in this work. A voltage relay with a voltmeter and amperemeter 7 shows the current voltage so that the same illumination can be set later, and also protects the lamps from accidental overvoltage.
The research showed significant shortcomings of this method and the stand. As a result, the bench underwent four significant modernisations.
Firstly, due to power supply problems and disruptions in the operation of power grids as a result of Russian Federation attacks on the power system, additional wear and tear occurred on power supply and power consumption equipment. For this reason, the daily voltage fluctuations in the laboratory after the power supply were increased significantly and began to create unacceptable fluctuations in illumination until the over-voltage protection activation. Therefore, the test bench was equipped with a double-conversion voltage stabiliser consisting of a Dicasver 12 V 166 A (Wuhan, China) power supply and a 12–220 V inverter (made in EU). Thus, it was possible to provide a stable voltage with fluctuations of up to 0.1 V at the input to the laboratory-adjustable autotransformer, which, after the inverter reaches a stable thermal mode, is slightly dependent on the load power. The multimeter (AKTAKOM AVM-4307, Tianjin, China) test showed that voltage fluctuations during the experiment with constant lighting power did not exceed the measurement accuracy of 0.1 V (the devices did not feel it).
Furthermore, a paradoxical increase in the carbon dioxide catching with increasing airflow was found. This indicates a significant inertia of the plant, i.e., it does not have time to reach the mode. It is impossible to extend the time to reach the mode, because plants have a limited photosynthetic resource. Therefore, the system includes the adjustment of the volume of zone II with plants by filling its lower part with 100 mm-thick foam sheets. This way, the minimum volume for plant placement remains free. The size of zone III was also reduced. To do this, the fan was covered with a 60 dm3 vessel, which was not enough. The volume was then further reduced to 5 dm3 by placing a 6 dm3 canister within the volume of zone II at the inlet to the fan.
After this modernisation, the readings began to change rapidly, and stabilisation took up to two hours. However, with a decrease in illumination, there were paradoxical results—experimental points of the CO2 absorption vs. average CO2 content at input and output. For better understanding, a third gas analyser was placed above the plants. At lower illumination, it shows the lower carbon dioxide content Yveg, ppm, than at the inlet and outlet. This indicates stratification of the content inside zone II.
The installation of mixing fans did not improve the situation. Therefore, we checked the stratification of carbon dioxide content in plan and height. In the many points on the plan, separately under and above the plants, the difference in readings was within 1–3 ppm, which is an order of magnitude less than the systematic error. Therefore, there was no need for additional gas analysers. A significant difference was observed under and above the plants. It was concluded that vertical air mixing is necessary, which would eliminate stratification in thermal installations [
42].
The installation of a mixing system of 20 fans (Cooling Baby 4010 3PS, Guangzhou, China) evenly spaced between the plants led to a paradox that is not possible in thermal installations: the start-up of fans increases both the difference between the readings of gas analysers at the inlet and outlet and deepens the vertical stratification. To obtain correct results, this phenomenon must be explained and its impact on the results analysed [
43].
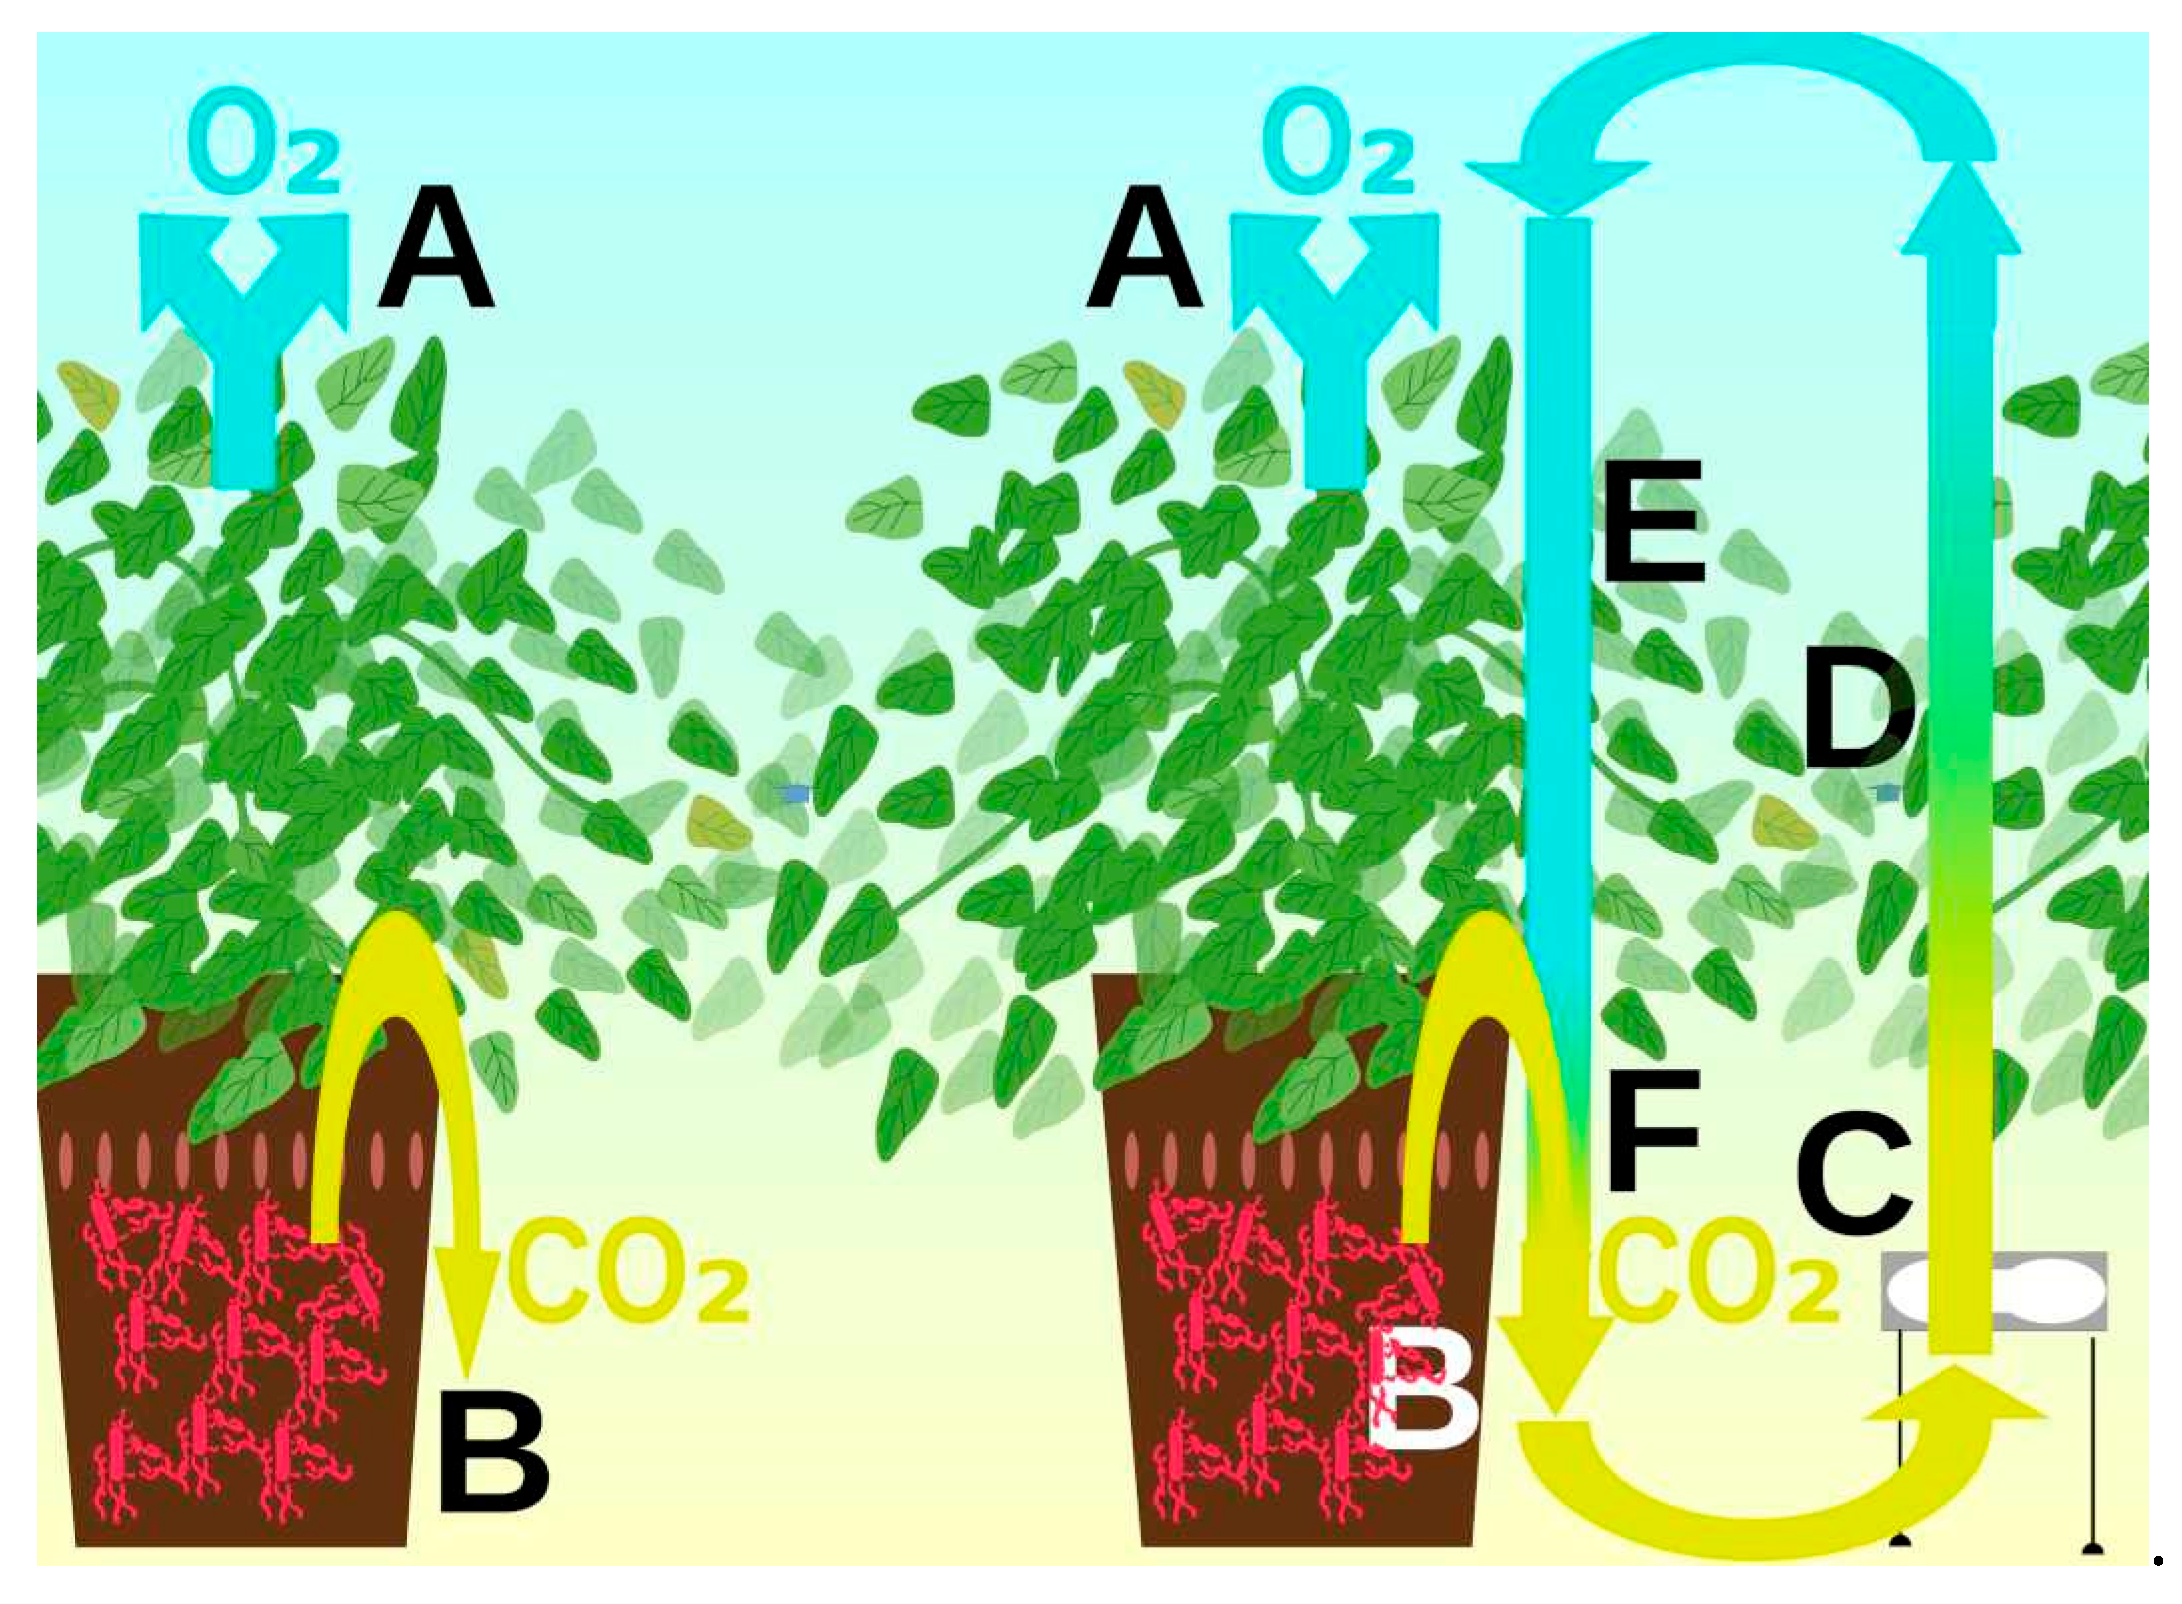
The explanation for this phenomenon (
Figure 4) is as follows. If there are no fans in the chamber with the plants, the oxygen released during photosynthesis is lighter than CO
2 and rises upwards, while the carbon dioxide released by soil bacteria is heavier and sinks downwards. Vertical mixing with fans causes circulation currents. The air polluted with carbon dioxide will rise to the vegetation zone of the plants. This will speed up photosynthesis. Plants will absorb carbon dioxide from it and release oxygen. The oxygenated air will descend through the plant growing zone. But this air is depleted in carbon dioxide and will have little effect on photosynthesis. When the air reaches the soil level, the oxygen from it will diffuse into the soil and be consumed by bacteria, and the air will be polluted with carbon dioxide. A mixture of air ends up at the chamber outlet. Therefore, attempts to adjust the height of the air sampling point do not change the readings of the gas analysers. Thus, mixing will lead to an increase in the photosynthetic effect without additional contamination of the inlet air, which will reduce the requirements for model air [
41].
The main conclusion is the need to install a gas analyser in the vegetation layer. It will show the carbon dioxide content Yveg, ppm, which will determine photosynthesis, and should be plotted on the abscissa axis.
Due to the coarseness of the most accurate modern gas analysers (±40 ppm by mole fraction), the airflow rate in the test bench was quite low. Therefore, the requirements for the tightness of the path from the fan to the air metering unit were as high as possible. It was impossible to fulfil them within the 1 × 1 × 1 m chamber. Therefore, the vessel covering the fan was connected to the meter using a gas hose.
Controlling the airtightness by coating possible air loss points with surfactants proved to be ineffective. Monitoring the tightness of the plant during its operation using this method is practically impossible. Therefore, a new device was invented that allows the monitoring of the tightness during the operation of the installation with the ability to remotely transmit the results and transmit signals to the experimental controller for immediate action [
41].
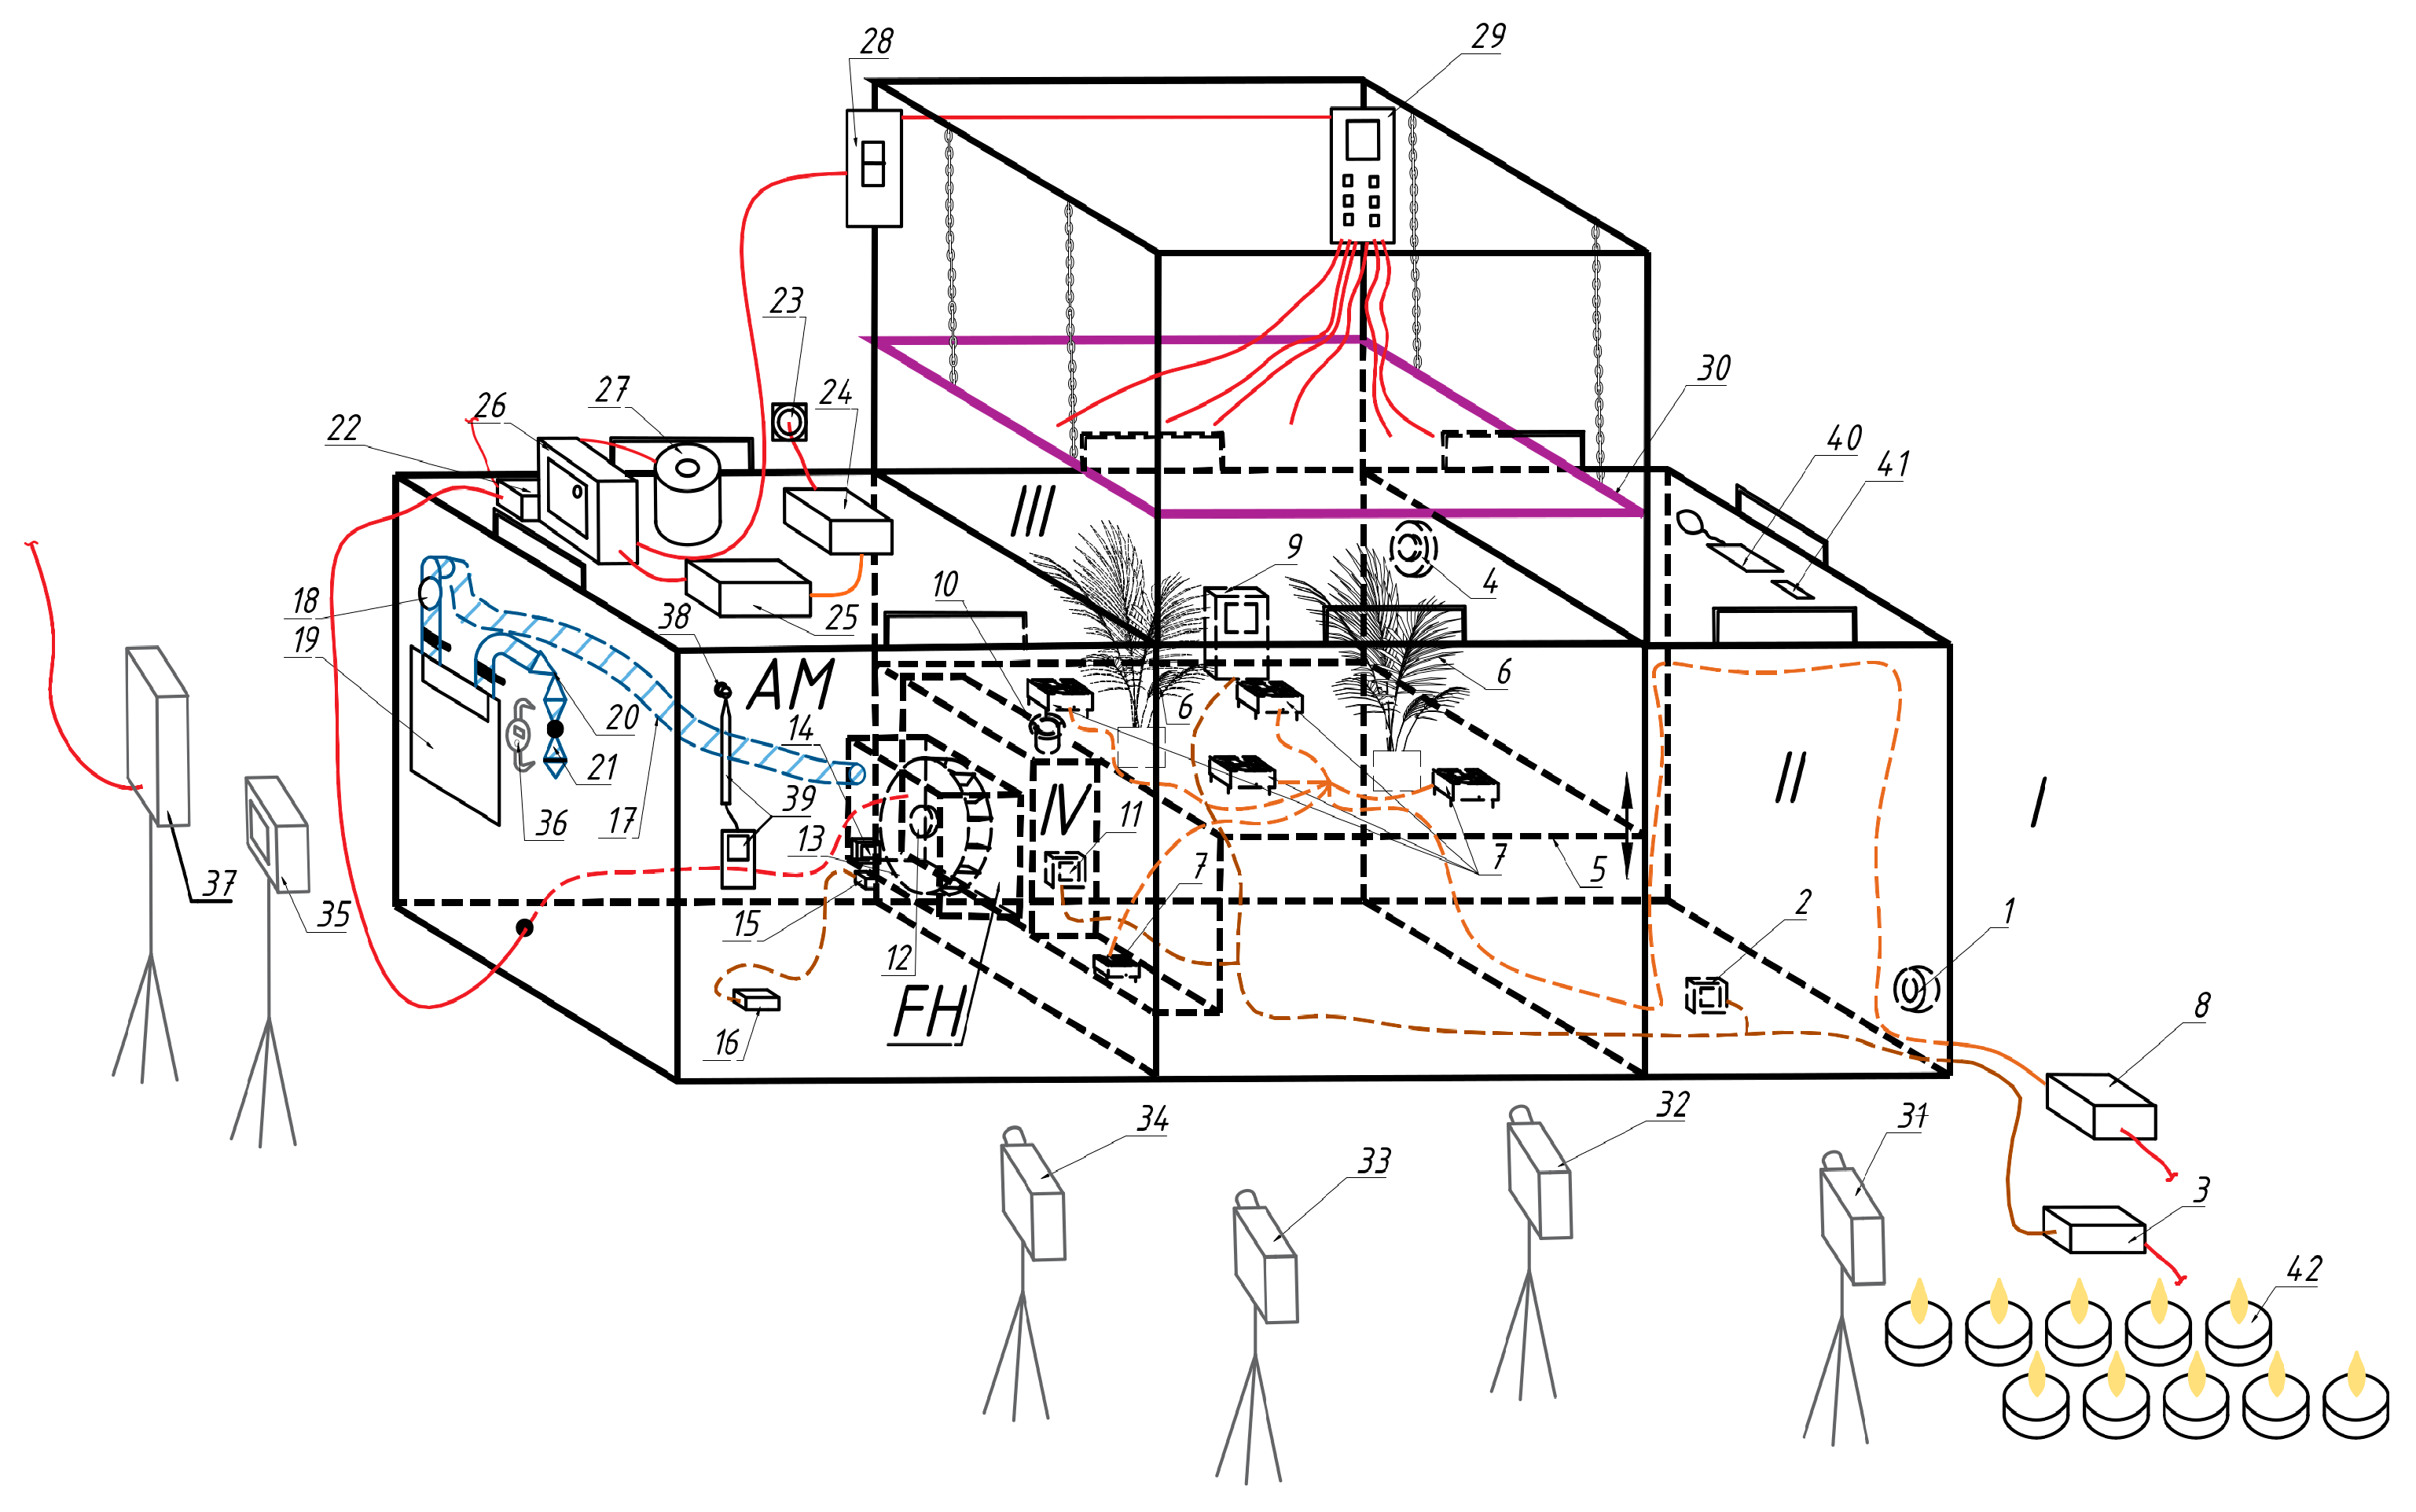
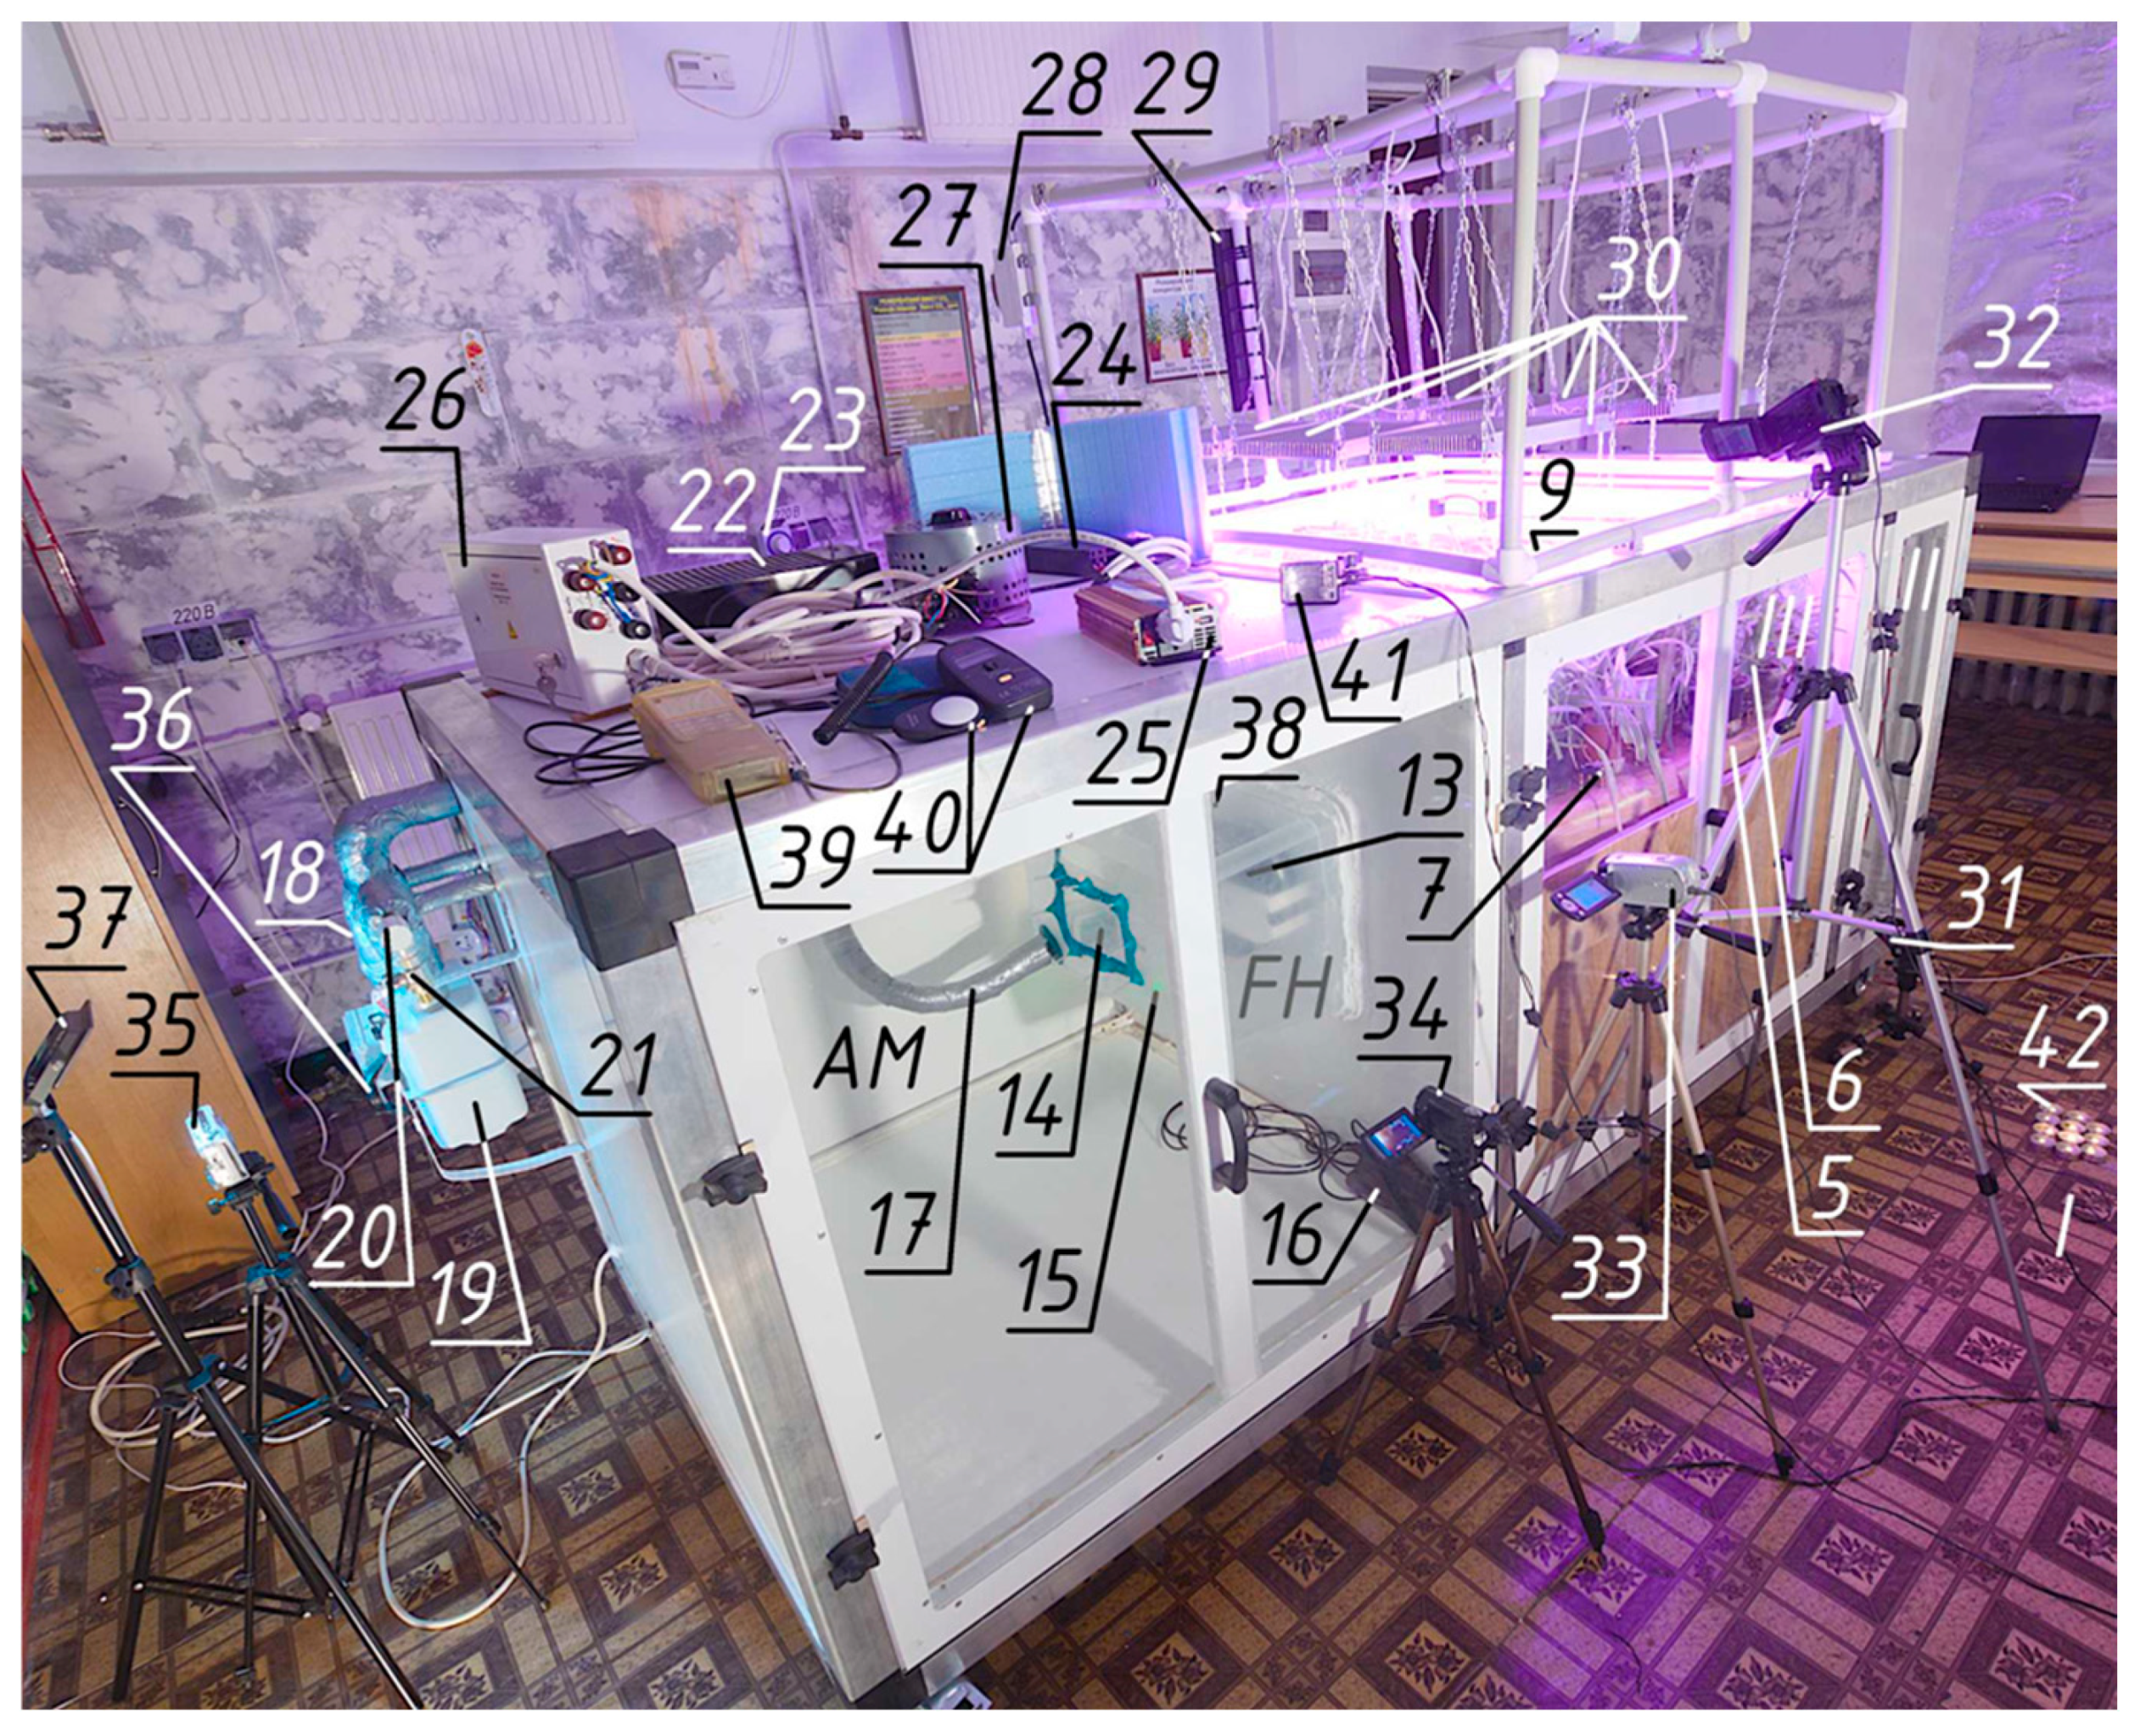
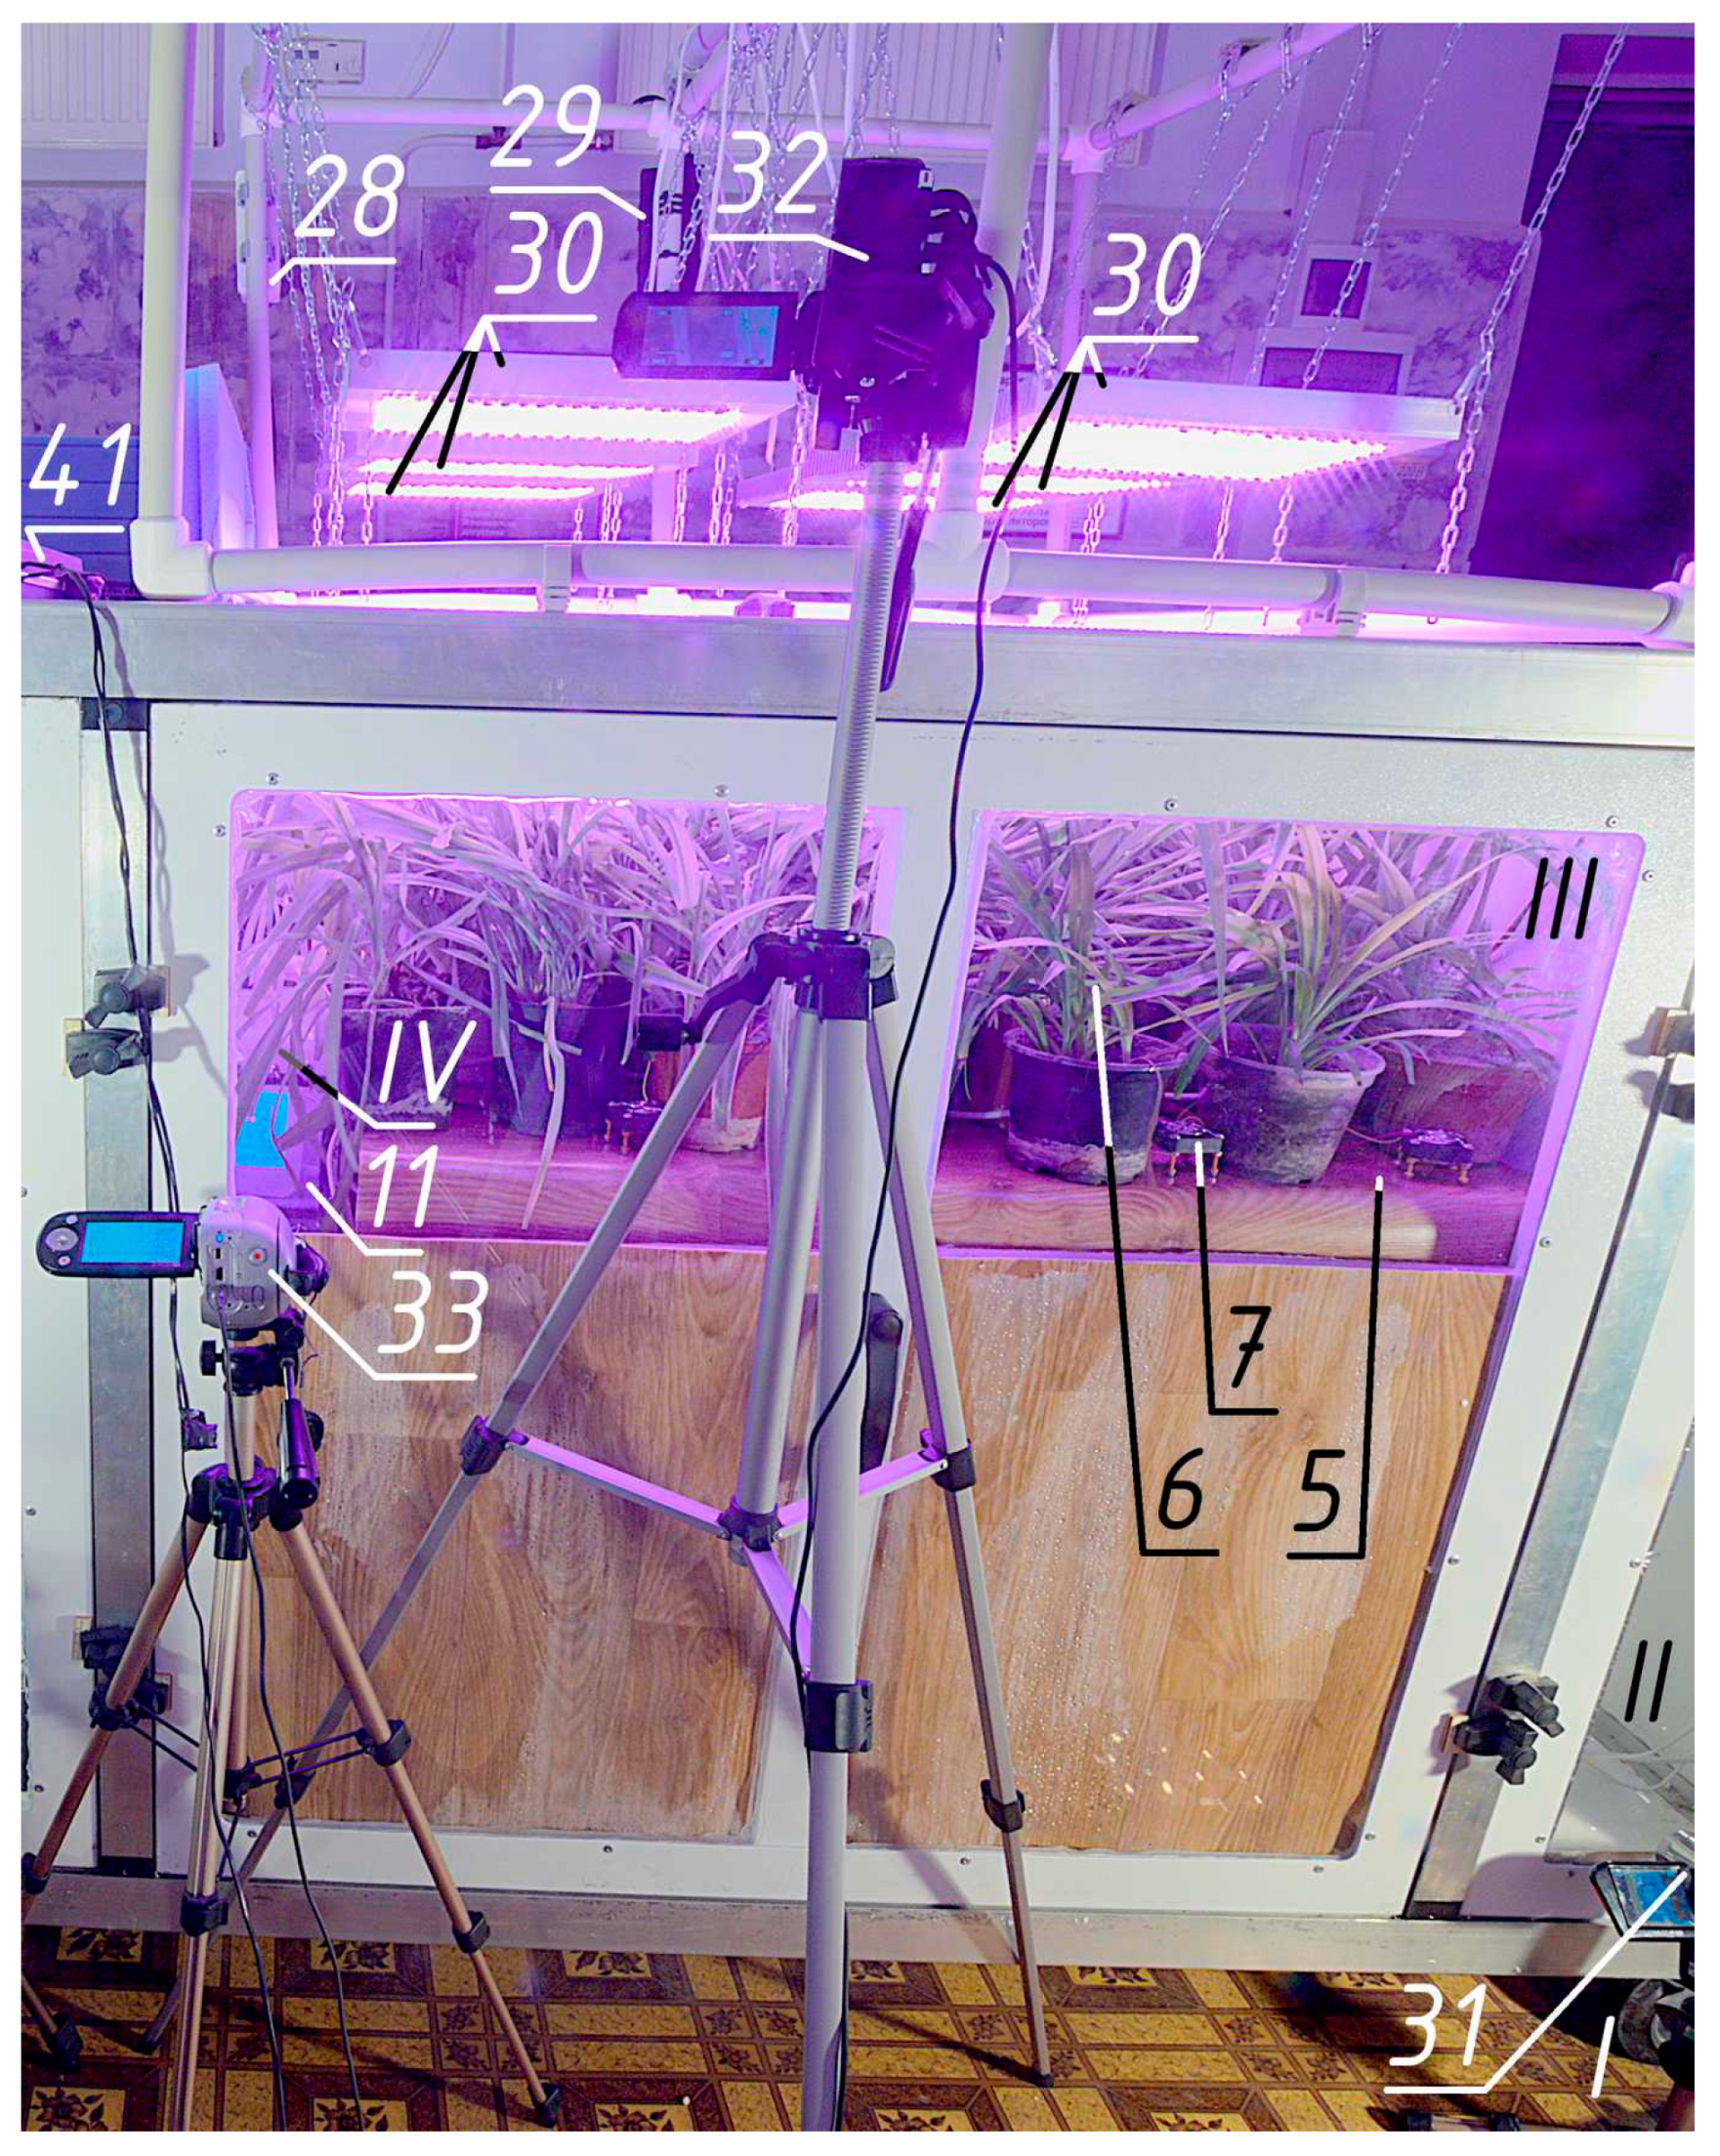
2.2. The Final Version of the Experimental Setup
The final version of the installation (
Figure 5,
Figure 6,
Figure 7 and
Figure 8) has four main zones—parts of the space in which a certain direction of air movement is organised for a specific purpose:
the model air preparation area is a laboratory room 5 × 4 m in plan and 3.2 m in height where up to 100 candles are lit, which, in addition to carbon dioxide, produce a sufficient amount of PM2.5 and PM10 particles, as well as various combustion products;
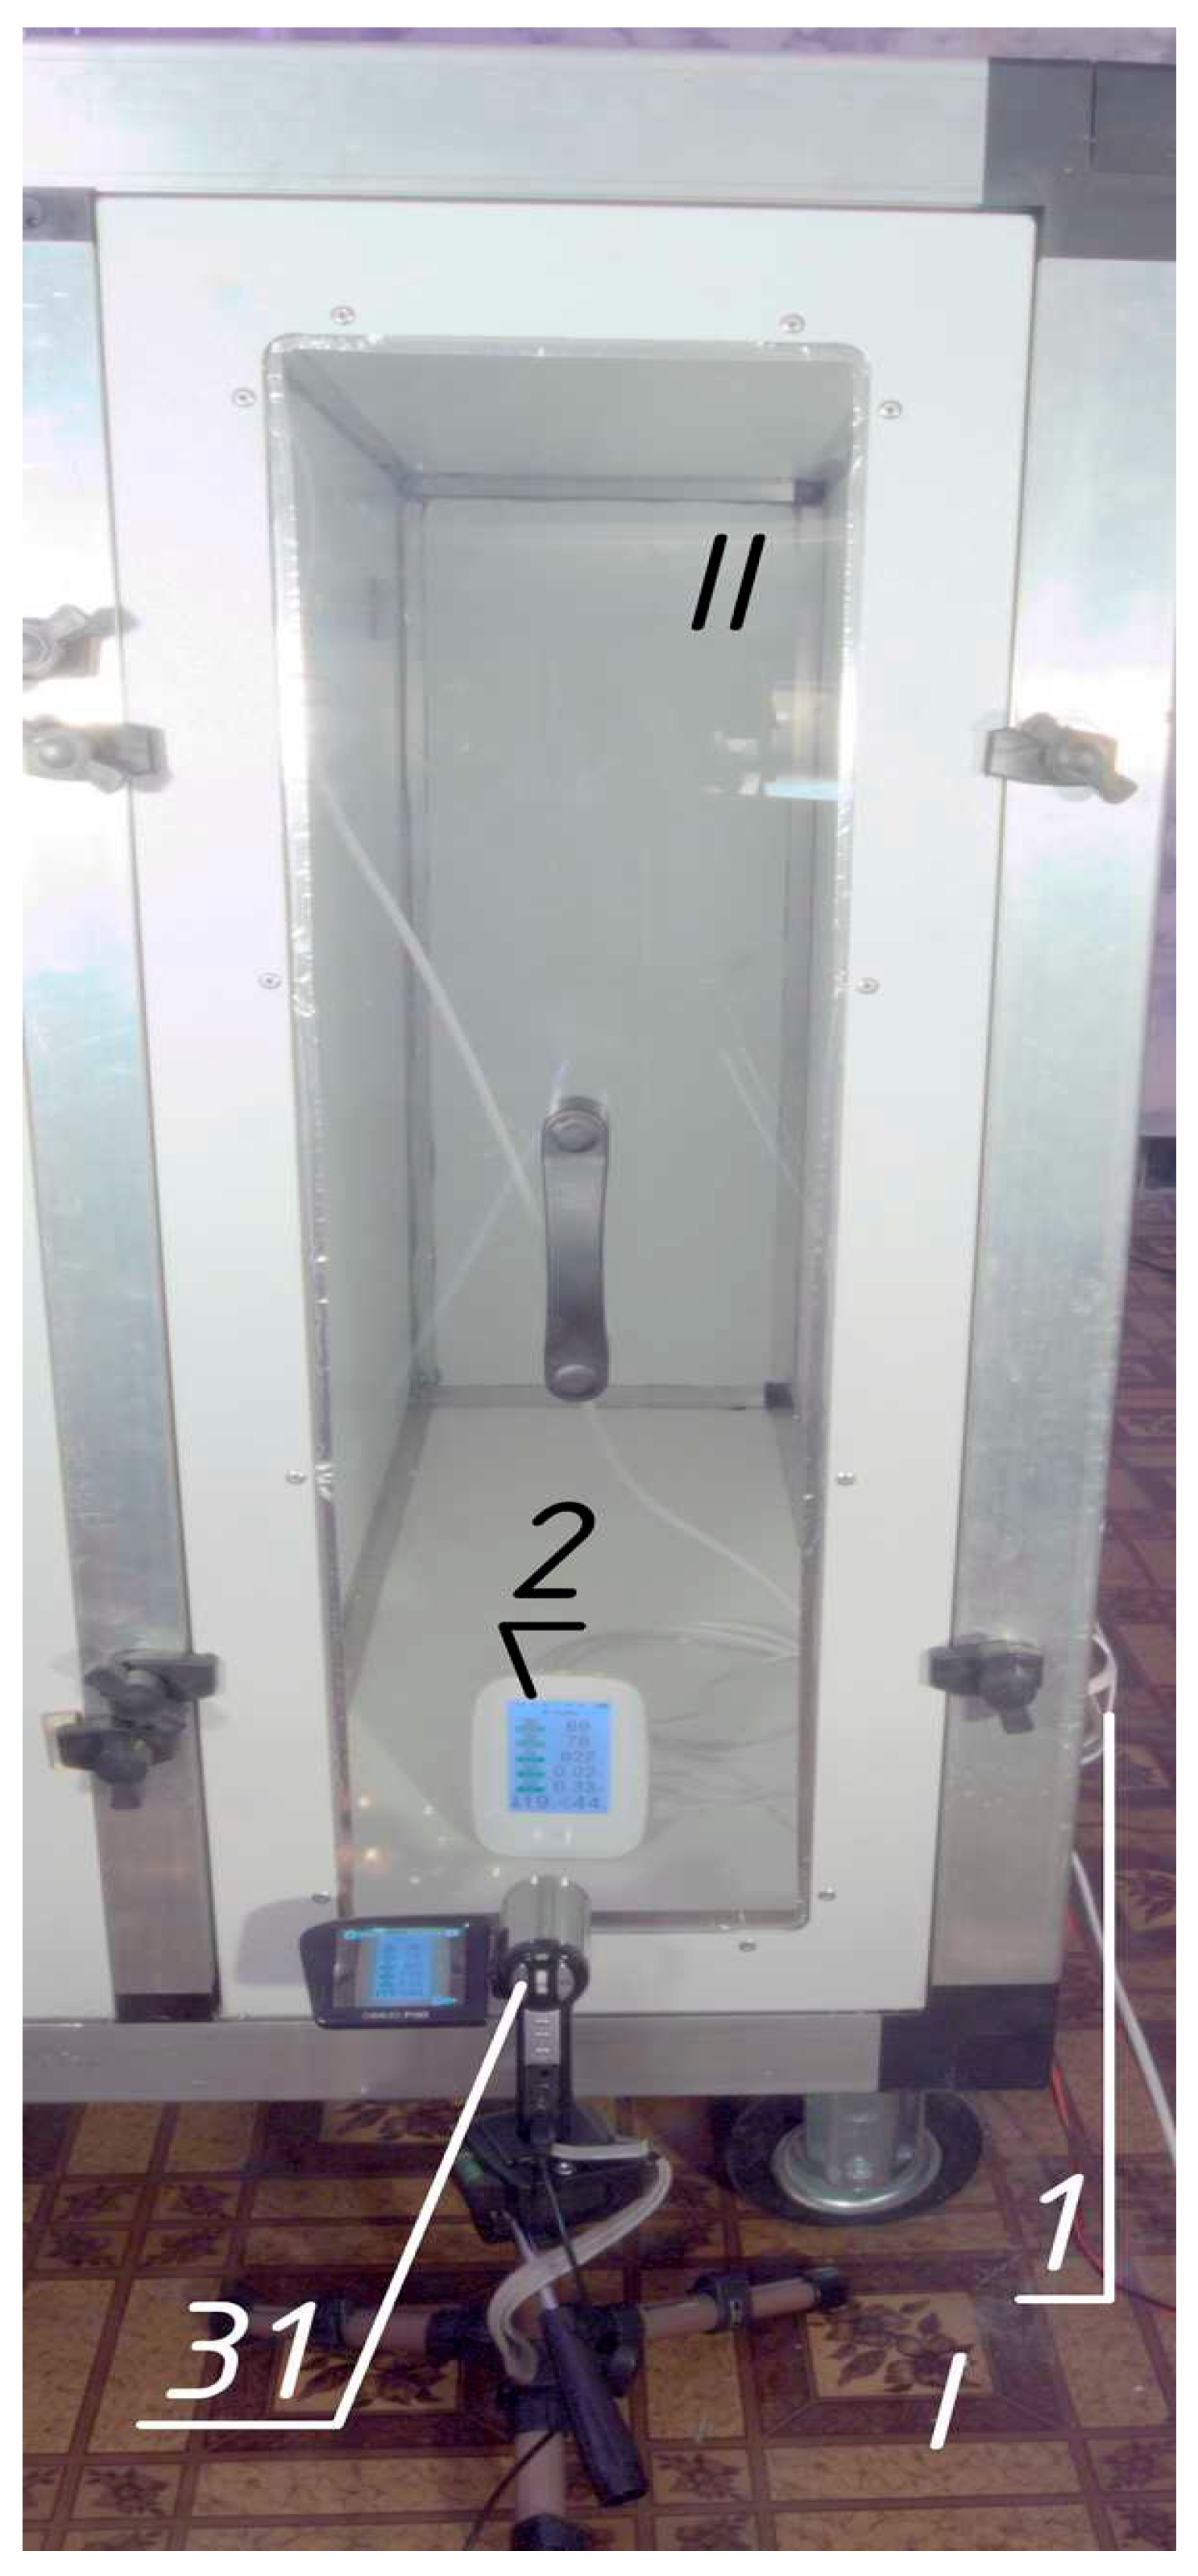
inlet zone—for measuring the parameters of model air, this is designed as a compartment and has a gas analyser to determine the parameters of the incoming air—990 mm in depth, 300 mm in width (along air movement), 990 mm in height;
gas exchange zone—designed as a compartment and contains plants and a gas analyser—990 × 990 × 990 mm;
outlet zone for measuring air parameters after exposure to plants—contains a gas analyser for measuring air parameters at the outlet of the gas exchange zone—5 dm3 canister.
Measuring devices correspond to
Table 1.
The system works as follows. The model air preparation area (laboratory) I is sealed by closing the metal–plastic windows and sealing the ventilation openings by armed scotch.
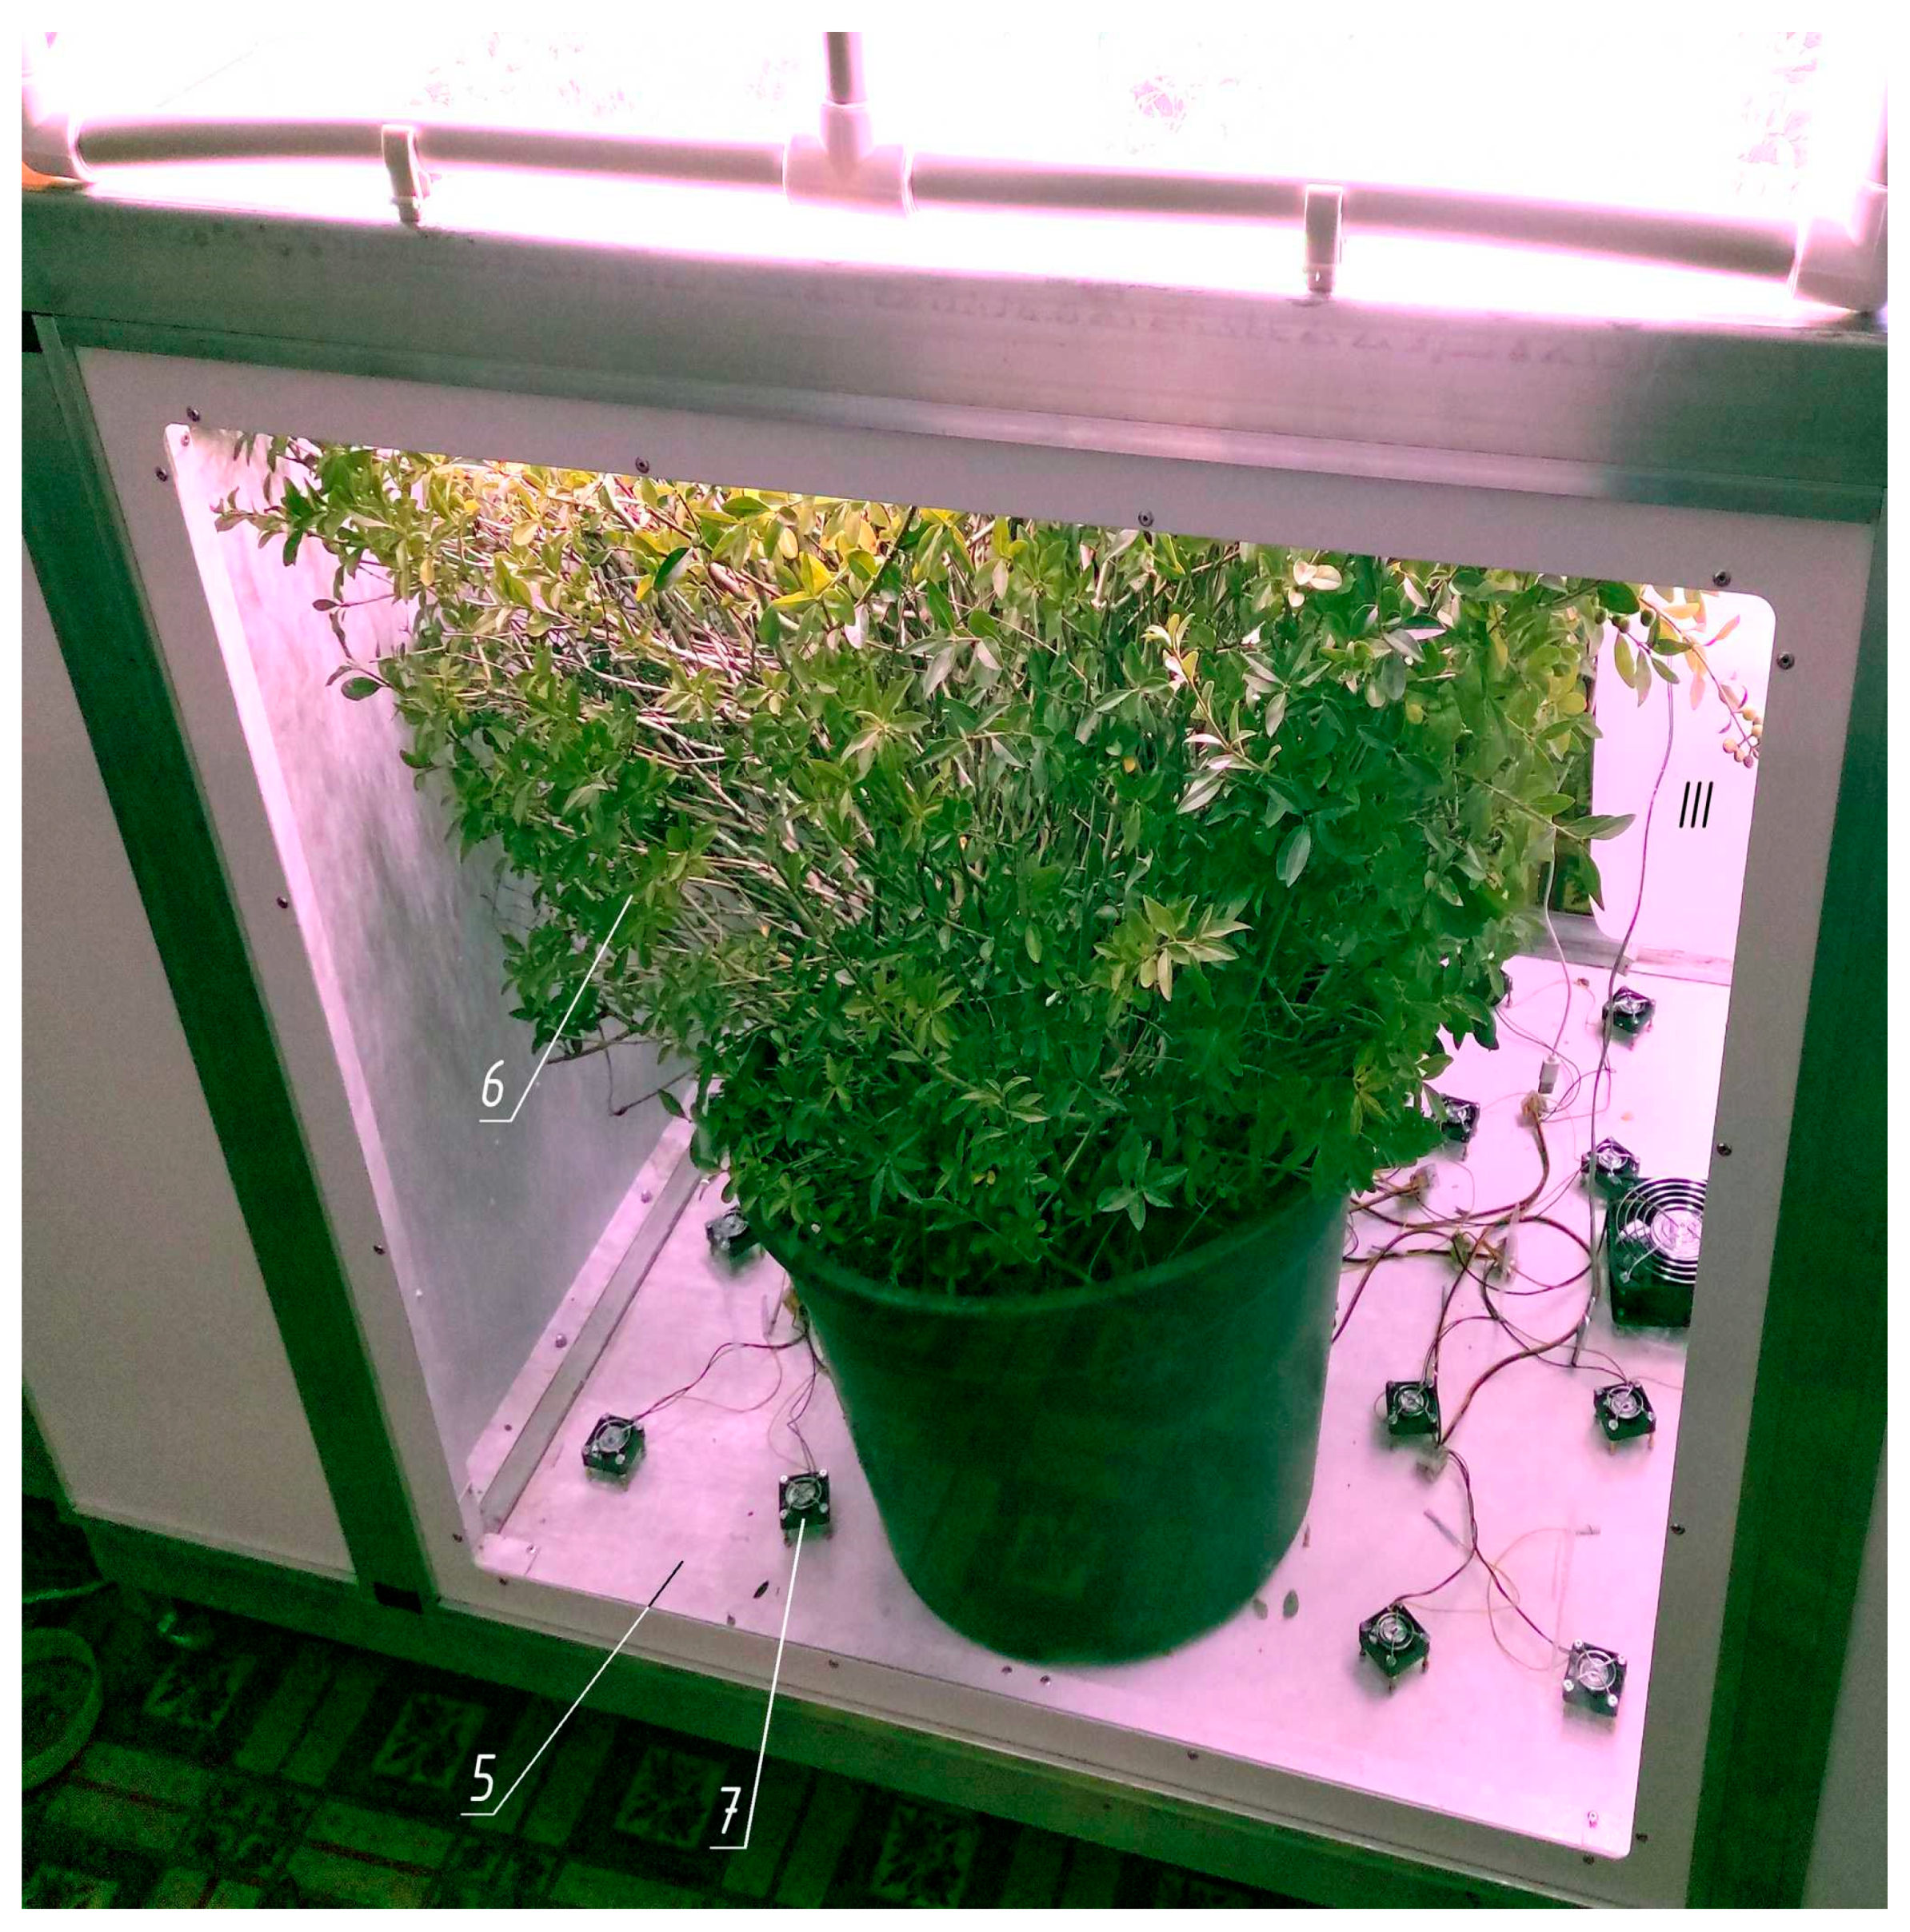
Start the installation. The model air enters through the inlet 1 with a protective grid into the inlet zone II, where its composition is determined by the gas analyser 2 connected to the power supply unit 3. Then the air flows into the gas exchange zone III, the height of which is regulated by raising or lowering the bottom 5 to the maximum level so that the plants 6 fill the maximum share of the volume (300 mm of height in this case).
The air is mixed by the mixing modules 7 (a fan Cooling Baby 4010 3PS, China with two protective grilles on the racks) in the vertical direction. The modules are connected to a power supply unit 8. The gas analyser 9 in the plant growing zone shows the carbon dioxide content between the plants. It is powered by the same power supply unit 3. The temperature and relative humidity readings of this gas analyser should not be trusted, because it is directly irradiated by the lighting system. The air, after being treated by plants, enters through the inlet with collector 10 to the outlet zone IV with gas analyser 11, which is also connected to unit 3.
As practice has shown, when operating three gas analysers on a single USB power supply cable without supplying mains voltage to the installation, it is necessary to prevent the voltage in this cable from falling below 4.9 V. In this case, we used a power supply unit 3 (not a phone charger) with a large current reserve (5 V, 2 A) and a power wire bus 2 × 0.5 mm2. Each line from the bus to the USB sockets is made with a minimum section of 2 × 0.25 mm2 wire due to the restrictions of the connectors. After year of operation, the bus loses stability, causing error in the gas analysers. This is due to the degradation of capacitors inside the power supply causing more pulsations. To avoid problems, additional pairs of capacitors (ceramic 2.2 μF R20Y225Z1HY2-L-Hitano (Hitano Ent. Corp., Taiwan R.O.C) for high frequencies and electrolytic 2200 μF 10 V ECR222M10B-Hitano Hitano (Hitano Ent. Corp., Taiwan R.O.C) for low ones) are installed on each socket.
Furthermore, the air through the inlet with the collector 12 is pumped by a fan 13 into the limited space of its transparent casing FH (Spaceo 40 dm3 container 580 × 390 × 265 mm) with a thermo-hygrometer 14, which determines the temperature, °C, and relative humidity, %. These parameters are needed to determine the air density during its metering. Below it is a thermo-hygrometer lighting module 15 with autonomous power supply from a portable 5 V 20,000 Ah battery 16 (Xiaomi BHR5121GL, Xiaomi Corporation, Beijin, China).
It could be connected to the power supply unit 3, but this would require additional breaking of the tightness of the partition or the unit housing. The battery lasts for a week of continuous operation. Next, the air enters the filter 18 and the gas meter 19 through the gas hose 17, from where it goes outside through the regulating (radiator) 20 and ball valve 21.
An attempt to regulate the airflow by adjusting the fan speed was unsuccessful. The gas meter is a volumetric membrane meter. When filling or deflating its bags, the system worked even when the voltage to the fans was less than 100 V. When the flows are switched, the spool mechanism requires energy from the airflow to operate. If the voltage on the fan exceeds 190 V, the switching occurs quite quickly. If the voltage is lowered, there is not enough energy, and the meter stops and stops airflow.
Because of this effect, airflow regulation by a valve was adopted. When the valve is covered during the filling and emptying of the bags, the pressure loss in the meter is relatively small, and the authority of the valve is high enough to ensure regulation. When the moment of switching flows approaches, the airflow is stopped by the meter. The pressure loss in the valve disappears, and all the fan pressure is directed through the meter diaphragms to the spool mechanism, which quickly works out the flow switching. As soon as the flows are switched, the pressure loss in the meter decreases and the high authority of the valve is restored [
44,
45].
Initially, it was planned to regulate the flow rate with the radiator valve 20 and use the ball valve 21 to block the access of dust when the plant was not in operation. It was assumed that when the ball valve 18 was subsequently turned on, the flow rate in the plant would resume. However, experience has shown that valves with elastic gaskets are not able to stably maintain an airflow rate of less than 1 m3/h, even during a continuous test. During operation, the gaskets are deformed by turbulent flow pulsations, which leads to changes in flow rate. When the ball valve is switched on and off, the flow rate is restored only if it is close to the maximum. Therefore, the function of the valves had to be changed.
A ball valve should not be used as a control valve due to severe wear when the flow comes into contact with the gasket. However, in this case, the operating time of the valve is very short, and it can be easily replaced. The conventional theory of valve authority, based on pressure loss at the fully open position, is not able to describe the operation of this valve with zero pressure loss. But practice shows that after 5–10 min of attempts, it is possible to set it to the desired flow rate. This flow rate is maintained within the meter’s sensitivity even after the fan is stopped and restarted.
The above provisions do not imply that ball valves can be used to regulate engineering systems. When designing such installations, it is also recommended to use valves that do not require elastic gaskets, such as needle valves.
A voltage stabiliser 22 of the Ukraine-2 SN-315 (VO Zaporizhtransformator, Zaporizhzhia, Ukraine) type was used to stabilise the voltage on the fan motor. Experience has shown that fan performance fluctuations are so small that they are not even detected on the collector by an accurate micromanometer MKV-250 (Chermetkoks, Kharkiv, Ukraine) with a reading accuracy of 0.1 Pa. Since these stabilisers stabilise the voltage with a sinusoidal distortion, their use for other purposes should be tested experimentally. For example, LED lighting with a diode-capacitor “driver” can be damaged by the harmonics that arise. The higher harmonics cannot be filtered out properly on a series-connected capacitor that is highly permeable to high frequencies.
For controlled lighting, the laboratory windows were tightly closed with aluminium reflective screens, and the installation provided a system of adjustable phytolighting. The system was powered from the mains through a daily timer 23 (TS-MF1, Kanlux, Radzionków, Poland) and a double-conversion stabiliser, which was assembled from a 12 V power supply 24 (Dicasver 12 V 166 A, Wuhan, China) and a 220 V 2200 W inverter 25 (made in EU). The disadvantage of this solution is that the inverters output a stable current frequency at a constant load, but it can differ significantly from the mains frequency. The inverter used has a frequency of 48 Hz instead of 50. This creates significant problems not only in film and video shooting, but also causes equipment to operate in modes other than the passport one. In particular, phytolamps operate at up to 50% of their power.
The inverter is connected to a soft-starter device 26 PPPT-25 of our own design for a rated current of 25 A. When the voltage is applied from the inverter, it connects a laboratory-adjustable autotransformer 27 (AOSN-8-220-82-UKHL4, Uman, Ukraine) through a wire limiting resistor (PEV-50 330 Ω, recommended to select within 220–470 Ω). This magnetises the transformer core. After about 3 s, the switch-on delay relay (ETI SMR-H, EVE-ETIREL, Romania) is activated and energises the coil of the three-phase starter. One of its contacts closes the resistor and connects the autotransformer directly to the mains. The output should be protected by a snubber (EPCOS S20K250, TDK Electronics AG, Munich, Germany) independently on the requirements for the components inside the soft-starter. The other two contacts connect a voltage and current relay 28 to the output of the autotransformer, which performs the function of overvoltage protection due to accidental scrolling of the autotransformer knob above 230 V, and also allows estimating the power consumption of the lighting through voltage and current readings. When choosing a relay, we chose one that has the function of measuring voltage with auto-adjustment to the actual current frequency. The output of the relay is connected to the control panel 29 for phytolighting—a block of six sockets with a common switch and a separate switch for each socket, as well as a surge filter. It allows six LED full-spectrum phytolamps (ZVision Growing LEDs, Beijing, China) with adjustable drivers to be switched on separately.
It is recommended to use an automated system for collecting data from gas analysers. However, in this case, when the methodology was just being tested and neither the number nor the exact locations of the gas analysers were known in advance, the readings of the gas analysers and the thermo-hygrometer were recorded by video camcorders 31–34. The meter readings were recorded by camera 35 (Olympus Miu 700, Olympus, Japan) at the beginning and end of the experiment. A watch 36 is installed near the meter to record the time. For the duration of the meter readings, the light 37 is turned on.
Due to the low airflow rates and high requirements for tightness of the meter connection in the installation, the fan casing FH with the outlet fitting and the hose connection to the meter is covered by the leakage monitoring camera AM with a small hole 38, in front of which a thermoelectric anemometer 39 is placed. This is a patented-by-authors tightness monitoring camera, the operation and tests of which are described in [
45]. The principle is that small hole 38 has significantly lower aerodynamic resistance than microscopic leakiness of AM. Thus, the most of leaked air, if present, will leave the camera through the hole and attack the sensor of anemometer 39. The anemometer senses the leakage at flows, which could not be measured by the most precise flow meter available, and soup solution applied to all junctions and surfaces inside it did not indicate leaking. We tried different sealants, but only plasticine heated before application was accepted (anemometer 39 indicates 0.00–0.01).
Other parts of the stand have no strong requirements for tightness. If some air will enter from zone I to zone II or III with under-pressure, it will have the same parameters as air in zone II. By the design, this air will be metered by meter 19. Thus, standard sealing by rubber sealant is applied to the doors and standard silicone sealant is used for fixed junctions.
Additionally, the unit is equipped with a luxmeter 40 for measuring the illumination in the room with the windows closed with screens (achieving that there are no indicators) and in the volume of the gas exchange compartment, as well as a flash 41 for issuing light pulses. The latter is directed at the entire installation and gives a light pulse. Subsequently, the blinded frame is used to synchronise the recordings on all camera videos.
Model air is prepared by burning candles in this area 42 (up to a hundred tea lights in this work), as well as paper and rags to simulate the ingress of smoke from a fire. The air is prepared before the beginning of tests.
It is necessary to take into account the peculiarities of the operation of the total volatile organic matter sensor. It does not distinguish between the nature of substances and shows a higher value at the output than at the input. The device often emits a life-threatening signal. The reason for this is the addition to the concentration of minor residual contaminants in the air of a significant content of volatile phytoorganic compounds (VPOC), which in most plants are either useful and therapeutic (phytoncides, aromas, biologically active substances, etc.) or have no effect on humans and other biota. The only exception is poisonous plants. An example is the well-known Conium maculatum, which is called “Hemlock” for its ability to cause headaches. Such plants are strictly not allowed on green structures and in interiors. General laboratories are not allowed to test such plants because of the health risks, so they are not considered. Due to the lack of separation of harmful pollutants from beneficial VPSs, it is impossible to measure the total absorption of all harmful substances by using plants.
In addition, to ensure the correct measurement of air parameters, the meter connection should be insulated as much as possible to ensure the lowest possible loss of air temperature—no more than 1 K. For this purpose, the so-called critical radius of thermal insulation was exceeded. This decision is justified if we consider the change of outer heat transfer coefficient [
44].
2.3. Treatment of the Results
The air density [kg/m
3] is determined by the following formula:
where
Pb is the barometric pressure, Pa;
T is the air temperature, K;
d is the moisture content of the air [g/(kg of dry air)];
t is the air temperature, °C.
The saturated vapor pressure is determined by the modified Buck’s formula [Pa] after elementary simplifications without loss of accuracy:
where
EF is the correction for the influence of air molecules (Enhancement Factor), which is the ratio of the saturated vapor pressure in air to this pressure in a vapor–liquid-only system:
Air moisture content [g/kg]:
where
Psat is the pressure of saturated vapor at a given air temperature [Pa]; φ is the relative humidity (dimensionless);
Pb is the barometric pressure [Pa];
Psat,d is the pressure of saturated vapor at the dew point temperature [Pa].
Absorption of carbon dioxide [g/s]:
where
Yin is the mole fraction of carbon dioxide in the inlet zone, ppm;
Yout is the mole fraction of carbon dioxide in the outlet zone [ppm];
G is the mass flow rate of air [kg/s].
Oxygen release may be estimated according to the gross photosynthesis reaction 6
CO2 + 6
H2O →
C6H12O6 + 6
O2↑ [g/s]:
Absorption of harmful impurities or particles of a certain size [µg/s or mg/s] is as follows:
where
qin is the concentration of an impurity or particles of a certain size, respectively, [µg/m
3], [mg/m
3];
qout is the concentration of an impurity or particles of a certain size, respectively, [µg/m
3] or [mg/m
3];
G is the mass flow rate of air [kg/s].
The illuminance is usually measured in Luxes, which weights the spectrum according to the sensitivity of the photopic vision, or micromoles per some time unit, which is the same weight as the spectrum by one per the photon energy. Both units do not correspond to the photosynthetic activity. In [
46], a new unit Phytolux [phlx] was introduced to weight the spectrum according to the standard photosynthetic activity curve, keeping the same value at the standard solar spectrum. In the same work, the used lux-meter reading X was re-weighted for the LEDs used in the phytolamps [phlx]:
It remains to determine the value that describes biomass and to which the results will be attributed. Biomass is usually used, but in this case it is impossible. After all, to determine it, the plant should be destroyed, and it is also impossible to purchase plants with a certain biomass. Therefore, non-destructive parameters of biomass are used, i.e., values that are related to biomass but do not require the death of plants to determine them.
The
Clorophytum comosum plant is unique in terms of gas exchange, because it is not a succulent, but it has a continuous photosynthetically active biomass. This is one of the most studied plants for indoor air phytoremediation. This species is known for its ability to effectively absorb a wide range of pollutants, including formaldehyde, nitrogen dioxide, carbon monoxide, ozone, benzene, toluene, cigarette smoke, and ammonia. Therefore, Chlorophytum comosum was selected as a model plant to evaluate the capacity of indoor plants to purify the air. For such a plant, this can be the total leaf area. To determine it, we measured (
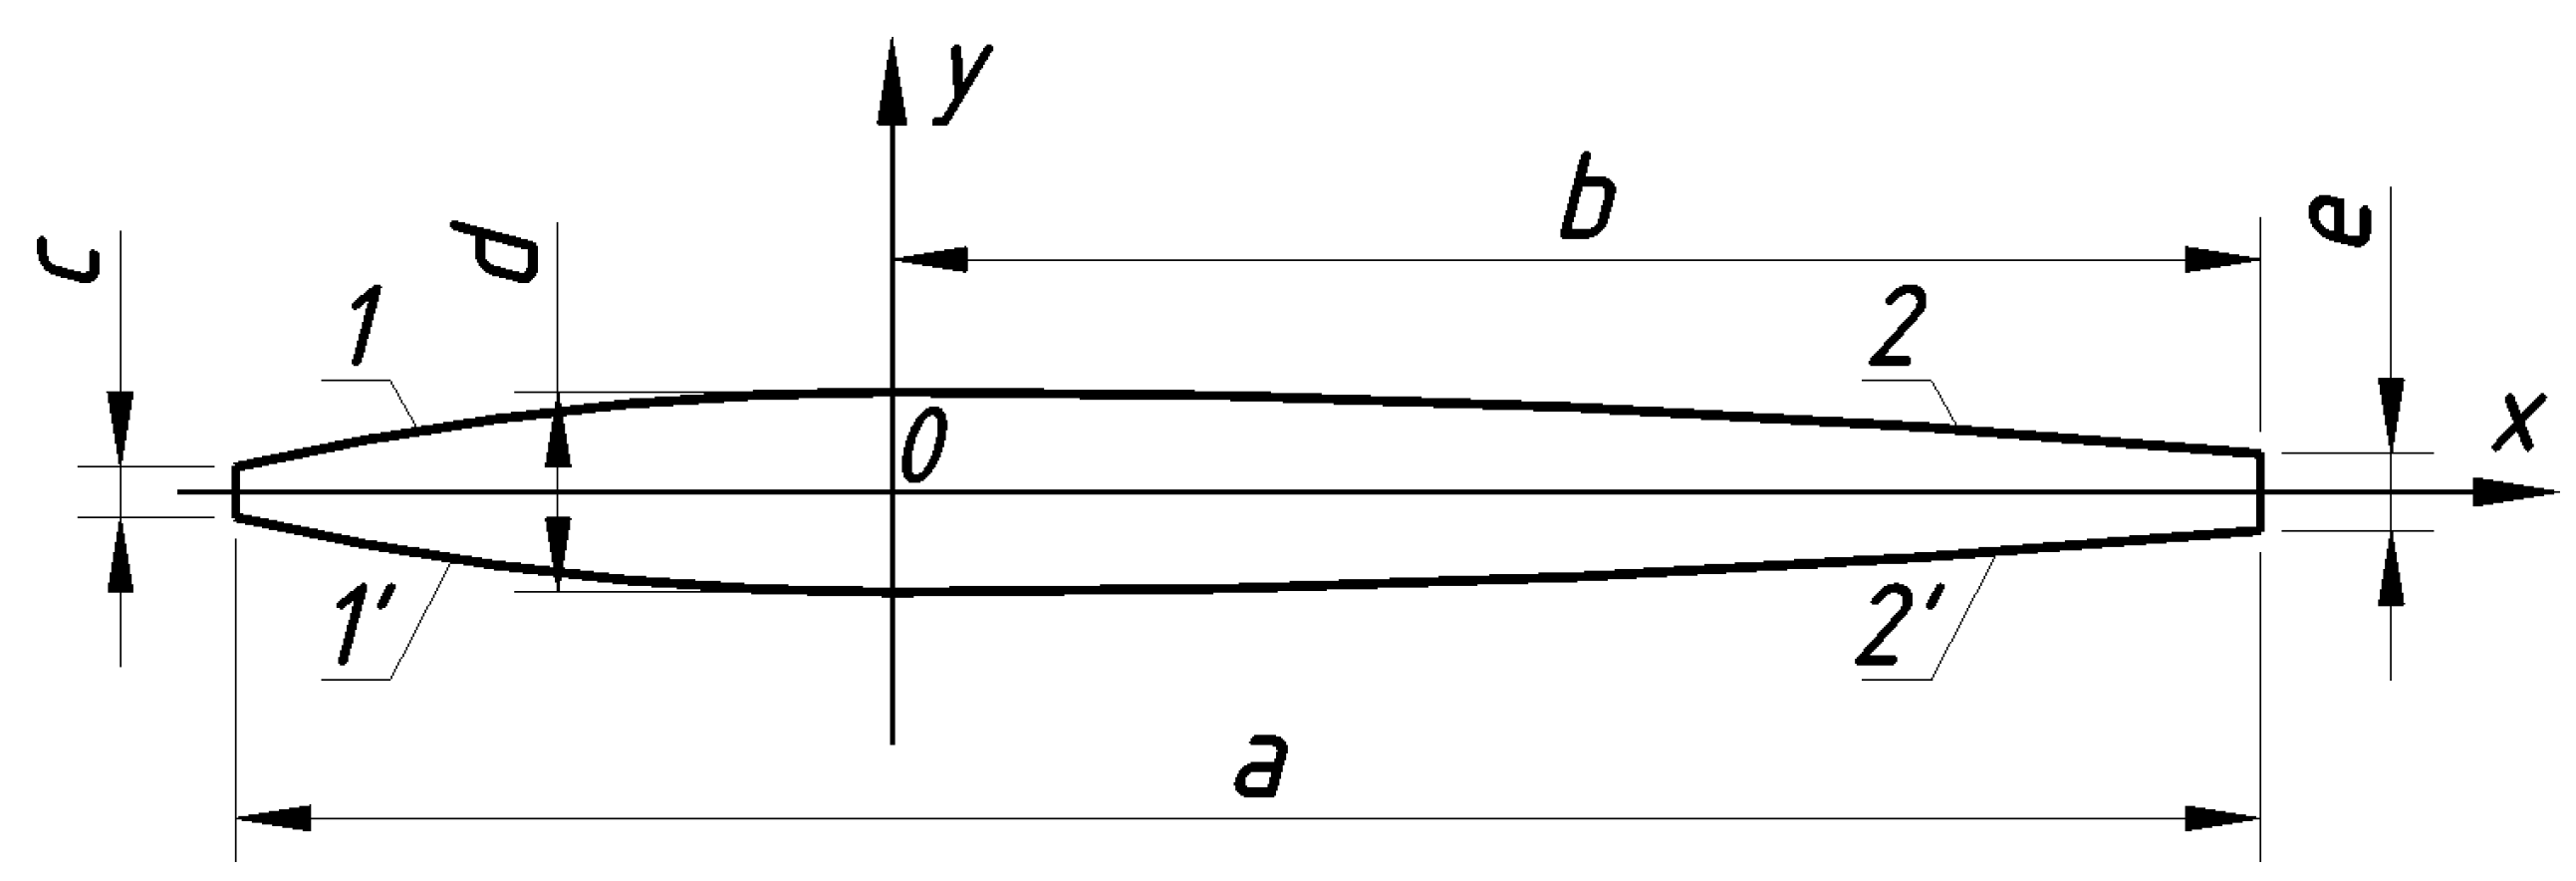
Figure 9) at least the length of the leaves a, m, the distance from the widest point to the end of the leaves b, m, the width of the leaves at the stem c, m, at the widest point d, m, and at the end e, m. If the leaves are new, e = 0. But in the course of normal life, leaves fall off and form. In the slow process of leaf fall, the leaves gradually dry out from the end to form a non-zero width e. Some of the leaves may dry out to the widest point. Then b = 0.
The contours of the leaves of
Clorophytum comosum are approximated by four parabolas, which, according to
Figure 8, have equations in accordance with
Table 2. Total leaf area [m
2] is as follows:
where
nfol is the total number of leaves on all plants participating in the research;
ai,
bi,
ci,
di, and
ei are the sizes of the
i-th leaf.
2.4. The Experimental Procedure
The experimental procedure is the following:
Disinfecting the stand.
If necessary, moving the bottom up.
Installing plants 6 and mixing modules 7.
Starting the measuring devices.
Closing the stand.
Putting on an FFP3 respirator(s) and lighting the candles, paper, etc. During the stand preparation, the modelling air will be prepared.
Starting the fan 13 and mixing modules 7.
Regulating the airflow by valve 21 and the illumination using autotransformer 27.
Adjusting cameras 31–34, starting recording.
Switching off and on the illumination to synchronise the video recordings.
Waiting for enough pollution of the modelling air.
Putting out the candles to avoid over-pollution.
Making the shot of the gas meter and the clock.
Leaving the laboratory to keep the experimental setup operating (CO2 will leak very, very slowly, incomparable with the inertia of the stand, through very small slots in the sealed door of zone I) using one of the following programs:
- a.
8–18 h of illumination and at least 6 h of darkness to measure the dependence of CO2 absorption on the illumination and CO2 release of breathing;
- b.
From 8 h up to lessen the difference in the readings of gas analysers 2 and 11 (capacity of cards in cameras 31–34 if no remote sensing system) to test the time–gas exchange characteristics.
Stopping recording.
Ensuring that plants are rested enough (at least 8 h) inside the gas exchange zone at the fan operation. If there is a failure of the fan, the CO2 content can reach critical values, condensation can occur, and the plants should be inspected.
Repeating steps 6–15 for other parameters (always use at least FFP3 respirator inside zone I with model air).
2.5. The Error Estimation
The main advantage of the approach in comparison to the single-leaf one is that the result is produced by many plants. Each result is the averaging of approx. 50 plants. This raises the reliability of the results.
If we are determining the airflow using such precise devices and methods, which take into account the air temperature and humidity, the relative error εG of the airflow will correspond to the characteristics of the gas meter—3%. Using the reliability α = 0.95, the error should be estimated at the corresponding Student quantile for infinite freedom degree tα(∞) = 2 as εG,0.95 = (2/3)·εG = 2% of measured value.
The CO
2 analysers are the roughest devices. The difference between CO
2 values has the estimation of absolute error as the square root [
47] of the sum of squares of the gas analysers errors. If there are no special conditions (for example, very short of funds), we should use both the best possible sensors available. In our case, the absolute error is Δ
Y = 40 ppm. Thus, the error will be the error of each sensor multiplied by the square root of two. Using the same reliability α, the absolute error will be Δ
Yin−Yout,0.95 = (2
3/2/3)·Δ
Y = 0.9428·Δ
Y = = 37.71 ppm.
Using Equation (5), it is possible to calculate the relative error of the CO
2 absorption as follows:
As we see from Equation (10), to achieve adequate results, we should control the air volume, because decreasing it will throttle the relative error by Equation (10) but increase the inertia. The flow is selected to achieve not less than Yin − Yout = 190 ppm, except the points, corresponding to exhaustion. Equation (10) gives the relative error estimation up to 20%, which is enough for such research. To achieve better error, it is possible to decrease the airflow, increasing the inertia. But this requires automatic control of the constant CO2 content in model air for approx. 6 h and taking the measurements at the end of the period (only one experimental point). But this will require 1–2 weeks to perform one series of research at constant illuminance.


 ,
, 
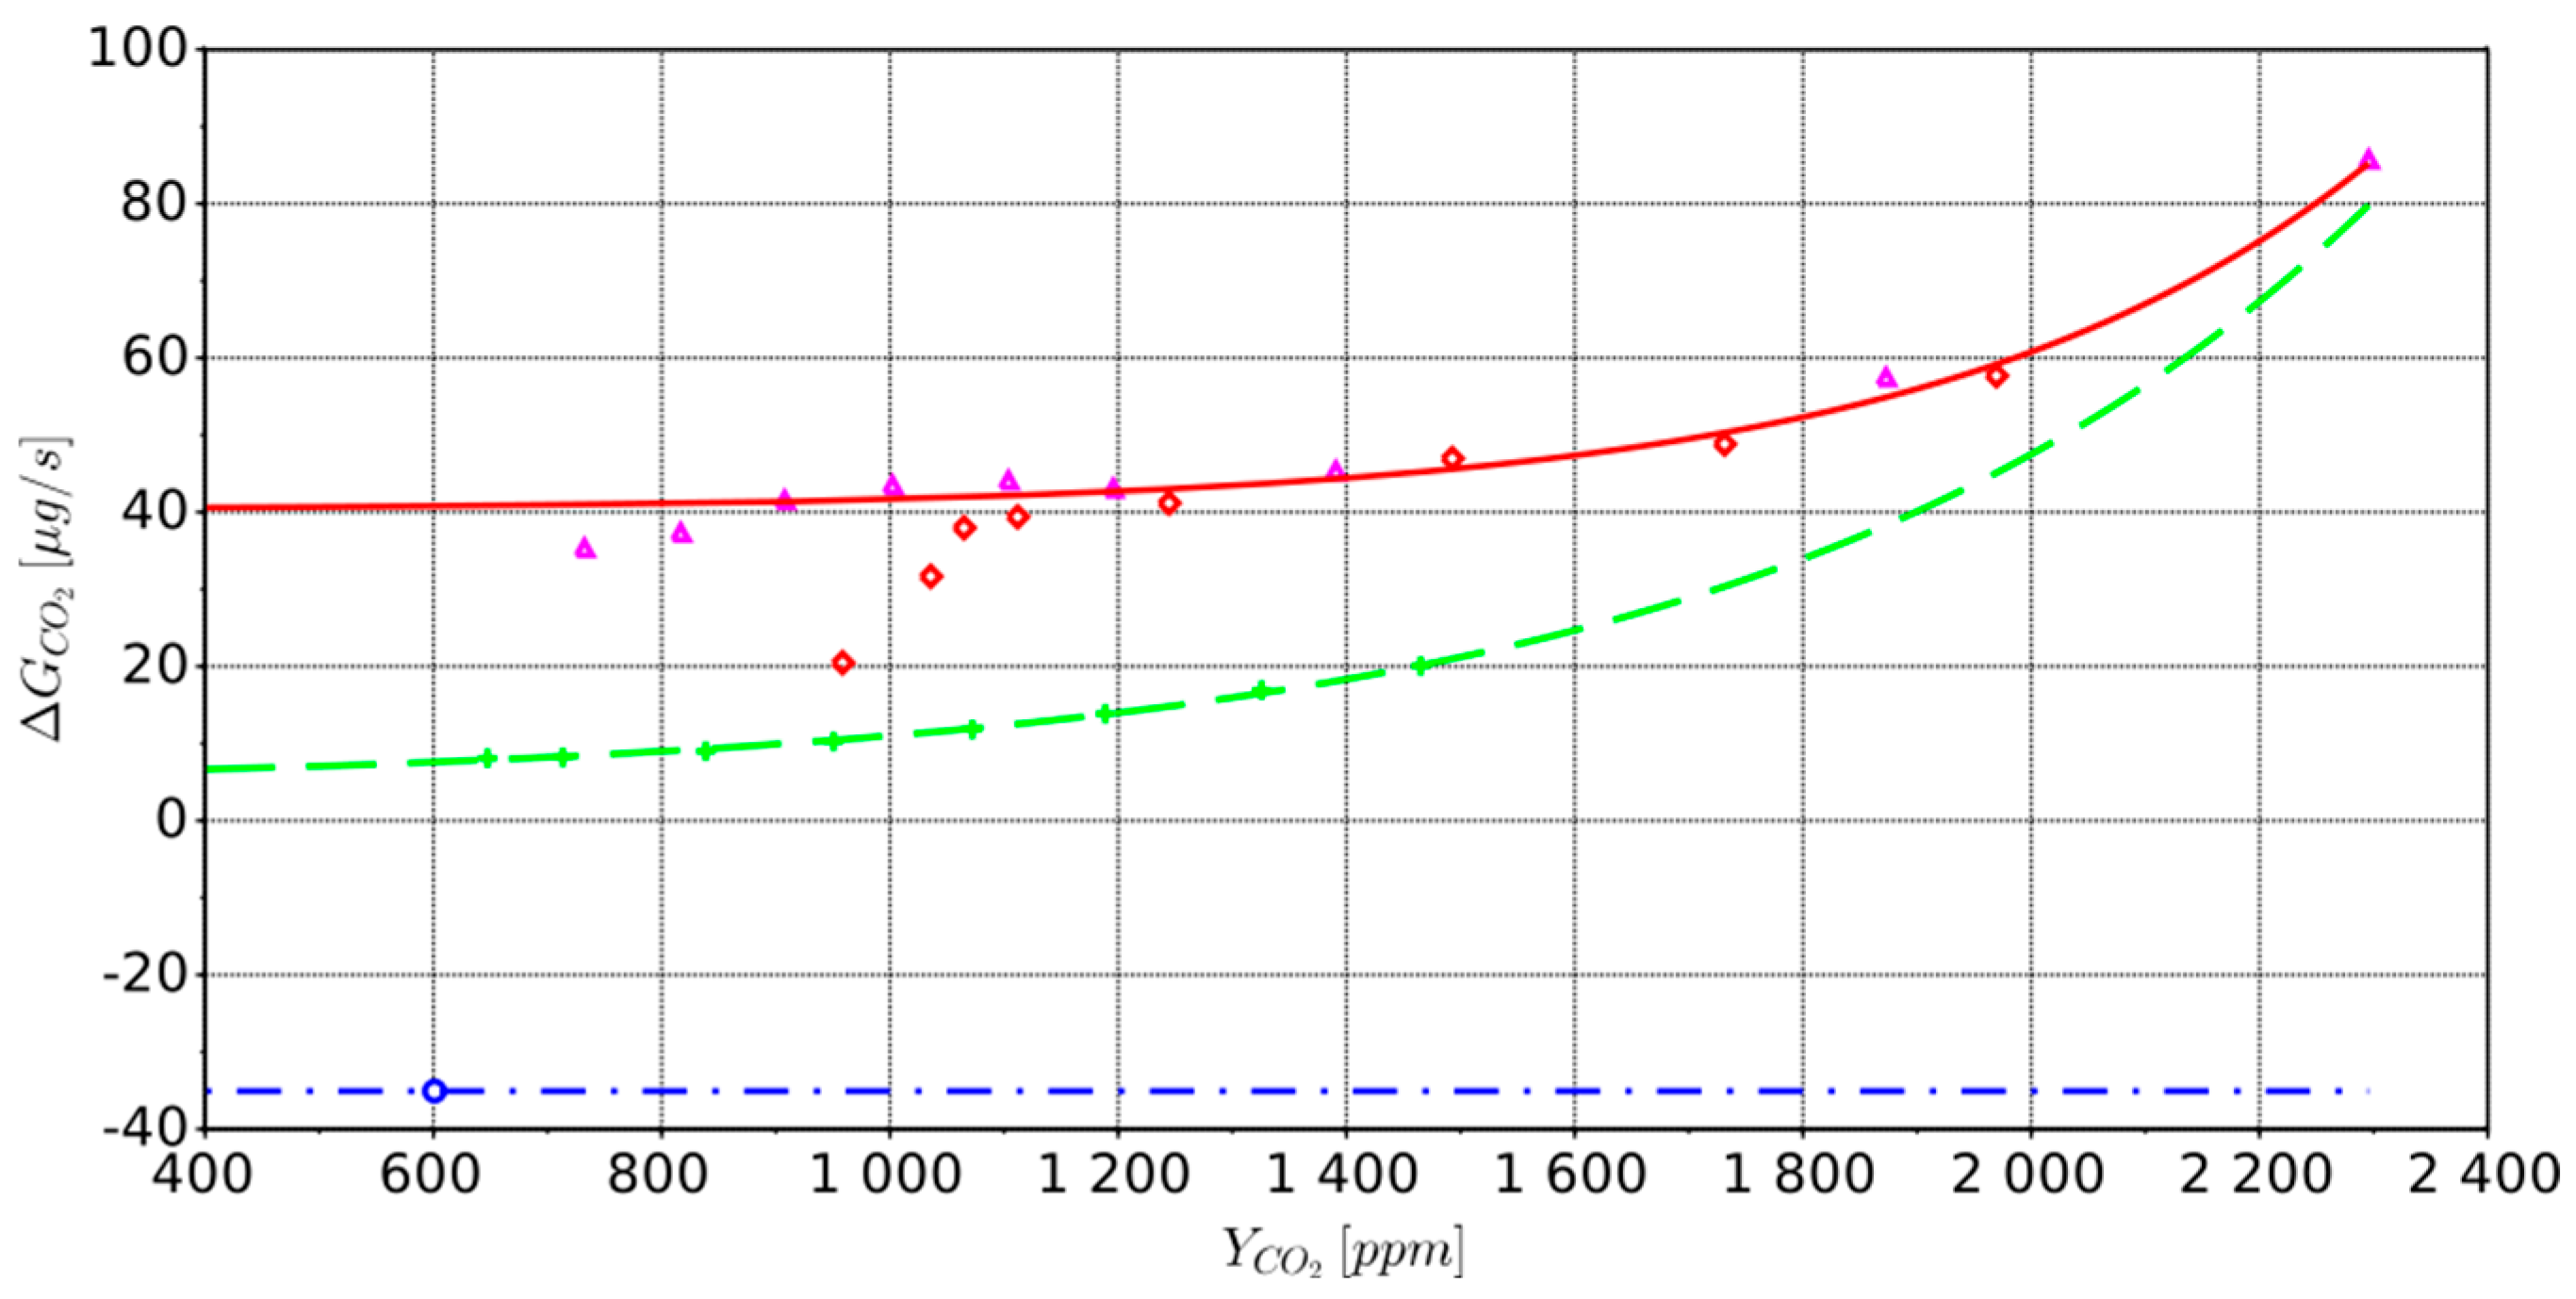
 —0 (respiration);
  —6872 phlx;
  —20,236 phlx;
  —31,136 phlx. approximation:
  —0 (respiration);
  —6872 phlx;
  —14,766 phlx.
