Article

Accounting of Grassland Ecosystem Assets and Assessment of Sustainable Development Potential in the Bosten Lake Basin

College of Grassland Science, Xinjiang Agricultural University, Urumqi 830052, China
*
Author to whom correspondence should be addressed.
These authors contributed equally to this work.
Sustainability 2025, 17(8), 3460; https://doi.org/10.3390/su17083460
Submission received: 7 February 2025 / Revised: 24 March 2025 / Accepted: 11 April 2025 / Published: 13 April 2025

Abstract

:
Assessing the ecosystem service value (ESV) of grasslands is crucial for sustainable resource management and environmental conservation. This study evaluates the spatiotemporal changes in grassland ecosystem services in the Bosten Lake Basin using long-term land use data (2000–2022). Employing the Patch-generating Land Use Simulation (PLUS) model, we develop three future scenarios—natural development, ecological protection, and economic priority—to predict grassland utilization trends. The findings reveal a continuous decline in grassland area and ecosystem service values, driven by climate change and human activities. Compared with 2022, all three scenarios indicate further degradation, but ecological protection measures significantly mitigate ESV loss. This study provides scientific insights for sustainable land management and policy-making, contributing to ecological restoration strategies under climate change impacts. The findings reveal the following: (1) Over the 22-year period, the grassland area in the Bosten Lake Basin has experienced an overall decline. Notably, the area of plain desert steppe grassland expanded from 626,179.41 ha to 1,223,506.62 ha, whereas plain meadow grassland reduced from 556,784.64 ha to 118,948.23 ha. (2) The total ecosystem service value of grasslands in the basin exhibited a marginally insignificant decrease, amounting to a reduction of 5.73422 billion CNY. The values for mountain desert, mountain desert steppe, mountain typical steppe, and mountain meadow grasslands were relatively low and showed minimal change. (3) In comparison to 2022, the projected areas of grassland under the three scenarios for 2000 show a substantial reduction, particularly in plain desert and hilly desert grasslands. The ecosystem service values across all scenarios are expected to decline in tandem with varying degrees of grassland degradation. This research underscores the impact of global warming and human activities on the shrinking grassland area and the diminishing ecosystem service values in the Bosten Lake Basin. The current state of grassland resources in the study area is under threat, highlighting the urgent need for strategic planning and conservation efforts to ensure sustainable development and ecological integrity.

1. Introduction

Grasslands are the world’s largest and most widely distributed terrestrial ecosystem, supporting major livestock production and providing various ecosystem services [1]. They serve essential functions such as biodiversity conservation, soil and water conservation, and wind erosion control [2]. Grassland ecosystems, primarily composed of perennial herbaceous plants, are key indicators of ecological quality and play a vital role in the utilization and optimization of grassland resources [3,4]. Numerous international researchers have delved into extensive studies in the field of grassland ecology, yielding substantial findings [5]. However, climate change and intensified grazing pressures have precipitated a cascade of degradation phenomena in grassland ecosystems, including soil erosion, reduced biodiversity, and altered species composition. These changes collectively undermine the resilience and functional integrity of the grasslands, thereby compromising their long-term stability and provisioning services [6]. Remote sensing-based monitoring has been widely applied to assess multi-scale grass-land dynamics. For alpine meadows and steppes, studies have integrated multi-source satellite imagery with machine learning algorithms to quantify degradation patterns [7,8]. Hyperspectral imaging has emerged as a critical methodology for detecting bio-chemical and structural shifts associated with grassland degradation, particularly through its capacity to resolve spectral signatures of stress-induced vegetation changes and soil biogeochemical alterations [9]. Continental-scale assessments further leverage SMAP radar data to track soil moisture–vegetation feedback [10].
Functioning as biophysical conduits between natural systems and human societies, ecosystem services underpin socioeconomic well-being through their regulation of material cycles, while simultaneously safeguarding biosphere integrity and adaptive capacity in the face of global environmental change [11]. In recent years, the PLUS model (Patch Landscape and Transition Simulation model) has been widely used as an effective tool for simulating land use change in ecosystem service value assessment and land use change prediction studies [12]. By integrating landscape ecology, Geographic Information Systems (GISs), and machine learning techniques, the PLUS model is capable of simulating the dynamic transition processes between different land use types and predicting the impact of these transitions on ecosystem services. Zhang et al. [13] conducted a quantitative evaluation of forest ecosystem service intensity and forest landscape patterns in Renqiu, Hebei Province, discovering that forest ecosystem service intensity is significantly related to spatial distribution, forest area ratio, and landscape pattern. Exploration of the monetization potential of grassland ecosystem services is a domain that has hitherto been inadequately addressed.
Spanning the transitional zone between desert and alpine ecosystems in northwestern China, the Bosten Lake Basin represents a topographically complex watershed where dynamic interactions between geomorphology and anthropogenic pressures drive landscape evolution. Intensive land use transitions—primarily fueled by rapid urban expansion and unsustainable pastoral practices—have precipitated widespread degradation of native grasslands, altering their capacity to deliver critical ecosystem functions. Leveraging the spatially explicit scenario modeling capabilities of the PLUS framework, this study demonstrates that grassland ecosystem service value (ESV) is modulated by dual forces of adaptive management frameworks and climate variability. Strategic integration of vegetation restoration protocols with landscape-scale conservation zoning emerges as a viable pathway to amplify ESV trajectories, while scenario-based projections provide actionable insights for balancing ecological integrity with socioeconomic development imperatives.

2. Materials and Methods
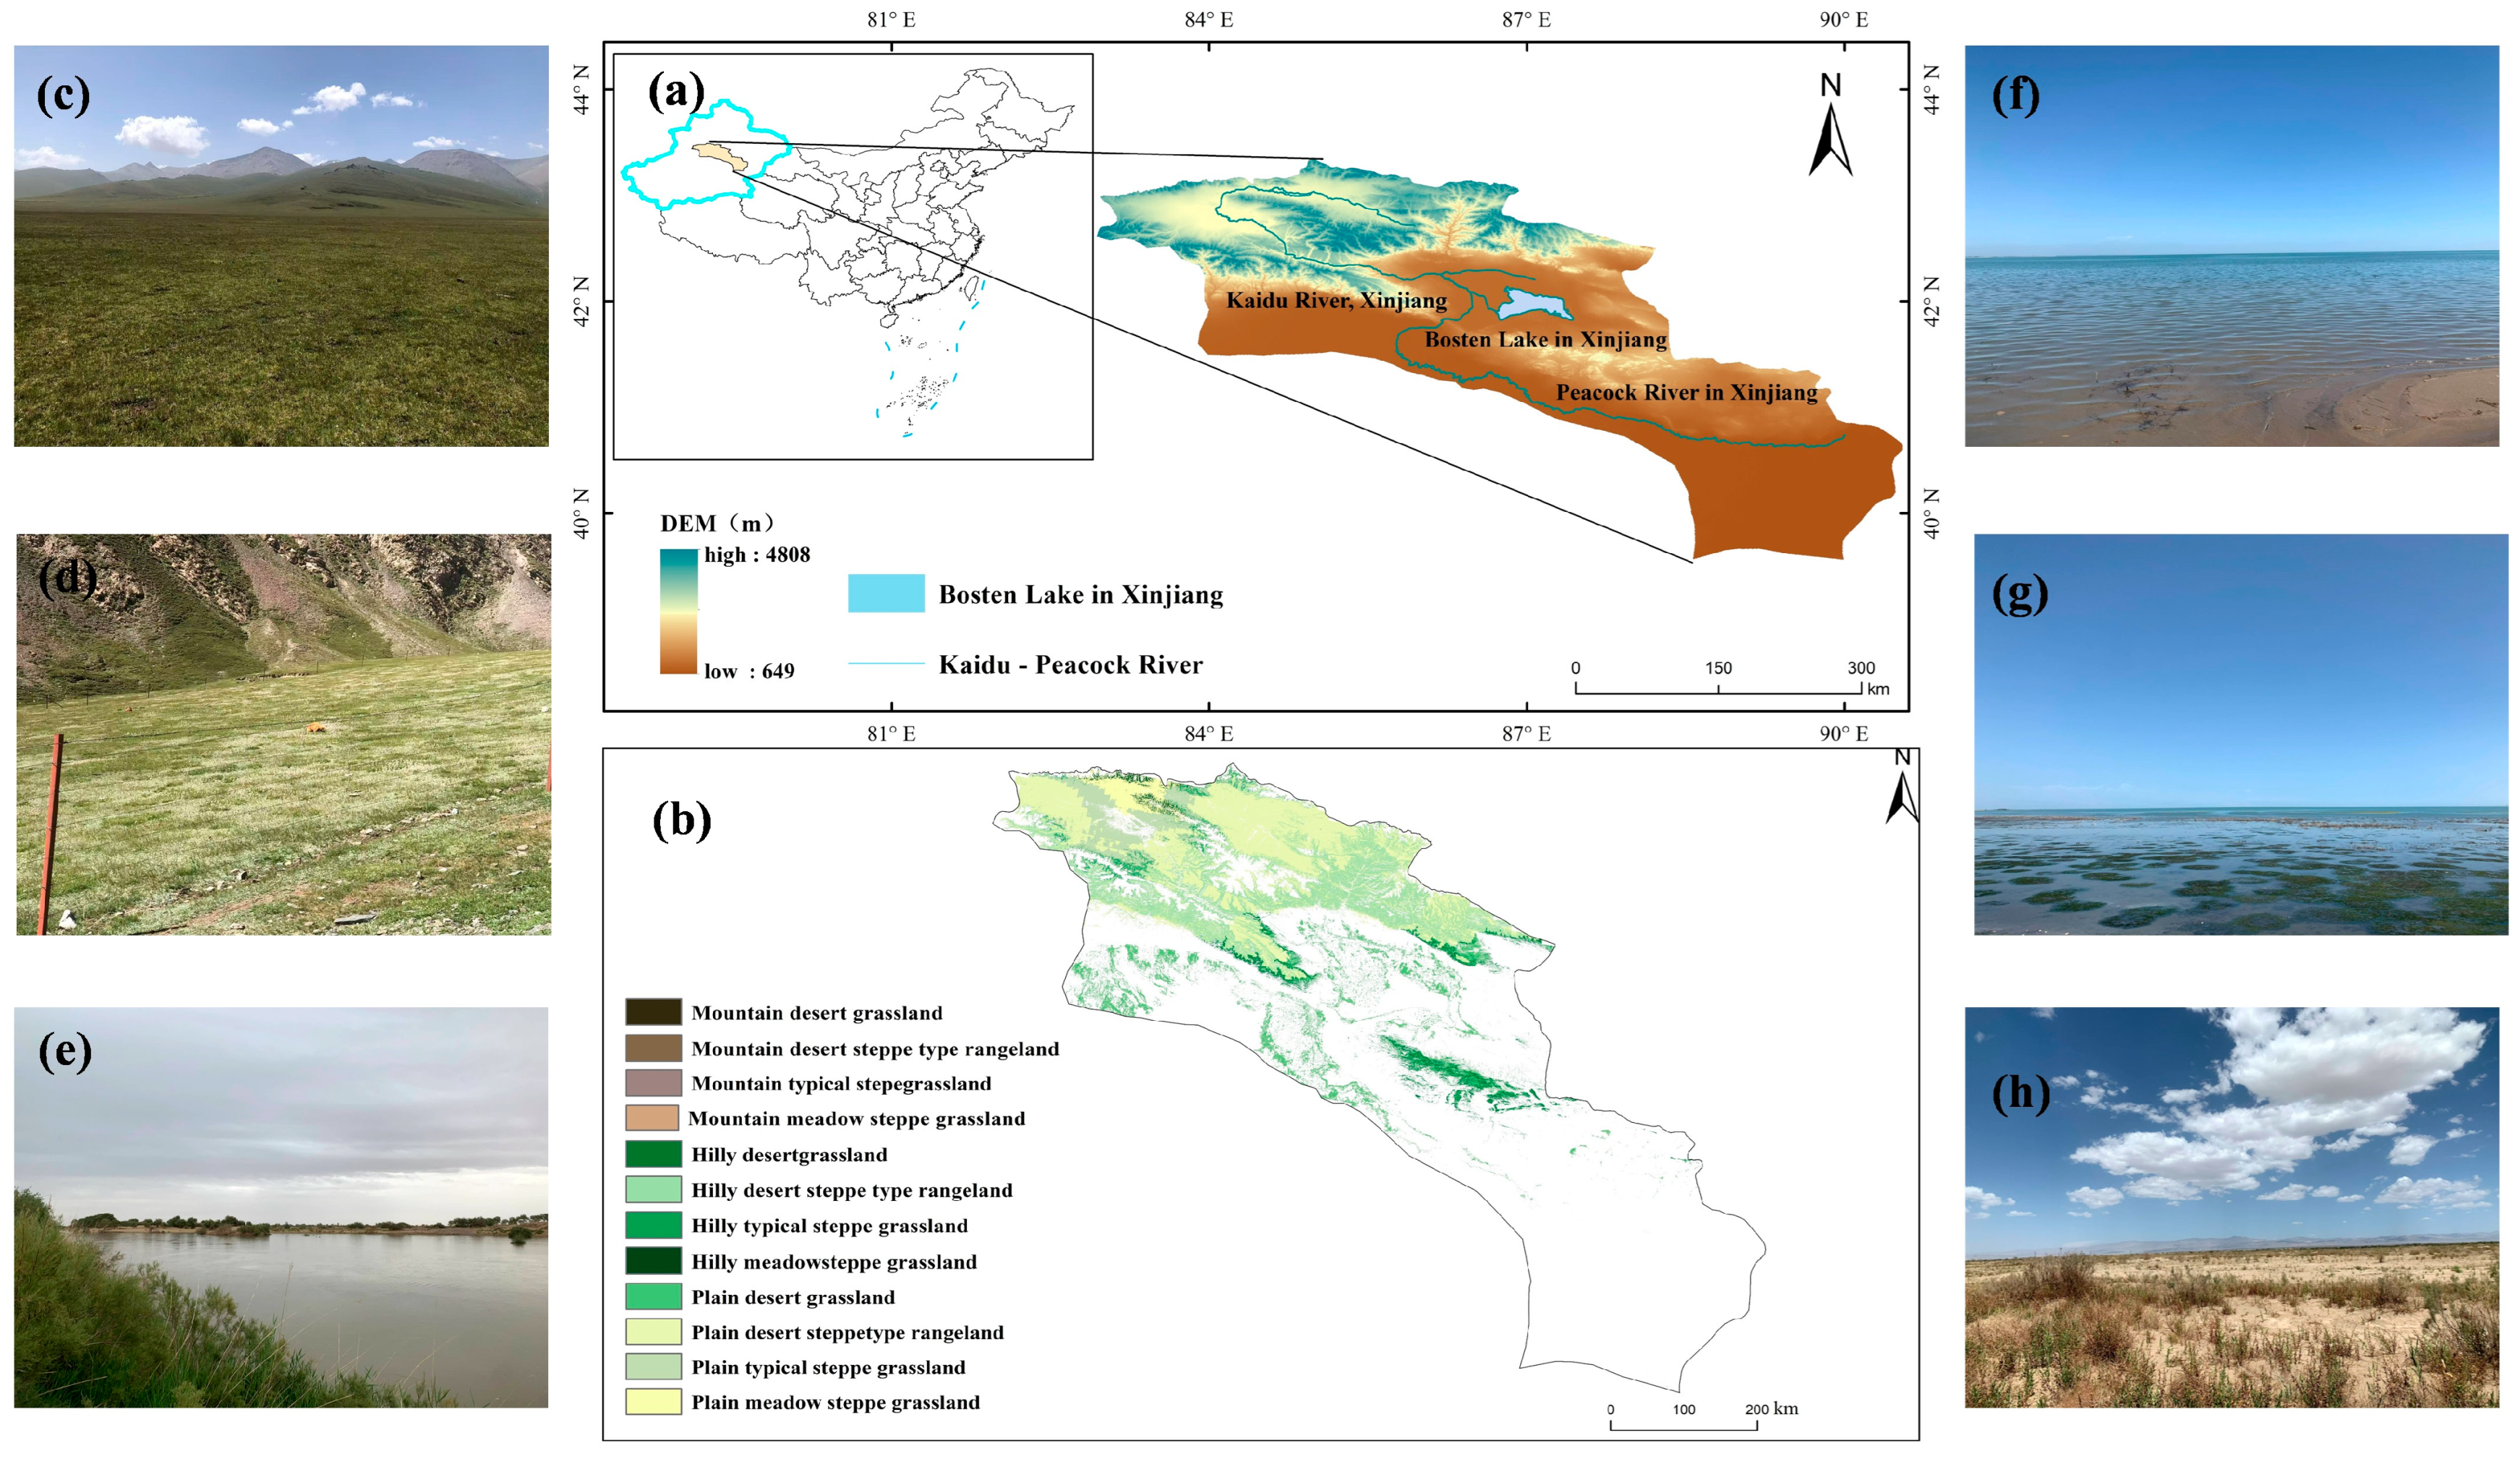
2.1. Study Area

The Bosten Lake Basin is located in the northeastern Tarim Basin, at the northeastern edge of the Taklamakan Desert. The geographic coordinates are 82°80′~88°62′ E, 41°25′~43°35′ N (Figure 1). The administrative divisions include Heshuo County, Hejing County, Yanqi County, Bohu County, and Yuli County, covering a total area of approximately 115,403.88 km2. The basin, which serves as both the origin of the Peacock River and the final destination of the Kaidu River, is characterized by intricate terrain and a climate that is temperate yet arid, with annual rainfall ranging between 70 and 80 mm. The mean annual temperature hovers around 8.2–11.5 °C [14]. The landscape is predominantly composed of various land types, including cropland and grasslands with varying degrees of coverage—high, medium, and low—along with lakes, sandy areas, and saline–alkali soils. Grasslands, second only to unutilized land, occupy the largest portion of the basin.

2.2. Data Sources

The study uses land use remote sensing data from Wuhan University’s CLCD (China Land Cover Dataset) [15], which provides 30 m spatial resolution land use data for Xinjiang from 2000 to 2022. The data classify nine primary land types (cropland, forest, shrubland, grassland, water bodies, ice/snow, barren land, impervious surfaces, and wetlands). DEM data are obtained from the Geospatial Data Cloud (http://www.gscloud.cn, accessed on 15 October 2024), processed through coordinate conversion and resampling. Meteorological data from standard stations in the study area are interpolated after removing anomalies, providing annual accumulated temperature and precipitation from 2000 to 2022 (Figure 2). Socioeconomic data for the study area from 2000 to 2022 were derived from the Xinjiang Statistical Yearbook (2001–2023) and the Xinjiang Production and Construction Corps Statistical Yearbook (2001–2023). A comprehensive summary of data accuracy, sources, and processing methods is provided in Table 1.

2.3. Grassland Classification

The Comprehensive Sequential Classification System (CSCS) classifies grasslands based on bioclimatic characteristics [16]. Grasslands with the same zonal bioclimatic characteristics are classified according to different thermal and humidity levels, and further divided into subcategories based on topographic relief [17]. CSCS provides high stability and accurately represents spatial distribution patterns of grassland types [18]. Based on hydrothermal conditions, the categories are divided into seven thermal levels (cold, cool, slightly warm, warm, warm–hot, sub-hot, and hot) and six humidity levels (extremely dry, dry, slightly dry, slightly moist, moist, and humid). This study categorizes grasslands in the study area based on humidity by calculating the ratio of annual precipitation to annual accumulated temperature above 0 °C [19]. The calculation formula is as follows:
K = r 0.1 θ
where K is the humidity index, r is the annual precipitation, and ∑θ is the annual accumulated temperature above 0 °C. Grasslands are classified into desert (K < 0.3), desert steppe (0.3 < K < 0.9), typical desert steppe (0.9 < K < 1.2), and meadow (K > 1.2) categories.
Topographic relief [20], a fundamental parameter in geomorphological analysis, quantifies vertical variation across landscapes through the elevation differential between maximum and minimum points within a delineated area. This metric is computed using the formula:
Δ H = H max H min
where ΔH is the topographic relief, Hmax is the maximum elevation, and Hmin is the minimum elevation. Relief is categorized as plain (<30 m), hilly (30–200 m), and mountainous (>200 m).

2.4. Evaluation of Grassland Ecosystem Service Value

This study estimates the value of grassland ecosystem services in the Bosten Lake Basin using the ecosystem service value equivalent factor method, based on an improved Costanza evaluation model proposed by Xie et al. [21], which considers China’s actual conditions. The evaluation primarily utilizes wheat and maize as the major crops in the study area. The formula used is as follows:
E S V = ( A k × V C k )
ESV represents the total value of ecosystem services (CNY); Ak refers to the area of the k-th type of grassland (hm2); the ecological valuation metric assigned to the k-th landscape category within the classification system is represented by the coefficient VCk. Through calculations, the grassland ecosystem service value coefficient is determined to be 13,624.38 CNY/hm2.

2.5. Grassland Utilization Change Scenarios Based on the PLUS Model

The Patch-generating Land Use Simulation Model (PLUS) [22] operates as a spatially explicit cellular framework [23], designed to project land use/cover transitions at fine-grained patch resolutions through raster-based spatial analytics. By integrating a dual-component architecture—combining retrospective pattern extraction (land expansion analysis strategy, LEAS) with forward-looking scenario modeling—the framework quantifies the spatiotemporal dynamics of landscape evolution. LEAS employs machine learning-driven diagnostics, utilizing random forest classification [24] to isolate dominant drivers of historical land conversion, thereby generating probabilistic surfaces of development suitability and variable importance metrics across temporal intervals [25]. Complementing this, the Coupled Adaptive-patch and Threshold-modulation System (CARS) introduces stochastic multi-seed initialization protocols [26,27], enabling dynamic patch generation through iterative probability optimization against spatially heterogeneous constraint layers.

2.5.1. Land Use Change Simulation

Considering relevant studies and the actual conditions of the region, the study takes into account the relationships between grasslands and environmental and socioeconomic driving factors [28]. Fourteen driving factors were selected, including annual precipitation, annual average temperature, soil type, Normalized Difference Vegetation Index (NDVI), slope, aspect, GDP, population density, and distances to various levels of roads. Land use data spanning from 2000 to 2022 were obtained from Wuhan University’s CLCD. To calibrate and validate the PLUS model, 2005 and 2015 were selected as representative time points based on their decadal interval (balancing computational efficiency and dynamic land use change capture), improved post-2005 data quality, and the need for rigorous validation through a sufficient time gap. Using 2005 as the base-line, the model simulated 2015 land use patterns, which were compared with actual 2015 data, achieving Kappa coefficient of 0.973. A higher Kappa coefficient indicates a higher model accuracy.

2.5.2. Different Scenario Settings Based on the PLUS Model

To predict future land use development directions based on the current status and needs of the study area, three development scenarios were established: the natural development scenario (Scenario 1), the ecological protection scenario (Scenario 2), and the economic priority scenario (Scenario 3).
Natural Development Scenario: Based on the 2005–2015 land use change rate and driving factors, this scenario simulates grassland development under natural conditions without considering policy constraints, serving as the basis for other scenarios [29].
Ecological Protection Scenario: Guided by the ecological restoration concept of “mountains, rivers, forests, fields, lakes, and grasslands,” this scenario restricts the conversion of natural ecological grasslands to other land types and suppresses the expansion of other land types into grasslands. The probability of forest and grassland conversion to construction land is reduced by 50%, and cultivated land conversion to construction land is reduced by 30% [30].
Economic Priority Scenario: Economic growth is the main development mode, increasing the probability of cultivated, forest, and grassland conversion to construction land by an additional 20% over the natural development scenario [31].

3. Results

3.1. Spatiotemporal Evolution of Grassland Type Changes and Ecosystem Service Value

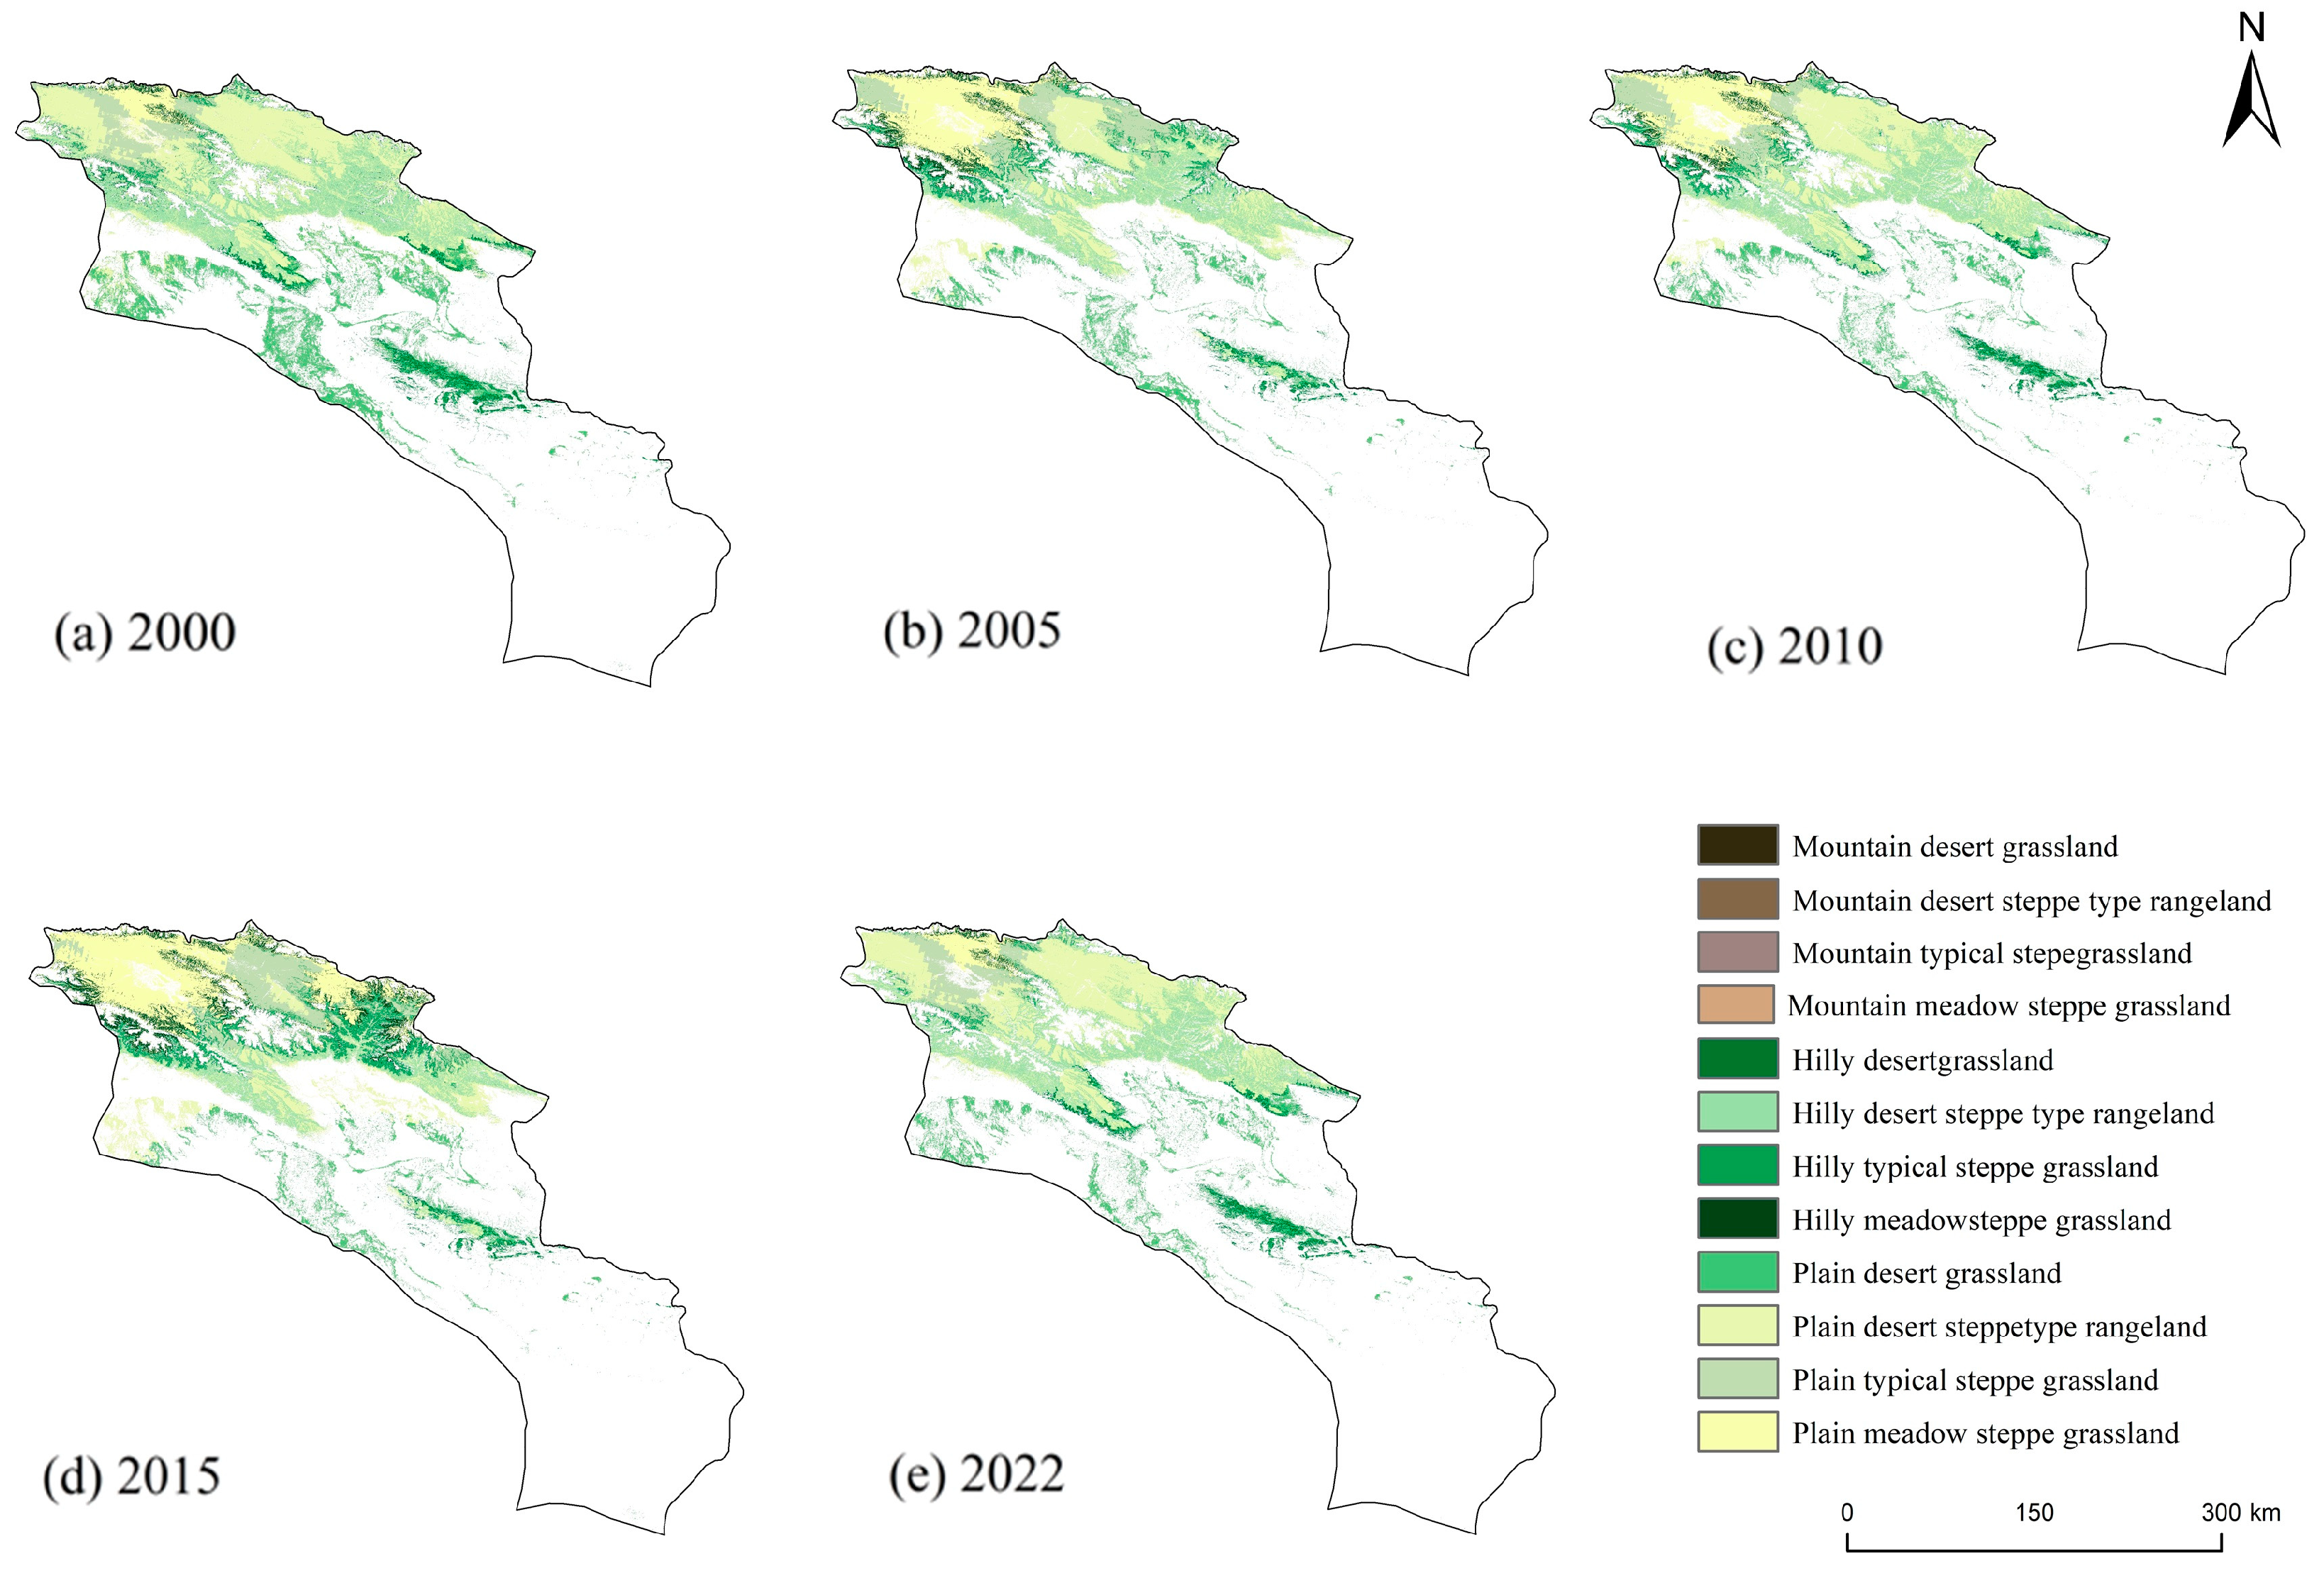
3.1.1. Dynamic Changes in Different Grassland Types

As shown in Figure 3, the grassland area in the Bosten Lake Basin changed significantly from 2000 to 2022, following a northwest–southeast distribution pattern, from mountainous (high) to desert (low) areas. The most significant changes were observed in desert steppe grasslands, meadow grasslands, typical steppe grasslands, and hilly desert steppe grasslands, mainly distributed in the mid–upper basin. Typical steppe grasslands were block-distributed in the upstream Kaidu River Basin; meadow grasslands were located adjacent to the typical steppe grasslands, spreading from northwest to southeast; desert steppe grasslands intermingled with typical steppe grasslands in the east, expanding northeastward. Some desert steppe grasslands were scattered around the Kaikong River Basin, while hilly desert steppe and plain desert steppe grasslands were point-distributed in the mid-basin and expanded southeastward.
According to 22 years of grassland type changes (Table 2) (in order to improve the validity of the analysis and the clarity of the report, we decided to exclude grass types that accounted for less than 1% of the total from the detailed analysis), the main grassland types in the study area are plain desert steppe grassland, hilly desert steppe grassland, plain desert grassland, plain typical prairie grassland and plain meadow grassland, accounting for 80.147%~93.018% of the total grassland area. Hilly desert grassland (Figure 4), hilly typical steppe grassland, and hilly meadow grassland occupy smaller areas, ranging from 6.975% to 19.846% of the total grassland area. The area of each type of grassland shows different trends from 2000 to 2022, as can be seen from Table 3. The rate of change of hilly desert grassland, mountain desert steppe grassland, plain meadow grassland, plain desert steppe grassland, and plain desert steppe grassland, during the period of 2000–2005 were 16.26%, 15.67%, 9.24%, 7.72%, and 3.48%, respectively, in descending order. Indicating an increase in the area of hilly desert grassland, montane desert steppe grassland, plain meadow grassland, plain desert steppe grassland, plain desert steppe grassland, and hilly typical steppe grassland. The rate of change of the remaining grassland types is negative, indicating that the area of mountainous desert grassland, hilly desert steppe grassland, plain typical steppe grassland, mountainous typical steppe grassland, hilly meadow grassland, and mountain meadow grassland is decreased to different degrees. In comparison, the area of plain desert grassland, hilly desert grassland and mountainous desert steppe grassland continued to increase between 2005 and 2010, while the rate of change of plain desert steppe grassland, hilly typical steppe grassland, and plain meadow grassland became −23.06%, −28.97%, and −14.75%, and the amount of change of their area was −132,856 hm2, −37,679 hm2, and −25 hm2, respectively. The area of mountain desert grassland, plain typical grassland meadow grassland, and mountain meadow grassland showed a decreasing trend, whereas the area of hilly desert steppe grassland, mountain typical steppe grassland, and hilly meadow grassland showed an increasing trend, as the rate of change was 92.04%, 181.09%, and 50.94%, respectively, during the period 2010–2015. Plain desert steppe grassland, plain typical steppe grassland, hilly typical steppe grassland, and mountainous desert grassland showed the most significant increase in the amount of change in that they were 445,452 hm2, 193,205 hm2, 176,649 hm2, and 144,551 hm2, respectively, and those that showed a significant reduction in the amount of change were hilly desert grassland—382,542 hm2, mountainous desert steppe grassland—33,454,549 hm2, plain desert grassland—169,041 hm2, and hilly desert steppe grassland—509,917 hm2. The area of hilly desert grassland increased by 711,378 hm2 and the area of plain desert steppe grassland decreased by 769,790 hm2 during the period 2015–2022 compared to 2015. This coincides with the overall ecological situation of grasslands in the whole territory, and the area of grassland degradation is obviously smaller than the area of grassland restoration and improvement. Over the span of 22 years, the Bosten Lake Basin witnessed varying trends in its grassland areas. There was a pattern of fluctuating expansion observed in the plain desert, hilly desert, hilly desert steppe, mountain desert steppe, and mountain typical steppe grasslands. Conversely, mountain desert, plain desert steppe, plain typical steppe, hilly typical steppe, plain meadow, hilly meadow, and mountain meadow grasslands experienced a reduction in their respective areas.

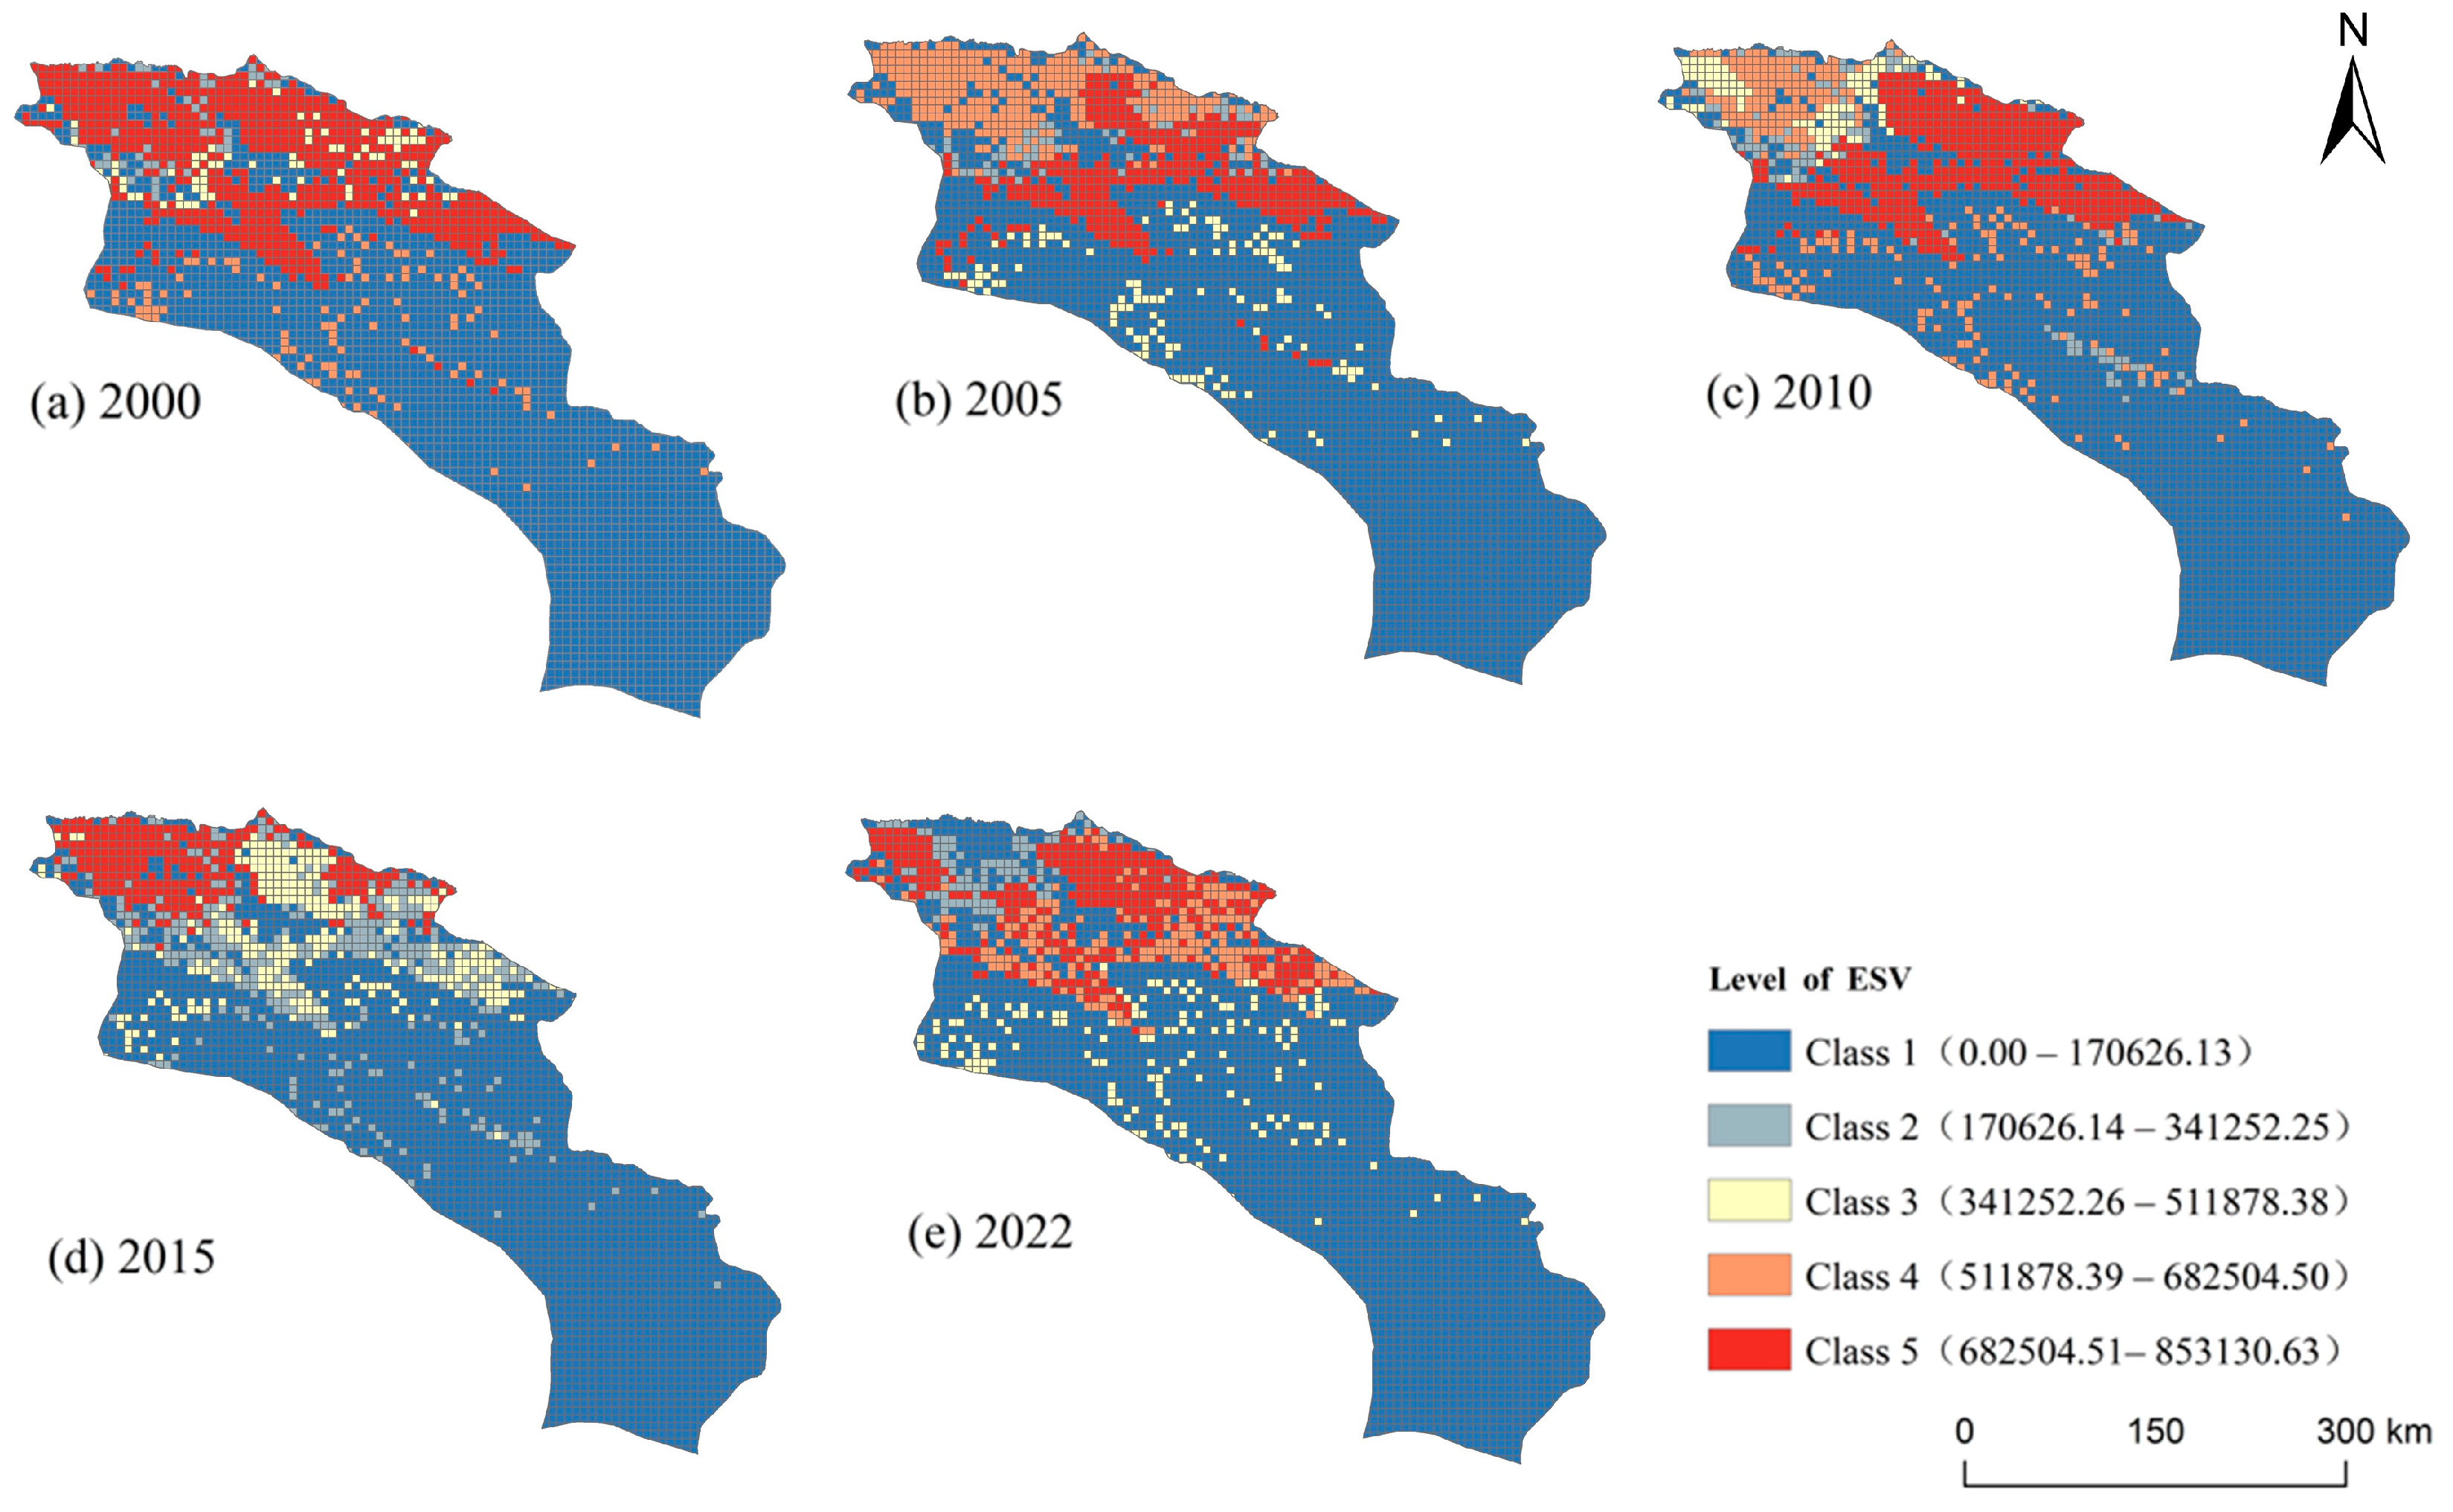
3.1.2. Dynamic Changes in the Value of Grassland Ecosystem Services

The spatial heterogeneity of ecosystem service value (ESV) in the study area demonstrates distinct regional clustering (Figure 5). Core high-value ESV zones predominantly occur in western, northern, and northeastern sectors, while the southern region remained stable due to its desert landscape with inherently low ESV. This spatial pattern aligns closely with demographic distributions and geomorphological features, where elevated terrain and superior vegetation coverage in western, northern, and northeastern areas sustain higher ecological service capacities. Temporal analysis from 2000 to 2022 reveals three key trends: contraction of core high-value zones, expansion of sub-high-value areas, and progressive diminishment of low-value territories. The overall ESV exhibited marginal decline, primarily attributable to grassland type conversions. Notably, the ecological service provision per unit area varies substantially across different grassland ecosystems.
The changes in ESV in the Bosten Lake Basin grasslands from 2000 to 2022 were significant (Table 4). Between 2000 and 2005, the total ESV of the study area’s grassland ecosystem increased by 1.9306 × 10⁸ CNY, with a growth rate of 0.44%. Notably, the ESV of plain desert grassland, plain meadow grassland, plain desert steppe grassland, and hilly desert steppe grassland increased significantly by 4.1113 × 10⁸ CNY, 2.6373 × 10⁸ CNY, 13.8704 × 10⁸ CNY, and 11.3744 × 10⁸ CNY, respectively. From 2005 to 2010, the ESV continued to rise, increasing by 5.6144 × 10⁸ CNY, a 1.27% growth compared to 2005, with notable increases in the ESV of plain desert steppe grassland and mountain typical steppe grassland, reaching 227.098 × 10⁸ CNY and 125.844 × 10⁸ CNY, respectively. However, between 2010 and 2015, the ESV experienced a fluctuating downward trend, with plain desert steppe grassland showing the most significant decline, decreasing by 521.190 × 10⁸ CNY compared to 2010. Between 2015 and 2022, the ESV declined at a slower pace, decreasing by 38.028 × 10⁸ CNY, representing a reduction of 0.87%. Significant changes were observed in mountain meadow grassland, hilly meadow grassland, plain meadow grassland, and hilly typical steppe grassland, with change rates of −2714.29%, −965.795%, −647.16%, and −401.59%, respectively.

3.2. Changes in Grassland Types and Ecosystem Services Under the PLUS Model

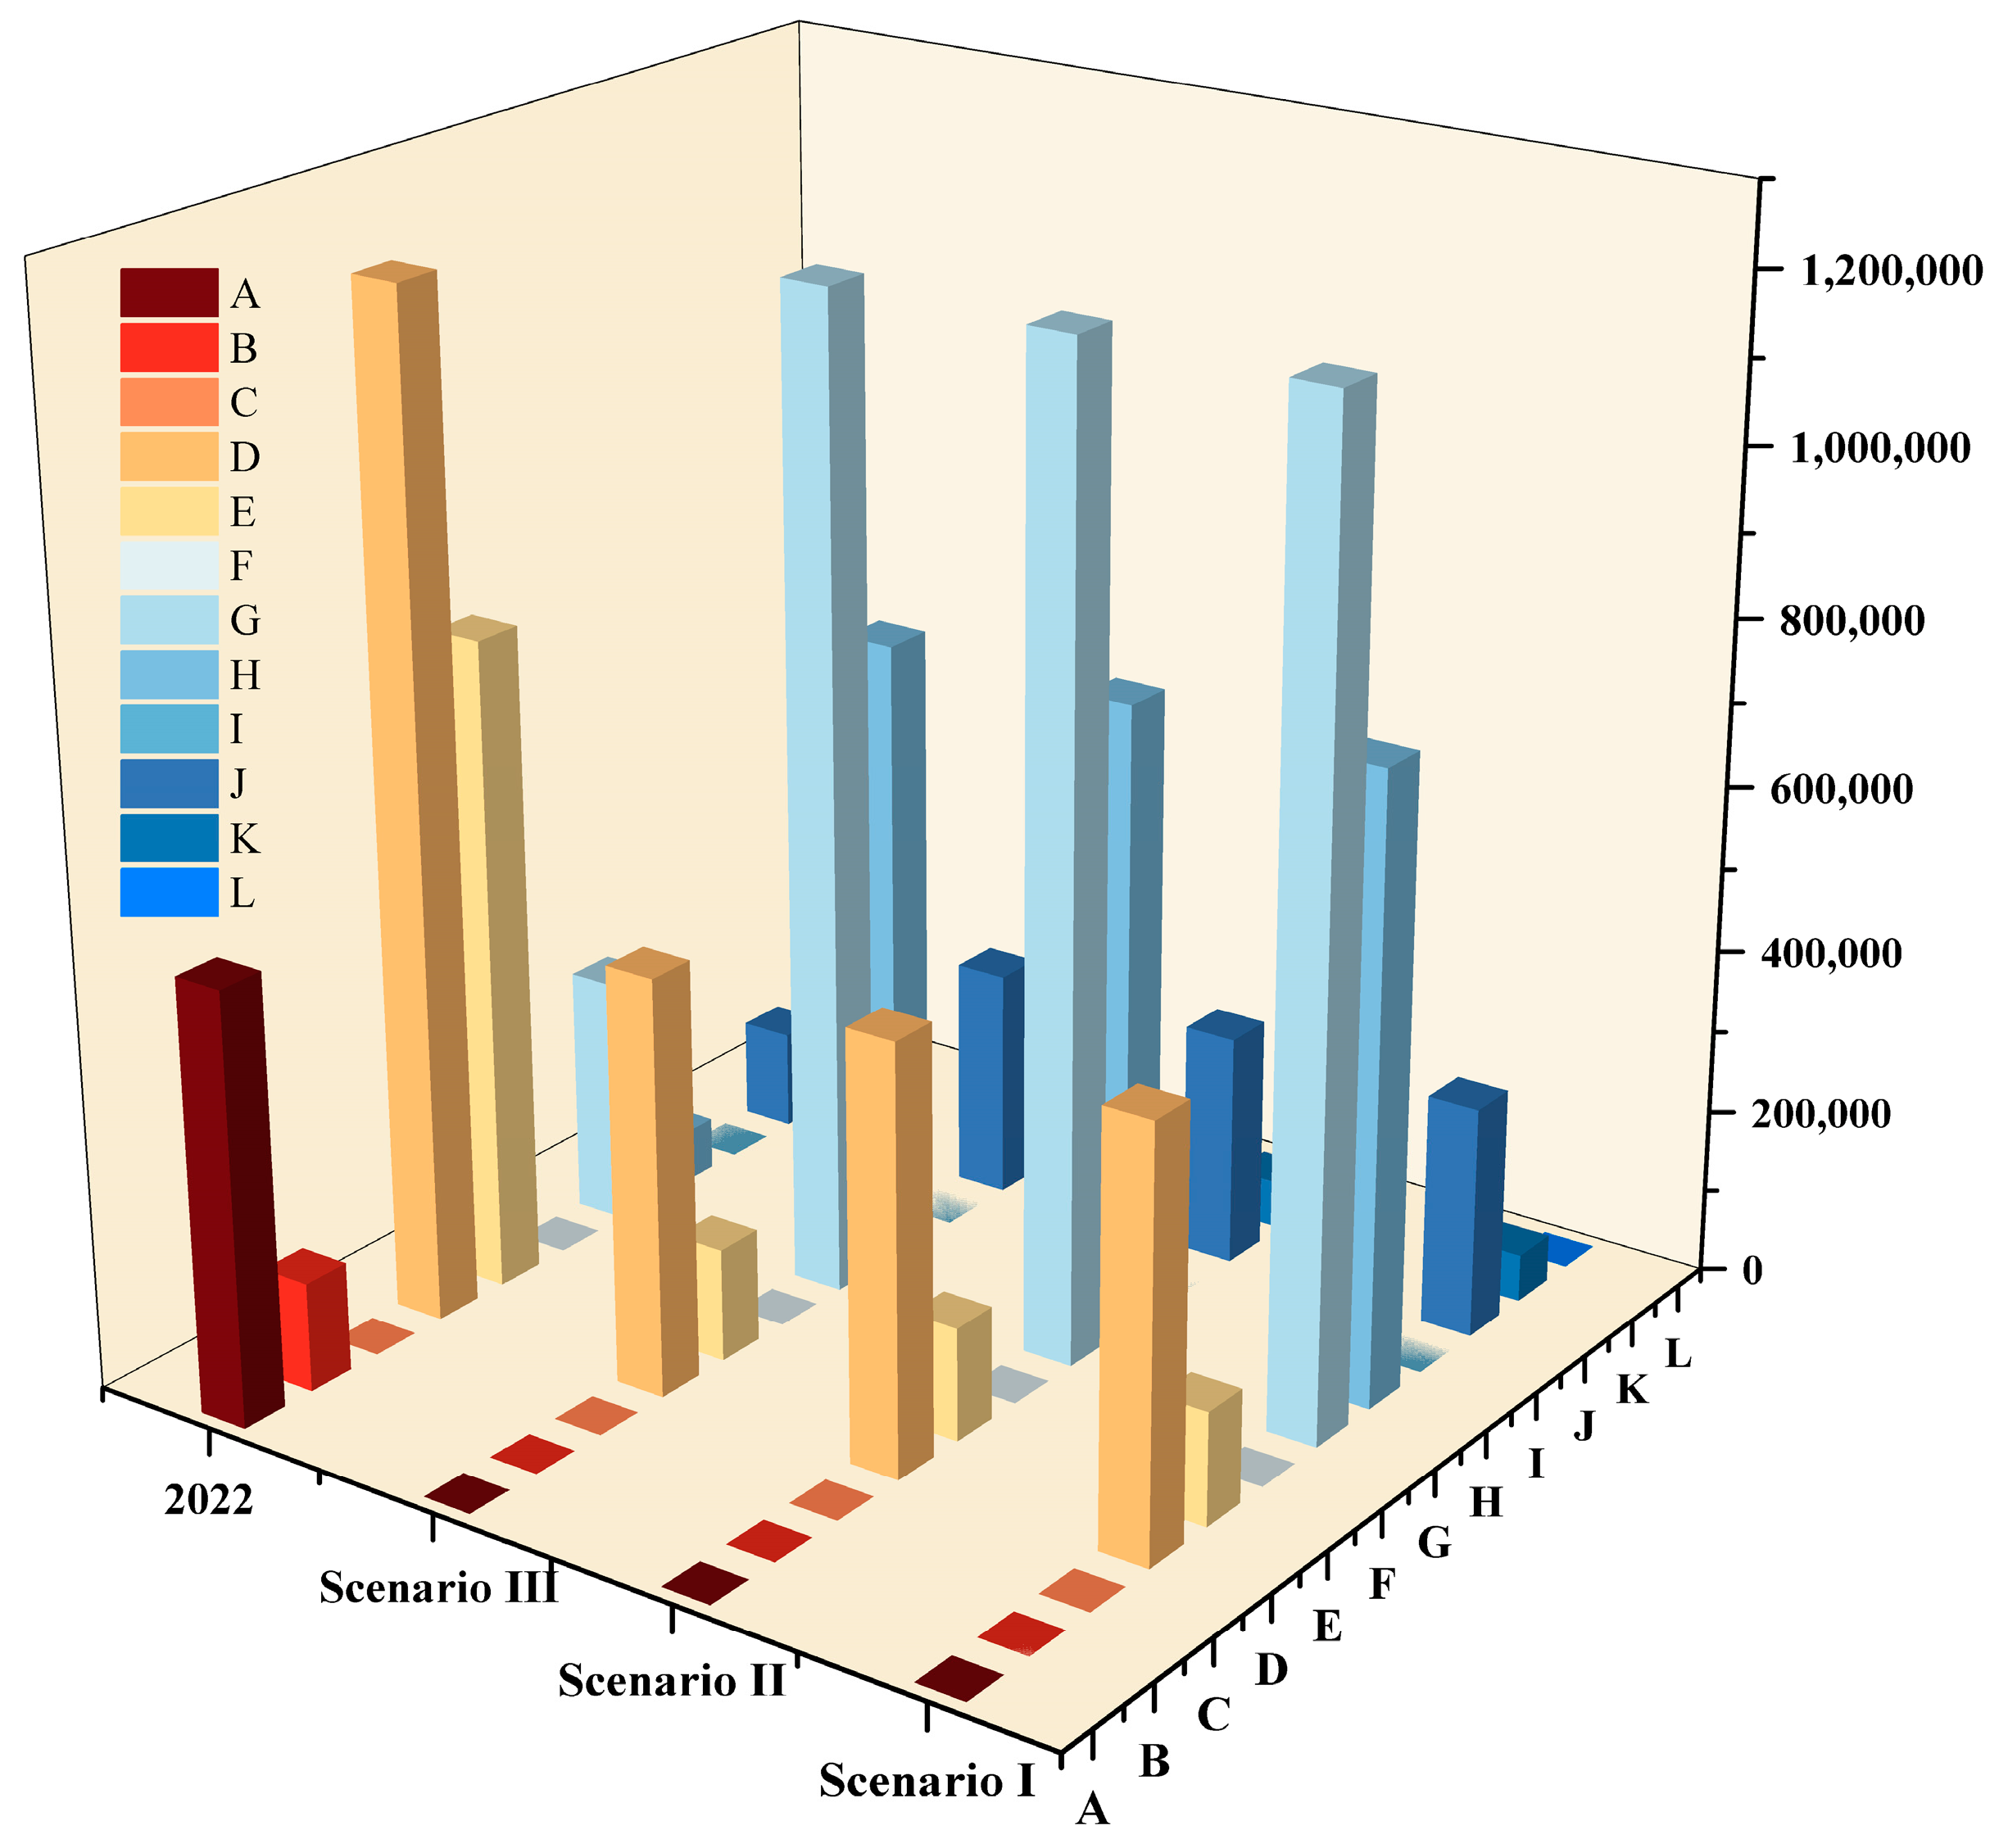
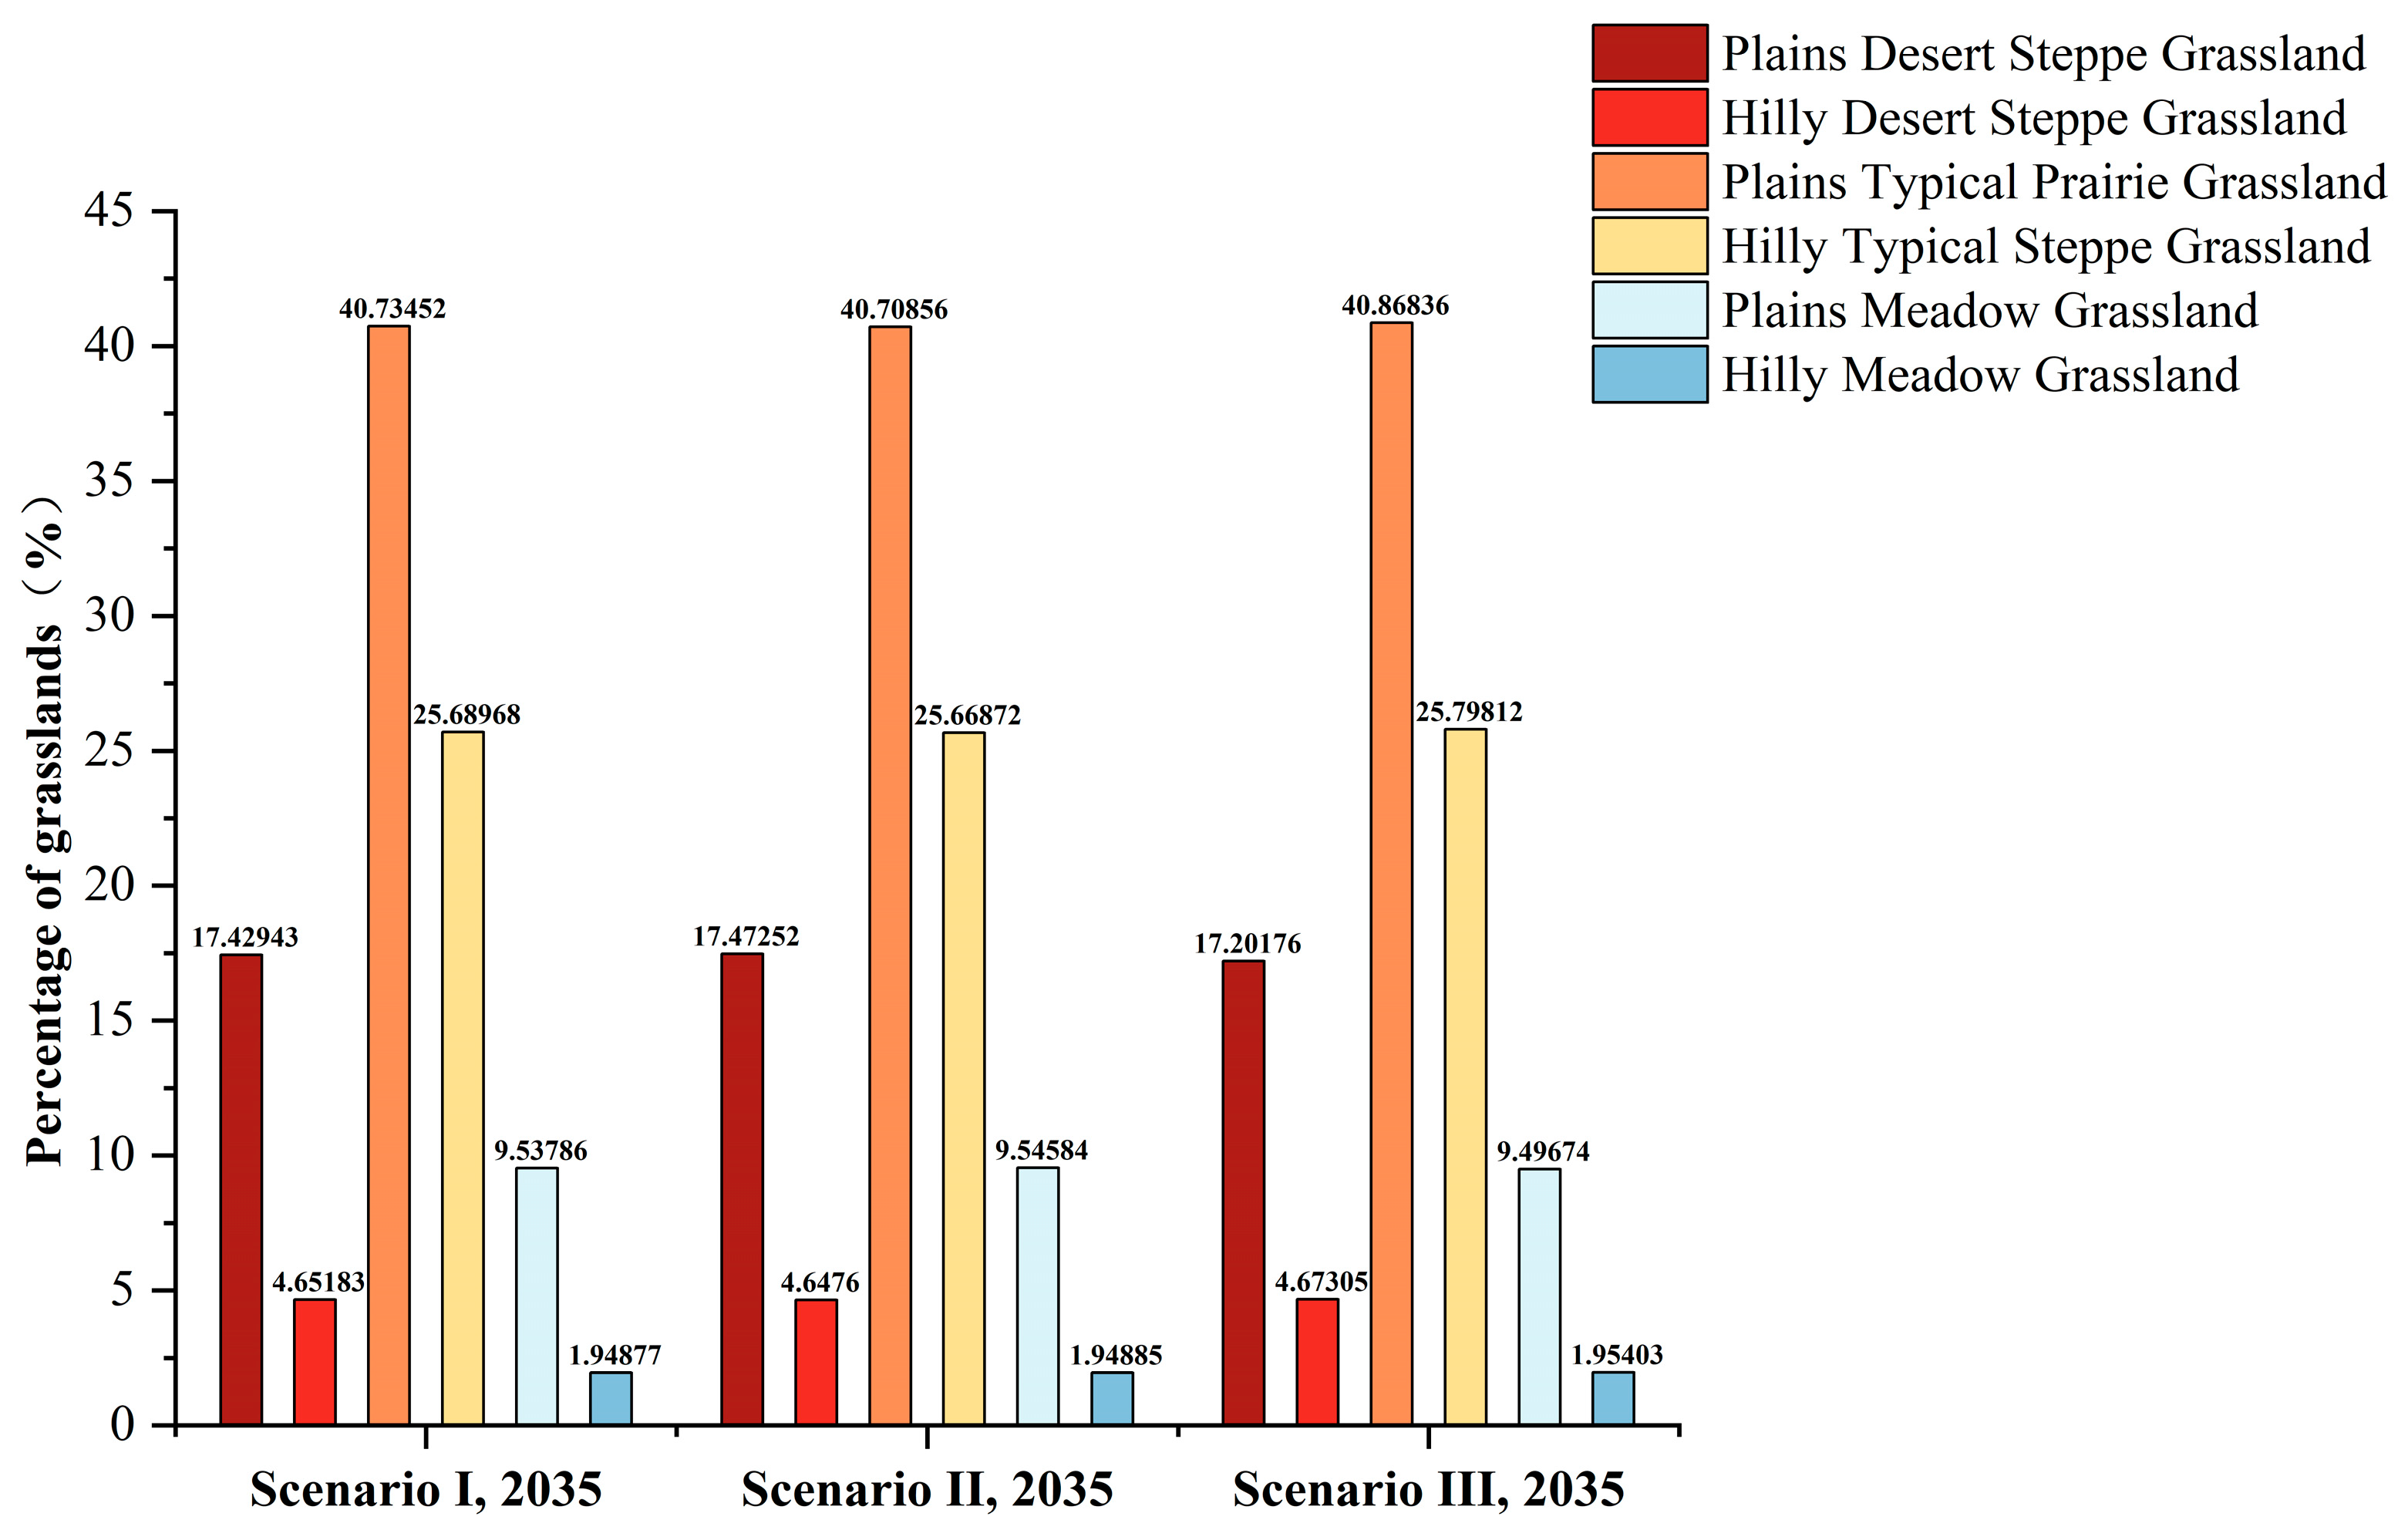
3.2.1. Simulation of Grassland Type Changes Under Multiple Scenarios

Utilizing land use data from 2005 and 2015 in the study area, the Markov chain model was employed to project 2035 land cover patterns through spatiotemporal transition probability analysis. Based on previous research, relevant parameters of the module were adjusted to simulate the land use data of Bosten Lake under multiple scenarios for 2035. These data were imported into ArcGIS 10.8 (Environmental Systems Research Institute, Redlands, CA, USA), where grassland types were extracted, reclassified, and their areas calculated (Table 5, Figure 6).
The simulation results of grassland type changes under different scenarios for 2035 indicate that compared to 2022, frequent transitions occur among different grassland types in the Bosten Lake Basin, with notable variations. The transitions primarily occur among plain desert grassland, plain desert steppe grassland, plain typical steppe grassland, plain meadow grassland, hilly desert grassland, hilly desert steppe grassland, hilly typical steppe grassland, and hilly meadow grassland. However, differences between the three scenarios are minimal due to the delayed effects of grassland ecological protection policies. Policy interventions including grazing restrictions, ecological conservation subsidies, and optimized land tenure systems have enhanced ecological sustainability in regional grassland ecosystems.
Under the natural development scenario, there is a noticeable expansion of plain typical steppe grassland (1,199,251 ha), hilly typical steppe grassland (756,321 ha), plain meadow grassland (280,801 ha), and hilly meadow grassland (57,373 ha). Conversely, the area of plain desert grassland (29 ha), hilly desert grassland (11 ha), plain desert steppe grassland (513,134 ha), and hilly desert steppe grassland (136,953 ha) decreases significantly, with plain desert steppe grassland experiencing the most substantial reduction of 710,372.62 ha compared to 2022.
Under the ecological protection scenario, the area of plain typical steppe grassland reaches its maximum at 1,199,562 ha, followed by hilly typical steppe grassland, plain desert steppe grassland, and other types. In contrast, under the economic development scenario, the overall grassland area decreases by 246,255.02 ha compared to 2022.
In terms of spatial distribution (Figure 7 and Figure 8), the spatial distribution of grassland in the natural development scenario continues the spatial distribution pattern in 2022, and under the ecological protection scenario, the area ranges of plain desert steppe grassland and hilly desert steppe grassland continue to increase. There is a shift from hilly desert steppe grassland to hilly typical steppe grassland, and the plain desert steppe grassland is shifted to plain typical steppe grassland. The unutilized land under the scenario continues to undergo development and utilization, which greatly increases the probability that it will be transformed to grassland, and therefore, the area of plain desert steppe grassland and hilly desert steppe grassland increases significantly in 2035. Under the economic priority scenario, the area of plain typical steppe grassland and hilly typical steppe grassland expands, with plain typical steppe grassland having a larger spatial–temporal distribution pattern, which is due to the fact that this grassland type is the one with the largest percentage of area in the study area.

3.2.2. Characterizing Changes in the Value of Grassland Ecosystem Services Under Multiple Scenarios

Based on the changes in the ecosystem service value (ESV) of various grassland types in the Bosten Lake Basin under three different scenarios (Table 6), the ESV of the study area in 2022 was 432.7874 × 10⁸ CNY. In comparison, the ESVs of all three projected scenarios decreased due to socioeconomic development, urbanization, and intensified human activities, which led to the continuous expansion of construction land and the encroachment on ecological land, resulting in severe grassland degradation. Under all three scenarios, the ESV of mountain meadow grasslands was zero due to the complete loss of this grassland type.
In the natural development scenario, the ESV of typical grasslands in the plains was the highest, reaching 1,633.905 × 108 CNY followed by typical grasslands in hilly areas at 103.0440 × 10⁸ CNY, while the ESV of typical grasslands in mountainous areas was the lowest, at 0.0003 × 10⁸ CNY. This scenario performed better in the plains due to their relatively stable climatic conditions, fertile soils, and accessibility to water resources, which support better grassland productivity compared to hilly and mountainous regions. Compared to the natural development and economic priority scenarios, the ESV of grasslands under the ecological protection scenario was the highest, reaching 401.4706 × 10⁸ CNY, owing to the positive effects of ecological restoration projects, which resulted in grassland expansion and reduced human disturbances.
Under the economic priority scenario, the ESV of grasslands showed the most significant decline compared to 2022. The ESV of plain desert grasslands and hilly desert grasslands decreased by 71.3467 × 10⁸ CNY and 18.0277 × 10⁸ CNY, respectively. The ESVs of hilly desert steppe grasslands (186.587 × 10⁸ CNY), mountain typical steppe grasslands (0.0003 × 10⁸ CNY), plain desert steppe grasslands (70.1470 × 10⁸ CNY), mountain desert grasslands (0.068 × 10⁸ CNY), and mountain desert steppe grasslands (0.192 × 10⁸ CNY) all exhibited a declining trend, with reduction rates of 4.77%, 2.96%, 1.43%, 0.16%, and 0.11%, respectively. In contrast, the ESVs of hilly typical steppe grasslands, plain typical steppe grasslands, plain meadow grasslands, and hilly meadow grasslands showed a slight upward trend. This phenomenon suggests that to promote economic development, social activities have further encroached on ecological land such as grasslands, forests, and water bodies, leading to an overall decline in ESV compared to 2022, indicating that socioeconomic development has a suppressive effect on grassland ESV.
According to the spatial distribution of grassland ESV under different scenarios (Figure 9), the number of ESV grid cells in all three scenarios significantly decreased compared to 2022. Except for the northern region, where ESVs changed, the remaining areas maintained the development trend observed in 2022. Under the natural development scenario, the ESV in the northern part of the study area shifted from a high-value region to a medium-value region, while medium-value areas transitioned to high-value areas. The spatial distribution of ESV under the ecological protection and economic priority scenarios exhibited similar trends to the natural development scenario, indicating that the spatial changes in grassland ESV were influenced by changes in grassland types.

4. Discussion

The Comprehensive Sequential Classification of Grasslands (CSCS) is based on bioclimatic conditions as an indicator of grassland type, as it is the essential condition for organisms to establish themselves in grasslands, and it is also the most stabilizing factor in the process of grassland occurrence and development [32]. On the basis of grassland class, topographic conditions are used as subclass indicators for further division, and topography plays an important role in the redistribution of hydrothermal conditions [33]. Changes in hydrothermal conditions due to topography are the key factors causing changes in the vegetation of grassland subclasses, which have a certain degree of stability [34]. The degree of relief is a reflection of the nature of grassland subclasses in the study area, and it also predicts the future development direction of grassland. The meteorological stations in Bosten Lake Basin are fewer and unevenly distributed, and the geomorphology is complicated, so there are certain errors in interpolating the meteorological data alone. The topography of the study area shows a large degree of local topographic relief, but the overall topography is relatively gentle; the difference in the degree of topographic relief is relatively small, and most of them are plains and hills [35]. Referring to the previous studies, this paper divided the terrain undulation degree into three types of plains, hills and mountains, and divided these into the corresponding grass subclasses. Among these, the area of mountain grass subclasses was small, especially mountain typical grassland meadow and mountain meadow grass, the area of which was only 7.92 hm2 and 0.63 hm2 in 2022, which made the comparison of mountain grass subclasses in this study not obvious. The classification of mountain grassland subclasses in this study area needs to be further improved. In addition, different geomorphologic types have different results due to the different complexity of geomorphologic morphology, geomorphologic camping force, and developmental stage, and the classification of grassland subclasses in this study is still insufficient and needs to be further explored and improved.
Clarifying the change rules and key factors of grassland utilization is the basis for rational planning and utilization of grassland resources. The PLUS model has the advantage of land expansion analysis strategy, combined with the CA model based on multi-class stochastic patch seed, which fully excavates the driving factors of changes in the type of grassland utilization, based on which the future changes are simulated. Through the comparative analysis of different scenarios of future development, the conclusions can provide the relevant departments with a reference basis for grassland utilization and conservation [36]. The PLUS model was used to simulate and predict the future changes in grassland utilization, and the results showed that the grassland area of the natural development scenario, the ecological protection scenario, and the economic priority scenario in 2035 in the study area was smaller than the grassland area in 2022. The trend of change was consistent; under the natural development scenario, the area of plain desert grassland meadow was significantly reduced, with a total reduction of 710372.62 hm2, and the areas of typical grassland meadow in the plains and the hills were increased significantly, with an increase of 900326.08 hm2 and 692326.23 hm2, respectively. The area of plain typical steppe grassland and hills typical steppe grassland increased significantly, increasing 900326.08 hm2 and 692326.23 hm2, respectively. Under the ecological conservation scenario, plain typical steppe grassland becomes the grassland type with the largest area of 1,199,562 hm2. Under the economic development scenario, the area of plain typical prairie grassland has the largest variation, which is 300.63%. This study refers to the previous studies and makes relevant improvements when setting the model parameters, and the simulation prediction result is that the difference in the area of each grassland type under different scenarios in 2035 is relatively small. For this reason, there are certain limitations in this paper, and it is necessary to further strengthen the setting of the research model’s prediction in the future, particularly in light of climate change and the increasing pressures on ecosystems. To enhance the discriminative power and applicability of our predictions, we suggest the following measures for future research: Firstly, incorporate a wider range of influencing factors such as land use changes, technological advancements, and policy shifts to improve the model’s sensitivity and predictive capabilities. Secondly, employ time-series analysis to capture the temporal trends in ecosystem service values and integrate multiple climate change scenarios and ecosystem stress tests to enhance the accuracy and reliability of the predictions. Under the influence of global warming, the temperature of Bosten Lake Basin has risen, the glacier snow has melted, and water resources are abundant; due to the accelerated development of agricultural production, arable land has been irrigated by surface water and groundwater resources, and the irrigated area has been expanded and is continuously expanding to forests, grasslands, and unutilized land, with the grassland area shrinking by a larger margin [37,38].
The essence of land use lies in comprehending the intricate “human–land relationship,” and the transformation of land use patterns serves as a fundamental approach to grasp this relationship, which is also a key prerequisite for achieving harmonious development [39]. Human endeavors have a profound influence on land use shifts. As urbanization accelerates, the economic level within the study region is on the rise, leading to a marked expansion in construction land. Consequently, the spatial layout of land use has undergone significant alterations [40]. Extensive grassland areas have been diminished, with a loss of 42,087.51 hectares in 2022. Moreover, population growth is a direct driver of land use pattern shifts, imposing dual demands for housing and sustenance [41]. This necessitates the continuous exploitation and conversion of other land types into residential and agricultural areas to satisfy human needs. The excessive exploitation of natural resources by humans has resulted in the continuous growth of farmland and built-up areas, while grasslands are reducing [42]. This trend will significantly impact future land use and ecological conservation scenarios. In a scenario where the grassland area remains below current levels, the land use trends observed in the study area over the past 22 years are likely to persist, with grasslands, forested areas, watersheds, unused land, and saline-alkali land decreasing, while cultivated land, construction land, deserts, and wetlands expand. Hence, it is crucial to focus on the influence of human activities on land use, delve into the interconnection between the two, and promote rational land use through regulating and limiting human actions.

5. Conclusions

This study classified grassland types in the Bosten Lake Basin and estimated their ecosystem service value. The PLUS model was used to predict grassland utilization and ESV changes under three future scenarios: natural development, ecological protection, and economic priority by 2035. The key findings are as follows:
  • From 2000 to 2022, the overall grassland area in the Bosten Lake Basin showed a declining trend. Analysis by grassland type revealed a pattern of “six increases and six decreases”. Increases were observed in plain desert steppe grasslands, hilly desert steppe grasslands, plain desert grasslands, hilly desert grasslands, mountain desert grasslands, and mountain desert steppe grasslands. Decreases were observed in plain meadow grasslands, plain typical steppe grasslands, hilly typical steppe grasslands, hilly meadow grasslands, mountain meadow grasslands, and mountain typical steppe grasslands.
  • Grassland ESV demonstrated marginal fluctuations during the 22-year observation period, characterized by an initial decade of growth (2000–2010) succeeded by progressive decline through subsequent phases (2010–2022). Geospatial analysis revealed concentrated high-value clusters along the western, northern, and northeastern peripheries of the research basin.
  • Compared to 2022, grassland degradation and area reduction were evident across all three future scenarios, with the primary conversions occurring among plain and hilly grassland types. The natural development scenario yielded the highest ESV for plain typical steppe grasslands; the economic priority scenario showed the greatest ESV decline compared to 2022, whereas the ecological protection scenario resulted in the highest ESV values overall.

Author Contributions

Z.Z. (Zhichao Zhang) and Z.L. contributed to the formulation of the research questions; Z.Z. (Zhichao Zhang) performed the data analysis and paper writing; Z.Z. (Zhen Zhu) was responsible for data processing and interpretation of the results. Y.W. managed the project and funded this paper. All authors have read and agreed to the published version of the manuscript.

Funding

Key Research and Development Program for Special Projects of Xinjiang Uygur Autonomous Region (Grant No. 20232115765).

Institutional Review Board Statement

Not applicable.

Informed Consent Statement

Not applicable.

Data Availability Statement

The data presented in this study are available on request from the corresponding author.

Conflicts of Interest

The authors declare no conflicts of interest.

References

  1. Li, T.; Cui, L.Z.; Lv, W.C.; Song, X.; Cui, X.; Tang, L. Exploring the frontiers of sustainable livelihoods research within grassland ecosystem: A scien-tometric analysis. Heliyon 2022, 8, e10704. [Google Scholar] [CrossRef] [PubMed]
  2. Bardgett, R.D.; Bullock, J.M.; Lavorel, S.; Manning, P.; Schaffner, U.; Ostle, N.; Chomel, M.; Durigan, G.; Fry, E.L.; Johnson, D.; et al. Combatting global grassland degradation. Nat. Rev. Earth Environ. 2021, 2, 720–735. [Google Scholar] [CrossRef]
  3. Grange, G.; Finn, J.A.; Brophy, C. Plant diversity enhanced yield and mitigated drought impacts in intensively managed grassland communities. J. Appl. Ecol. 2021, 58, 1864–1875. [Google Scholar] [CrossRef]
  4. He, M.; Pan, Y.; Zhou, G.; Barry, K.E.; Fu, Y.; Zhou, X. Grazing and global change factors differentially affect biodiversity-ecosystem functioning relationships in grassland ecosystems. Glob. Change Biol. 2022, 28, 5492–5504. [Google Scholar] [CrossRef] [PubMed]
  5. Zhu, X.; Zheng, J.; An, Y.; Xin, X.; Xu, D.; Yan, R.; Xu, L.; Shen, B.; Hou, L. Grassland Ecosystem Progress: A Review and Bibliometric Analysis Based on Research Pub-lication over the Last Three Decades. Agronomy 2023, 13, 614. [Google Scholar] [CrossRef]
  6. Maestre, F.T.; Le Bagousse-Pinguet, Y.; Delgado-Baquerizo, M.; Eldridge, D.J.; Saiz, H.; Berdugo, M.; Gozalo, B.; Ochoa, V.; Guirado, E.; García-Gómez, M.; et al. Grazing and ecosystem service delivery in global drylands. Science 2022, 378, 915–920. [Google Scholar] [CrossRef]
  7. Wang, C. A Remote Sensing Perspective of Alpine Grasslands on the Tibetan Plateau: Better or Worse Under “Tibet Warming”? Remote Sens. Appl. Soc. Environ. 2016, 3, 36–44. [Google Scholar] [CrossRef]
  8. Li, W.; Xue, P.; Liu, C.; Yan, H.; Zhu, G.; Cao, Y. Monitoring and Landscape Dynamic Analysis of Alpine Wetland Area Based on Multiple Algorithms: A Case Study of Zoige Plateau. Sensors 2020, 20, 7315. [Google Scholar] [CrossRef] [PubMed]
  9. Kong, B.; Yu, H.; Du, R.; Wang, Q. Quantitative Estimation of Biomass of Alpine Grasslands Using Hyperspectral Remote Sensing. Rangel. Ecol. Manag. 2019, 72, 336–346. [Google Scholar] [CrossRef]
  10. Dehghan-Shoar, M.H.; Pullanagari, R.R.; Kereszturi, G.; Orsi, A.A.; Yule, I.J.; Hanly, J. A Unified Physically Based Method for Monitoring Grassland Nitrogen Concentration with Landsat 7, Landsat 8, and Sentinel-2 Satellite Data. Remote Sens. 2023, 15, 2491. [Google Scholar] [CrossRef]
  11. Lu, Q.; Hua, D.; Li, Y.; Wang, D. Estimation of Water Resource Ecosystem Service Value inTarim River Basin—From a Full Value Chain Perspective. Water 2022, 14, 2355. [Google Scholar] [CrossRef]
  12. Ma, Q.; He, S.; Jing, H.; Wang, W.; Zhang, S.; Liang, X. Spatiotemporal Evolution and PLUS Simulation Prediction of Ecosystem Service Value in the Southern Jiangsu Urban Agglomeration Based on Land Use Changes. Appl. Sci. 2024, 15, 195. [Google Scholar] [CrossRef]
  13. Zhang, Y.; Su, T.; Ma, Y.; Wang, Y.; Wang, W.; Zha, N.; Shao, M. Forest ecosystem service functions and their associations with landscape patterns in Renqiu City. PLoS ONE 2022, 17, e0265015. [Google Scholar] [CrossRef]
  14. Huang, Z.; Xu, J.; Zheng, L. Long-Term Change of Lake Water Storage and Its Response to Climate Change for Typical Lakes in Arid Xinjiang, China. Water 2023, 15, 1444. [Google Scholar] [CrossRef]
  15. Yang, J.; Huang, X. The 30 m annual land cover dataset and its dynamics in China from 1990 to 2019. Earth Syst. Sci. Data 2021, 13, 3907–3925. [Google Scholar] [CrossRef]
  16. Ren, J.Z.; Hu, Z.Z.; Zhao, J.; Zhang, D.G.; Hou, F.J.; Lin, H.L.; Mu, X.D. A grassland classification system and its application in China. Rangel. J. 2008, 30, 199–209. [Google Scholar] [CrossRef]
  17. Wu, J.; Li, C.; Hu, Z.; Zhang, D.; Liu, X.; Shen, Z. Comprehensive and sequential classification system of grasslands in Gansu province based on remote sensing. Trans. Chin. Soc. Agric. Eng. 2013, 29, 126–133. [Google Scholar]
  18. Lin, H.; Zhao, Y.; Kalhoro, G.M. Ecological Response of the Subsidy and Incentive System for Grassland Conservation in China. Land 2022, 11, 358. [Google Scholar] [CrossRef]
  19. Han, T.D.; Ye, B.S.; Jiao, K.Q. Temperature variations in the southern and northern slopes of Mt. Tianger in the Tianshan Mountains. J. Glaciol. Geocryol. 2002, 24, 567–570. [Google Scholar]
  20. Wu, X.; Zhang, L.; Gao, L.; Li, Y.; Liu, X. Change and Tradeoff/Synergy Analysis of Watershed Ecosystem Services: A Case Study of Qinghai Lake Basin. Sustainability 2023, 15, 11711. [Google Scholar] [CrossRef]
  21. Xie, G.D.; Zhang, C.X.; Zhen, L.M.; Chen, W.H.; Li, S.M. Dynamic changes in the value of China’s ecosystem services–Sci-enceDirect. J. Ecosyst. Serv. 2017, 26, 146–154. [Google Scholar] [CrossRef]
  22. Liang, X.; Guan, Q.; Clarke, K.C.; Liu, S.; Wang, B.; Yao, Y. Understanding the drivers of sustainable land expansion using a patch-generating land use simulation (PLUS) model: A case study in Wuhan, China. Comput. Environ. Urban Syst. 2021, 85, 101569. [Google Scholar] [CrossRef]
  23. Wang, G.; Zhao, Q.; Jia, W. Spatio-Temporal Differentiation and Driving Factors of Land Use and Habitat Quality in Lu’an City, China. Land 2024, 13, 789. [Google Scholar] [CrossRef]
  24. Li, P.; Chen, J.; Li, Y.; Wu, W. Using the InVEST-PLUS model to predict and analyze the pattern of ecosystem carbon storage in Liaoning Province, China. Remote Sens. 2023, 15, 4050. [Google Scholar] [CrossRef]
  25. Shi, M.; Wu, H.; Fan, X.; Jia, H.; Dong, T.; He, P.; Baqa, M.F.; Jiang, P. Trade-offs and synergies of multiple ecosystem services for different land use scenarios in the yili river valley, China. Sustainability 2021, 13, 1577. [Google Scholar] [CrossRef]
  26. Chen, Z.; Gao, X.; Liu, Z.; Chen, K. Spatiotemporal Variation of Soil Erosion Characteristics in the Qinghai Lake Basin Based on the InVEST Model. Int. J. Environ. Res. Public Health 2023, 20, 4728. [Google Scholar] [CrossRef]
  27. Jin, Y.; Li, A.; Bian, J.; Nan, X.; Lei, G. Modeling the Impact of Investment and National Planning Policies on Future Land Use Development: A Case Study for Myanmar. ISPRS Int. J. Geo-Inf. 2023, 12, 22. [Google Scholar] [CrossRef]
  28. Kerdan, I.G.; Giarola, S.; Skinner, E.; Tuleu, M.; Hawkes, A. Modelling Future Agricultural Mechanisation of Major Crops in China: An Assessment of Energy Demand, Land Use and Emissions. Energies 2020, 13, 6636. [Google Scholar] [CrossRef]
  29. Deng, Y.; Chen, H.; Hai, Y. Land Use Changes and Future Land Use Scenario Simulations of the China–Pakistan Economic Corridor under the Belt and Road Initiative. Sustainability 2024, 16, 8842. [Google Scholar] [CrossRef]
  30. Zhan, Q.; Yu, H. Study on Optimization of Land Use Structure in Fujian Province Based on Low-Carbon Perspective. Land 2024, 13, 1410. [Google Scholar] [CrossRef]
  31. Zhu, S.; Zhao, Y.; Huang, J.; Wang, S. Analysis of Spatial-Temporal Differentiation and Influencing Factors of Ecosystem Services in Resource-Based Cities in Semiarid Regions. Remote Sens. 2023, 15, 871. [Google Scholar] [CrossRef]
  32. Zhu, X.; Wang, Z.; Gu, T.; Zhang, Y. Multi–Scenario Prediction of Land Cover Changes and Habitat Quality Based on the FLUS–InVEST Model in Beijing. Land 2024, 13, 1163. [Google Scholar] [CrossRef]
  33. Zhang, S.; Wang, Y.; Wang, Y.; Li, Z.; Hou, Y. Spatiotemporal Evolution and Influencing Mechanisms of Ecosystem Service Value in the Tarim River Basin, Northwest China. Remote Sens. 2023, 15, 591. [Google Scholar] [CrossRef]
  34. Alemayehu, B.; Suarez-Minguez, J.; Rosette, J. The Implications of Plantation Forest-Driven Land Use/Land Cover Changes for Ecosystem Service Values in the Northwestern Highlands of Ethiopia. Remote Sens. 2024, 16, 4159. [Google Scholar] [CrossRef]
  35. Zhang, Z.; Han, L.; Feng, Z.; Zhou, J.; Wang, S.; Wang, X.; Fan, J. Estimating the Past and Future Trajectory of LUCC on Wetland Ecosystem Service Values in the Yellow River Delta Region of China. Sustainability 2024, 16, 619. [Google Scholar] [CrossRef]
  36. Qi, B.; Yu, M.; Li, Y. Multi-Scenario Prediction of Land-Use Changes and Ecosystem Service Values in the Lhasa River Basin Based on the FLUS-Markov Model. Land 2024, 13, 597. [Google Scholar] [CrossRef]
  37. Hou, Y.; Chen, Y.; Ding, J.; Li, Z.; Li, Y.; Sun, F. Ecological Impacts of Land Use Change in the Arid Tarim River Basin of China. Remote Sens. 2022, 14, 1894. [Google Scholar] [CrossRef]
  38. Mamat, A.; Wang, J.; Ma, Y. Impacts of Land-Use Change on Ecosystem Service Value of Mountain-Oasis-Desert Ecosystem: A Case Study of Kaidu-Kongque River Basin, Northwest Chain. Sustainability 2020, 13, 140. [Google Scholar] [CrossRef]
  39. Guo, P.; Wang, H.; Qin, F.; Miao, C.; Zhang, F. Coupled MOP and PLUS-SA Model Research on Land Use Scenario Simulations in Zhengzhou Metropolitan Area, Central China. Remote Sens. 2023, 15, 3762. [Google Scholar] [CrossRef]
  40. Xie, L.; Wang, H.; Liu, S. The ecosystem service values simulation and driving force analysis based on land use/land cover: A case study in inland rivers in arid areas of the Aksu River Basin, China. Ecol. Indic. 2022, 138, 108828. [Google Scholar] [CrossRef]
  41. Hou, Y.; Chen, Y.; Li, Z.; Wang, Y. Changes in Land Use Pattern and Structure under the Rapid Urbanization of the Tarim River Basin. Land 2023, 12, 693. [Google Scholar] [CrossRef]
  42. Huang, X.; Ma, J.X. Changes in the ecosystem service values of typical river basins in arid regions of Northwest China. Ecohydrology 2013, 6, 1048–1056. [Google Scholar] [CrossRef]
Figure 1. Overview map of the study area (GS(2022)1873), included among these: (a) Elevated topographic map of the study area; (b) Map of grassland types in the study area; (c) Northwestern Bayinbruk Steppe; (d) Baynbruk Grassland fence to protect the ecological balance of grassland; (e) Middle Peacock River; (f) Northwestern part of Lake Constance; (g) Southeast of Lake Boster; (h) Lower Peacock River.
Sustainability 17 03460 g001
Figure 2. Technical roadmap.
Sustainability 17 03460 g002
Figure 3. Characteristics of grassland spatial distribution in Bosten Lake Basin, 2000–2022.
Sustainability 17 03460 g003
Figure 4. Proportion of main grassland areas in the Bosten Lake Basin from 2000 to 2022. (Grass types representing less than 1% of the total composition were excluded from detailed analysis to enhance analytical validity).
Sustainability 17 03460 g004
Figure 5. Characteristics of spatial distribution of grassland ESV in Bosten Lake Basin, 2000–2022.
Sustainability 17 03460 g005
Figure 6. Distribution of grassland types in the Bosten Lake Basin under different scenarios.
Sustainability 17 03460 g006
Figure 7. Area of each type of grassland in Bosten Lake Basin under different scenarios, included among these: (A: plain desert grasslands; B: hilly desert grasslands; C: mountain desert grasslands; D: plain desert steppe grassland; E: hilly desert steppe grassland; F: mountain desert steppe grassland; G: plain typical prairie grassland; H: hilly typical steppe grassland; I: typical grassland meadows in mountainous areas; J: plain meadow grassland; K: hilly meadow grassland; L: mountain meadow grassland. Notes: Grass types representing less than 1% of the total composition were excluded from detailed analysis to enhance analytical validity).
Sustainability 17 03460 g007
Figure 8. Percentage of area of each grassland type in Bosten Lake Basin under different scenarios.
Sustainability 17 03460 g008
Figure 9. Spatial distribution of grassland in Bosten Lake Basin under different scenarios.
Sustainability 17 03460 g009
Table 1. Data accuracy and sources.
Data TypeAccuracy/FormatData Source
Land use data30 mJie Yang, and Xin Huang. (2023) [15]. The 30 m annual land cover datasets and its dynamics in China from 1985 to 2022 [dataset]. In Earth System Science Data
GDPText txt“Xinjiang Statistical Yearbook” “Xinjiang Production and Construction Corps Statistical Yearbook”
Population spatial distribution km grid data, meteorological data such as precipitation and temperature1 km National Climatic Data Center (http://data.cma.cn/, accessed on 20 October 2024)
1:1,000,000 administrative divisions datavector dataNational Catalogue Service for Geographic Information (https://www.webmap.cn/main.do?method=index, accessed on 24 October 2024)
1:250,000 national basic geographic datavector dataNational Catalogue Sevice For Geographic Information (https://www.webmap.cn, accessed on 25 October 2024)
The DEM data30 mGeospatial Data Cloud (http://www.gscloud.cn, accessed on 15 October 2024)
Prices of China’s major grain varietiesText txtNational Food and Strategic Reserves Administration (http://www.lswz.gov.cn/, accessed on 6 November 2024)
Table 2. Area and percentage of each type of grassland in the Bosten Lake Basin, 2000–2022.
Grassland Type20002005201020152022
Area
/hm2
Share
/%
Area/hm2Share
/%
Area/hm2Share/%Area/hm2Share
/%
Area/hm2Share
/%
Plain desert grasslands391,054.5912.14963421,230.3313.02980496,289.715.59840327,248.4610.21222523,698.0316.48629
Hilly desert grasslands70,175.432.1802750,440.231.5602596,863.493.0444245,946.531.43382132,330.64.16584
Mountain desert grasslands38.520.0012018.090.0005650.850.0016013.590.0004258.230.00183
Plain desert steppe grassland626,179.4119.45470727,985.4322.51856894,670.6528.11952512,128.2615.981651,223,506.6238.51664
Hilly desert steppe grassland532,913.0416.55702616,398.5719.06688686,789.4621.58581352,240.4710.99213789,698.0724.86012
Mountain desert steppe grassland155.880.00484170.280.00527145.170.00456151.020.00471156.060.00491
Plain typical prairie grassland621,846.7219.32009499,405.2315.44796343,391.9410.79282487,943.115.22692298,924.929.41032
Hilly typical steppe grassland290,452.689.02404210,958.116.52551127,787.494.01636320,992.6510.0170063994.772.01459
Typical grassland meadows in mountainous areas12.690.000399.540.0003092,376.270.0004532.310.001017.920.00025
Plain meadow grassland556,784.6417.29868576,142.0217.82163443,28613.93249888,738.4827.73427118,948.233.74455
Hilly meadow grassland129,022.294.00858130,054.954.0229592,376.272.90339269,025.038.3952925,241.940.79463
Mountain meadow grassland17.640.0005511.070.000345.310.0001717.730.000550.630.00002
Notes: Grass types representing less than 1% of the total composition were excluded from detailed analysis to enhance analytical validity.
Table 3. Changes in the area of each grassland type in the Bosten Lake Basin, 2000–2022.
Grassland Type2000–20052005–20102010–20152015–2022
Magnitude of Change/hm2Rate of Change
/%
Magnitude of Change
/hm2
Rate of Change
/%
Magnitude of Change
/hm2
Rate of Change
/%
Magnitude of Change
/hm2
Rate of Change
/%
Plain desert grasslands391,054.597.7275,05917.82−169,041−34.06196,45060.03
Hilly desert grasslands70,175.4316.26166,68522.90−382,542−42.76711,378138.91
Mountain desert grasslands38.52−19.69−156,013−31.24144,55142.10−189,018−38.74
Plain desert steppe grassland626,179.413.48−132,856−23.06445,452100.49−769,790−86.62
Hilly desert steppe grassland Hilly desert steppe grassland532,913.04−28.1246,42392.04−50,917−52.5786,384188.01
Mountain desert steppe grassland155.8815.6770,39111.42−334,549−48.71437,458124.19
Plain typical prairie grassland621,846.72−27.37−83,171−39.43193,205151.19−256,998−80.06
Hilly typical steppe grassland290,452.680.80−37,679−28.97176,649191.23−243,783−90.62
Typical grassland meadows in mountainous areas12.69−53.0433181.09−37−73.2745328.48
Plain meadow grassland556,784.649.24−25−14.7564.0353.34
Hilly meadow grassland129,022.29−24.82550.9418124.38−24−75.49
Mountain meadow grassland17.64−37.24−6−52.0312233.90−17−96.45
Table 4. Changes in ESV for grassland types in the Bosten Lake Basin, 2000–2022 (108 CNY).
Grassland Type2000–20052005–20102010–20152015–2022
ESVChange/%ESVChange/%ESVChange
/%
ESVChange/%
Plain desert grassland4.1113 7.1610.2264 15.12−23.0308 −51.6626.7650 37.51
Hilly desert grasslands−2.6888 −39.136.3249 47.93−6.9371 −110.8211.7693 65.28
Mountain desert grasslands−0.0028 −112.940.0045 64.42−0.0051 −274.170.0061 76.66
Plain desert steppe grassland13.8704 13.9822.7098 18.63−52.1190 −74.7096.9209 58.14
Hilly desert steppe grassland11.3744 13.549.5903 10.25−45.5802 −94.9859.6009 55.40
Mountain desert steppe grassland0.0020 8.46−0.0034 −17.300.0008 3.870.0007 3.23
Plain typical prairie grassland−16.6819 −24.52−21.2558 −45.4319.6942 29.62−25.7526 −63.23
Hilly typical steppe grassland−10.8306 −37.68−11.3315 −65.0926.3230 60.19−35.0144 −401.59
Typical grassland meadows in mountainous areas−0.0004 −33.0212.5844 99.99−12.5813 −285806.13−0.0033 −307.95
Plain meadow grassland2.6373 3.36−18.1008 −29.9760.6901 50.12−10.4879 −647.16
Hilly meadow grassland0.1407 0.79−5.1335 −40.7924.0673 65.66−33.2139 −965.79
Mountain meadow grassland−0.0009 −59.35−0.0008 −108.470.0017 70.05−0.0023 −2714.29
Total1.9306 0.445.6144 1.27−9.4764 −2.12−3.8028 −0.87
Notes: Grass types representing less than 1% of the total composition were excluded from detailed analysis to enhance analytical validity.
Table 5. Changes in the area of each grassland type in the Bosten Lake Basin under different scenarios.
Grassland Type2035 Scenario I2035 Scenario II2035 Scenario III
Area
/hm2
Rate of Change
/%
Area
/hm2
Rate of Change
/%
Area
/hm2
Rate of Change
/%
Plain desert grasslands29−99.994529−99.994529−99.9945
Hilly desert grasslands11−99.991711−99.991711−99.9917
Mountain desert grasslands50−14.133650−14.133650−14.1336
Plain desert steppe grassland513,134−58.0604514,864−57.9190504065−58.8016
Hilly desert steppe grassland136,953−82.6575136,951−82.6578136935−82.6598
Mountain desert steppe grassland141−9.6501141−9.6501141−9.6501
Plain typical prairie grassland1,199,251301.18801,199,562301.29211,197,570300.6257
Hilly typical steppe grassland756,3211081.8481756,3821081.9435755,9651081.2918
Typical grassland meadows in mountainous areas2−74.74752−74.74752−74.7475
Plain meadow grassland280,801136.0699281,288136.4793278,284133.9539
Hilly meadow grassland57,373127.292457,427127.506357,259126.8407
Mountain meadow grassland
Table 6. Changes in the value of ecosystem services of various types of grassland in Bosten Lake Basin under different scenarios (×108 CNY).
Grassland Type2035 Scenario I2035 Scenario II2035 Scenario III
ESVChange %ESVChange %ESVChange %
Plain desert grasslands0.0040 −18057.550.0040 −18,057.550.0040 −18,057.55
Hilly desert grasslands0.0015 −12029.050.0015 −12,029.050.0015 −12,029.05
Mountain desert grasslands0.0068 −0.160.0068 −0.160.0068 −0.16
Plain desert steppe grassland69.9113 −1.3870.1470 −1.3870.1470 −1.43
Hilly desert steppe grassland18.6590 −4.7718.6587 −4.7718.6587 −4.77
Mountain desert steppe grassland0.0192 −0.110.0192 −0.110.0192 −0.11
Plain typical prairie grassland163.3905 0.75163.4329 0.75163.4329 0.75
Hilly typical steppe grassland103.0440 0.92103.0524 0.92103.0524 0.92
Typical grassland meadows in mountainous areas0.0003 −2.960.0003 −2.960.0003 −2.96
Plain meadow grassland38.2574 0.5838.3237 0.5838.3237 0.57
Hilly meadow grassland7.8167 0.567.8241 0.567.8241 0.56
Mountain meadow grassland
Total401.1107 −30,093.19401.4706 −30,093.18399.2367 −30,093.24
Disclaimer/Publisher’s Note: The statements, opinions and data contained in all publications are solely those of the individual author(s) and contributor(s) and not of MDPI and/or the editor(s). MDPI and/or the editor(s) disclaim responsibility for any injury to people or property resulting from any ideas, methods, instructions or products referred to in the content.

