Article

Life Cycle-Based Product Sustainability Assessment Employing Quality and Cost

Faculty of Mechanical Engineering and Aeronautics, Rzeszow University of Technology, Al. Powstancow Warszawy 12, 35-959 Rzeszow, Poland
*
Author to whom correspondence should be addressed.
Sustainability 2025, 17(8), 3430; https://doi.org/10.3390/su17083430
Submission received: 31 March 2025 / Revised: 8 April 2025 / Accepted: 9 April 2025 / Published: 11 April 2025

Abstract

Current issues in sustainable development concern research on comprehensiveness, coherence and practicality. Therefore, the objective was to develop and test a novelty approach to product sustainability assessment based on life cycle, quality, and costs. This approach extends the iterative design thinking process (DT), including overcoming the limitations of existing LCSA methods. We present a systematic process for obtaining and processing customer requirements with a survey and Pareto–Lorenz analysis. Then, using an algorithm developed in Matlab R2021a program, we generated product prototypes considering the key criteria presented in various dimensions of current and modified states. Next, we propose the modeling of prospective LCA for all prototypes in the OpenLCA program with Ecoinvent database. Finally, we aggregated the results considering the cost of prototypes in environmental–cost analysis to determine the direction of product sustainability. We tested this approach in detail with the example of vacuum cleaners for domestic and commercial use. After a literature review and survey research in customers, we developed 54 prototypes, where the modified key quality criteria were as follows: vacuum in the suction pipe, engine power, operating range, and length of the power cable. Using this approach, it was possible to select six prototypes that best meet customer requirements, are environmentally friendly, and cost-effective. Finally, we discuss contributions to DT and LCSA methodologies, and propose future directions for development within the application of artificial intelligence (AI). This approach can be a practical application in SMEs already in the early stages of product development (conceptualization), where access to detailed data is limited.

1. Introduction

The design and improvement of products are the key activity of companies in maintaining a competitive position in the market. However, dynamic progress in the field of technology, including changes in living standards, forces the pursuit of the personalization and complexity of products [1]. Examples of advances in product sustainability and design methodologies are shown in [2,3]. The need for short product life cycles forces companies to respond quickly to market changes, including increasing the effectiveness of design activities [4,5]. This is particularly important in the era of negative climate change, where companies are increasingly managing their activities to be sustainable in social, environmental, and cost terms. This task is difficult and has been reflected in the approach of life cycle-based sustainability assessment (LCSA) [6]. That is combining LCA (Life Cycle Assessment) [7], S-LCA (Social Life Cycle Assessment) [8], and LCC (Life Cycle Cost) [9]. However, we observed many limitations associated with this, for example, the lack of widespread use in practice [10] due to the high level of sophistication [11]. Also, extensive models that are difficult to develop without detailed information that is difficult to access in the early stages of product development [12], or difficulties in predicting data in the case of a large number of prototypes [13]. In turn, focused only on S-LCA, additional observations include, for example, difficulties in quantifying data, including their subjective nature [14]. Also, the complexity of social indicators and the lack of indications on which of them should be taken into account in a given stage of analysis [15,16].
In this context, our goal was to develop and test a novel approach to product sustainability, more precisely, a product sustainability assessment based on the life cycle, quality, and costs. Our approach starts from the methodological foundations of the existing LCSAs. The main motivation was the observed lack of comprehensiveness, consistency and practical methods for implementation in the traditional approach to product sustainability in the early stages of design (conceptualization) [17,18]. For the purposes of this study, we set out to achieve the following sub-objectives, as further justified:
  • Extending the traditional design thinking method to sustainable product development, where the key is to strive not only for products that meet customer requirements, but also those that are environmentally friendly in their life cycle and financially profitable [19,20,21], while taking into account the ideas of S-LCA, we involve customers (users) in the form of stakeholders who define their requirements for product quality criteria;
  • Replacing the traditional scenario method in LCA with a new approach based on the generation of different combinations of states of product criteria important to customers, where this supports the process of pursuing a prospective LCA of prototypes created in the conceptual phase [22,23];
  • Developing a method to integrate LCA results with cost of production (or product cost) in the form of cost–environmental analyses, which is adapted to dynamic estimation and modeling of results instead of extensive, time-consuming LCC methods [10].
In addition to developing a novel approach to assessing product sustainability based on LCA, quality, and cost, in Section 2 and Section 3, we first demonstrate the application of this approach through a case study of domestic and commercial vacuum cleaners at early design stages. This product is considered important due to its widespread use and its dynamic share in the home appliance market, where it is expected to reach 290 million units in the EU by 2030 [16]. In Section 4, we identify its contribution to the traditional (iterative) design thinking process, make a comparison with traditional methodologies, i.e., S-LCA, E-LCA, LCC, outline benefits and limitations, and outline the development perspectives towards artificial intelligence (AI).
This method allows for taking into account customers in the form of stakeholders who assess the importance of criteria allows for directing design activities to meet customer satisfaction. The advantage of our approach is its simplified form, providing qualitative and quantitative analysis of customer requirements for product criteria, including environmental impact and costs. Additionally, this approach does not require the creation of extensive models as would be necessary in traditional LCSA. It works effectively for a large set of alternative product solutions, including those with limited access to detailed data. In addition, this approach is adapted to dynamic estimation and modelling of results, including their integration (environment–cost) instead of extensive, time-consuming methods such as LCC.
The approach to assessing product sustainability based on life cycle, quality, and costs presented by us can be used successfully by managers and designers at the early stages of product development (conceptualization). It will find a particular application for common and frequently used products to dynamically predict the direction of their development, including complex products, for which the area of improvement activities should be limited to the key. In this case, the focus is on maximizing customer requirements and minimizing the negative environmental impact at optimal costs. This approach may be particularly applicable to SMEs, where such solutions are sought as part of sustainable product development.

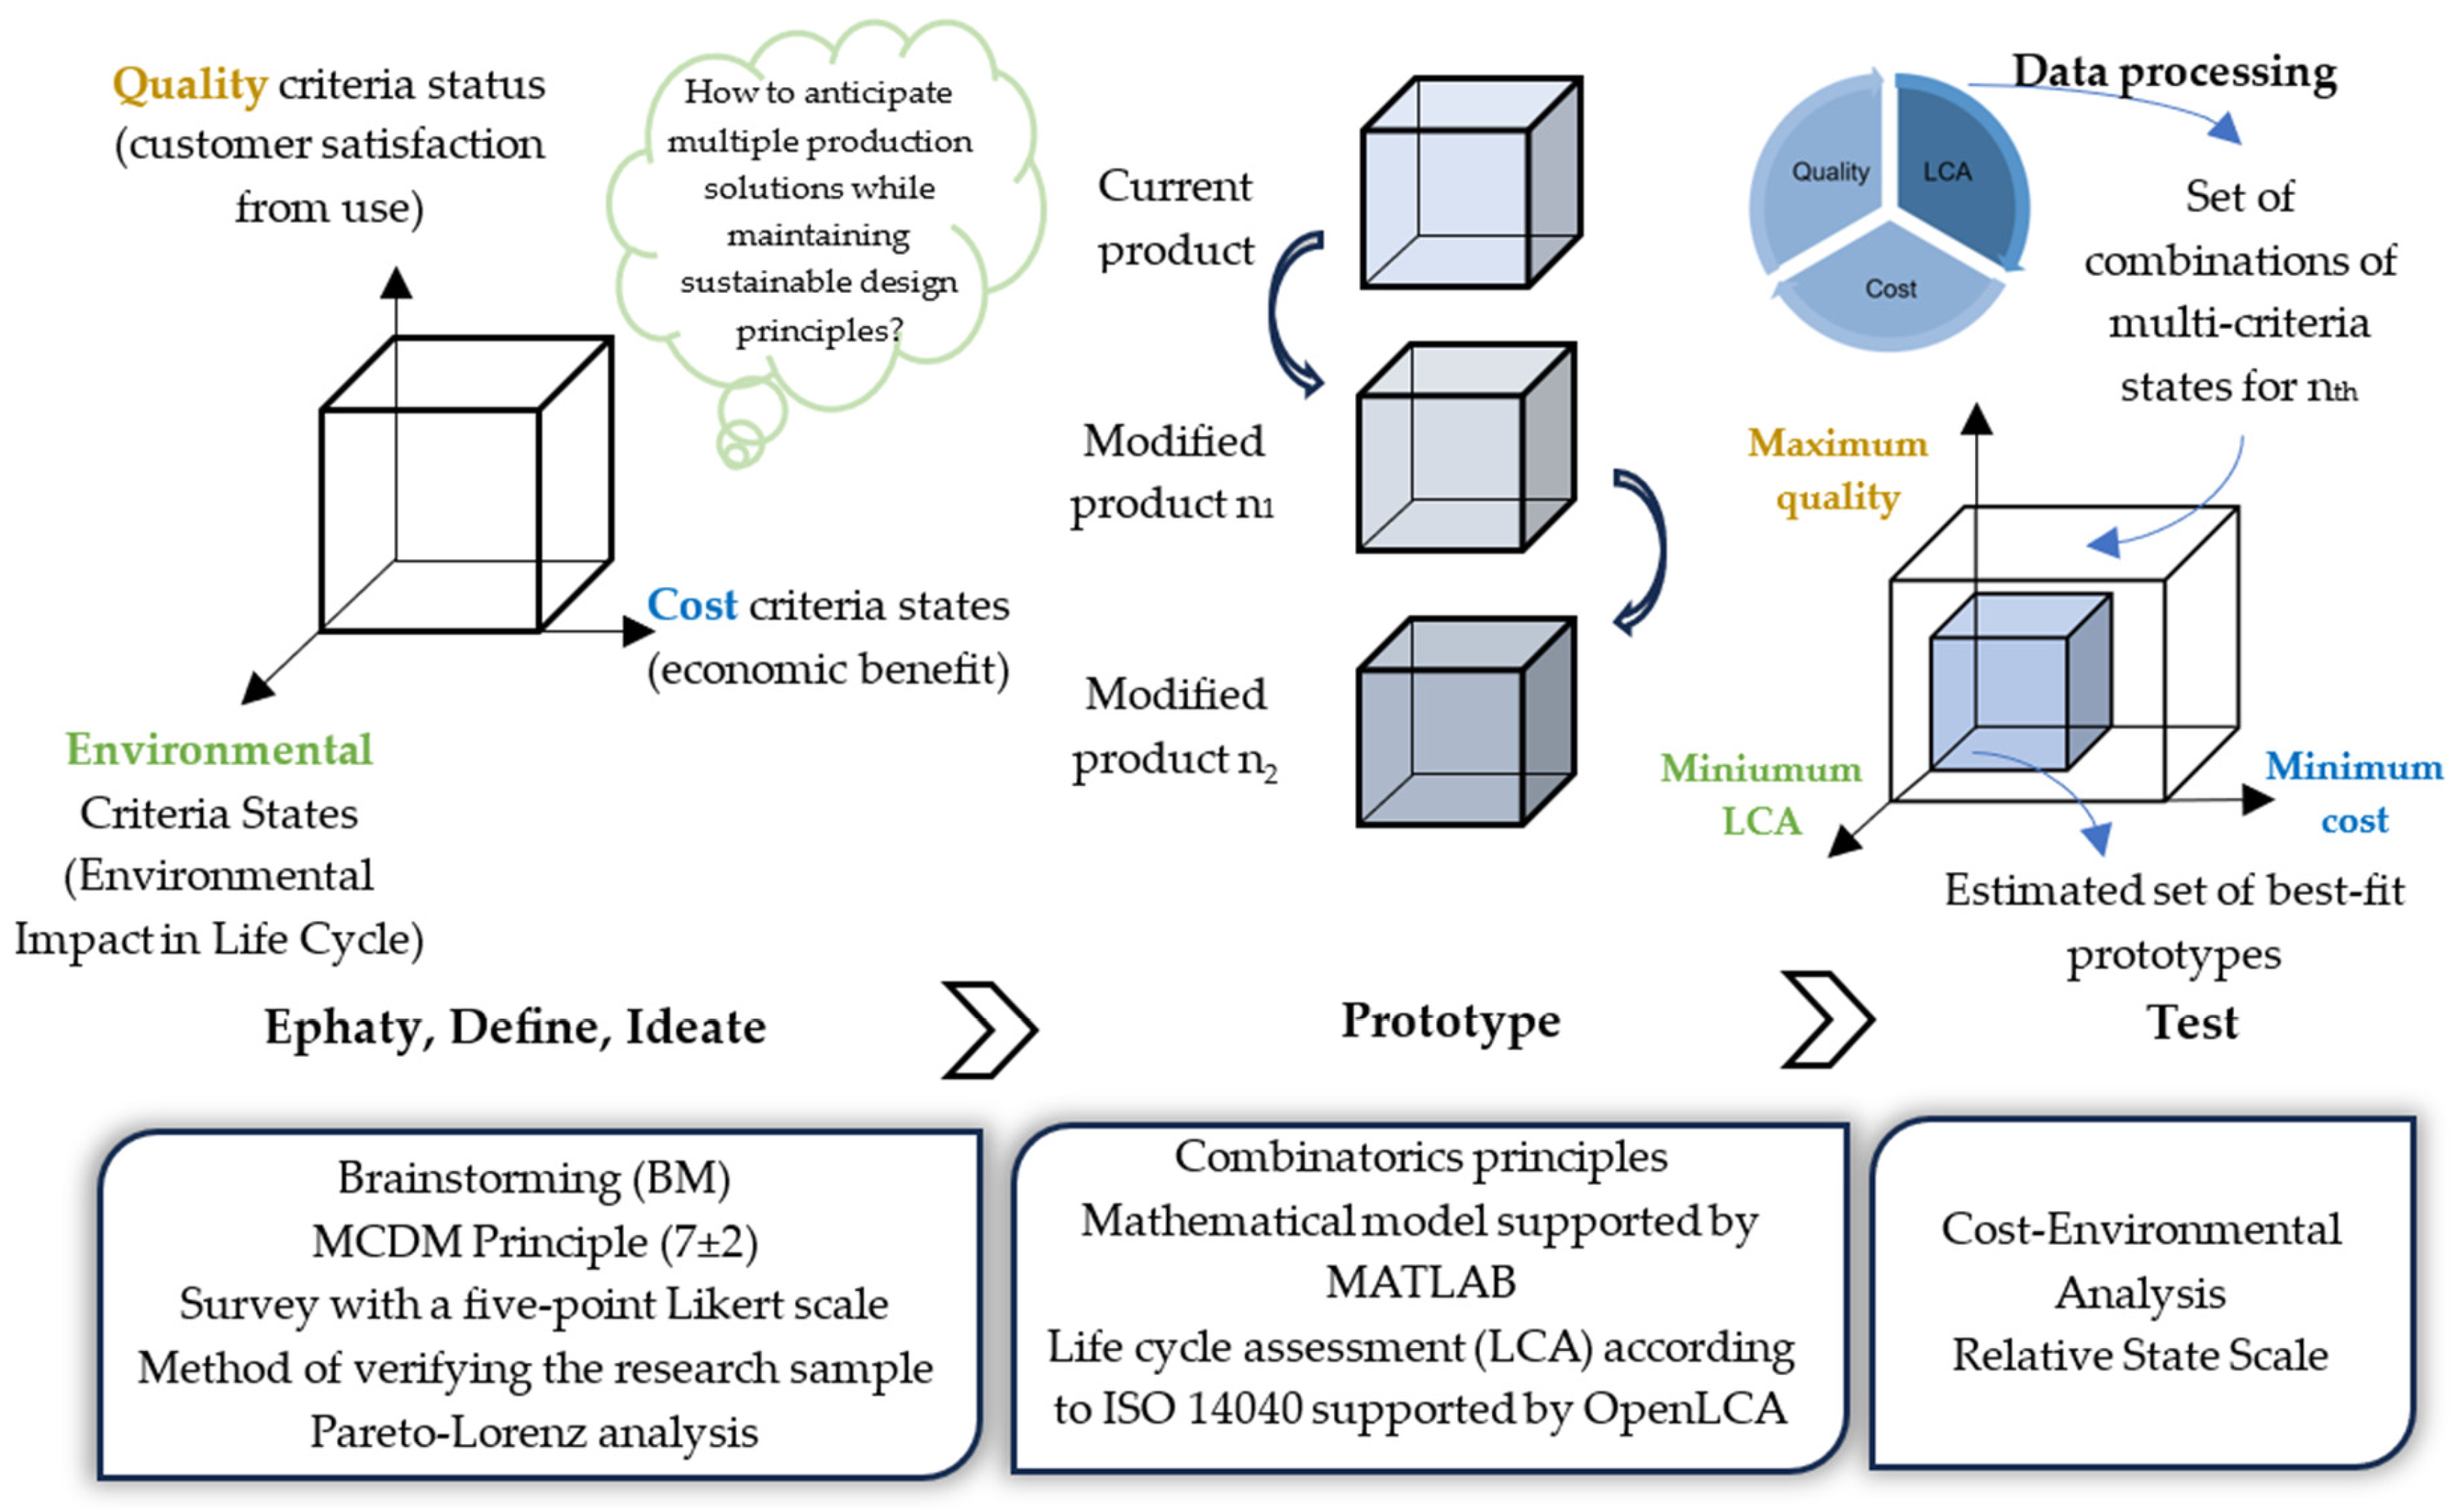
2. Method: General Approach and Novelty

In this section, we develop the proposed approach to the product design process toward sustainability. We assumed that the sustainable product design process will help predict beneficial design concepts that could not be achieved in the form of traditional design processes during experimental studies. It is based on the principles of modelling and generating multidimensional and multifaceted product data sets regarding quality, environmental impacts in LCA, and production costs. Figure 1 presents the conceptual view of the proposed approach to product sustainability in relation to traditional design thinking (DT) [24].
The research concept was based on comparing known and unknown sequences of product criteria, i.e., current and modified (hypothetical, prototyped) [25]. These criteria are assessed and processed multi-dimensionally and multi-aspectally. They concern many and differently correlated states of real and hypothetical criteria of product sustainability, i.e., quality, LCA, and costs. The research was based on acquiring and processing the voice of the customers (VoC), dynamic creation and modeling of alternative production solutions (prototypes) in terms of prospective assessment of the prototypes’ life cycle and assessment of their profitability in the financial context (purchase cost for the customer). The research was focused on moving from traditional design thinking (DT) to an innovative approach to the idea of product sustainability applicable at the early stages of design. Section 3 delves into the specifics of the methodology using the example of a vacuum cleaner.

3. Test and Illustration of the Method by Case Study

3.1. Research Initiation

Research can be carried out with the participation of any product. The choice is made, for example, by the company in which the design activities are undertaken, based on, for example, sales trends and the product life cycle phase. In the form of tests, due to the dynamics of growth in use, we selected vacuum cleaners, of which in 1990 in the EU-27 there were 121 million, 2020 to 271 million, and by 2030 even 290 million units are expected. The vacuum cleaner is the so-called reference product, i.e., a generalization of products of this type. Due to the need to adopt a reference, we consider the basic product to be a household vacuum cleaner, which is a commercial model, which is also used by professional cleaners. We identified this type of vacuum cleaners based on the literature on the subject, e.g., [26,27,28,29,30,31]. We selected cylindrical vacuum cleaners (where the cleaning head is separated from the vacuum cleaner body and connected to it by a suction hose), which constitute about 85% of the European market [16]. At the same time, there is a trend toward bagless vacuum cleaners, the largest number of which are produced in China [16]. According to the EU Regulation implementing Directive 2009/125/CE of the European Parliament and of the Council with respect to eco-design requirements for vacuum cleaners, since 2017 vacuum cleaners cannot exceed 900 W. Therefore, we chose a conventional 900 W bagless vacuum cleaner as the subject of our research, where we considered it to be representative of the European vacuum cleaner market.
We observed that a few years ago, the input power of vacuum cleaners was closely correlated with their cleaning efficiency. According to Eurostat data, in 1990, the power of vacuum cleaners was 1200 W, while in 2020, it was already 2300 W. However, higher power did not always mean higher efficiency; on the contrary, it was often associated with lower energy efficiency, which was reduced from 30–35% in the 1970s. According to Eurostat, in this regard, regulations were introduced, e.g., the regulation on eco-design, which from 2017 limited, among others, the maximum power and annual energy consumption, max. 900 W and 43 kWh/a [27]. Additionally, it is a fact that the quality criteria that characterize vacuum cleaners affect customer satisfaction during their use. Therefore, when buying, customers look for vacuum cleaners that have the parameters they require. Taking the traditional approach to product design as a framework, we assume that it is essential to obtain the voice of the customers (VoC), which refers to the quality criteria of the product [32,33,34]. Our approach to the sustainable product design process concerns the requirement of obtaining VoC on the importance of the main quality criteria of the product, to specify the research area and improve data processing at later stages. This way, we omit linguistic problems or lack of precision in defining customer requirements, which are considered the main barriers to acquisition [35,36,37]. In order to identify key quality criteria for vacuum cleaners, which we will later assess the importance of by customers, we conducted a review of major publications, including verification of catalogs (specifications) of the base product. A summary of selected works on vacuum cleaner research is presented in Table 1.
We have shown that various studies were conducted on vacuum cleaners (domestic and industrial). They mainly concerned the efficiency of filtration using the HEPA filter [28,29,30,38]. However, we did not find any results that examined the importance of other quality criteria for customers (e.g., motor power, price, or length of the suction tube). An in-depth review of the cited studies allowed us to prove that other vacuum cleaner quality criteria are not completely ignored, and are even often indicated as important during use by customers. Therefore, we standardized them in the form of key vacuum cleaner criteria, as shown in Table 2.

3.2. Obtaining and Processing Data from Customers

Based on the adopted quality criteria, a survey questionnaire is created to obtain customer preferences about the importance of quality criteria. The process of acquiring the customer’s voice is an important and still difficult task in the case of product improvement. Various techniques have been developed for this purpose, the most popular of which are surveys, interviews, and observations. These are not complicated techniques, but they do have some shortcomings. Among other things, unreliable survey preparation, an inappropriately selected rating scale, or even targeting the survey to the wrong (incompetent) customers can cause systematic errors. Often, the scope of the survey is also a problem. In such cases, we can observe, for example, its unreliable completion, haste during completion, lack of understanding by customers, or lack of differentiation of their preferences in the case of different survey questions. This can also be caused by the customer’s misunderstanding of the survey, often caused by, for example, lack of direct contact. Ultimately, this generates data loss and less realistic survey results, or even the need to expand the research in order to obtain a reliable sample. Important, often unaddressed problems in the case of VoC studies are changes in customer needs over time, uncertainty in defining their requirements, or the lack of capturing their real feelings and emotions. In this case, supporting techniques are proposed, e.g., Kansei (for analyzing emotions), the ladder method (for weighting), or the use of fuzzy rating scales, e.g., Saaty (for capturing fuzzy/uncertain customer requirements). Despite this, more advanced techniques and scales for obtaining customer requirements are not often used. Mainly, due to their difficult form of implementation, or even the lack of understanding by potential customers. Therefore, despite the limitations of traditional research, the common Likert scale surveys are still used most often.
In this way, we take into account the participation of customers in the product concept, thus identifying the most important product criteria, of which the improvement can provide a noticeable increase in customer satisfaction. We developed a survey with a five-point Likert scale [41,42,43] and adapted the research sample according to the method [44]. We consider that a household vacuum cleaner can be successfully tested among any customer (users or potential users) and these results will be reliable due to the commonness and popularity of this product. We supported these assumptions with our own research and literature studies; e.g., according to [45], vacuum cleaners in Europe are used by women and men aged 20 to 74, all year round. Customers indicate that they spend a lot of time on activities related to vacuuming and maintenance of the device, e.g., 13–28% of the total time spent on housework. Almost 33% of respondents from 23 countries vacuum about 2–5 times a week, where 46% will spend about 1–2 h vacuuming [46]. According to our survey research conducted among 197 Polish customers, including 51% men and 49% women, aged from under 30 to over 50, more than half; that is, 52% use the vacuum cleaner more than 4 times a month and about 22% from 3 to 4 times a month. This is conditioned by the confirmation in the results of other authors whose work was cited. Therefore, we asked these customers how important the quality criteria of the vacuum cleaner are to them.
We process the results of the importance assessments using the arithmetic mean, which estimates the average weight of the quality criterion (1):
w ¯ i = y i n
where w—weight of the i-th quality criterion, y—importance score of the i-th criterion, n—number of customers.
Then, we processed the weights obtained to identify the criteria most important to customers, which are the reference for the next stages of design. We rely on the Pareto data analysis approach [47,48], so we sort the weights from the maximum to the minimum value, where w ¯ 1 = max w , and calculate the percentage share of the weight (2):
p i = w ¯ i w · 100 %
where w—weight of i-th quality criterion, i—criterion, i = 1, 2, …, m.
Next, the cumulative percentage of the criterion weight is calculated, where c 1 = p 1 , and then (3):
c i = c i 1 + p i
where p—percentage share of the weight of the i-th criterion, c—cumulative percentage share of the weight of the i-th criterion, i—criterion, i = 1, 2, …, m.
The results of processing the weights of the vacuum cleaner criteria are presented in Figure 2, where the designations are as follows: A1—price, A2—vacuum, A3—power, A4—length of the power cord, A5—range, A6—noise level, A7—cord winding system, A8—tank capacity, A9—thermal protection, A10—rubber protectors, A11—number of accessories, A12—type of dust filter, A13—length of the suction cord, A14—weight, A15—type of bag, A16—dimensions, A17—possibility of control from the handle, A18—type of material of the driving wheels, A19—socket for the electric brush, A20—appearance/design, A21—on/off type, A22—diameter of the suction cord. We use the 20/80 rule, where approximately the first 20% of the criteria are the most important for customers and their level of satisfaction when using the vacuum cleaner is highly dependent on them. In our case, we obtained customer requirements regarding the importance of vacuum cleaner criteria during surveys. These were Likert scale weight values (ratings) that were averaged across all surveyed customers. These averaged criteria weights were processed using Pareto analysis. In this case, the Pareto principle indicates that 20% of all analyzed criteria generate the greatest impact on customer satisfaction. In general, it can be expected that changes in the most important criteria, which constitute about 20% of all considered criteria, will result in a noticeable increase in customer satisfaction.
We assume that important product criteria, in the further research process, will be interpreted in the form of one current state (current in the product) and at least two modified states (new, hypothetical), which constitute alternative design solutions. The maximum of all states for one criterion is 7 ± 2 [49,50].
Also, we have shown that in this case, the important criteria for the vacuum cleaner are the purchase price, which was also popular in other studies, for example [26,28,30,38]. Subsequently, negative pressure in the suction tube and motor power are important to customers, where these criteria were similarly mentioned, e.g., in [27,28,29,30,38]. Next, the length of the power cord and the operating range of the vacuum cleaner connected to the power cord are important, which were also mentioned in [27,51]. Following the research methodology, including the idea of sequential integration of product sustainability aspects, we assumed that the purchase price would be analyzed at a later stage of the design process. Hence, we have now limited ourselves to the four remaining important criteria. During brainstorming and based on the catalogs (specifications) of selected vacuum cleaners, including in the form of experimental studies presented in [44], we propose current states and one or two modified states: (i) negative pressure in the suction tube 27,000 Pa (current), below 27,000 Pa (modification 1) and above 27,000 Pa (modification 2), (ii) motor power 900 W (current and maximum permissible), below 900 W (modification 1), (iii) length of the power cord 15 m (current), below 15 m (modification 1) and above 15 m (modification 2), (iv) operating range of the vacuum cleaner connected to the power cord 19 m (current), below 19 m (modification 1) and above 19 m (modification 2) [26,27,28,29,30,31].

3.3. Dynamic Generation of Alternative Sets of Product Solutions

Next, our goal is to generate all alternative sets of vacuum cleaner solutions based on four important criteria described by three states (current and two modified). When we rely on combinatorics, we obtain 54 combinations of these states, as we prove later. We already consider it unrealistic to manually write all combinations, eliminating the error as a factor of human error, including predicting the average time needed to determine these solutions. To address these limitations, we developed a comprehensive set of commands to dynamically generate these combinations in Matlab 2022 (Figure 3).
The algorithm operates on a conventionally adopted continuous numbering, which we assigned to the current and modified states of individual criteria: negative pressure in the suction tube (<27,000 Pa) (1), (27,000 Pa) (2), (>27,000 Pa) (3); motor power (<900 W) (4), (900 W) (5); length of the power cord (<15 m) (6), (15 m) (7), (>15 m) (8); operating range (<19 m) (9), (19 m) (10), and >15 m (11). As a result, we generated 54 all possible combinations of the states of the vacuum cleaner quality criteria, where unrealistic combinations (i.e., simultaneously taking into account different states in one combination for the same criterion) were omitted. Then, the first combination is the set of states 1,4,6,9, the second combination is 1,4,6,10, the third is 1,4,6,11, etc. The combinations we developed are used to search for the most advantageous solutions for the vacuum cleaner in the context of its sustainable development, where we model the prospective results of its LCA according to them.

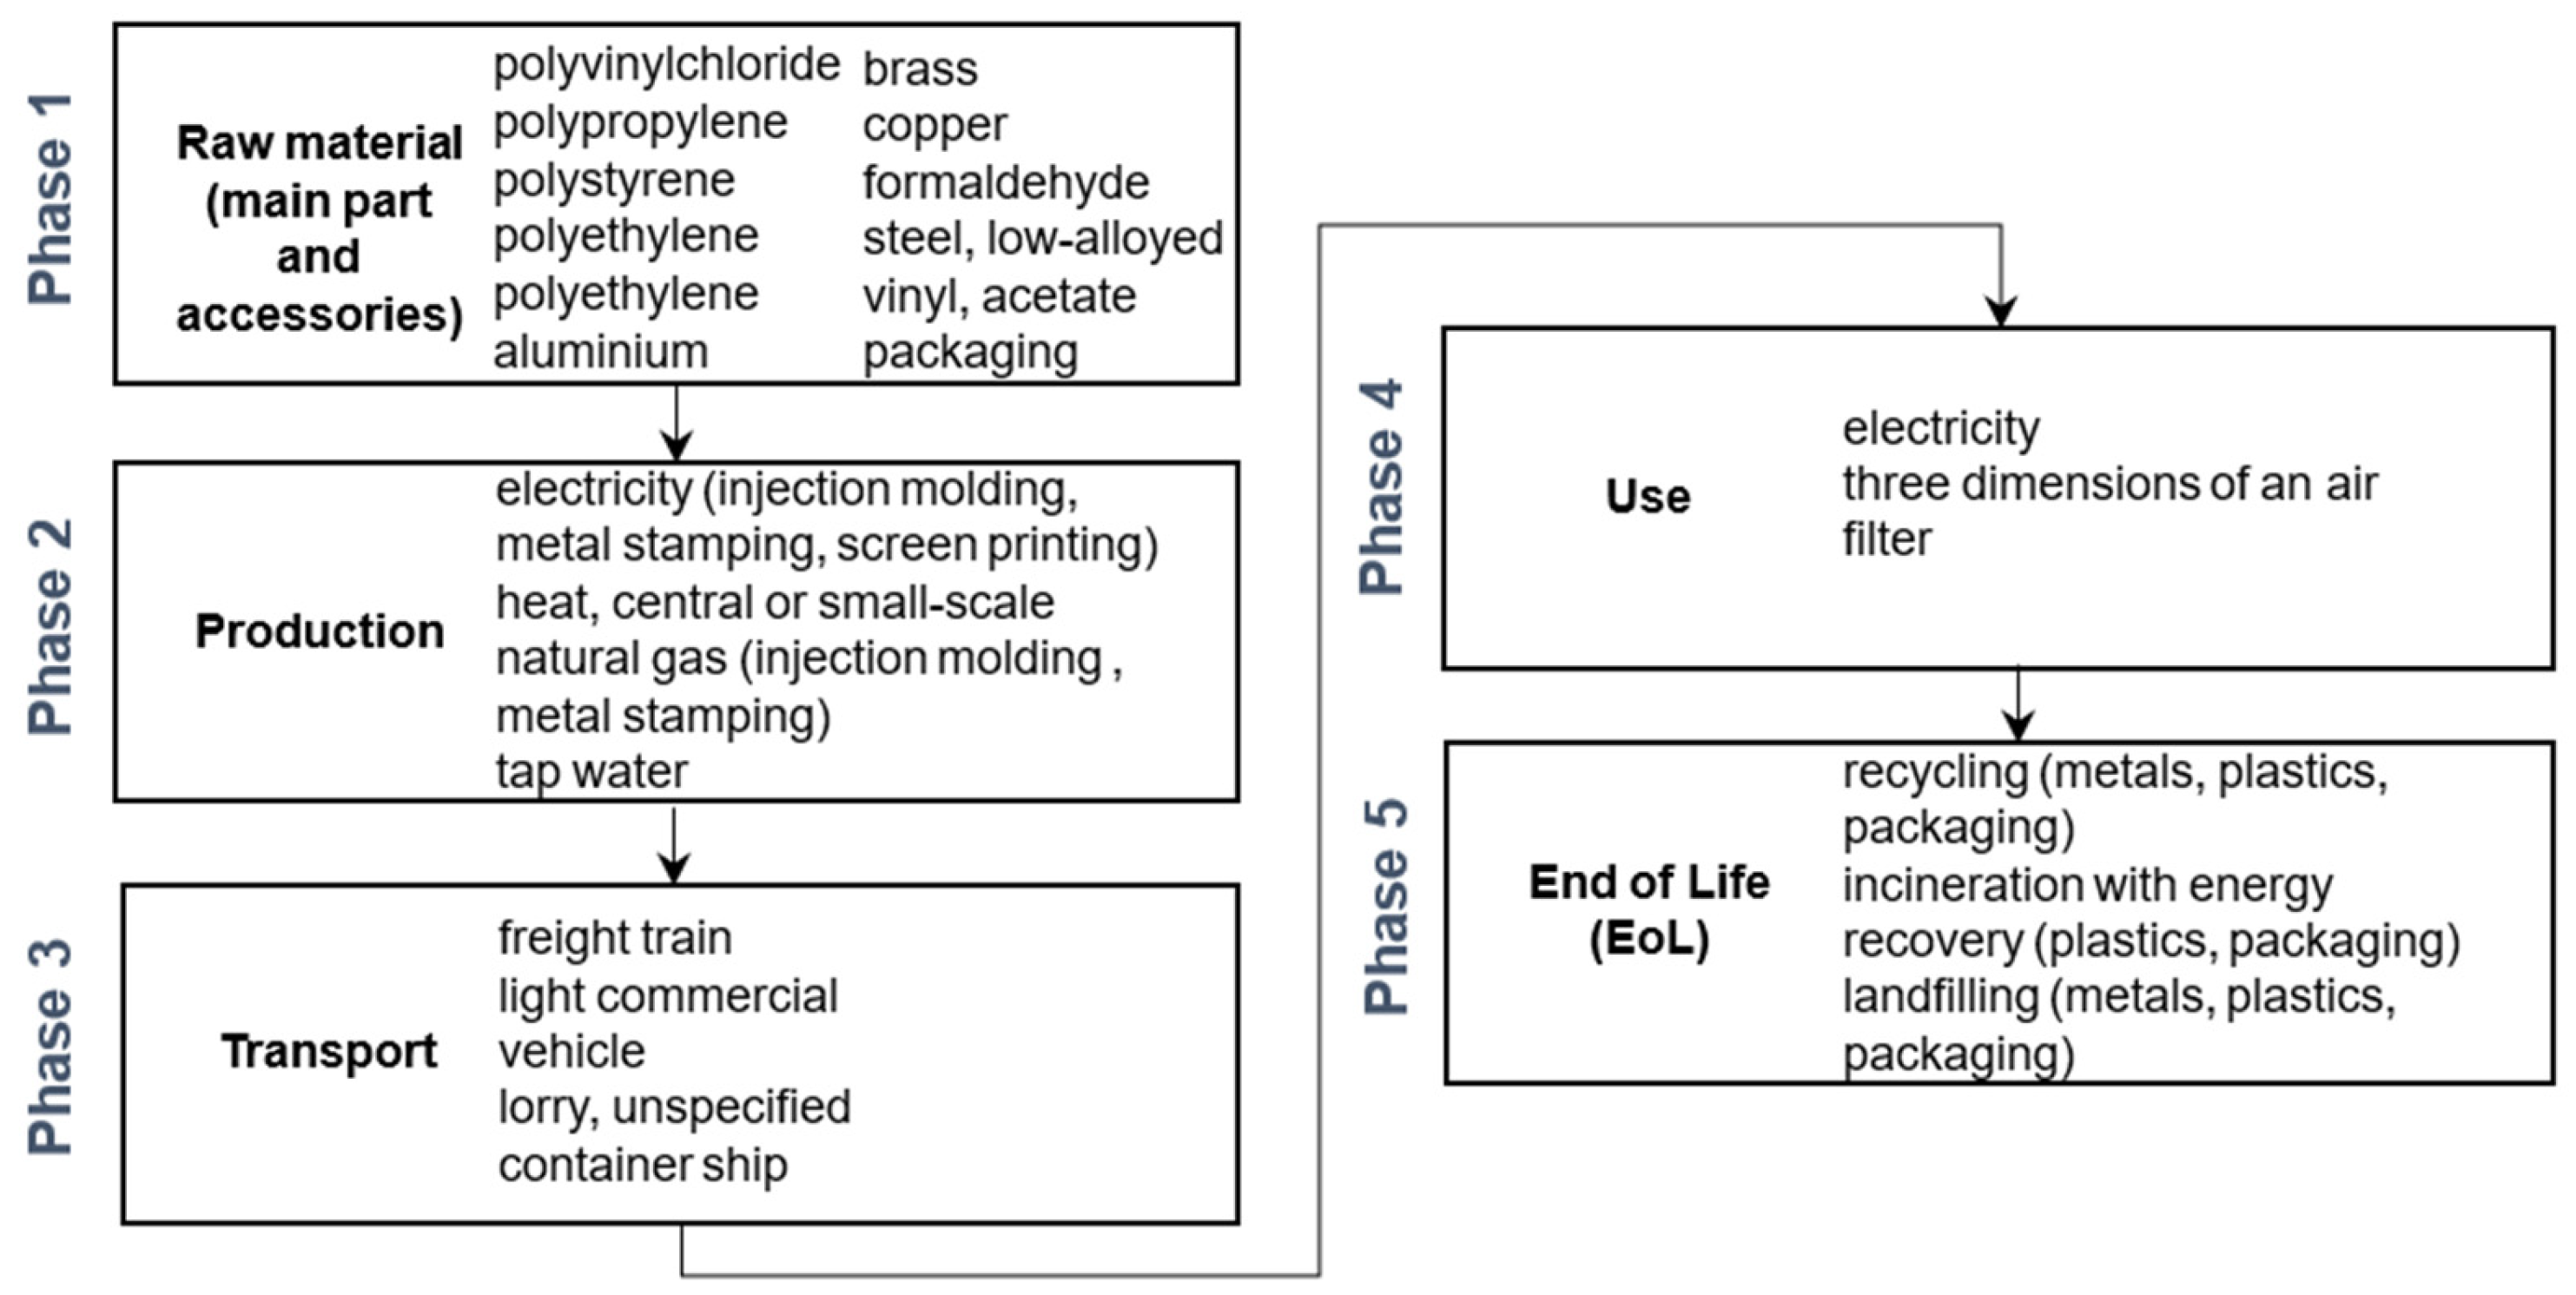
3.4. Prospective Life Cycle Assessment

The approach we propose involves the use of an integrated life cycle assessment of a reference product with prospective processing of LCA results for developed product prototypes [52]. We assume that the product life cycle assessment is carried out according to the LCA method. Then, a set of input data is considered, which are related to materials, energy, and other types of environmental impacts. The goal and scope are defined, inventory data are collected, impact is assessed and the results are interpreted [7,53,54]. If possible, we recommend using a ‘cradle to grave” approach, i.e., taking into account material acquisition and extraction, production, use, and end of life. The concept of our research is to including only one, any environmental burden criterion, in the analyses, e.g., popularly carbon dioxide (CO2) emissions or others, depending about the research [55,56,57]. After estimating the environmental impact on the product life cycle for the selected environmental criterion, a prospective life cycle assessment for prototypes is carried out. The form of prospective LCA of prototypes offered by us results from the early phase of product development, where access to full data is significantly limited [58]. Then, for example, scenario analyses are carried out [59,60,61]. However, our approach involves the creation of a much larger number of different product alternatives than in the case of typical scenarios. In our case, they depend on the generated combinations of product criteria states, which additionally complicates the entire calculation process in traditional form. At the same time, we did not find many studies on vacuum cleaner, apart from one publication, i.e., [27], in which a complete life cycle assessment of this product was carried out.
Therefore, we base our analysis on the aforementioned publication [27], and use OpenLCA 2.0.0 with Ecoinvent v3.10. to calculate the LCA of the vacuum cleaner and its prototypes according to our sustainable design concept. The scope of the study covers “from cradle to grave”, where we consider raw materials, production, use, and end of life (Figure 4).
Following the authors of the article [27], we assume that the functional unit is 50 h of work (use) of the vacuum cleaner per year, where its service life is eight years. The area of use with such assumptions concerns a traditional household (≈87 m2). The assumptions we have adopted also find their source in ecodesign regulations, where the energy consumption of these products is analyzed [16].
We have presented the inventory data in the Table 3. The proposed distribution of the share of individual elements in the total mass of the vacuum cleaner corresponds to the average values given in [16], where for vacuum cleaners used in Europe it is about 50% plastics, about 20–30% metals and 10–20% packaging [27].
We developed inventory data based on data from the ecoinvent v3.10 database from the OpenLCA program, including data from the subject literature, i.e., [27]. Data gaps were filled with other open data sources. Therefore, we assume that the weight of the vacuum cleaner body is about 3.5 kg, where most of the elements (about 35%) are made of aluminum (e.g., engine, screws), steel (engine), brass (plug) and copper (plug, wires, cables, and engine). Materials used in plastic elements, e.g., dust container, air filter parts, or cables and wires, constitute about 66% of the total vacuum cleaner. The main materials used for their production were, e.g., polyvinyl chloride, polypropylene, polystyrene, or polyethylene. Accessories account for about 27%, e.g., hose, handle, socket for electric brush, cleaning brush, etc. We also included packaging boxes, cardboards, and polyethylene bags, as in the Ecoinvent database. According to [27], offset printed boxes, corrugated cardboard (mixed fibres) and polyethylene film are used for the production of plastic bags. We assume that production occurs in China, where, based on the data from the Ecoinvent database, we include electricity of 14.19 kWh, which according to [27] is used for injection molding, metal stamping, and screen printing, but also for assembly and packaging processes. As in the Ecoinvent database, we assume a heat production of 17.13 kWh, where we assume that as [27] it is during injection molding and metal stamping. In turn, the power cord and plug were modelled as in the Ecoinvent data for the data based on the computer cable, using the H05VVH2-F power cord (mass approximately 14 g/m, 1.5 mm2), as in [27]. The necessary water consumption for assembly and packaging is estimated at 12.97 L according to the Ecoinvent database and [27]. In the case of using a vacuum cleaner, we refer to the previously assumed functional unit of 50 h of work/year, a service life of eight years. As stated in the Directive of the European Parliament and of the Council 2009/125/EC regarding ecodesign requirements for vacuum cleaners, the annual electricity consumption of a vacuum cleaner should be around 40 kWh. We adopt these assumptions, estimating that over its entire service life it would be around 320 kWh of electricity. In the case of the filter, we assume that its replacement is standard and occurs once or twice a year, as recommended by vacuum cleaner manufacturers. We have adopted the transport data in accordance with the data available in the Ecoinvent database. We therefore include data on transport by freight train, light commercial vehicle (where according to the Bureau of Transportation Statistics, 6% of total road transport is assumed to be by delivery van for goods with a high retail share), truck (popular Euro 3 type with a payload of 16 to 32 tons), including container ship, where Ecoinvent reports the total volume of sea transport divided into main commodity groups. Following [27], we similarly assumed that after production in China, the vacuum cleaner is transported by ship to Europe, an estimated 19,500 km (to Rotterdam). Then, by truck to Munich (830 km) and then to Shanghai and the distribution center. The last phase is the end of life, where according to the data from the Ecoinvent database we have taken into account the recycling process of metals, plastics, and packaging (49%), the incineration process with energy recovery of plastics and packaging (24%), and the waste disposal process of landfilling waste from metals, plastics, and packaging (27%). These assumptions are consistent with the estimated data presented by [16], or the data presented in [27,62].
We used OpenLCA 2.0.0 software with the Ecoinvent database to model the system. We calculate the LCA indicator value according to the ecological footprint method [63]. The category of environmental impact we chose for the study was the carbon footprint (CO2) [64], important from the point of view of environmental criteria, with which we did not find studies for the LCA of the vacuum cleaner. Based on the adopted assumptions, we estimate that the reference vacuum cleaner emits 859.55 kg of equivalent carbon dioxide during the life cycle. We analyze and interpret this result in further considerations, because our proposal for sustainable design also includes an estimate of the environmental impact for vacuum cleaner prototypes. We then are able to develop a prototype that is as environmentally friendly as possible.
Therefore, when considering the modifications adopted to the vacuum cleaner criteria states, we expertly determined the changes in the inventory data values based on these data for the reference vacuum cleaner in its current state. If the change in value was negligible in the case of the modified state, we assumed the same value as for the reference vacuum cleaner (Table 4).
Where negative pressure in the suction pipe below 27,000 Pa (B1), above 27,000 Pa (B2); motor power below 900 W (B3); power cord length below 15 m (B4), above 15 m (B5); operating range of the vacuum cleaner connected to the power cord below 19 m (B6), above 19 m (B7).
Our research concept is based on a prospective life-cycle assessment of prototypes depending on the combination of its criteria states. Therefore, we use previously developed combinations to model the inventory data set necessary for the LCA assessment of vacuum cleaner prototypes. We model the data for 54 combinations in MS Excel (horizontal lookup function), by matching the estimated inventory data for prototypes to the generated set of their combinations depending on important criteria of the vacuum cleaner. According to a given combination, we calculate the average value of all values belonging to this combination, separately, for each element considered in the LCA (e.g., energy, aluminum, copper, etc.). Based on these data, we performed a prospective life-cycle assessment of vacuum cleaner prototypes in OpenLCA with the Ecoinvent database. Analyses were performed as for the reference vacuum cleaner, except that we replaced the values previously interpreted with those generated from a new inventory data set. We estimate that the minimum value of the life cycle emissions of the vacuum cleaner prototypes we offer is 858.61 kg eq. of carbon dioxide. It is important to note that the modelled data included a set of combinations of only four main criteria important to customers, and these criteria generated relatively similar changes in the LCA. The differences between the LCA results of the vacuum cleaner prototypes resulted from the different states of the quality criteria for these prototypes, where these states were estimated as the development direction. However, the offered approach allows the generation of different emission factors for alternative products. According to the results obtained, it is possible to indicate that from an environmental point of view it would be beneficial to undertake design activities that involve combinations with the minimum impact of CO2 emissions (858.613 kg eq CO2). This is the first combination, described by states 1,4,6,9. This means that it would be necessary to reduce the vacuum in the suction tube below 27,000 Pa, reduce the engine power below 900 W, reduce the length of the power cord below 15 m, and reduce the range of the vacuum cleaner connected to the power cord below 19 m. Solutions of this type would contribute to the greatest extent to reducing the CO2 emissions of the vacuum cleaner in its LCA. If these solutions were not the most beneficial from the design point of view and meeting customer satisfaction, it is recommended to consider other combinations, e.g., those for which CO2 emissions are within the range from the minimum estimated impact value to that which characterizes the reference vacuum cleaner, that is, from 858.613 to 859.546 kg eq. CO2.

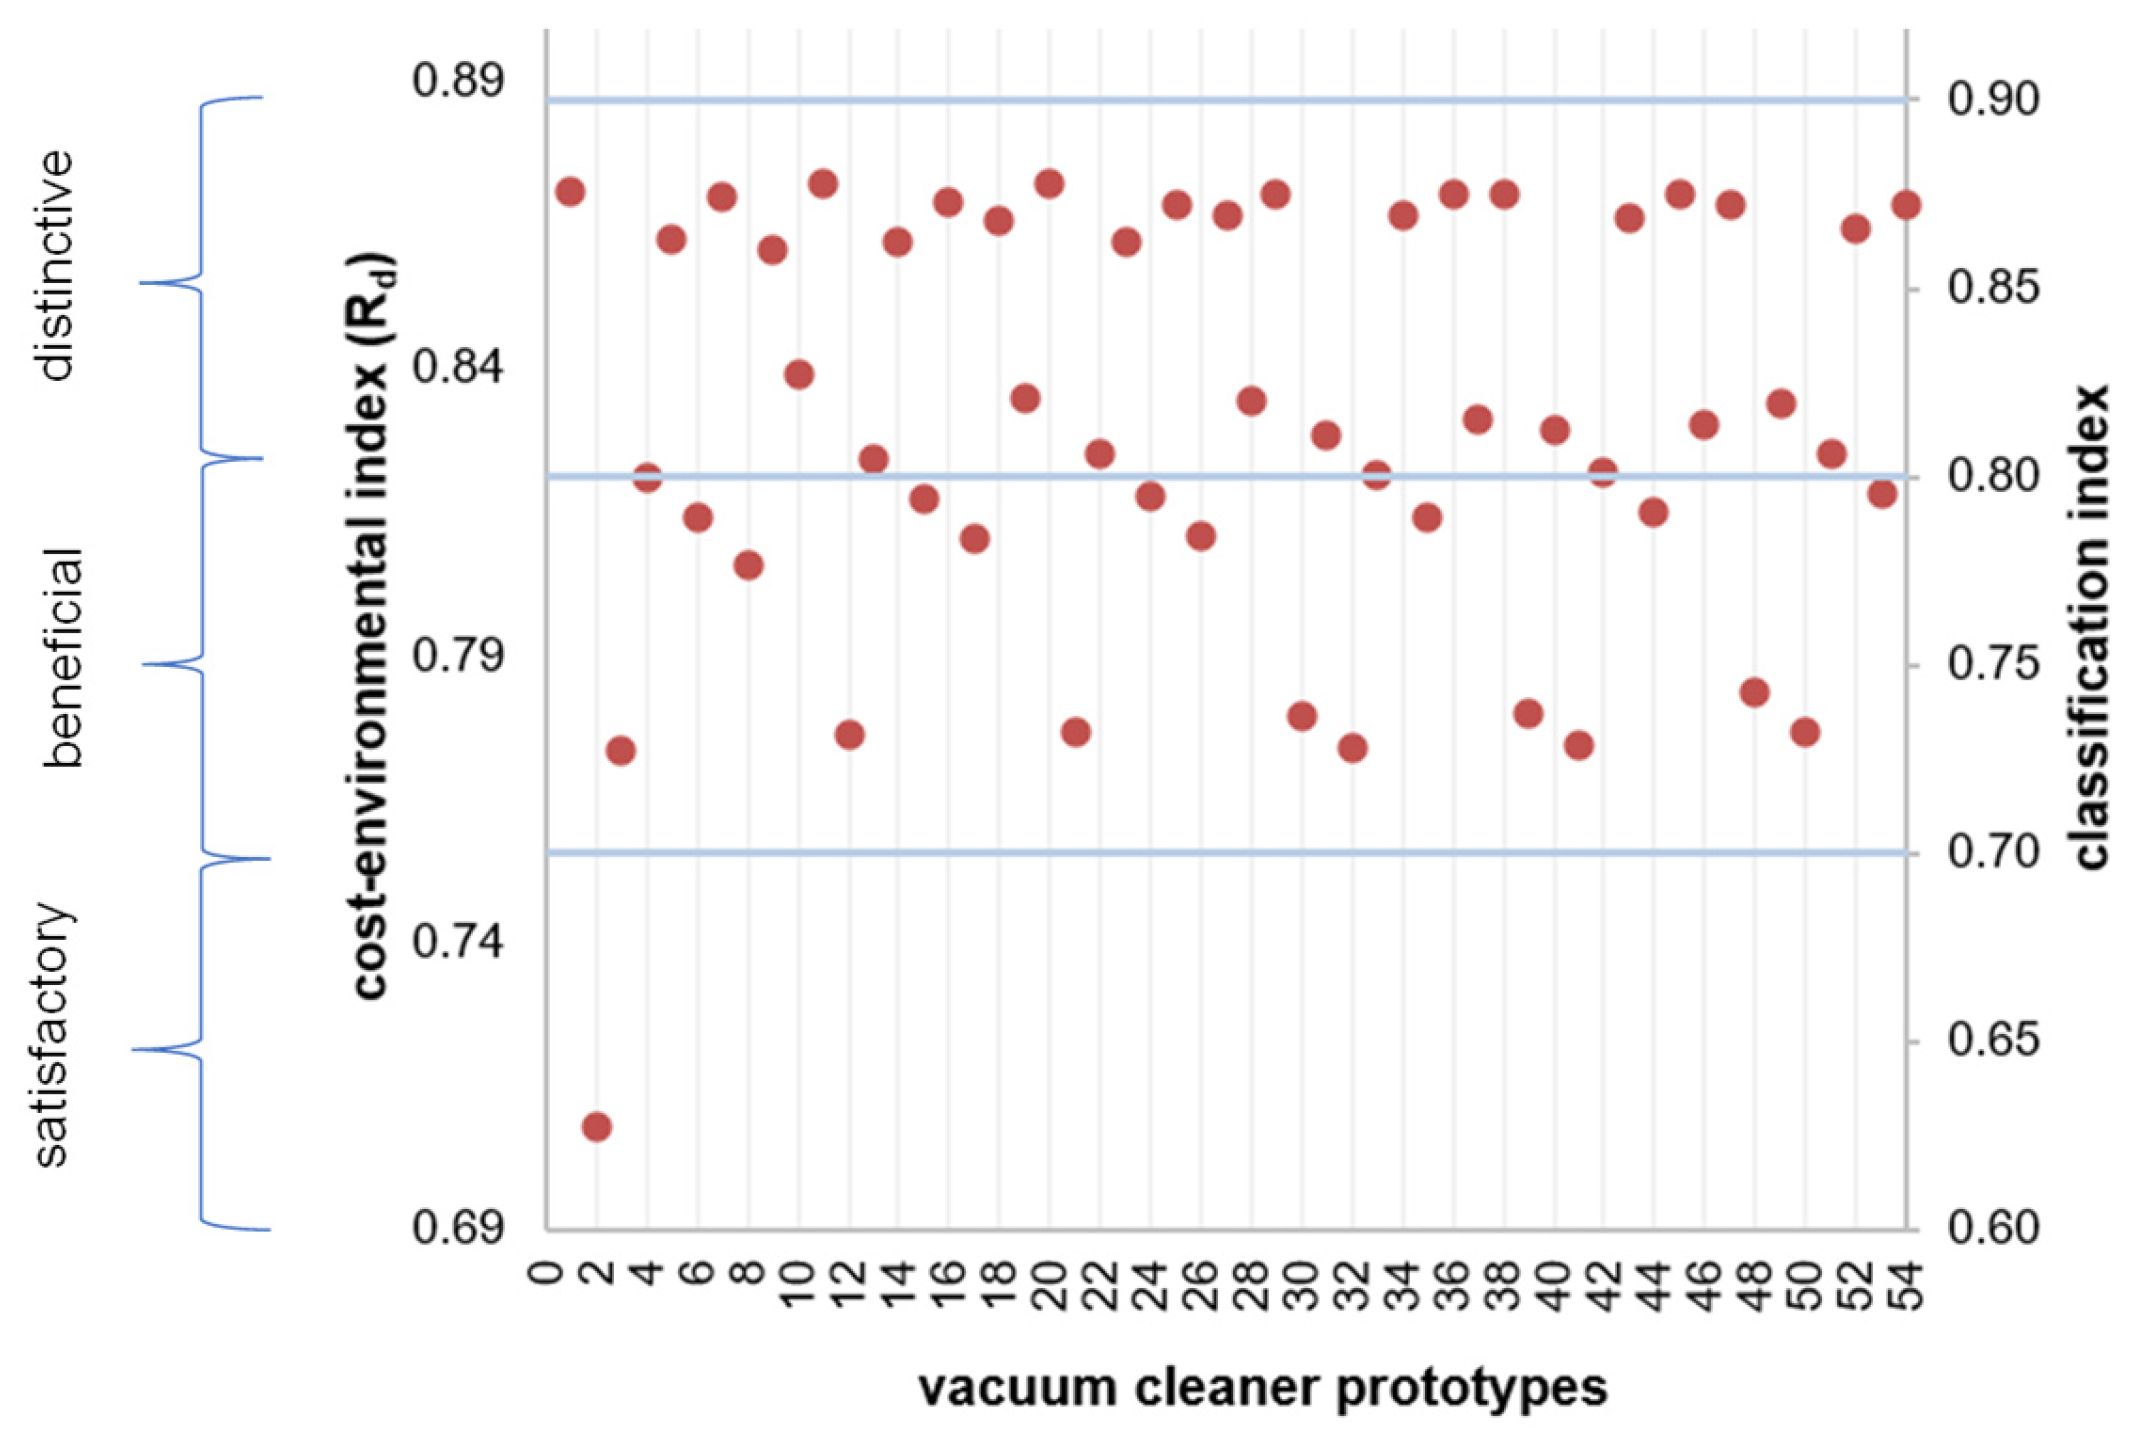
3.5. Predicting the Direction of Product Solutions Taking into Account Costs

As we proved after the literature review, the purchase price is an important criterion for a vacuum cleaner, for example [26,28,30,38]. Furthermore, the results of the survey conducted indicated that price is one of the most important criteria. The concept of our approach to sustainable product design takes into account the dependence of design activities on price. We assume that this will be implemented in the cost-environmental analysis (ACE). The approach we propose aggregates the results of the life cycle assessment (LCA) with the product cost. To do this, we initially normalized the values of the environmental indicator (the environmental impact of the vacuum cleaner in LCA), by estimating the difference between the value of the LCA indicator obtained for the prototype and the total minimum LCA indicator value among all those estimated for the prototypes considered (EI). Then, we estimate the cost of the prototype depending on the combinations of its criteria states and the values obtained values of the environmental indicator. Taking into account the costs, we estimate the environmental cost indicator (ck) according to the estimated cost of the prototypes (K) and the prospectively estimated environmental impact of the prototypes in their LCA (4):
c k i = K i E I i %
where ck—environmental cost index, K—cost, EI—normalized environmental impact index in the prototype life cycle expressed in %, i—prototype, i = 1, 2, …, 54.
Next, we estimate the so-called relative cost (k), which depends on the maximum and minimum value of the prototype costs, including the cost considered in the given analysis (5):
k i = K a K i K a K b
where k—relative cost, K—analyzed cost, Ka—the highest cost among all analyzed costs, Kb—the lowest cost among all analyzed costs, i—prototype, i = 1, 2, …, 54.
Then, we calculate the decision function index (d) and the cost-environmental proportionality (E), as in Formula (6):
      E i = k i E I i d i = 0.5 · E i i f E i = 0 ; 1 d i = 0.5 + 0.5 · 1 1 E i i f E i > 1
where k—relative cost, EI—normalized environmental impact index in the prototype life cycle, E—cost-environmental proportionality, i—prototype, i = 1, 2, …, 54.
Then we calculate the relative cost index (c), which depends on the maximum environmental cost index and the minimum environmental cost index among all the analysed ones (7):
c i = c p a c p i c p a c p b
where c—relative cost index, cpa—maximum environmental cost index among all analyzed ones, cpb—minimum environmental cost index among all analyzed ones, i—prototype, i = 1, 2, …, 54.
Finally, based on [65], we calculate the resolution indices for technical, economic, and decision-making preferences from the following relations (8):
R t i = α E I i + β d i + γ c i + δ k i α + β + γ + δ w h e n α : β : γ : δ = 8 : 4 : 2 : 1 R t i = 0.0667 8 L C A i + 4 d i + 2 c i + k i R e i = α k i + β c i + γ d i + δ Q i α + β + γ + δ w h e n α : β : γ : δ = 8 : 4 : 2 : 1 R e i = 0.0667 8 k i + 4 c i + 2 d i + E I i R d i = R t i + R e i 2
where Rt—resolution index for technical preference, Re—resolution index for economic preference, Rd—average decision resolution index, the remaining symbols are as before.
In accordance with these assumptions, we performed calculations for the reference vacuum cleaner and its 54 prototypes. A fragment of the obtained results is presented in the Table 5.
The most beneficial in terms of environment and cost are prototypes that obtained the indicator Rd = 0.87 (maximum value), for example, 10, 11, 20, etc. On the other hand, the least beneficial in terms of cost and environment are prototypes with the indicator Rd = 0.64 (minimum value), e.g., last prototype. We have overwritten the quantitatively estimated decision indicator with verbal labels according to the relative scale [66] to facilitate the interpretation of the results. Therefore, prototypes with the values of the indicator Rd   <   0 .6; 0.7) are satisfactory, Rd   <   0 .7; 0.8) are beneficial and Rd   <   0 .8; 0.9) are distinctive (Figure 5).
Prototypes from the distinctive group are the most advantageous in terms of cost and environment, e.g., prototype 1, 2, 4, 5, etc. It is recommended to direct the sustainable product development process to the prototype with the highest cost and the environmental index Rd = 0.87, that is, 1, 5, 9, 18, 27, 34, 36, and 44. These prototypes have the most advantageous price with the lowest amount of CO2 emissions in LCA. In our method concept, we assumed that the recommended projects that are the best solutions in the ranking will meet customer preferences and usability at the same time. In the absence of the possibility of directing design activities according to these prototypes, e.g., limited company resources, it is recommended to choose from other prototypes from the “distinctive” group. Satisfactory, but to a lesser extent, would be prototype 2, which has a low Rd index, i.e., have a relatively high price, with an unfavorable impact on the environment in LCA.

4. Results and Discussion

In this section, we initially determined, in Section 3.1, the contribution of our proposed approach to sustainable product design using vacuum cleaners as an example to the traditional (iterative) design thinking process. Then, in Section 3.2, we compared our proposed approach with traditional methodologies, that is, S-LCA, E-LCA, and LCC, which are part of our research methodology, to determine the benefits and limitations of our approach. Finally, in Section 3.3, we outlined the prospects for the development of research topics toward artificial intelligence (AI).

4.1. Contribution to the Iterative Design Thinking (DT)

Our approach to sustainable product development is supported by the search for alternative product solutions that are beneficial to customers, and environmentally and cost-effective. We have shown that this is possible in the early stages of product development, mainly dedicated to the design phase, where product prototypes are created [67]. This approach is consistent with the traditional design thinking (DT) process [68] based on five main stages [69]: (1) empathy, (2) define, (3) ideate, (4) prototype, (5) test [70]. At the beginning, situation analyses and observations are performed that relate to customer expectations, requirements, motives, and emotions [19]. The next stages are the generation of ideas, that is, initial prototyping [20]. This is carried out based on previously collected data that allow the development of specific patterns [21]. The interdisciplinary teams involved in the process [71] develop as many ideas as possible and then reduce them to the most realistic [70]. The testing stage includes the development of prototypes according to the adopted design assumptions. In this case, the tests consist of repeatable and modified experiments that are to help find the optimal solution [72]. In the case of design thinking, prototyping is based on the conceptual phase, only up to the stage of obtaining feedback to improve the design solution [70,73]. The main goal of iterative design thinking is to obtain three-dimensional information: attractiveness for customers, technical feasibility, and business profitability [74]. As stated by [75], the most widely used design thinking techniques include ethnographic methods, personas, journey map, brainstorming, mind map, visualization, prototyping techniques, and experiments. Figure 1 presents the design thinking framework enriched with our proposed approach. Our approach to sustainable product development extends the traditional (iterative) design thinking process, mainly by taking into account not only customer expectations but also the environmental impact of the product in the LCA and production costs. We assume that practicing our approach to sustainable design is possible because design thinking has a flexible form and can be modified and extended depending on needs [76,77].

4.2. Benefits and Limitations: Comparison to Traditional S-LCA, LCA, LCC Methodologies

Current life cycle-based sustainability assessments (LCSA) lack comprehensiveness, consistency, and practical tools for implementation [17]. Currently, a popular approach in LCSA is the integration of life cycle assessment (LCA), social life cycle assessment (S-LCA), and life cycle cost assessment (LCC) [13,78]. These methods have separate, yet similar, methodologies, and all of them concern the product life cycle. We compare the LCSA approach by separating it into key, mentioned elements with our proposed approach to product sustainability based on LCA, quality, and costs. Our goal is to outline the advantages (novelties and strengths) of our approach, but also the limitations compared to current methodologies.
In the case of traditional LCA, the novelty is to provide a dynamic, prospective life cycle assessment of product prototypes according to the proposed combinations of customer-relevant criteria states. Instead of traditional solution scenarios [7], we generate different combinations of alternative products and model the LCA results. We present the details in Section 2.
In turn, the life cycle cost (LCC) [79] is the cost incurred in all stages of the product life cycle [13]. The main purpose of LCC is to quantify the total cost (financial) associated with the product throughout its life cycle [10]. LCC is important for customers because, in general, environmentally friendly products have a higher purchase cost. Furthermore, LCC provides an analysis on different perspectives on the costs of a conventional product to predict whether it can be successful in the market [9]. It is assumed that more than 70% of the total life cycle cost of a product is incurred in the early design stage [80]. Therefore, designers are looking for opportunities to reduce the life cycle of products by paying special attention to design decisions. These decisions should be made quickly, but in the early stages of design, there may be contradictions, including limited detailed information, which makes the analysis process difficult. Although LCC helps estimate the incremental development, production, use and end-of-life costs of a product [81], the activities related to the development of parametric LCC models for many different concepts and requirements become impractical [80,82]. Hence, other approaches than traditional LCC are sought to include an early-stage product cost assessment. LCC method must be integrated with product life cycle processes to provide semantics data for other areas to support decisions, even taking into account other aspects, e.g., technical or ecological. We observe that despite the existence of many LCC methods, they are not widely adopted and also adapted by practitioners, which is also confirmed by [11]. Examples of research in this area and the limitations identified by other researchers are presented in Table 6.
We have observed that LCC is used, but it has some limitations. Among the frequently indicated ones were: difficult use in practice (mainly due to the development of extensive LCA models, the creation of which for prototypes is impractical), time-consuming, lack of possibility of dynamic decision-making, difficult possibility of application in the absence of access to detailed information [10], limitations in integration with other methods [82].
In turn, our proposal regarding the inclusion of production costs (or the costs of purchasing the product by the customer) provides a simplified cost estimate and their modelling for any number of prototypes. The proposed mathematical model introduced in a computer spreadsheet, e.g., MS Excel, shortens the calculation time, eliminates errors, is practical in use thanks to its simplified form and can be integrated with any aspects; in this case we combined it with the LCA indicator. A certain limitation of our approach is the comprehensive, conventional cost estimate in the product life cycle, where the LCC is adapted to a detailed analysis of costs at individual stages of the life cycle. However, we believe that such simplified procedures will be welcomed by practitioners, especially since they are low-cost and provide cost estimates at early stages of product development (including when the scope of data is limited).
On the other hand, S-LCA (Social Life Cycle Assessment) is a technique used to assess the social impact (and potential impact), where the objective is to assess the social, but also socio-economic aspects of products, including their potential effects throughout LCA [8]. The methodology is similar to that in LCA or LCC, hence it can be successfully integrated with them, but this leads to the same challenges and limitations that arise within these methods [85]. From our research point of view, an important aspect of S-LCA is stakeholder theory, an instrument that is used to assess social harm, but also benefits resulting from the company-stakeholder relationship in the product life cycle [86]. In S-LCA, stakeholders can be considered as: (i) users of the LCA method, (ii) users of the results of the LCA method, (iii) customers (victims or beneficiaries of the effects), (iv) entities defining the types of significant impacts or the LCA methodology [86,87]. Our approach to product sustainability focusses on stakeholders who are customers (users of the product). This is a correct assumption, where, as stated by [14], S-LCA concerns human behavior related to the use of the product. Examples of studies in this area, as well as identified limitations of S-LCA by other researchers, are presented in Table 7.
We consider S-LCA to be less popular than LCC or LCA. This is due, for example, to the recognition of environmental criteria as less important [85] the qualitative and subjective nature of indicators, where the quantitative ones are more advantageous in interpretation [14,89]. An important point of reference is the stakeholders [88], where in our case they are customers (users) of the product. Our proposal provides a qualitative and quantitative analysis of customer requirements for product criteria. These criteria refer to the usability of the product, where they are presented in the current and modified (hypothetical) state. We propose to focus on maximizing customer satisfaction by achieving key (main) product criteria, i.e., the most important for customers. Due to the aforementioned limitations of S-LCA, our perspective on taking into account VoC concerns the validity of criteria, including their quantitative interpretation. Based on important criteria described in the current and modified state, combinations are created, called prototypes, alternative design solutions. These results are integrated in subsequent stages with LCA and finally with environmental–cost analysis. A certain limitation of this approach is the omission of modelling other social criteria, taken into account in the traditional S-LCA. However, in this case, we consider them to have traditional application.

4.3. Limitations and Development Prospects: Toward Artificial Intelligence (AI)

Based on the identified limitations, we have identified further research directions. We have observed that our approach to sustainable product development can be successfully developed toward the use of artificial intelligence (AI) [1]. It is a particularly promising area of research in the near future, also in the context of product development [90]. We observe that there is a need to support the following areas of the methodology with machine learning techniques, including artificial intelligence.
  • Predicting a larger number of combinations of criteria states, e.g., considering a larger number of states and a larger number of criteria. This can help identify combinations that are less costly, including deepening research for a wider range of customer requirements. Currently, according to the combinatorics principles, for 4 criteria and 11 states we have generated 54 combinations, where considering a larger number of states generates a larger number of product alternatives, including a wider range of product possibilities. However, their detailed processing in practice becomes time consuming [13], and the use of AI can predict possible solutions based on those generated so far;
  • Estimation of the environmental impact indicator within LCA for prototypes, where it is difficult to predict costs for a large number of them [13], where the number of these prototypes depends on the combinations of criteria states; hence, the more combinations, the need to create extensive LCA models [82], therefore, the use of AI can generate LCA indicators according to a dozen or so estimated according to our approach;
  • At the same time, the limitation is the orientation of LCA results depending on one environmental burden criterion (in our case CO2 emissions); the use of machine learning and AI tools could facilitate the entire calculation process, including allowing LCA analysis to be carried out for more criteria;
  • Estimating the costs of prototypes, which is not very practical in the case of a large number of them, but it would be possible to develop nonparametric regression models for this purpose [13].
Overall, we plan to develop the proposed approach in the form of an artificial neural network model to predict favorable product solutions [82].

5. Conclusions

This article presents an innovative approach to product sustainability, or more precisely, product sustainability assessment based on life cycle, quality, and costs. Our approach extends the traditional (iterative) design thinking process, where we propose: (i) a systematic process of obtaining customer expectations in the form of surveys, (ii) processing these requirements using Pareto-Lorenz analysis to select the most important product criteria, (iii) based on them, a set of combinations of states of these criteria (current and modified) is created according to the author’s set of commands used in MATLAB, (iv) based on these combinations, we estimate the environmental impact indicator in the LCA of product prototypes, (v) we integrate it with the estimated cost of production in the cost-environmental analysis, (vi) finally, based on the obtained results, we select the most advantageous prototypes in terms of meeting customer requirements, environmentally friendly and cost-effective.
We present this approach using the example of vacuum cleaners for home and commercial use. Finally, we present our approach in comparison to traditional design thinking. We demonstrate that: (i) taking into account customers in the form of stakeholders who assess the importance of criteria allows for directing design activities to meet customer satisfaction, (ii) the advantage of our approach is its simplified form, providing qualitative and quantitative analysis of customer requirements for product criteria, including environmental impact and costs, (iii) this approach does not require the creation of extensive models as would be necessary in traditional LCSA, and (iv) it works effectively for a large set of alternative product solutions, including with limited access to detailed data, (v) this approach is adapted to dynamic estimation and modeling of results, including their integration (environment-cost) instead of extensive, time-consuming methods such as LCC.
The main additional advantages of our approach are as follows:
  • Extension of the iterative design thinking process by using an executive mechanism for development (regarding customers, LCA and production costs);
  • Providing and sending customer requests in the form of current and future results;
  • Efficient identification of key product criteria that are important for customers, thus providing a specific increase in their satisfaction;
  • Dynamic creation of different product solutions supported by computer software with an authorial algorithm, where these solutions are responsible for development;
  • Uncomplicated consideration of the prototype cost aspect in relation to hypothetically created derivative designs dependent on the quality and environmental aspect, which provides a simplified cost valuation and their modeling for a number of prototypes;
  • The issue of identifying different devices dependent on the quality, LCA and cost aspect;
  • Providing support to decision makers, e.g., the designer who implements the product development;
  • Reduction of waste by applying actions at the most advanced stage of development;
  • Modeling production data at a lower level (prototyping, conceptualization), where real data are often unavailable;
  • Supporting the development of enterprises in the field of distribution of offered products.
Compared to other decision support models, our proposed method for assessing sustainable development is distinguished by a systematic way of assessing products in a multi-aspect and multi-criteria approach, where each aspect is analyzed in depth using dedicated techniques. Decision-making models provide multi-criteria analyses, often also of different criteria. However, analysis using them is usually focused on the simultaneous consideration of a limited number of criteria (usually 7 +/− 2). It is possible to analyze alternative product solutions, but in MCDM it is difficult to conduct analyses for combinations of different product solutions. This is possible using our method. It is important to mention that although our method does not have a nested MCDM technique, the overall process is based on making multi-criteria decisions. In the future, it is planned to consider supporting this method with other techniques, including techniques from the MCDM group.
In the application of method of taking into account only key quality criteria. Prototype ranking based on prototypes on the environment and costs. In the previous methods of application either only quality criteria or quality and control criteria. The traditional solution generated additional solutions, and by making access to results and solutions difficult. The proposed method of limiting the original prototype variants through analysis becomes clearer and is more easily dependent on decisions. The introduction of the number of analyzed quality criteria to only the limitation from the customer’s point of view causes the number of hypothetical (variants) prototypes to radically decrease in the detailed application of the method.
Toward future research, we plan to develop our approach within the framework of developing simple software. It should be adapted to different products, hence further tests of the method are planned. This software could take into account the previously mentioned assumptions within the framework of AI. Then it could successfully provide the possibility of adaptation and have significance in the constantly changing area of sustainable product development. Now, the approach to assessing product sustainability based on life cycle, quality, and costs presented by us can be used successfully by managers and designers at the early stages of product development (conceptualization). It will find a particular application for common and frequently used products to dynamically predict the direction of their development, including complex products, for which the area of improvement activities should be limited to the key. In this case, the focus is on maximizing customer requirements and minimizing the negative environmental impact at optimal costs. This approach may be particularly applicable to SMEs, where such solutions are sought as part of sustainable product development.

Author Contributions

Conceptualization, D.S. and A.P.; methodology, D.S. and A.P.; software, D.S. and A.P.; validation, D.S. and A.P.; formal analysis, D.S. and A.P.; investigation, D.S. and A.P.; resources, D.S. and A.P.; data curation, D.S. and A.P.; writing—original draft preparation, D.S. and A.P.; writing—review and editing, D.S. and A.P.; visualization, D.S. and A.P.; supervision, D.S. and A.P.; project administration, D.S. and A.P.; funding acquisition, D.S. and A.P. All authors have read and agreed to the published version of the manuscript.

Funding

This research received no external funding.

Institutional Review Board Statement

Not applicable.

Informed Consent Statement

Not applicable.

Data Availability Statement

Dataset available on request from the authors.

Conflicts of Interest

The authors declare no conflicts of interest.

References

  1. Sharma, A. Product Design and Development Using Artificial Intelligence (AI) Techniques: A Review. engrXiv 2023. [Google Scholar] [CrossRef]
  2. Altaf, A.; Khan, I.; Khan, A.; Sadiq, S.; Humayun, M.; Khan, S.; Zaman, S.; Khan, A.; Abumousa, R.A.; Bououdina, M. Metal/Covalent Organic Framework Encapsulated Lead-Free Halide Perovskite Hybrid Nanocatalysts: Multifunctional Applications, Design, Recent Trends, Challenges, and Prospects. ACS Omega 2024, 9, 34220–34242. [Google Scholar] [CrossRef] [PubMed]
  3. Khan, I.; Altaf, A.; Sadiq, S.; Khan, S.; Khan, A.; Khan, S.; Humayun, M.; Khan, A.; Abumousa, R.A.; Bououdina, M. Towards Sustainable Solutions: Comprehensive Review of Advanced Porous Materials for CO2 Capture, Hydrogen Generation, Pollutant Degradation, and Energy Application. Chem. Eng. J. Adv. 2025, 21, 100691. [Google Scholar] [CrossRef]
  4. Yang, C.; Xu, T.; Ye, J. Applying TRIZ and Kansei Engineering to the Eco-Innovative Product Design towards Waste Recycling with Latent Dirichlet Allocation Topic Model Analysis. Eng. Appl. Artif. Intell. 2024, 133, 107962. [Google Scholar] [CrossRef]
  5. Chen, X.; Zhang, C. A Dynamic Analysis of a Green Closed-Loop Supply Chain with Different on-Line Platform Smart Recycling and Selling Models. Comput. Ind. Eng. 2025, 200, 110748. [Google Scholar] [CrossRef]
  6. Valdivia, S.; Backes, J.G.; Traverso, M.; Sonnemann, G.; Cucurachi, S.; Guinée, J.B.; Schaubroeck, T.; Finkbeiner, M.; Leroy-Parmentier, N.; Ugaya, C.; et al. Principles for the Application of Life Cycle Sustainability Assessment. Int. J. Life Cycle Assess. 2021, 26, 1900–1905. [Google Scholar] [CrossRef]
  7. Proske, M.; Finkbeiner, M. Obsolescence in LCA–Methodological Challenges and Solution Approaches. Int. J. Life Cycle Assess. 2020, 25, 495–507. [Google Scholar] [CrossRef]
  8. Germani, M.; Gregori, F.; Luzi, A.; Mengarelli, M. Assessing Social Sustainability of Products: An Improved S-LCA Method. In Proceedings of the Product Lifecycle Management in the Era of Internet of Things: 12th IFIP WG 5.1 International Conference, PLM 2015, Doha, Qatar, 19–21 October 2015; Springer International Publishing: Berlin/Heidelberg, Germany, 2016; pp. 529–540. [Google Scholar]
  9. Klöpffer, W.; Ciroth, A. Is LCC Relevant in a Sustainability Assessment? Int. J. Life Cycle Assess. 2011, 16, 99–101. [Google Scholar] [CrossRef]
  10. Sakao, T.; Lindahl, M. A Method to Improve Integrated Product Service Offerings Based on Life Cycle Costing. CIRP Annals 2015, 64, 33–36. [Google Scholar] [CrossRef]
  11. Kambanou, M.L. Life Cycle Costing: Understanding How It Is Practised and Its Relationship to Life Cycle Management—A Case Study. Sustainability 2020, 12, 3252. [Google Scholar] [CrossRef]
  12. Park, J.-H.; Seo, K.-K.; Wallace, D.; Lee, K.-I. Approximate Product Life Cycle Costing Method for the Conceptual Product Design. CIRP Annals 2002, 51, 421–424. [Google Scholar] [CrossRef]
  13. Liu, H.; Gopalkrishnan, V.; Quynh, K.T.N.; Ng, W.-K. Regression Models for Estimating Product Life Cycle Cost. J. Intell. Manuf. 2009, 20, 401–408. [Google Scholar] [CrossRef]
  14. Huertas-Valdivia, I.; Ferrari, A.M.; Settembre-Blundo, D.; García-Muiña, F.E. Social Life-Cycle Assessment: A Review by Bibliometric Analysis. Sustainability 2020, 12, 6211. [Google Scholar] [CrossRef]
  15. Lehmann, A.; Zschieschang, E.; Traverso, M.; Finkbeiner, M.; Schebek, L. Social Aspects for Sustainability Assessment of Technologies—Challenges for Social Life Cycle Assessment (SLCA). Int. J. Life Cycle Assess. 2013, 18, 1581–1592. [Google Scholar] [CrossRef]
  16. Vacuum Cleaners: Ecodesign Requirements Apply to This Product. Available online: https://energy-efficient-products.ec.europa.eu/product-list/vacuum-cleaners_en (accessed on 8 April 2025).
  17. Bachmann, T.M.; van der Kamp, J.; Bianchi, M.; Pihkola, H.; Saavedra del Oso, M. Life Cycle Costing as Part of a Life Cycle Sustainability Assessment of Products: Methodology and Case Studies. Int. J. Life Cycle Assess. 2024, 29, 1863–1879. [Google Scholar] [CrossRef]
  18. Pacana, A.; Siwiec, D. Analysis of the Possibility of Used of the Quality Management Techniques with Non-Destructive Testing. Teh. Vjesn. Tech. Gaz. 2021, 28, 45–51. [Google Scholar] [CrossRef]
  19. Nagaraj, V.; Berente, N.; Lyytinen, K.; Gaskin, J. Team Design Thinking, Product Innovativeness, and the Moderating Role of Problem Unfamiliarity. J. Prod. Innov. Manag. 2020, 37, 297–323. [Google Scholar] [CrossRef]
  20. Seidel, V.P.; Fixson, S.K. Adopting Design Thinking in Novice Multidisciplinary Teams: The Application and Limits of Design Methods and Reflexive Practices. J. Prod. Innov. Manag. 2013, 30, 19–33. [Google Scholar] [CrossRef]
  21. Liedtka, J. Putting Technology in Its Place: Design Thinking’s Social Technology at Work. Calif. Manag. Rev. 2020, 62, 53–83. [Google Scholar] [CrossRef]
  22. Arvidsson, R.; Tillman, A.; Sandén, B.A.; Janssen, M.; Nordelöf, A.; Kushnir, D.; Molander, S. Environmental Assessment of Emerging Technologies: Recommendations for Prospective LCA. J. Ind. Ecol. 2018, 22, 1286–1294. [Google Scholar] [CrossRef]
  23. Adrianto, L.R.; Ciacci, L.; Pfister, S.; Hellweg, S. Toward Sustainable Reprocessing and Valorization of Sulfidic Copper Tailings: Scenarios and Prospective LCA. Sci. Total Environ. 2023, 871, 162038. [Google Scholar] [CrossRef] [PubMed]
  24. Chen, S.; Venkatesh, A. An Investigation of How Design-Oriented Organisations Implement Design Thinking. J. Mark. Manag. 2013, 29, 1680–1700. [Google Scholar] [CrossRef]
  25. Siwiec, D.; Pacana, A.; Gazda, A. A New QFD-CE Method for Considering the Concept of Sustainable Development and Circular Economy. Energies 2023, 16, 2474. [Google Scholar] [CrossRef]
  26. Veillette, M.; Knibbs, L.D.; Pelletier, A.; Charlebois, R.; Blais Lecours, P.; He, C.; Morawska, L.; Duchaine, C. Microbial Contents of Vacuum Cleaner Bag Dust and Emitted Bioaerosols and Their Implications for Human Exposure Indoors. Appl. Environ. Microbiol. 2013, 79, 6331–6336. [Google Scholar] [CrossRef]
  27. Gallego-Schmid, A.; Mendoza, J.M.F.; Jeswani, H.K.; Azapagic, A. Life Cycle Environmental Impacts of Vacuum Cleaners and the Effects of European Regulation. Sci. Total Environ. 2016, 559, 192–203. [Google Scholar] [CrossRef]
  28. Trakumas, S.; Willeke, K.; Grinshpun, S.A.; Reponen, T.; Mainelis, G.; Friedman, W. Particle Emission Characteristics of Filter-Equipped Vacuum Cleaners. AIHAJ Am. Ind. Hyg. Assoc. 2001, 62, 482–493. [Google Scholar] [CrossRef]
  29. Trakumas, S.; Willeke, K.; Reponen, T.; Grinshpun, S.A.; Friedman, W. Comparison of Filter Bag, Cyclonic, and Wet Dust Collection Methods in Vacuum Cleaners. AIHAJ Am. Ind. Hyg. Assoc. 2001, 62, 573–583. [Google Scholar] [CrossRef]
  30. Lioy, P.J.; Wainman, T.; Zhang, J.; Goldsmith, S. Typical Household Vacuum Cleaners: The Collection Efficiency and Emissions Characteristics for Fine Particles. J. Air Waste Manag. Assoc. 1999, 49, 200–206. [Google Scholar] [CrossRef]
  31. Vicente, E.D.; Vicente, A.M.; Evtyugina, M.; Calvo, A.I.; Oduber, F.; Blanco Alegre, C.; Castro, A.; Fraile, R.; Nunes, T.; Lucarelli, F.; et al. Impact of Vacuum Cleaning on Indoor Air Quality. Build. Environ. 2020, 180, 107059. [Google Scholar] [CrossRef]
  32. Shen, Y.; Zhou, J.; Pantelous, A.A.; Liu, Y.; Zhang, Z. A Voice of the Customer Real-Time Strategy: An Integrated Quality Function Deployment Approach. Comput. Ind. Eng. 2022, 169, 108233. [Google Scholar] [CrossRef]
  33. Sakao, T. A QFD-Centred Design Methodology for Environmentally Conscious Product Design. Int. J. Prod. Res. 2007, 45, 4143–4162. [Google Scholar] [CrossRef]
  34. Hassan, A.; Siadat, A.; Dantan, J.-Y.; Martin, P. Conceptual Process Planning—An Improvement Approach Using QFD, FMEA, and ABC Methods. Robot. Comput. Integr. Manuf. 2010, 26, 392–401. [Google Scholar] [CrossRef]
  35. Gong, X.; Guo, Z.; Xie, Z. Using Kansei Engineering for the Design Thinking Framework: Bamboo Pen Holder Product Design. Sustainability 2022, 14, 10556. [Google Scholar] [CrossRef]
  36. Yamagishi, K.; Seki, K.; Nishimura, H. Requirement Analysis Considering Uncertain Customer Preference for Kansei Quality of Product. J. Adv. Mech. Des. Syst. Manuf. 2018, 12, JAMDSM0034. [Google Scholar] [CrossRef]
  37. Yamakawa, E.K.; Aoki, A.R.; Siebert, L.C.; Klinguelfus, G.; Cauchick Miguel, P.A. A Fuzzy-QFD Decision Making Approach for Selecting Industry Energy Efficiency Indicators. In Proceedings of the 2013 IEEE PES Conference on Innovative Smart Grid Technologies (ISGT Latin America), Sao Paulo, Brazil, 15–17 April 2013; pp. 1–5. [Google Scholar]
  38. Willeke, K.; Trakumas, S.; Grinshpun, S.A.; Reponen, T.; Trunov, M.; Friedman, W. Test Methods for Evaluating the Filtration and Particulate Emission Characteristics of Vacuum Cleaners. AIHAJ Am. Ind. Hyg. Assoc. 2001, 62, 313–321. [Google Scholar] [CrossRef]
  39. Kumar, S.; Wing, W.; Lee, H. Psychoacoustic Analysis of Vacuum Cleaner Noise. Acoustics 2021, 3, 545–558. [Google Scholar] [CrossRef]
  40. Čudina, M.; Prezelj, J. Noise Generation by Vacuum Cleaner Suction Units. Part III. Contribution of Structure-Borne Noise to Total Sound Pressure Level. Appl. Acoust. 2007, 68, 521–537. [Google Scholar] [CrossRef]
  41. Sullivan, G.M.; Artino, A.R. Analyzing and Interpreting Data From Likert-Type Scales. J. Grad. Med. Educ. 2013, 5, 541–542. [Google Scholar] [CrossRef]
  42. Solis, D.; Hutchinson, D.; Longnecker, N. Visual Discrete Format: An Alternative to Likert-Type Formats of Survey Items Sensitive Enough to Measure Small Changes in Stable Constructs Such as Self-Concept in Science. Int. J. Cogn. Res. Sci. Eng. Educ. (IJCRSEE) 2022, 10, 1–16. [Google Scholar] [CrossRef]
  43. Joshi, A.; Kale, S.; Chandel, S.; Pal, D. Likert Scale: Explored and Explained. Br. J. Appl. Sci. Technol. 2015, 7, 396–403. [Google Scholar] [CrossRef]
  44. Siwiec, D.; Pacana, A. A Pro-Environmental Method of Sample Size Determination to Predict the Quality Level of Products Considering Current Customers’ Expectations. Sustainability 2021, 13, 5542. [Google Scholar] [CrossRef]
  45. Aliaga, C. Statistics in Focus: Population and Social Conditions. How Is the Time of Women and Men Distributed in Europe? Eurostat: Luxembourg, 2006. [Google Scholar]
  46. Su, C.; Zha, X.; Ma, J.; Li, B.; Wang, X. Dynamic Optimal Control Strategy of CCUS Technology Innovation in Coal Power Stations Under Environmental Protection Tax. Systems 2025, 13, 193. [Google Scholar] [CrossRef]
  47. Hoła, A.; Sawicki, M.; Szóstak, M. Methodology of Classifying the Causes of Occupational Accidents Involving Construction Scaffolding Using Pareto-Lorenz Analysis. Appl. Sci. 2018, 8, 48. [Google Scholar] [CrossRef]
  48. Lestyánszka Škůrková, K.; Fidlerová, H.; Niciejewska, M.; Idzikowski, A. Quality Improvement of the Forging Process Using Pareto Analysis and 8D Methodology in Automotive Manufacturing: A Case Study. Standards 2023, 3, 84–94. [Google Scholar] [CrossRef]
  49. Mu, E.; Pereyra-Rojas, M. Practical Decision Making, 1st ed.; Springer International Publishing: Cham, Switzerland, 2017; Volume 1, ISBN 978-3-319-33860-6. [Google Scholar]
  50. Ostasz, G.; Siwiec, D.; Pacana, A. Model to Determine the Best Modifications of Products with Consideration Customers’ Expectations. Energies 2022, 15, 8102. [Google Scholar] [CrossRef]
  51. Siwiec, D.; Bednárová, L.; Pacana, A.; Zawada, M.; Rusko, M. Decision Support in the Selection of Fluorescent Penetrants for Industrial Non-Destructive Testing. Przemysł Chem. 2019, 1, 92–94. [Google Scholar] [CrossRef]
  52. Pacana, A.; Siwiec, D.; Bednárová, L.; Petrovský, J. Improving the Process of Product Design in a Phase of Life Cycle Assessment (LCA). Processes 2023, 11, 2579. [Google Scholar] [CrossRef]
  53. Chevalier, J.L.; Le Téno, J.F. Requirements for an LCA-Based Model for the Evaluation of the Environmental Quality of Building Products. Build. Environ. 1996, 31, 487–491. [Google Scholar] [CrossRef]
  54. Lagerstedt, J.; Luttropp, C.; Lindfors, L.-G. Functional Priorities in LCA and Design for Environment. Int. J. Life Cycle Assess. 2003, 8, 160–166. [Google Scholar] [CrossRef]
  55. Zhu, X.; Tian, Y.; Wang, S. Comparing Two Types of Mainstream Disposable Lunch Boxes by LCA and Exploring the Possibility of Converting Carbon Dioxide into Products. Heliyon 2023, 9, e13480. [Google Scholar] [CrossRef]
  56. Chang, H.; Khan, I.; Yuan, A.; Khan, S.; Sadiq, S.; Khan, A.; Shah, S.A.; Chen, L.; Humayun, M.; Usman, M. Polyarylimide-Based COF/MOF Nanoparticle Hybrids for CO 2 Conversion, Hydrogen Generation, and Organic Pollutant Degradation. ACS Appl. Nano Mater. 2024, 7, 10451–10465. [Google Scholar] [CrossRef]
  57. Khan, A.; Sadiq, S.; Khan, I.; Humayun, M.; Jiyuan, G.; Usman, M.; Khan, A.; Khan, S.; Alanazi, A.F.; Bououdina, M. Preparation of Visible-Light Active MOFs-Perovskites (ZIF-67/LaFeO3) Nanocatalysts for Exceptional CO2 Conversion, Organic Pollutants and Antibiotics Degradation. Heliyon 2024, 10, e27378. [Google Scholar] [CrossRef] [PubMed]
  58. Grenz, J.; Ostermann, M.; Käsewieter, K.; Cerdas, F.; Marten, T.; Herrmann, C.; Tröster, T. Integrating Prospective LCA in the Development of Automotive Components. Sustainability 2023, 15, 10041. [Google Scholar] [CrossRef]
  59. Bisinella, V.; Christensen, T.H.; Astrup, T.F. Future Scenarios and Life Cycle Assessment: Systematic Review and Recommendations. Int. J. Life Cycle Assess. 2021, 26, 2143–2170. [Google Scholar] [CrossRef]
  60. Gao, L.; Wang, Z.; Wang, Y.; Peng, T.; Liu, W.; Tang, R. LCA-Based Multi-Scenario Study on Steel or Aluminum Wheel Hub for Passenger Vehicles. Procedia CIRP 2023, 116, 191–196. [Google Scholar] [CrossRef]
  61. Bianco, I.; Panepinto, D.; Zanetti, M. End-of-Life Tyres: Comparative Life Cycle Assessment of Treatment Scenarios. Appl. Sci. 2021, 11, 3599. [Google Scholar] [CrossRef]
  62. Gallego-Schmid, A.; Jeswani, H.K.; Mendoza, J.M.F.; Azapagic, A. Life Cycle Environmental Evaluation of Kettles: Recommendations for the Development of Eco-Design Regulations in the European Union. Sci. Total Environ. 2018, 625, 135–146. [Google Scholar] [CrossRef]
  63. Mancini, M.S.; Galli, A.; Niccolucci, V.; Lin, D.; Bastianoni, S.; Wackernagel, M.; Marchettini, N. Ecological Footprint: Refining the Carbon Footprint Calculation. Ecol. Indic. 2016, 61, 390–403. [Google Scholar] [CrossRef]
  64. Lakusic, S. Variants of Determining the Construction Production Carbon Footprint. J. Croat. Assoc. Civ. Eng. 2023, 75, 273–281. [Google Scholar] [CrossRef]
  65. Pacana, A.; Siwiec, D.; Bednárová, L. Method of Choice: A Fluorescent Penetrant Taking into Account Sustainability Criteria. Sustainability 2020, 12, 5854. [Google Scholar] [CrossRef]
  66. Kolman, R. Quality Engineering; PWE: Warsaw, Poland, 1992. (In Polish) [Google Scholar]
  67. Gajdzik, B.; Siwiec, D.; Wolniak, R.; Pacana, A. Approaching Open Innovation in Customization Frameworks for Product Prototypes with Emphasis on Quality and Life Cycle Assessment (QLCA). J. Open Innov. Technol. Mark. Complex. 2024, 10, 100268. [Google Scholar] [CrossRef]
  68. Luotola, H.; Hellström, M.; Gustafsson, M.; Perminova-Harikoski, O. Embracing Uncertainty in Value-Based Selling by Means of Design Thinking. Ind. Mark. Manag. 2017, 65, 59–75. [Google Scholar] [CrossRef]
  69. Li, W.-T.; Ho, M.-C.; Yang, C. A Design Thinking-Based Study of the Prospect of the Sustainable Development of Traditional Handicrafts. Sustainability 2019, 11, 4823. [Google Scholar] [CrossRef]
  70. Rösch, N.; Tiberius, V.; Kraus, S. Design Thinking for Innovation: Context Factors, Process, and Outcomes. Eur. J. Innov. Manag. 2023, 26, 160–176. [Google Scholar] [CrossRef]
  71. Halvorsen, K. Team Decision Making in the Workplace. J. Appl. Linguist. Prof. Pract. 2013, 7, 273–296. [Google Scholar] [CrossRef]
  72. Nakata, C. Design Thinking for Innovation: Considering Distinctions, Fit, and Use in Firms. Bus. Horiz. 2020, 63, 763–772. [Google Scholar] [CrossRef]
  73. Liedtka, J. Innovative Ways Companies Are Using Design Thinking. Strategy Leadersh. 2014, 42, 40–45. [Google Scholar] [CrossRef]
  74. Elsbach, K.D.; Stigliani, I. Design Thinking and Organizational Culture: A Review and Framework for Future Research. J. Manag. 2018, 44, 2274–2306. [Google Scholar] [CrossRef]
  75. Micheli, P.; Wilner, S.J.S.; Bhatti, S.H.; Mura, M.; Beverland, M.B. Doing Design Thinking: Conceptual Review, Synthesis, and Research Agenda. J. Prod. Innov. Manag. 2019, 36, 124–148. [Google Scholar] [CrossRef]
  76. Boons, F.; Montalvo, C.; Quist, J.; Wagner, M. Sustainable Innovation, Business Models and Economic Performance: An Overview. J. Clean. Prod. 2013, 45, 1–8. [Google Scholar] [CrossRef]
  77. Siwiec, D.; Gajdzik, B.; Gawlik, R.; Wolniak, R.; Pacana, A. Open Eco-Innovations in Sustainable Product Development: Model Framework of Design Thinking in Quality Life Cycle Assessment (DT-QLCA). J. Open Innov. Technol. Mark. Complex. 2025, 11, 100480. [Google Scholar] [CrossRef]
  78. Luthin, A.; Traverso, M.; Crawford, R.H. Circular Life Cycle Sustainability Assessment: An Integrated Framework. J. Ind. Ecol. 2024, 28, 41–58. [Google Scholar] [CrossRef]
  79. Kloepffer, W. Life Cycle Sustainability Assessment of Products. Int. J. Life Cycle Assess. 2008, 13, 89–95. [Google Scholar] [CrossRef]
  80. Seo, K.-K.; Park, J.-H.; Jang, D.-S.; Wallace, D. Approximate Estimation of the Product Life Cycle Cost Using Artificial Neural Networks in Conceptual Design. Int. J. Adv. Manuf. Technol. 2002, 19, 461–471. [Google Scholar] [CrossRef]
  81. Asiedu, Y.; Gu, P. Product Life Cycle Cost Analysis: State of the Art Review. Int. J. Prod. Res. 1998, 36, 883–908. [Google Scholar] [CrossRef]
  82. Seo, K.-K.; Park, J.-H.; Jang, D.-S.; Wallace, D. Prediction of the Life Cycle Cost Using Statistical and Artificial Neural Network Methods in Conceptual Product Design. Int. J. Comput. Integr. Manuf. 2002, 15, 541–554. [Google Scholar] [CrossRef]
  83. Park, P.-J.; Tahara, K.; Inaba, A. Product Quality-Based Eco-Efficiency Applied to Digital Cameras. J. Environ. Manag. 2007, 83, 158–170. [Google Scholar] [CrossRef]
  84. Manco, P.; Caterino, M.; Rinaldi, M.; Fera, M. Additive Manufacturing in Green Supply Chains: A Parametric Model for Life Cycle Assessment and Cost. Sustain. Prod. Consum. 2023, 36, 463–478. [Google Scholar] [CrossRef]
  85. Bonilla-Alicea, R.J.; Fu, K. Evaluation of a Challenge-Derived Social Life Cycle Assessment (S-LCA) Framework. Int. J. Sustain. Eng. 2021, 14, 1680–1697. [Google Scholar] [CrossRef]
  86. Kühnen, M.; Hahn, R. Indicators in Social Life Cycle Assessment: A Review of Frameworks, Theories, and Empirical Experience. J. Ind. Ecol. 2017, 21, 1547–1565. [Google Scholar] [CrossRef]
  87. Dubois-Iorgulescu, A.-M.; Saraiva, A.K.E.B.; Valle, R.; Rodrigues, L.M. How to Define the System in Social Life Cycle Assessments? A Critical Review of the State of the Art and Identification of Needed Developments. Int. J. Life Cycle Assess. 2018, 23, 507–518. [Google Scholar] [CrossRef]
  88. Rezaei Kalvani, S.; Sharaai, A.H.; Abdullahi, I.K. Social Consideration in Product Life Cycle for Product Social Sustainability. Sustainability 2021, 13, 11292. [Google Scholar] [CrossRef]
  89. Manik, Y.; Leahy, J.; Halog, A. Social Life Cycle Assessment of Palm Oil Biodiesel: A Case Study in Jambi Province of Indonesia. Int. J. Life Cycle Assess. 2013, 18, 1386–1392. [Google Scholar] [CrossRef]
  90. Ghimire, R.; Raji, A. Use of Artificial Intelligence in Design, Development, Additive Manufacturing, and Certification of Multifunctional Composites for Aircraft, Drones, and Spacecraft. Appl. Sci. 2024, 14, 1187. [Google Scholar] [CrossRef]
Figure 1. Design for sustainable product development concept based on quality, LCA, and costs.
Sustainability 17 03430 g001
Figure 2. Interpretation of the importance of vacuum cleaner criteria according to customers supported by Pareto analysis.
Sustainability 17 03430 g002
Figure 3. Example of: (a) an algorithm; (b) a set of commands generating all possible combinations of vacuum cleaner criterion states initialized in Matlab.
Sustainability 17 03430 g003
Figure 4. System boundary.
Sustainability 17 03430 g004
Figure 5. Classification of vacuum cleaner prototypes according to the cost–environmental indicator, where red dots are values of indicator, and blue lines are level of satisfaction.
Sustainability 17 03430 g005
Table 1. Literature review of studies where vacuum cleaners were the subject of research.
StudyPurpose and Scope
of the Research
Research MethodMain ResultsMentioned Quality
Criteria
[26]Assessment of bioaerosol emissions in different vacuum cleanersCollection and analysis of air samples in an experimental flow tunnel with operating vacuum cleaners, including testing their emissions from closed-surface cassettes as well as testing dust from a dust bagEmission of bacteria and molds (Penicillium/Aspergillus) significant (even 1 × 10⁵ Eq. cells/min), content of bacteria and molds in bag dust consistent, where most of the bacteria come from humans, and vacuum cleaners can spread significant amounts of molds and bacteria of human origin, including being a source of exposure to bioaerosolsVacuum cleaner bag, e.g., vacuum, HEPA dust filter,
Hose (suction tube), attachments, method of switching on and off (automatic start/stop), vacuum in the suction tube, purchase price
[38]Evaluation of the overall filtration efficiency of a vacuum cleanerFiltration analysis by placing the vacuum cleaner in a test chamber where the aerosol concentration was measured at the chamber inlet and outletOverall efficiency 100% for industrial vacuum cleaners and most mid-range and high-end home vacuum cleanersDust filter, e.g., HEPA or other, installed in the outlet, purchase price, outlet pipe, tank capacity, negative pressure in the suction pipe
[27]Assessment of the environmental impact of vacuum cleaners in LCA and the effects of implementing the provisions of the Directive on Waste Electrical and Electronic Equipment (WEEE) at European levelEcodesign analysis of the environmental impact of vacuum cleaners, including decarbonization of electricity, product lifespan and end-of-life disposal optionsThe implementation of the Ecodesign Regulation reduced the environmental impact of vacuum cleaners by approximately 37–44% compared to the areas of analysis consideredHose (suction tube),
bag type (disposable, bagless), engine power, power cables and wires, dust filter type, sockets and plugs,
rubber protectors to protect furniture from knocking, accessories (e.g., brushes)
[28]Evaluation of filtration efficiency of industrial and household vacuum cleanersStudies on the evaluation of cleaning efficiency when using a HEPA filter in industrial and household vacuum cleanersSimilar performance of vacuum cleaners, where household vacuum cleaners equipped with a final HEPA filter effectively collect about 100% of dry dust sucked in by the nozzle, however, industrial vacuum cleaners were more efficient on wet surfacesPurchase price, Hepa dust filter type, bag type, vacuum in the suction pipe, engine power, suction pipe diameter
[29]Development of a comparative assessment method for dust collection methods used in vacuum cleanersA method dedicated to the comparison of filter bag, cyclone and wet primary dust collection, where dry aerosols were used,
non-hygroscopic test particles
Similar efficiency for dust collection methods: up to 50% for particles of 0.35 m and close to 100% for particles of 1.0 m and larger, where the degree of dependence of initial collection efficiency on airflow rate was strongly related to the type and manufacture of the main dust collectorDust filter type
[30]Testing of household vacuum cleaners for their fine particulate emission rate and collection efficiency in laboratory conditionsCarbon and Aerosol Engine Emissions Test Using HIAC/Royco 5130A Continuous Light Scattering as a Particle DetectorThe lowest particle emission rate was obtained for vacuum cleaners with a HEPA filter, where the filter was placed behind the vacuum cleaner bag and the motor in a sealed housingFilter type, bag type, suction pipe vacuum and engine power, price
[31]Vacuum cleaners (bagless, wet with bag and HEPA filter) were tested for mass emission factor and number of particulate matterChemical characterization of solid particles, including organic elements, carbon, metals, etc.Particulate matter emissions were significantly higher for vacuum operation (207 ± 99.0 μg min−1), than for bagless (86.1 ± 16.9 μg min−1) and filter vacuum cleaners (75.4 ± 7.89 μg min−1)Hepa filter, vacuum cleaner bag type
Table 2. Key qualitative criteria of vacuums cleaner based on the literature review.
Quality CriterionSource
Vacuum cleaner purchase price[26,28,30,38]
Negative pressure in the suction tube[26,27,28,30]
Vacuum cleaner motor power[27,28,29,30,38]
Power cord length[27]
Working range of the vacuum cleaner connected to the power cord[27]
Noise level during vacuum cleaner operation[39,40]
Power cord winding system[27]
Vacuum cleaner tank capacity[30,38]
Thermal protection (against overheating)Own elaboration based on catalogs of vacuum cleaner
Rubber protectors protecting furniture from knocking[27]
Number of accessories included with the vacuum cleaner (suction tubes and nozzles)[26]
Vacuum cleaner dust filter type[26,27,28,29,30,31,38]
Suction hose (suction tube) length[30]
Vacuum cleaner weightOwn elaboration based on catalogs of vacuum cleaner
Vacuum cleaner bag type[26,27,30,31,38]
Vacuum cleaner dimensionsOwn elaboration based on catalogs of vacuum cleaner
Vacuum cleaner under pressure control option in the operating handleOwn elaboration based on catalogs of vacuum cleaner
Vacuum cleaner wheel material typeOwn elaboration based on catalogs of vacuum cleaner
Electric brush socket[27]
Vacuum cleaner appearance/designOwn elaboration based on catalogs of vacuum cleaner
Vacuum cleaner on/off switch type[26]
Suction hose (suction tube) diameter[28,38]
Table 3. Inventory data for vacuum cleaner life cycle assessment.
Life Cycle StageValueSource
Raw material (main part and accessories)
polyvinylchloride, bulk polymerized341.34 gown estimate based on data from the Ecoinvent v3.10 database and [27]
polypropylene, granulate1104.85 gown estimate based on data from the Ecoinvent v3.10 database and [27]
polystyrene, general purpose1107.68 gAccording to data from the Ecoinvent v3.10 database
polyethylene, high density, granulate249.51 gown estimate based on data from the Ecoinvent v3.10 database and [27]
polyethylene, low density, granulate29.00 gaccording to data from the Ecoinvent v3.10 database
aluminum375.27 gown estimate based on data from the Ecoinvent v3.10 database and [27]
brass19.96 gown estimate based on data from the Ecoinvent v3.10 database and [27]
copper176.66 gown estimate based on data from the Ecoinvent v3.10 database and [27]
formaldehyde22.91 gaccording to data from the Ecoinvent v3.10 database
steel, low-alloyed, hot-rolled640.75 gown estimate based on data from the Ecoinvent v3.10 database and [27]
vinyl, acetate414.20 gown estimate based on data from the Ecoinvent v3.10 database and [27]
packaging (folding boxes, cardboard, polyethylene bags)901.27 gown estimate based on data from the Ecoinvent v3.10 database and [27]
Production
electricity (injection molding, metal stamping, screen printing)14.19 kWhaccording to data from the Ecoinvent v3.10 database
heat, central or small-scale natural gas (injection molding, metal stamping)17.13 kWhaccording to data from the Ecoinvent v3.10 database
tap water12.97 lown estimate based on data from the Ecoinvent v3.10 database and [27]
Transport
transport, freight train 0.13   t · kmaccording to data from the Ecoinvent v3.10 database
transport, freight, light commercial vehicle 0.08   t · kmaccording to data from the Ecoinvent v3.10 database
transport, freight, lorry, unspecified 2.61   t · kmaccording to data from the Ecoinvent v3.10 database
transport, freight, sea, container ship 4.95   t · kmaccording to data from the Ecoinvent v3.10 database
Use
electricity320 kWhdirective 2009/125/EC of the European Parliament and of the Council with regard to ecodesign requirements for vacuum cleaners
three dimensions of the air filter380 gself-assessment based on [27]
End of Life
recycling (metals, plastics, packaging)2845.00 gself-assessment based on [27]
incineration with energy recovery (plastics, packaging)1367.00 gself-assessment based on [27]
landfilling (metals, plastics, packaging)1545.00 gself-assessment based on [27]
Table 4. Estimated changes in inventory data values resulting from changes to important vacuum cleaner criteria.
Life Cycle StageB1B2B3B4B5B6B7
Raw material (main part and accessories)
polyvinylchloride, bulk polymerized341.34341.34307.21341.34341.34337.93344.75
polypropylene, granulate1104.851104.851126.951104.851104.851071.71138
polystyrene, general purpose1107.681107.681129.831107.681107.681096.61118.76
polyethylene, high density, granulate249.51249.51249.51237.03261.99237.03261.99
polyethylene, low density, granulate292929.8727.5530.4527.5530.45
Aluminum371.52379.02386.53375.27375.27337.74412.8
Brass19.7620.1620.5618.9620.9619.3620.56
copper174.89178.43181.96167.83185.49171.36181.96
formaldehyde22.9122.9122.9122.9122.9122.9122.91
steel, low-alloyed, hot rolled653.57627.94647.16640.75640.75621.53659.97
vinyl, acetate414.2414.2414.2414.2414.2414.2414.2
packaging (folding boxes, cardboard, polyethylene bags)892.26910.28901.27901.27901.27874.23928.31
Production
electricity (injection molding, metal stamping, screen printing)14.1914.1914.1913.7614.6213.4814.9
heat, central or small-scale natural gas
(injection molding, metal stamping)
16.9617.316.9616.6217.6417.1317.13
tap water12.8413.1012.9712.5813.3612.8413.10
Transport
transport, freight train0.130.130.130.130.130.130.13
transport, freight, light commercial vehicle0.080.080.080.080.080.080.08
transport, freight, lorry, unspecified2.642.582.612.532.692.532.69
transport, freight, sea, container ship4.954.954.954.954.954.954.95
Use
electricity0.130.130.130.130.130.130.13
three dimensions of an air filter0.080.080.080.080.080.080.08
End of Life
recycling (metals, plastics, packaging)2816.552873.452816.552674.303015.702475.153214.85
incineration with energy recovery (plastics, packaging)1339.661394.341380.671367.001367.001339.661394.34
landfilling (metals, plastics, packaging)1529.551560.451529.551545.001545.001498.651591.35
Table 5. Fragment of the results of the cost–environmental analysis of vacuum cleaner prototypes.
No.12345678910
EI0.610.931.260.881.211.541.161.491.820.63
EI (%)613.2692.59125.6288.14121.17154.20116.04149.07182.1163.41
Cost (€)115.00138.38162.69135.10159.41183.73155.64179.95327.50116.90
ck0.191.491.301.531.321.191.341.211.801.84
k 1.000.910.810.920.820.730.840.740.160.99
E1.630.980.651.040.680.470.720.500.091.57
d0.690.050.030.520.030.020.040.020.000.68
c0.900.210.320.190.310.370.290.370.050.03
Rt0.700.600.780.700.750.930.720.900.990.59
Re0.720.950.871.030.880.810.890.820.691.15
Rd0.710.770.820.860.810.870.810.860.840.87
Rank545335184184421221
Table 6. Examples of studies using the LCC and main limitations of the method.
Examples of Research with LCCMentioned Limitations of LCCSource
Traditional use
of LCC
Excel and MATLAB R2021a based method and tool supporting the development of integrated product service offerings via LCC where interchangeability between products and services is appliedLack of widespread use of LCC in practice[10]
Using the LCC method to improve life cycle management (LCM)Despite the large number of tailored, case-specific methods, LCC is not widely used, and when it is used, it is not at the level of sophistication described in the published literature because practitioners tailor LCC methods individually[11]
Approximate life cycle costing to help evaluate different product concepts in the early stages of designImportant product criteria determined by statistical analysis, neural network algorithm supports LCC estimationLack of detailed information in the early stages of product development and time for detailed LCC for different design concepts[83]
Learning algorithms trained to use known characteristics of existing products to approximate the life cycle cost of new products without having to define new LCC modelsConflicting requirements in the early stages of product development, lack of detailed information, and limited ability to make quick decisions due to the need to develop parametric LCC models for a wide range of concepts or requirements[82]
Predictive models for product LCC during conceptual designDeveloped artificial neural network (ANN) model for predicting product LCCThe need to develop extensive LCC models, lack of access to detailed information that generates a lack of practicality in the use of LCC[80]
Empirical Study on the Performance of Nonparametric Regression Models for LCC EstimationDifficulty predicting costs for a large number of product prototypes[13]
LCC-based decision support modelsIntegration of LCC and LCA to determine economic and environmental production strategies, along with integration of monetary valuation of life cycle assessment (MLCA) to aggregate environmental impact categoriesCost flows in LCC do not always have a direct relationship with physical flows, where it is difficult to directly integrate LCC with LCA[10,84]
Table 7. Examples of studies using S-LCA and the main limitations of the method.
Examples of Research with S-LCAMentioned Limitations
of S-LCA
Source
Literature
Review on
S-LCA
Narrative review of works from 2006–2020 according to the Web of Science and Scopus databasesThere is a lack of attention paid to society and value chain actors and final consumer stakeholders[88]
Bibliometric analysis of works from 2003–2018The difficulty in quantifying data and the subjective nature of some social indicators[14]
Development of a new S-LCA frameworkS-LCA framework by systematic mapping, expert opinion gathering, evaluation by novice user surveyThe difficulty in quantifying data and the subjective nature of some social indicators[85]
S-LCA Case Study AnalysisConceptual analyses of how to define a product system and the implications of their different approaches, including a classification of the criteria usedConceptual analyzes of how to define a product system and the implications of their different approaches, including a classification of the criteria used[87]
Technology BenchmarkingThe complexity of social indicators means that there is a lack of guidance on which impact categories to include, including how to measure some effects[15]
Creating groups of social criteria within S-LCAAssessment of the quality of the social criterion on a seven-point Likert scale by stakeholdersMost social impact indicators are difficult to quantify[89]
Disclaimer/Publisher’s Note: The statements, opinions and data contained in all publications are solely those of the individual author(s) and contributor(s) and not of MDPI and/or the editor(s). MDPI and/or the editor(s) disclaim responsibility for any injury to people or property resulting from any ideas, methods, instructions or products referred to in the content.

