Article

Spatiotemporal Changes and Driving Analysis of Ecological Environmental Quality in the Qinghai Lake Basin

1
School of Economics and Management, Beijing Jiaotong University, Beijing 100044, China
2
School of Soil and Water Conservation, Beijing Forestry University, Beijing 100083, China
*
Author to whom correspondence should be addressed.
Sustainability 2025, 17(8), 3421; https://doi.org/10.3390/su17083421
Submission received: 17 January 2025 / Revised: 2 March 2025 / Accepted: 7 April 2025 / Published: 11 April 2025

Abstract

:
Taking Qinghai Lake Basin as the research object, the spatial and temporal variation characteristics of the remote sensing ecological index (RSEI) in Qinghai Lake Basin from 1986 to 2022 were analyzed, and the spatial distribution and driving factors of the RSEI are discussed. Methods: Using remote sensing technology and a geographic detector, combined with time series RSEI data, the main natural factors and human activity factors affecting ecological quality were studied. Conclusion: (1) In the past 30 years, the RSEI in Qinghai Lake Basin showed a significant upward trend, and the ecological quality continued to improve. The low RSEI region decreased, while the high RSEI region increased and was distributed more evenly. (2) Spatially, the RSEI changes significantly in the central and southeastern regions but little in the northern and western regions. (3) Height difference is the main factor affecting the RSEI, which affects the stability of the climate, vegetation, and ecosystem. (4) From 2000 to 2020, the impact of terrain and climate on the RSEI is significant, the impact of human activities on ecological quality is enhanced, and the impact of land use change on the RSEI has a potential negative impact. The findings highlight the importance of ecological restoration policies in promoting long-term ecological sustainability and the need for further research on the socio-economic impacts of human activities and provide a new perspective on the relationship between ecological health and sustainable development, providing guidance for improving environmental governance in vulnerable regions and promoting sustainable development.

1. Introduction

Sustainability is a critical global challenge that requires an integrated approach to balancing ecological, social, and economic factors. Ecological sustainability, particularly in vulnerable regions such as the Qinghai Lake Basin, plays a crucial role in ensuring long-term environmental stability. In recent years, the application of remote sensing technology in ecological environment monitoring has deepened [1,2]. The Remote Sensing Ecological Index (RSEI), as a comprehensive assessment tool, has been widely applied in regional ecological environment monitoring and analysis due to its advantages of rapid, real-time, and large-scale detection [3]. The RSEI, based on remote sensing data, is a composite index constructed using the first principal component (PC1) of four factors—green, wet, dry, and heat—through Principal Component Analysis (PCA) [4,5,6]. Although the first principal component may not fully capture all the complex changes in an ecosystem, it has been able to capture most of the major ecological features, especially in this study area where ecological changes are mainly dominated by a few key factors. We believe that, based on the existing methodology, the model can be further optimized by combining other techniques in the future to improve the accuracy and detail of ecological quality assessment. By combining remote sensing data with ecological indices, the RSEI can effectively reflect the ecological change trends in different regions and intuitively display the spatiotemporal dynamics of the ecological environment in the Qinghai Lake Basin. This not only provides scientific evidence for understanding the ecological quality change process in the basin but also offers important data support for formulating ecological protection and restoration policies.
The Qinghai Lake Basin, as a critical water source and biodiversity hotspot, is central to discussions of sustainable development in the region. By analyzing the trends in ecological quality, we aim to provide decision-makers with insights into the effectiveness of ecological restoration policies and the need for sustainable management strategies. This research is closely aligned with the goals of sustainability, as it addresses the measurement and monitoring of ecological changes while emphasizing the importance of policy-making and restoration efforts in promoting long-term ecological and socio-economic sustainability. This study builds upon previous research by employing the Remote Sensing Ecological Index (RSEI), which integrates multiple ecological components—greenness, wetness, dryness, and heat—into a single composite index. By combining these diverse factors, our study offers a more holistic view of the ecological quality of the Qinghai Lake Basin, addressing a gap in the current literature where isolated components of ecological monitoring are often examined without considering their interactions. Furthermore, while past studies have relied on relatively short time frames or specific geographic areas, this study utilizes a comprehensive dataset spanning over three decades (1986–2022), offering a more thorough analysis of long-term ecological trends in the region. Furthermore, the study’s findings are relevant for broader sustainability applications as they demonstrate the potential of remote sensing tools to quantify and monitor sustainability in other ecosystems that face similar challenges, such as those caused by climate change and unsustainable land use.
Google Earth Engine (GEE) is an open, free platform for research, education, and non-commercial use, which allows users to directly process data on the platform using its computational resources [7]. Additionally, datasets from satellite series such as Earth Observation Remote Sensing (EOS) are pre-processed, converting raw data into top-of-atmosphere reflectance and surface reflectance [8], enabling analysis without the need for specialized solar and atmospheric correction software. Compared to traditional tools, GEE is better suited for constructing the RSEI and conducting large-scale ecological quality assessments [9].
The environment is the fundamental guarantee for human survival and development, and a healthy ecological environment provides indispensable foundational conditions for the existence and progress of human society [10,11]. Therefore, ecological environment quality has become a global hotspot issue [12,13]. Wetlands, as one of the most important ecosystems on Earth, cover about 6% of the Earth’s surface but provide habitats for 20% of plant and animal species, playing a critically important ecological role. Wetlands in China account for approximately 10% of the global wetland area, ranking first in Asia and fourth in the world. However, in recent years, the combined pressures of human activities and climate change have led to significant reductions in wetland areas, with many wetland species, landscapes, and ecosystems facing the risk of extinction [14,15]. To address this, optimizing land-use planning in the Qinghai Lake Basin is crucial to ensure that sensitive ecological areas are prioritized for conservation while sustainable agricultural practices and eco-tourism are promoted in less ecologically sensitive areas. Furthermore, strengthening the delineation of ecological protection red lines around critical ecosystems, such as wetlands and grasslands, will ensure that these areas are protected from future development and degradation. The vital ecological functions of wetlands are also under severe threat. It is estimated that China loses about 20,000 hm2 of wetland area annually, with 40% of wetlands facing degradation threats. Therefore, the protection and restoration of wetland ecosystems have become key priorities in global environmental protection efforts, making the assessment of wetland ecological quality urgent. As one of China’s seven major wetlands [16,17], Qinghai Lake, known as the “humidifier” of the Qinghai–Tibet Plateau, plays an irreplaceable role in regulating the climate of the northwest region, maintaining ecological balance, conserving water resources, and protecting biodiversity. The ecological condition of Qinghai Lake directly impacts the ecological environment of the Qinghai–Tibet Plateau, making continuous monitoring and assessment of its ecological quality crucial. Ecological quality changes in the Qinghai Lake Basin are influenced by a complex interplay of factors, including climate change [13], land use changes, and human activities [14,18]. Therefore, researching the ecological quality changes and their driving mechanisms in this region, particularly through constructing a suitable ecological remote sensing index using remote sensing data, not only holds significant practical value but also provides critical support for regional ecological protection and scientific decision-making.

2. Materials and Methods
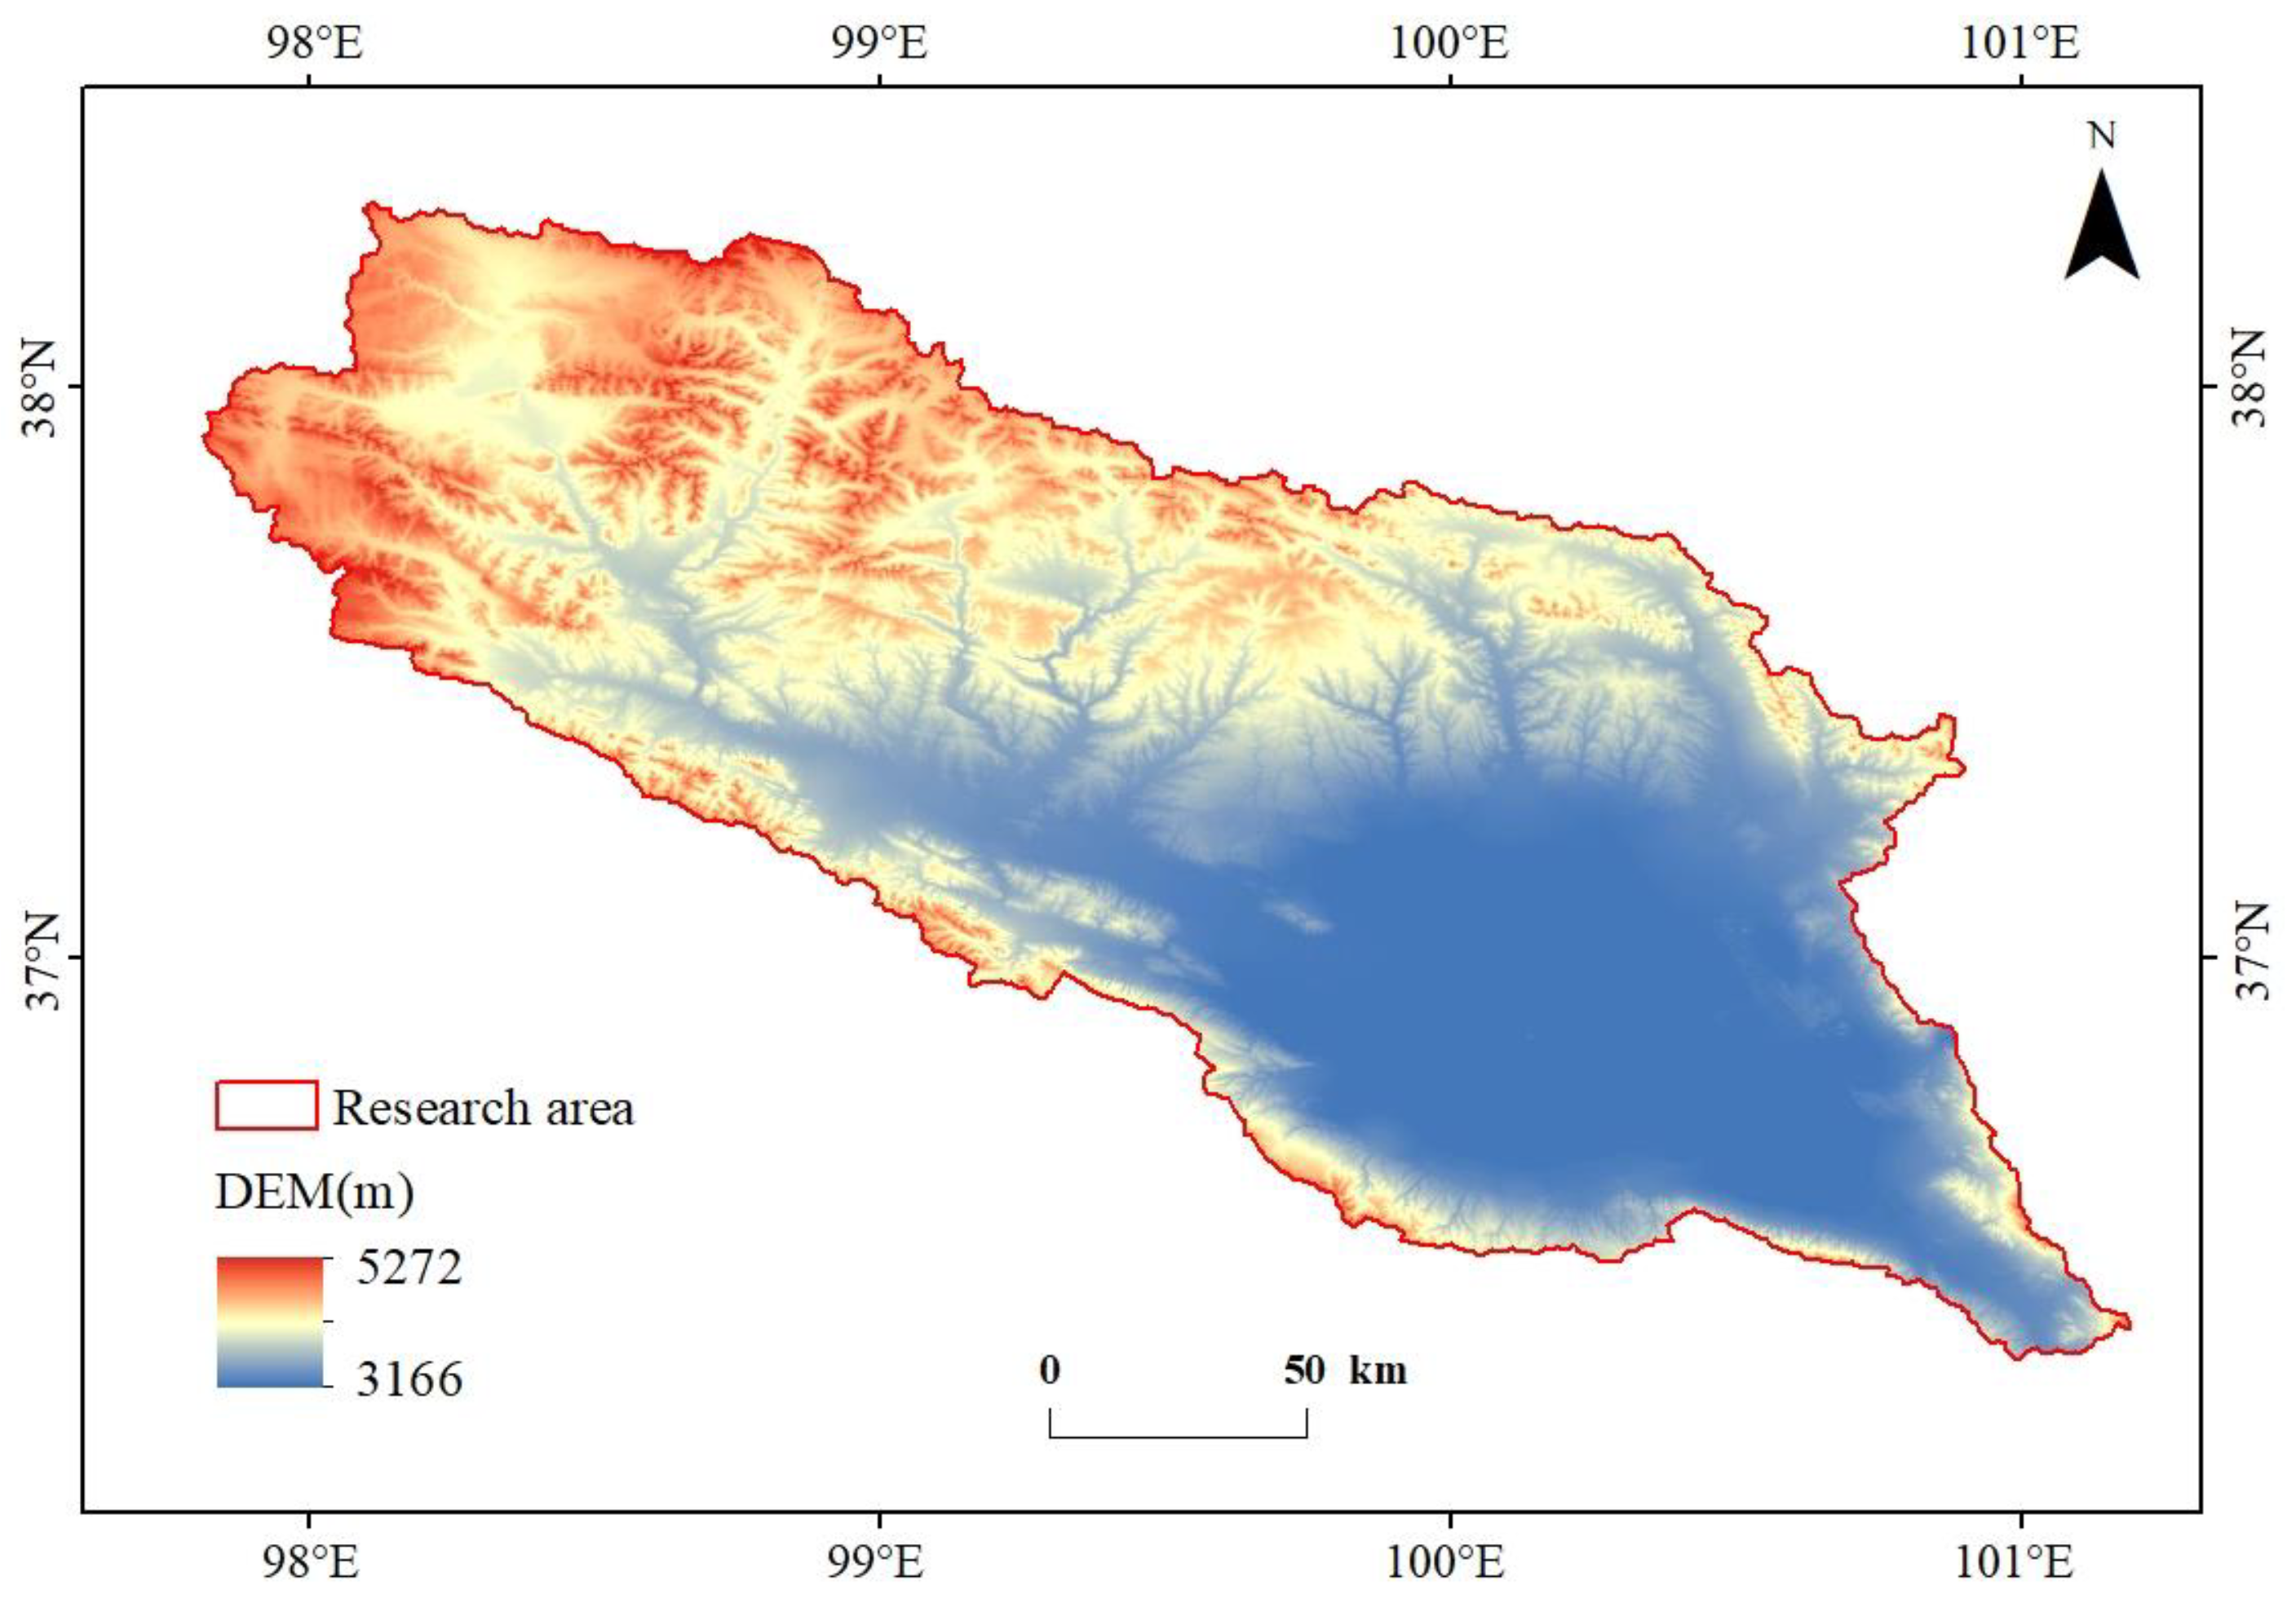
2.1. Study Area

The Qinghai Lake Basin is located on the northeastern edge of the Qinghai–Tibet Plateau, with geographic coordinates ranging from 97°50′ to 101°20′ east longitude and 36°15′ to 38°20′ north latitude, covering a total area of approximately 29,600 km2 (as shown in Figure 1). Qinghai Lake, situated within the basin, is the largest inland saline lake in China, with its surface area accounting for about 16% of the total basin area. In recent years, the surface area of Qinghai Lake has been steadily increasing. Currently, the main lake and its sub-lakes cover a total area of 4441.22 km2, and the lake contains two islands, Haixin Mountain and Sankeshi. In this study, the basin area is defined as the region excluding the lake’s surface area, which is approximately 25,000 km2.
The basin is located in the Qin–Qi–Kunlun tectonic fold zone, with a low-lying central area surrounded by mountains. The southeast is higher than the northwest, forming the typical Qinghai Lake Basin. The elevation ranges from 3036 m to 5298 m, with ridges exceeding 4500 m and the highest peak reaching 4472 m. The basin’s terrain is diverse, including plains, low mountains, middle mountains, and plateaus, with mountainous areas accounting for about two-thirds of the total area.
The climate in the basin is characterized as plateau semi-arid and cold, with drought, low rainfall, strong winds, and intense solar radiation. The annual average temperature ranges from −0.8 °C to 1.1 °C, with a significant day–night temperature difference. The average annual precipitation is between 327 and 423 mm, decreasing from southeast to northwest. The basin receives between 2430 and 3330 h of sunlight annually, with total solar radiation ranging from 607 to 720 KJ/cm2. Due to the vast water surface of Qinghai Lake, the surrounding temperature is relatively higher, and the frost-free period is longer. The basin is often affected by strong winds, and sandstorms occasionally occur.

2.2. Data Sources and Pre-Processing

As shown in Table 1, the data used in this study include Landsat 5/7/8 remote sensing images, annual average precipitation, annual average temperature, slope, aspect, elevation, land use, and population density. The data processing steps are as follows: On the GEE platform, Landsat 5-7-8 images for the target years (June to October, during the growing season) are first generated, and cloud removal is performed using the cloud-masking function. Simultaneously, the JRC Monthly Water History v1.4 data product is used to create a water body mask to minimize the influence of large water bodies on the load distribution of the humidity principal component. The cloud-free median composite image for the target year is then obtained.

2.3. Remote Sensing Ecological Indices

Based on the Remote Sensing Ecological Index ( R S E I ) theory proposed by Xu Hanqiu [5], the ecological environment quality is comprehensively reflected by calculating natural factor indicators such as greenness, humidity, dryness, and heat from satellite remote sensing images.
In this study, the expression for the Remote Sensing Ecological Index ( R S E I ) is as follows:
R S E I = f ( N D V I , W E T , N D B S I , L S T )
In this study, the greenness index is represented by the Normalized Difference Vegetation Index ( N D V I ), which measures the growth of surface vegetation; the humidity index is represented by the Wetness component ( W E T ) derived from the tasseled cap transformation; The dryness index is represented by the Normalized Difference Bare Soil Index ( N D B S I ), which combines the Built-up Index ( I B I ) and Soil Index ( S I ) to reflect the desiccation characteristics of surface buildings and bare soil. The temperature index is represented by the Land Surface Temperature ( L S T ) derived from remote sensing data, which intuitively reflects the surface thermal conditions. The specific calculation formulas for these indices are described in Table 2.

2.4. Research Methodology

2.4.1. Univariate Linear Trend Analysis and Mann–Kendall Trend Significance Test

The Theil–Sen Median Slope Estimation method is non-parametric [19] and has a high resistance to outliers, making it widely used for analyzing long-term trends in the RSEI. The results provided by this method can visually display the variations in the RSEI over a specific period. The calculation method is as follows:
β = M e d i a n x j x i j i ,  j > i
In the formula, x i and x j represent the maximum composite RSEI values for the i th and j-th years, respectively; Median represents the median calculation function. If the β value is positive, it indicates an increasing trend in the RSEI from 1986 to 2022. If the β value is negative, it indicates a decreasing trend in the RSEI during this period. The larger the absolute value of β, the more significant the trend in the RSEI changes.
The Mann–Kendall trend test is a statistical method used to analyze the temporal variation trends in time series data [20] and is suitable for non-normal data distributions, hydrological studies, and vegetation change research. In this study, the Mann–Kendall trend test is used to analyze the RSEI change trend in the Qinghai Lake Basin from 1986 to 2022. At a significance level of α, if Z > z 1 α / 2 , the change is considered significant; otherwise, the change is considered non-significant.

2.4.2. Geodetector

The Geodetector is an analytical tool focused on identifying spatial distribution heterogeneity and revealing the underlying driving factors [21]. In this study, factor detection and interaction detection in Geodetector are used to analyze the driving forces affecting the ecological environment quality in the Qinghai Lake Basin [17]. The larger the q-value obtained from the factor detector, the greater the influence of the control factor on the ecological environment. The formula for the factor detector and the types of multi-factor interactions are as follows:
q = 1 h = 1 L N h δ h 2 N δ 2
In the formula, q represents the influence of a certain factor on the RSEI, with h = 1,2,…L; L is the number of categories for the dependent variable RSEI and independent variable factors; N h and N are the sample sizes for different regions and the entire region, respectively; δ h 2 and δ 2 represent the variances of the RSEI in the different regions and the entire region, respectively.
Interaction detection aims to investigate whether different factors influence each other and to assess the extent of their interaction’s impact on the dependent variable Y. The relationships between factors and their effects on Y are typically categorized into five types [22]. The criteria for determining these relationships are shown in Table 3.

3. Results

3.1. Characteristics of Spatial and Temporal Changes of the RSEI in Qinghai Lake Basin

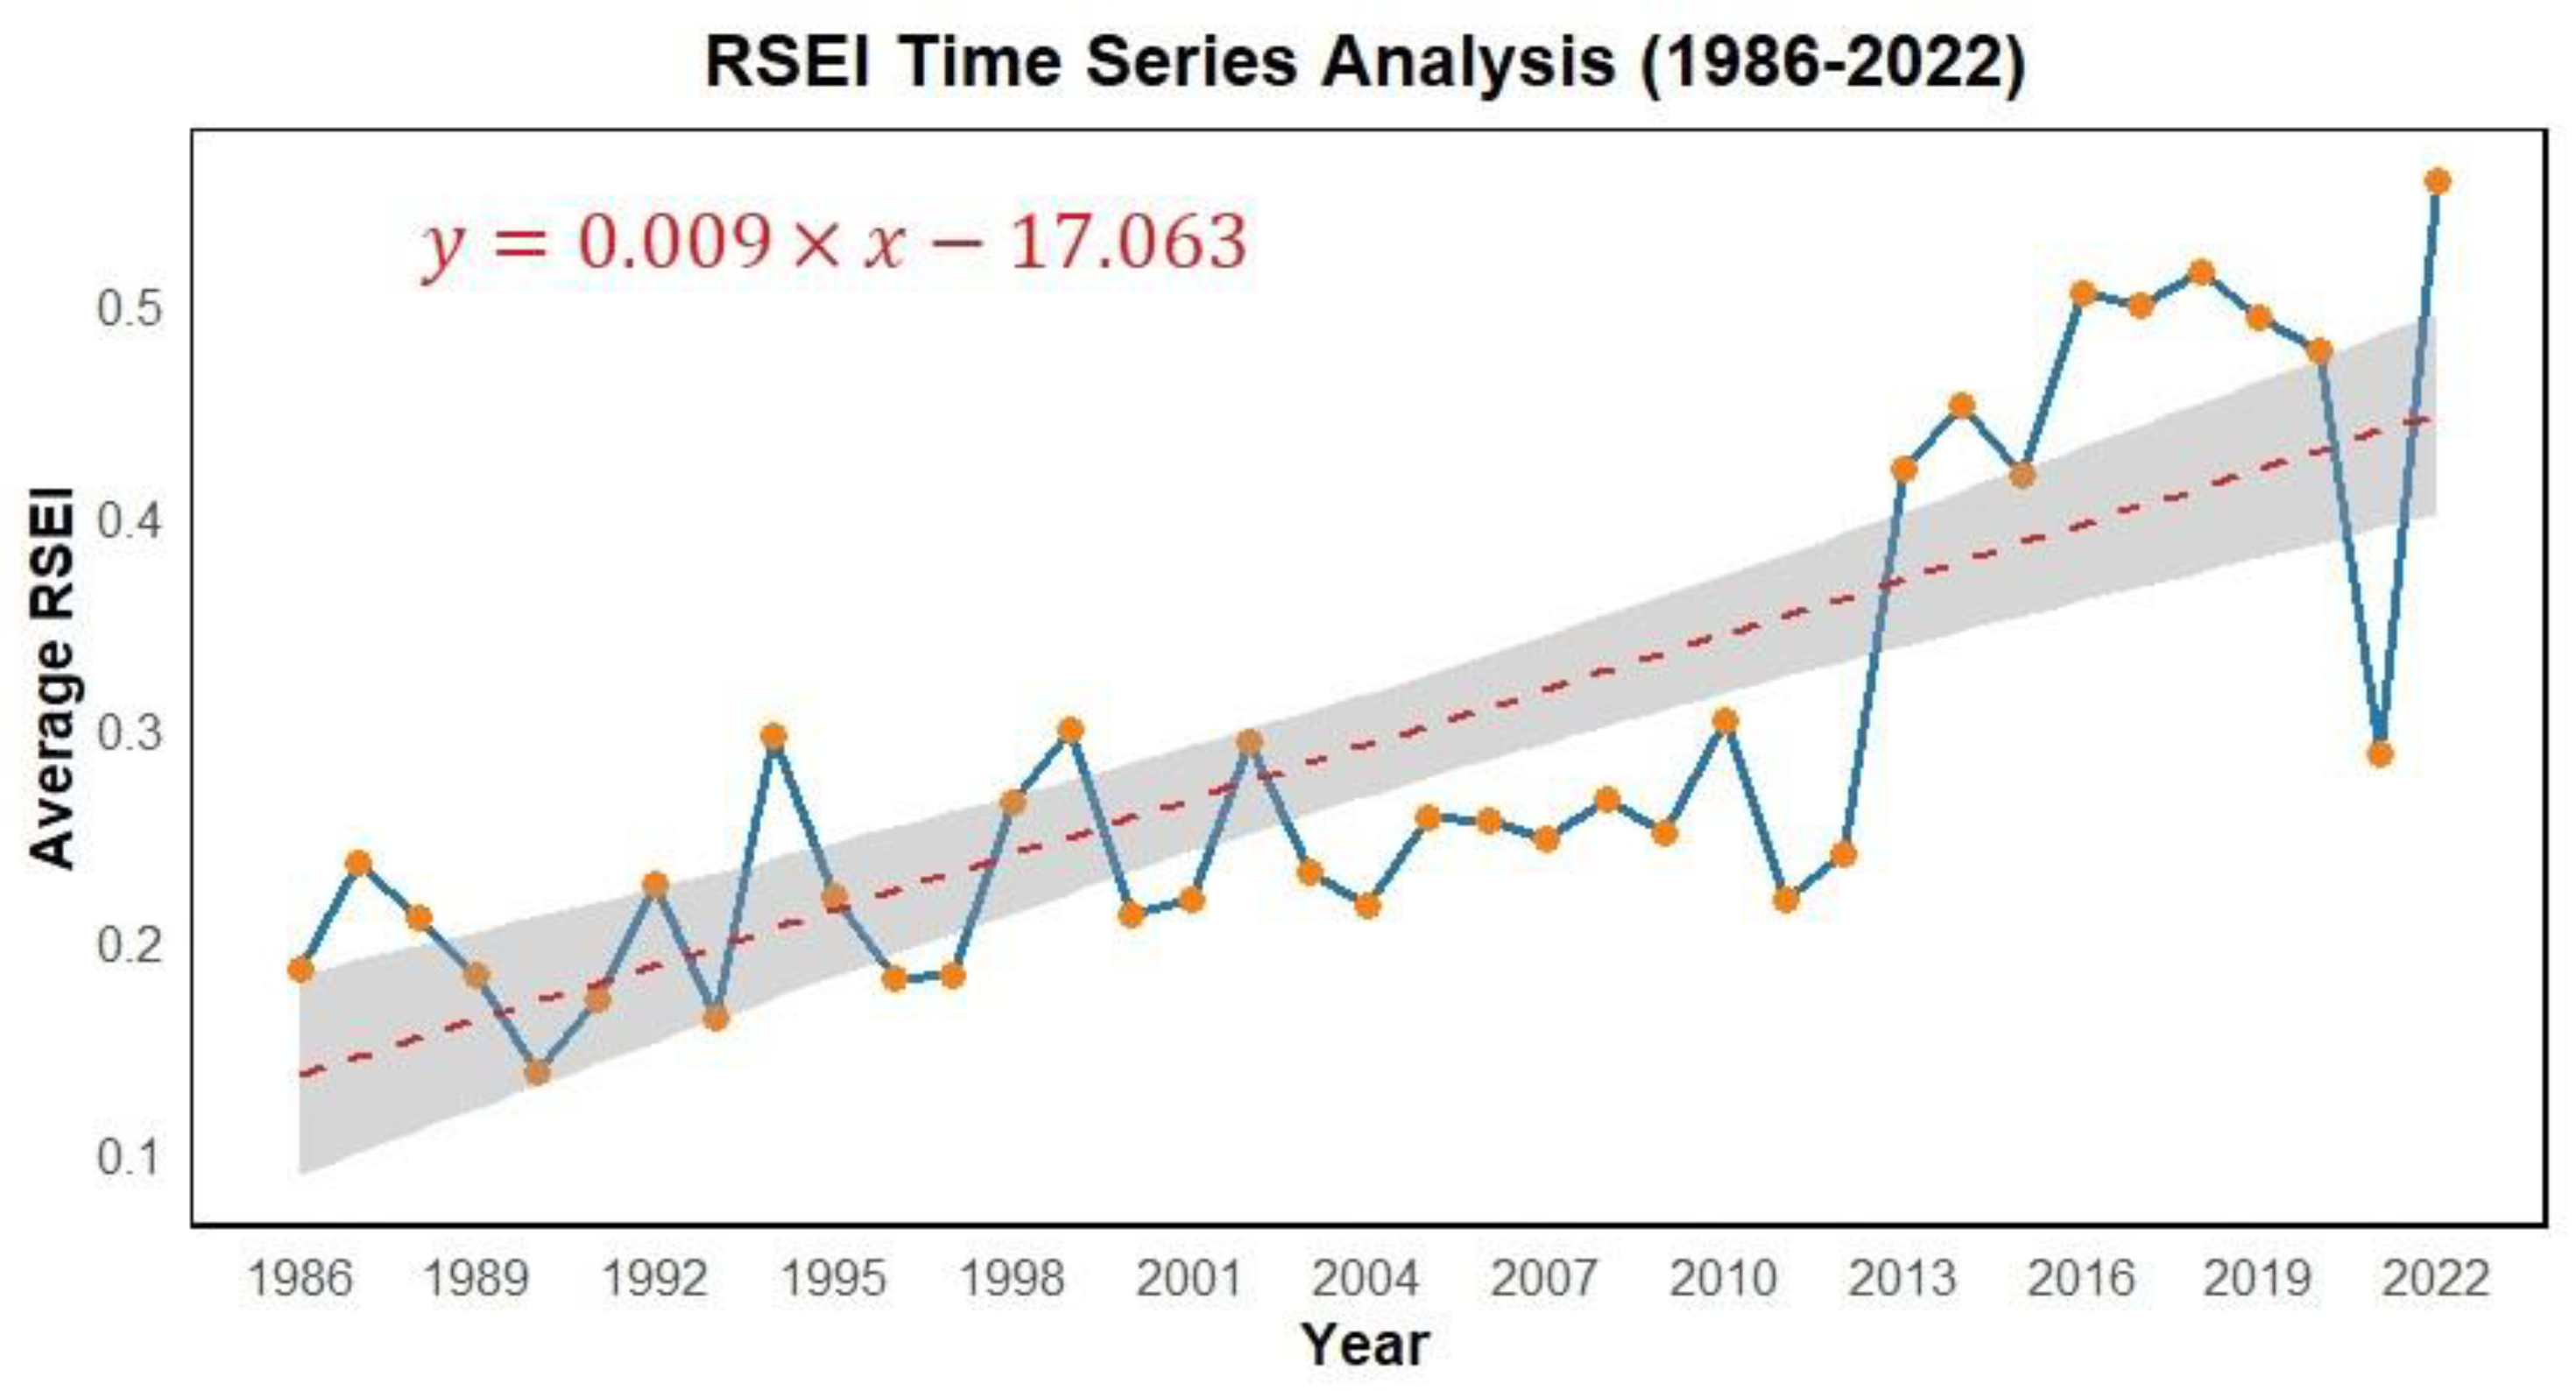
3.1.1. Characteristics of Temporal Changes of the RSEI in Qinghai Lake Basin

From 1986 to 2022, the Remote Sensing Ecological Index (RSEI) demonstrated a significant upward trend. In the early period (late 1980s to mid-1990s), RSEI values were relatively low and exhibited some fluctuations, but the overall level remained subdued. Over time, particularly after 2000, the annual mean RSEI increased substantially and continued to rise steadily over the subsequent decade. By 2022, it reached its highest level in the observation period, significantly surpassing the levels observed in the initial stage.
This trend is corroborated by both statistical tests and model fitting. The Mann–Kendall test (MK test) results show a p-value less than 0.05, indicating that at the 95% confidence level (gray shadow in the figure), the null hypothesis of no trend can be rejected, confirming a significant upward trend in the time series. Linear regression analysis yields a consistent conclusion: the fitted equation (y = 0.009X − 17.063) has an adjusted R2 of 0.6208, suggesting that the independent variable, time, explains approximately 62% of the annual RSEI variation (as shown in Figure 2). The high goodness of fit, coupled with a regression model p-value also below 0.05, further supports that this upward trend is not due to random fluctuations.
Overall, the significant increase in RSEI values from 1986 to 2022, combined with the statistically significant test results, indicates that the ecological conditions in the study area have steadily improved or recovered over this period.

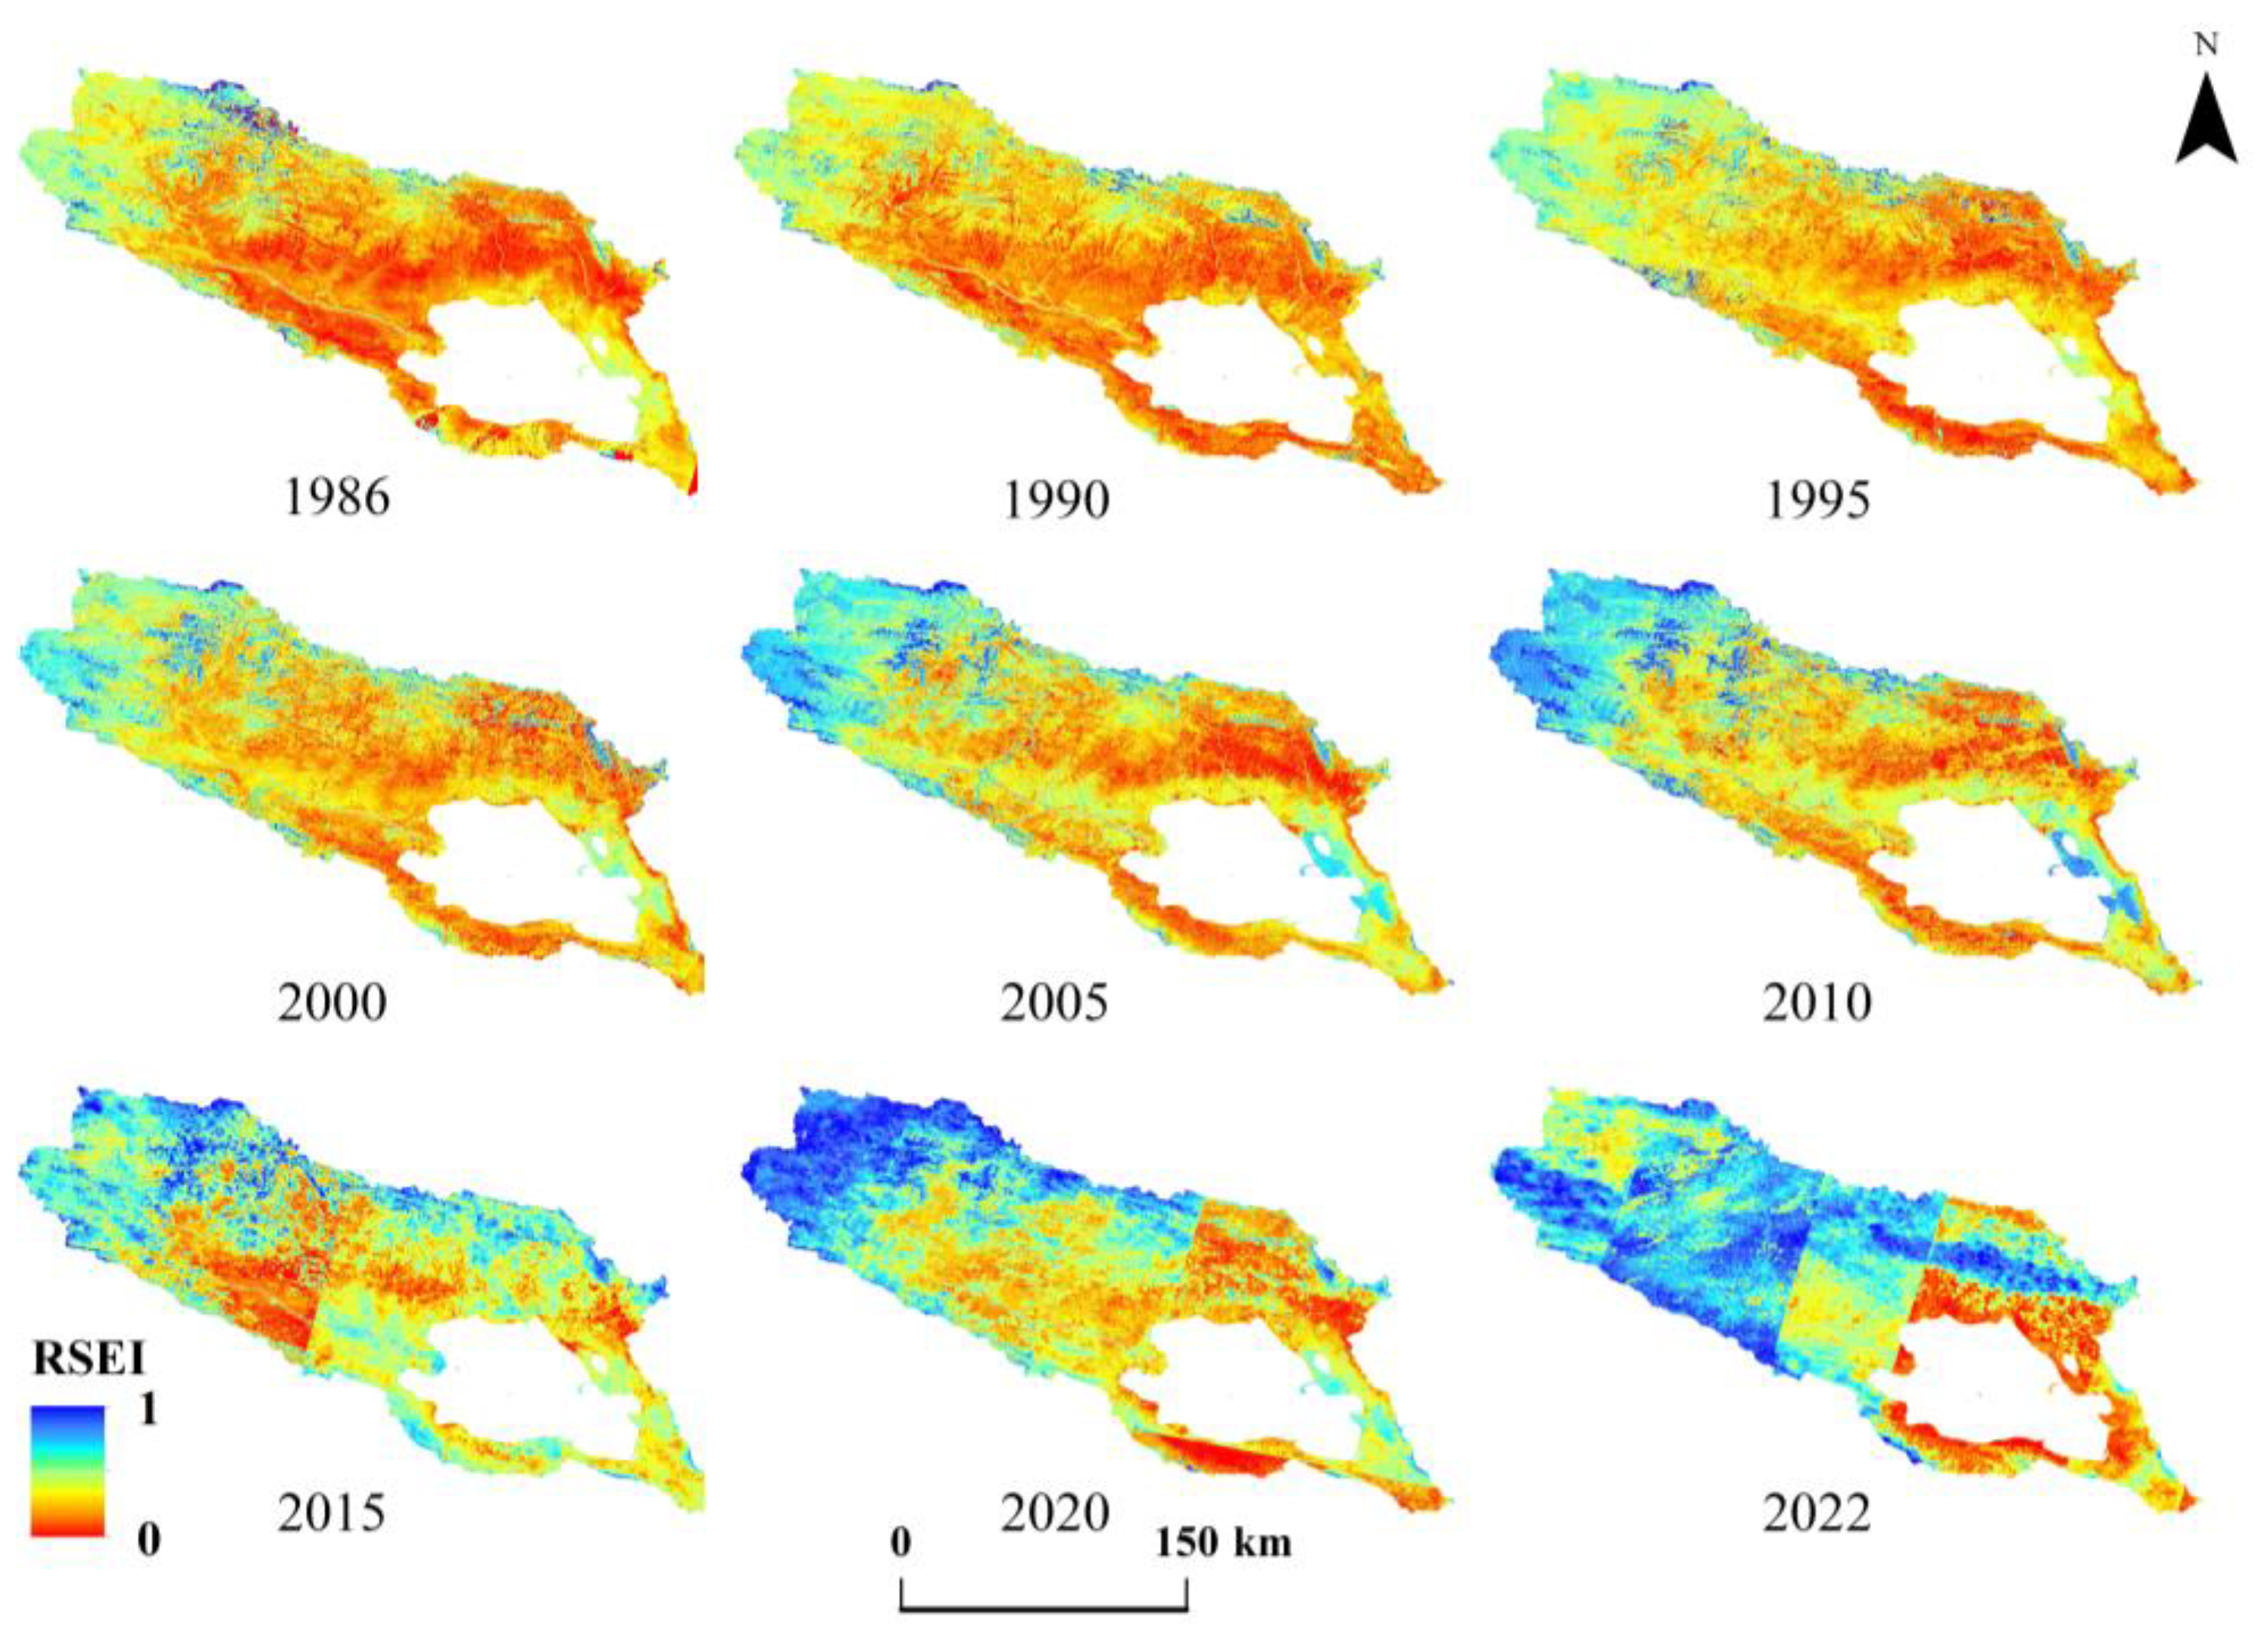
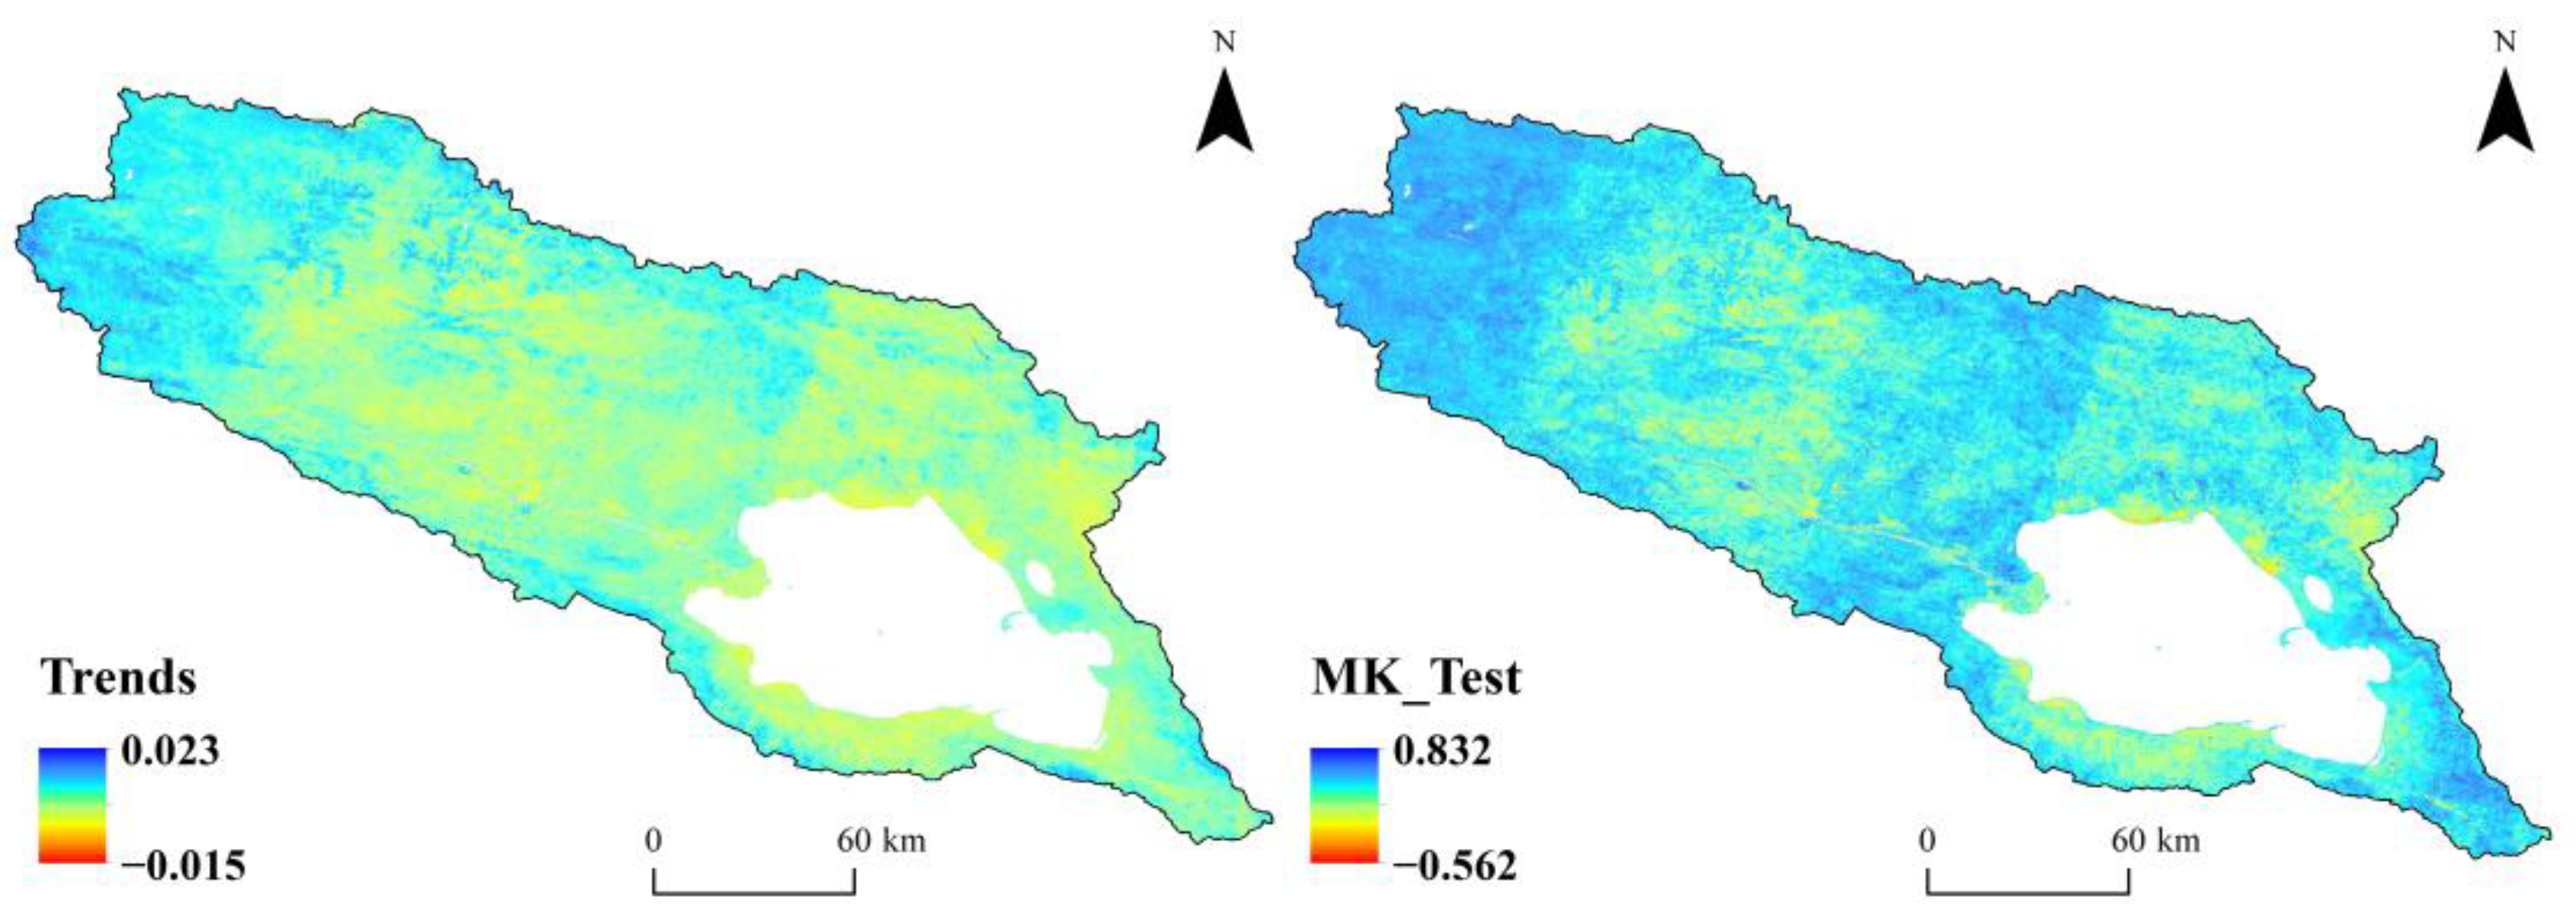
3.1.2. Spatial Distribution Patterns and Variation Characteristics of the RSEI in the Qinghai Lake Basin

From 1986 to 2022, the Qinghai Lake Basin’s Remote Sensing Ecological Index (RSEI) experienced significant spatial changes (as shown in Figure 3). Observing the spatial patterns over the time series:
In 1986 and 1990, most parts of the basin exhibited relatively low RSEI values. This indicates that vegetation cover, surface water conditions, or other ecological factors were at a generally lower level, resulting in poorer ecological quality during this period. High RSEI value regions were limited, primarily concentrated around the immediate vicinity of Qinghai Lake and in some localized habitats with relatively favorable conditions. From around 2000 to the 2010s, spatial distribution patterns began to change. Over time, particularly in 2000, 2005, and 2010, the area of low-value regions gradually decreased. More areas started transitioning from low to moderate-low values and eventually to moderate-high values. This process reflects improvements in vegetation coverage and ecosystem health in certain areas. The emergence of large swaths of moderate and moderate-high values indicates that a considerable portion of the basin saw enhanced ecological conditions during this period. From 2015 through to 2022, the basin showed widespread moderate-high RSEI regions. This signifies that the improvements in ecological quality had spread over a broader spatial extent, significantly reducing the area of low RSEI regions. By 2022, high-value areas had become quite prevalent, marking a substantial enhancement in the overall ecological quality of the basin over the past three decades. Initially, poor ecological conditions were widespread across the basin, with better ecological quality limited to areas around the lake and a few favorable habitats. Over time, the range of improved conditions expanded, the extent of low RSEI areas diminished, and high RSEI areas became more abundant and evenly distributed, ultimately achieving a significant overall improvement in the basin’s ecological quality.
From 1986 to 2022, the Remote Sensing Ecological Index (RSEI) in the Qinghai Lake Basin gradually shifted from large areas of low values to predominantly higher values. This indicates a steady overall improvement in the ecological environment of the basin.
As shown in the Figure 4, the Remote Sensing Ecological Index (RSEI) trend exhibits a spatially heterogeneous distribution pattern. Overall, the northern and western areas of the basin tend to show a more pronounced positive trend, indicating significant improvements in ecological quality in these regions. In contrast, the central and eastern areas generally display moderate increases in the RSEI, interspersed with a few weakly negative trend spots, suggesting that certain local areas still face challenges to ecological improvement. Meanwhile, the southern region demonstrates a more balanced trend, with most areas experiencing steady and sustained positive changes.
These spatial pattern differences suggest that there is spatial heterogeneity in how different regions within the Qinghai Lake Basin respond to ecological improvement efforts. The significant increases observed in the northern and western regions may be related to relatively favorable natural conditions, effective ecological management measures, and optimized resource allocation. In contrast, the moderate improvements and small areas of weakly negative changes in the central and eastern regions may be influenced by a combination of factors, including land use patterns, climate change, resource development activities, and insufficient environmental management efforts. These differences underscore the need for future regional ecological restoration and environmental management strategies to adopt site-specific and differentiated approaches, ensuring that governance and conservation measures are tailored to local conditions.
The spatial distribution characteristics of the Remote Sensing Ecological Index (RSEI) trend significance in the Qinghai Lake Basin were analyzed through significance testing, as illustrated in the figure. Overall, there are clear regional differences in the significance of the RSEI trend changes across the basin. The northern and western regions are predominantly blue, indicating low significance levels and suggesting relatively stable ecological conditions with minimal change. In contrast, the eastern and southern areas contain scattered moderate-low values, implying more significant RSEI trend changes, which may be associated with frequent human activities, vegetation recovery, or climate changes. The central region surrounding Qinghai Lake shows higher spatial heterogeneity in significance, with some areas displaying strong significance, possibly related to factors such as lake level fluctuations, wetland ecosystem restoration, and anthropogenic disturbances. The main water body of Qinghai Lake was not included in the significance testing, appearing as blank areas. In summary, the spatial distribution of the RSEI trend significance is characterized by “lower significance in the north and west, and higher significance in certain parts of the lake’s surroundings and southeastern regions,” indicating that ecological changes within the basin are influenced by both natural conditions and human activities.

3.2. Analysis of Driving Factors for the RSEI in Ecological Environment Quality

3.2.1. Results of Single-Factor Detection

As shown in the table presenting the Geodetector results (as shown in Table 4) for driving factors influencing the RSEI in the Qinghai Lake Basin from 2000 to 2020, the q-values reflect the explanatory power of each factor on the spatial distribution of the Remote Sensing Ecological Index. The statistical results indicate clear differences in the impact levels of various factors, with the strength and ranking of these influences fluctuating over time.
From 2000 to 2020, elevation consistently ranked as the most influential single factor on the RSEI, with an average q-value of 0.4642. This highlights the dominant control that topographic factors exert on the basin’s ecological environment quality. Variations in elevation directly impact climate conditions, vegetation types, and ecosystem stability within the basin. Slope, with an average q-value of 0.1558, ranked second. Its influence on the RSEI’s spatial distribution may be associated with soil erosion and lower vegetation coverage in areas with steeper slopes. Annual precipitation, with an average q-value of 0.1551, ranked third. Precipitation directly affects water resource availability and vegetation growth, serving as a key natural driver of the ecosystem. Aspect, with an average q-value of 0.0744, ranked fourth. It primarily reflects how slope orientation affects solar radiation distribution and hydrothermal conditions. Temperature, with an average q-value of 0.0524, ranked fifth. While its influence is relatively small, temperature changes still play a significant role in shaping vegetation growth cycles and biodiversity in the plateau ecosystem. Population density and land use patterns had average q-values of 0.0469 and 0.0072, respectively, placing them lower in influence. This indicates that human activity had a comparatively weaker effect on ecological changes in the Qinghai Lake Basin.
From 2000 to 2020, the q-values for elevation and slope consistently remained at high levels and exhibited strong stability, indicating that these natural factors are the primary controlling variables in ecosystem changes within the basin. The q-value for annual precipitation showed an increasing trend from 2000 to 2010, followed by a decline, which may be related to changes in the spatial and temporal distribution of precipitation and water resource management in the Qinghai Lake Basin. The relatively low q-values for land use and population density suggest that human activities had a limited direct impact on the spatial distribution of the RSEI. However, they may influence local ecosystems indirectly through activities such as grazing and tourism.
The dominant influence of natural factors (such as elevation, slope, and precipitation) on the spatial distribution of the RSEI indicates that the ecosystem in the Qinghai Lake Basin is largely controlled by topographical and climatic conditions, resulting in notable spatial heterogeneity. In contrast, human activity-related factors have a relatively minor impact, likely due to the basin’s low population density and limited land development. However, with the continued growth of tourism and increased human activities, their potential effects may become more apparent over time.

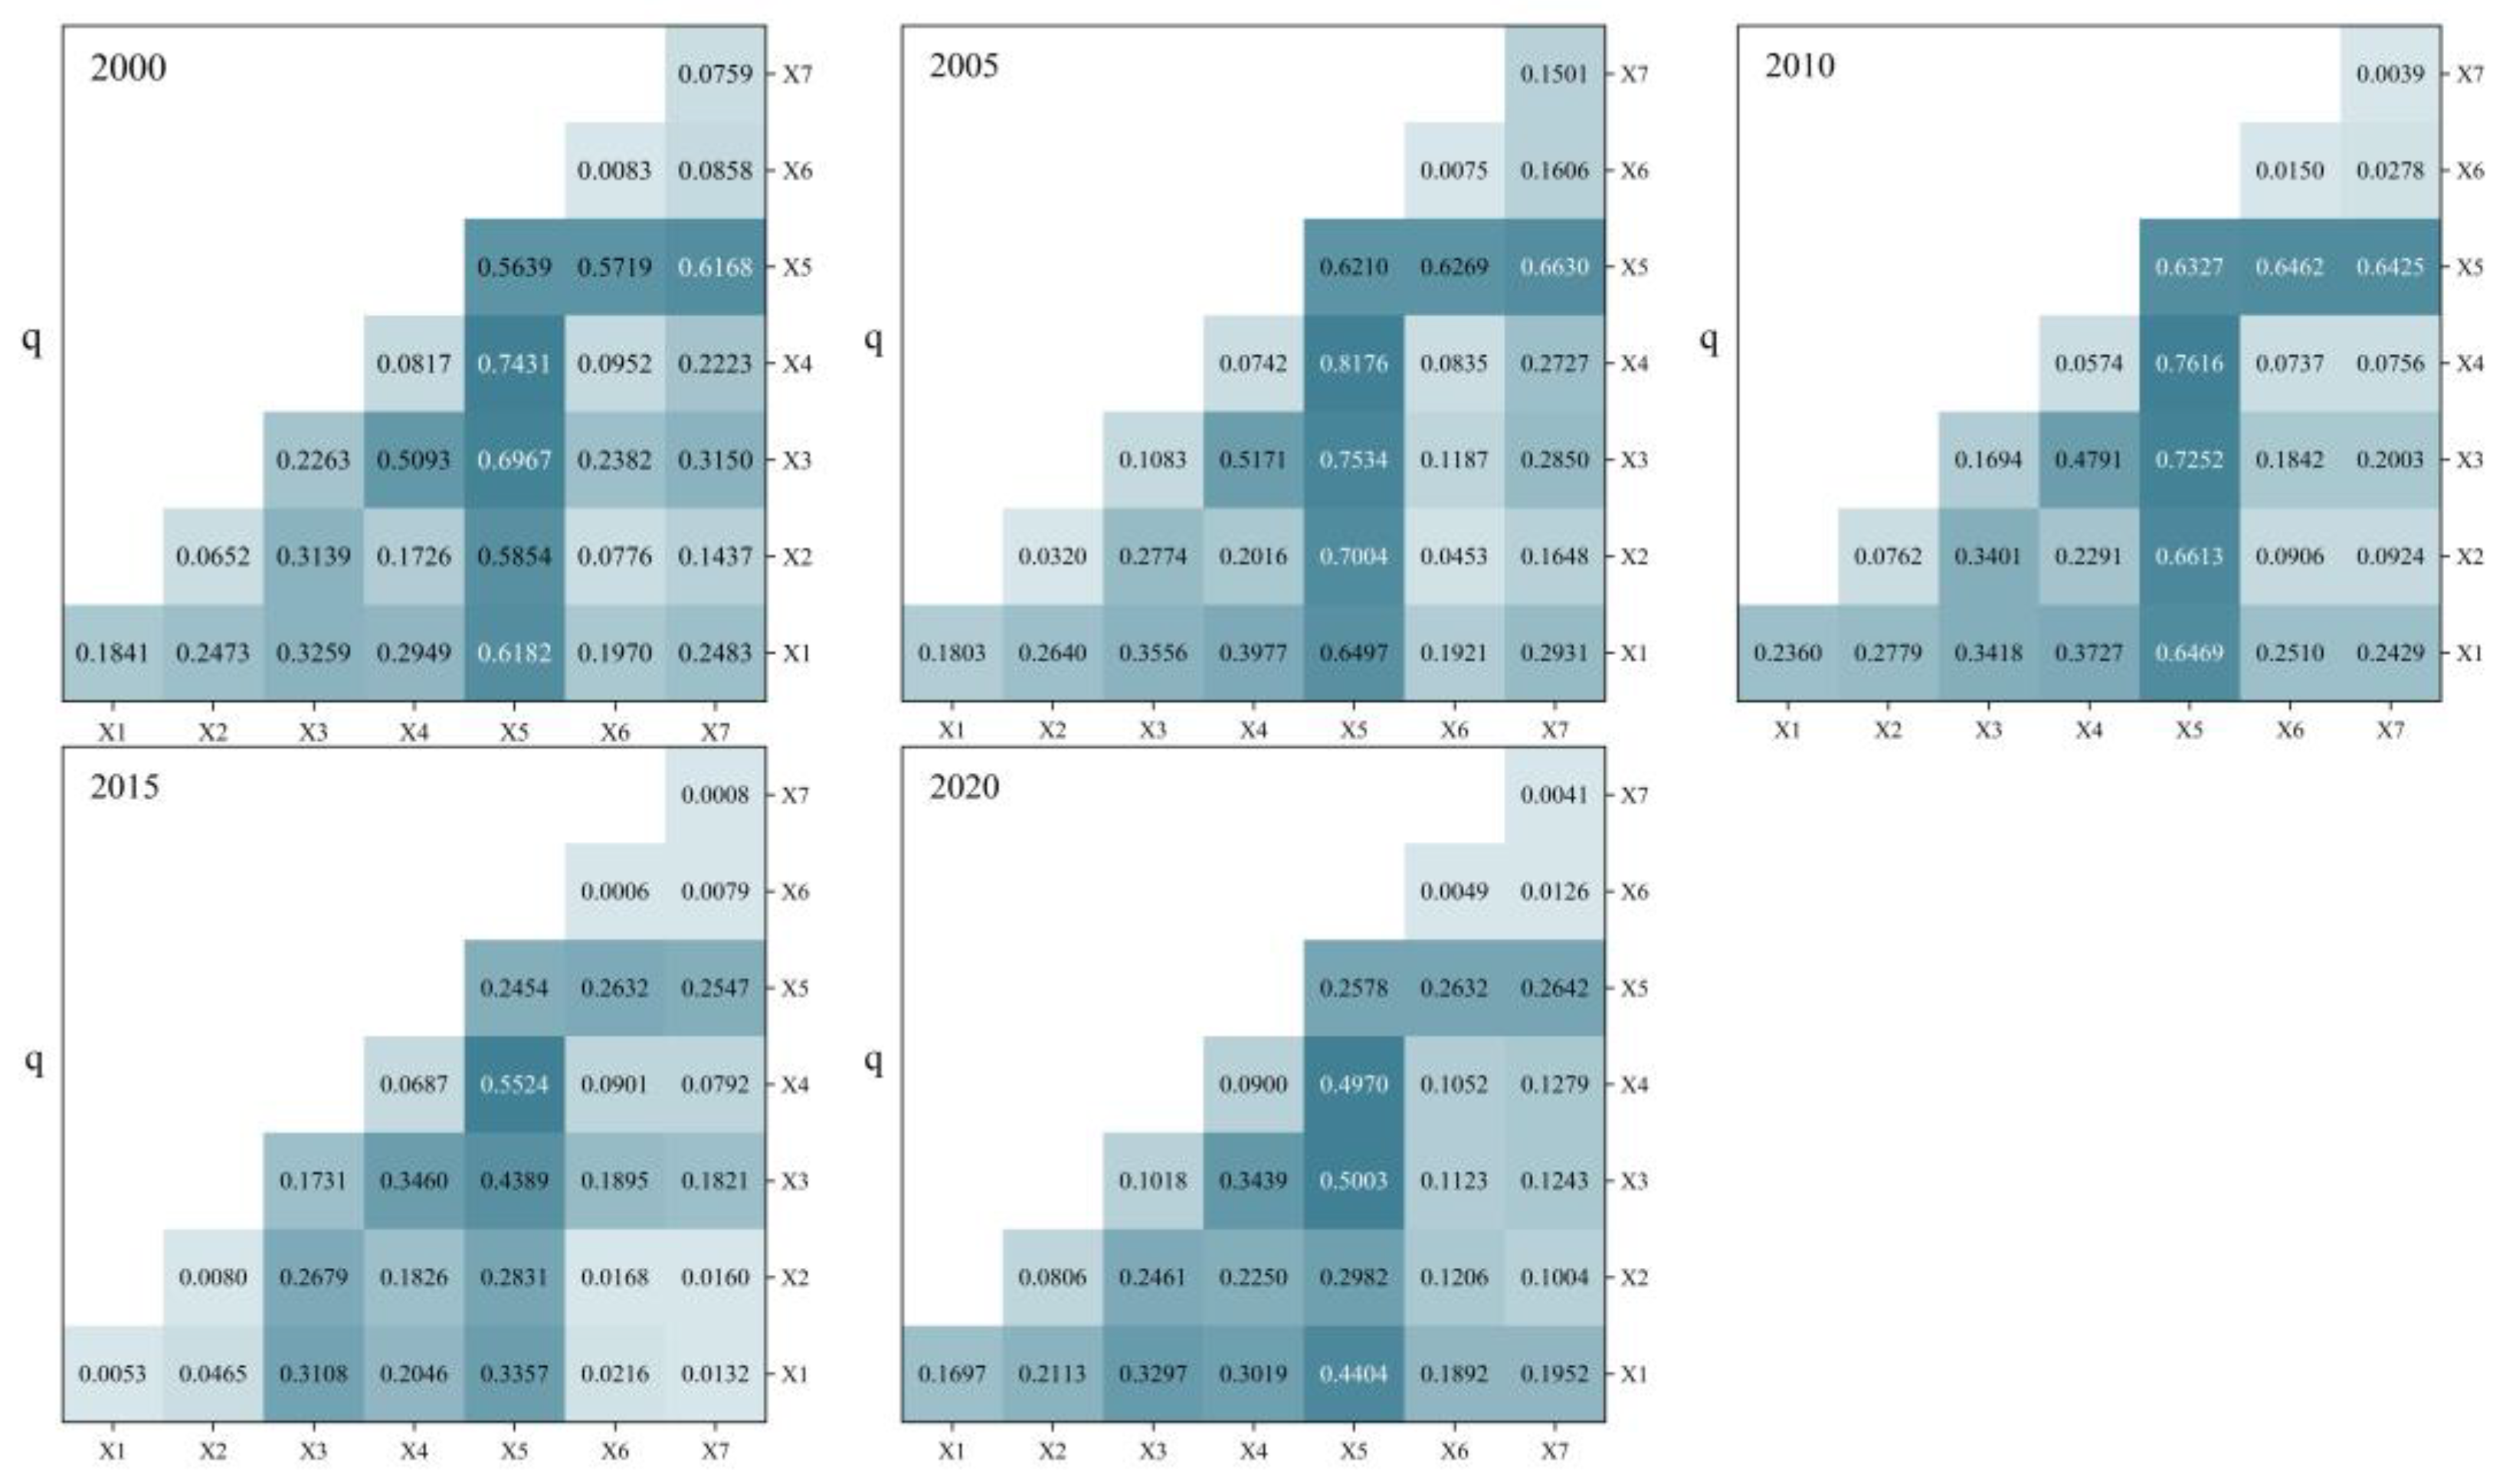
3.2.2. Results of Interaction Detection

According to the results of the Geodetector interaction detection (as shown in Figure 5), during the period from 2000 to 2020, the explanatory power (q-value) of the interactions among driving factors in the Qinghai Lake Basin was generally greater than that of single-factor detection results. This indicates that the interaction between driving factors significantly enhances the ability to explain the spatial distribution of the ecological index. The interaction types primarily manifested as “bivariate enhancement” or “nonlinear enhancement”.
From 2000 to 2020, the spatial distribution of the Remote Sensing Ecological Index (RSEI) in the Qinghai Lake Basin was influenced by both topographic and climatic factors, with human activities gradually playing a more significant role. The interaction between elevation (X5) and slope (X3) consistently showed strong explanatory power, particularly in 2000 (q = 0.6319) and 2005 (q = 0.7534), highlighting the significant influence of topographic features on ecological quality. The increase in interaction strength from 2000 to 2005 further underscored the dominant role of topographic factors. Additionally, the interaction between elevation (X5) and precipitation (X1) ranked second in both 2000 (q = 0.5919) and 2005 (q = 0.7044), indicating the ongoing importance of the coupling between climate and topography in shaping ecosystem spatial patterns.
By 2010, the interaction between elevation (X5) and slope (X3) continued to dominate (q = 0.7522), while the interaction between precipitation (X1) and aspect (X4) (q = 0.3418) began to emerge. This indicates an enhanced synergy between climatic conditions and topographic features, possibly linked to accelerated ecological degradation. In 2015, although the interaction between elevation (X5) and slope (X3) (q = 0.6349) remained strong, it showed a slight decline compared to 2010. Meanwhile, the interaction between land use (X6) and elevation (X5) (q = 0.4441) became more significant, reflecting a growing influence of human activities on the ecosystem.
By 2020, topographic factors remained prominent, with the interaction between elevation (X5) and slope (X3) (q = 0.6419) maintaining its dominant role. The interaction between land use (X6) and precipitation (X1) (q = 0.2641) also became significant, indicating that the combined effects of climate change and human activities had a considerable impact on the spatial distribution of the ecosystem.

4. Discussion

4.1. Spatiotemporal Variation Characteristics and Spatial Distribution Patterns of Ecological Quality in the Qinghai Lake Basin

On the temporal scale, we observed significant improvements in ecological quality in the Qinghai Lake Basin over the past three decades, as indicated by the upward trend in the Remote Sensing Ecological Index (RSEI). Our findings are consistent with previous studies that have reported positive trends in ecological conditions in the region [18,23]. For example, Gao et al. (2016) [13] found that the vegetation coverage in the Qinghai–Tibet Plateau has been increasing due to a combination of ecological restoration projects and favorable climatic conditions. Similarly, Zhang et al. (2022) [14] observed that the overall ecological quality in the Qinghai Lake Basin has improved over the past few decades, largely driven by reforestation programs and the expansion of protected areas. First, strengthened ecological conservation and restoration policies—especially since 2000—have introduced a series of environmental protection measures such as reforestation, wetland restoration, and water source protection. These initiatives have effectively promoted vegetation recovery, expanded wetland areas, reduced soil erosion, and directly improved ecological quality, thereby driving the increase in the RSEI values. Second, climate change may also play an important role in the rise of the RSEI. Warming temperatures and changing precipitation patterns in the basin likely provided favorable conditions for vegetation growth, further enhancing ecological conditions. Additionally, increased environmental awareness and stricter enforcement of environmental laws have positively influenced ecological restoration. This aligns with Lan Li’s (2020) findings [15], which identified human activities and climate change as major factors influencing changes in lake areas in the Golmud Basin. While climate change has had a long-term impact on lake water levels, the direct influence of human activities is more pronounced. Lastly, in recent years, China’s efforts in environmental management and international collaboration—particularly in water resource protection and ecological restoration in the Qinghai Lake Basin—have also contributed significantly to improving ecological quality in this region.
On the spatial scale, the ecological quality of the Qinghai Lake Basin exhibits a pattern of higher values in the northwest and lower values around Qinghai Lake itself. This spatial distribution pattern is shaped by the combined effects of multiple factors. Firstly, climate change has had a profound impact on the ecological environment. Rising temperatures and altered precipitation patterns have promoted vegetation growth and water supply. Secondly, land use changes—especially those associated with agriculture, animal husbandry, and urbanization—initially posed negative impacts on the ecological environment. However, with the implementation of ecological restoration measures, the basin’s ecological conditions have gradually improved. Vegetation restoration and ecological engineering projects, such as the Three-North Shelterbelt and wetland restoration initiatives in Qinghai Province, have significantly increased vegetation coverage and enhanced the ecological quality of the basin. Meanwhile, fluctuations in the Qinghai Lake water level have also played a critical role in the wetland ecosystem. The rising water level has facilitated the recovery of wetland vegetation, thereby boosting the RSEI values. Additionally, increases in biodiversity and improvements in ecosystem health have further contributed to enhanced ecological quality.
However, our study also reveals some regional variability in RSEI changes, with the northern and western regions showing more pronounced improvements compared to the southeastern region. This finding is in line with Li et al. (2020) [15], who noted that areas with more intensive land management and ecological restoration efforts, such as in the northern parts of the Qinghai–Tibet Plateau, have seen more significant ecological improvements. On the other hand, Wenhua (2017) [16] highlighted that the southeastern regions, despite receiving considerable restoration efforts, still face challenges such as land degradation and overgrazing, which may explain the relatively slower improvements in these areas.
In sum, the combined influence of climate conditions, land use changes, ecological protection measures, biodiversity enhancements, and policy support has led to a significant improvement in the basin’s ecological quality over the past three decades.

4.2. Influence of Different Driving Factors on RSEI Changes in Ecological Environment Quality

One key driver is the success of ecological protection policies implemented in recent decades, including the Three-North Shelter Forest Program and wetland restoration efforts, which have contributed to increased vegetation cover and improved land stability in many parts of the basin. Our results suggest that these restoration efforts have had a positive impact on ecological quality, particularly in regions where land-use changes have been more effectively controlled.
Elevation is the most significant factor driving ecological changes in the Qinghai Lake Basin [18]. Located on the Qinghai–Tibet Plateau, the basin exhibits substantial elevation differences, resulting in marked variations in climatic conditions [24]. In high-altitude areas, low temperatures and limited precipitation lead to sparse vegetation, as well as low productivity and stability of ecosystems—patterns commonly observed in alpine ecosystems worldwide [10]. For instance, in the high-altitude regions of the Qinghai–Tibet Plateau, short growing seasons and low temperatures make ecosystems less resilient to natural disturbances, leaving them more vulnerable to climate change and human activities. Conversely, low-altitude areas enjoy milder temperatures, ample rainfall, and more favorable ecological conditions. This elevation-driven variation directly determines the types of vegetation and ecosystem services in different regions. In steeply sloped areas, severe soil erosion is often a significant issue, especially where rainfall is abundant. Such regions experience more pronounced soil erosion problems, leading to lower vegetation coverage and further exacerbating ecological degradation.
Precipitation is a critical factor affecting ecological environment quality in the Qinghai Lake Basin, playing a pivotal role in water resource availability and vegetation growth. There is significant spatial variation in precipitation across the basin, with lower rainfall in the western regions and more abundant rainfall in the eastern areas. Precipitation directly impacts water resource supply and vegetation growth within the basin. Regions with plentiful rainfall generally exhibit better ecological conditions, while areas with insufficient precipitation are more prone to drought and grassland degradation. These observations align with previous research findings [24].
Temperature variations also influence the ecological environment in the Qinghai Lake Basin, particularly in plateau regions [25]. Although the average q-value for temperature is relatively low, its changes still affect vegetation growth cycles, species composition, and biodiversity. Rising temperatures may alter the length of growing seasons, thereby impacting vegetation growth and biodiversity. Climate change may have played a role in shaping the observed ecological trends. The Qinghai–Tibet Plateau is particularly sensitive to climate variability, and warming temperatures and changes in precipitation patterns may have created more favorable conditions for vegetation growth in certain areas. Shen et al. (2024) [18] reported similar findings, noting that regions experiencing higher temperatures and moderate precipitation are more likely to see improvements in vegetation cover and overall ecological quality. This may explain the improvements in the central and northern parts of the basin, where temperature and precipitation conditions are more conducive to vegetation recovery.
At the same time, human activities, particularly land-use changes, remain a significant influence on ecological quality in the region. Our analysis found that while topography and climate factors are dominant, land-use changes—especially urbanization and agriculture expansion—have increasingly impacted the ecological balance, particularly in the southern and southeastern parts of the basin [26,27,28]. This is consistent with Zhao et al. (2021) [21], who identified human activities as a major driver of ecological degradation in the Qinghai–Tibet Plateau, highlighting the importance of managing human impacts alongside natural factors.

5. Conclusions

The main conclusions of this study, based on the analysis of changes in the Remote Sensing Ecological Index (RSEI) in the Qinghai Lake Basin from 1986 to 2022, are as follows:
(1) The RSEI of the Qinghai Lake Basin exhibited a significant overall upward trend. Over time, the ecological environment in the basin steadily improved, with low-RSEI areas gradually shrinking and high-RSEI areas expanding and becoming more uniformly distributed, ultimately resulting in a marked enhancement in the basin’s overall ecological quality. However, further improvements can be achieved by enhancing the efficiency of ecological protection fund investments. Ensuring that these funds are allocated toward high-priority projects such as habitat restoration, soil erosion control, and water conservation can maximize their impact. In addition, implementing stronger ecological compensation mechanisms for local communities engaged in conservation efforts can help align economic incentives with ecological protection goals.
(2) The trend of RSEI changes exhibited clear spatial heterogeneity. The significance of change was lower in the northern and western regions, while the areas around the central lake and parts of the southeastern region showed higher significance. This indicates that ecological changes within the basin were driven by a combination of natural conditions and human activities, which worked together to improve the ecological environment.
(3) From 2000 to 2020, elevation differences emerged as the most influential factor affecting the RSEI in the Qinghai Lake Basin. With an average q-value of 0.4642, elevation ranked as the top factor, underscoring the dominant role of topographic conditions in driving ecological changes. Variations in elevation directly shaped the basin’s climatic conditions, vegetation types, and ecosystem stability, thereby determining differences in ecological quality across the region.
(4) During the period from 2000 to 2020, the spatial distribution of the RSEI in the Qinghai Lake Basin was shaped by the combined effects of topographic and climatic factors, while human activities gradually played a more significant role. As ecological protection measures were progressively implemented and human activities evolved, the basin’s ecological environment improved effectively. However, potential negative impacts from human activities in certain areas still warrant attention.

6. Deficiency and Prospect

In this study, Landsat satellite data from 1986 to 2022 were used, and although these data provide long-term and relatively consistent spatial coverage, there may be differences in climate change, satellite sensor performance, and data processing methods for different time periods, which may affect the consistency and accuracy of the results.
Second, the construction of the Remote Sensing Ecological Index (RSEI) relies on multiple remote sensing factors, and the computation of these factors is based on the Principal Component Analysis (PCA) method, which, although it can effectively reflect ecological changes in most cases, the complex relationships and interactions among different factors may still lead to partial loss of information or accumulation of errors.
Looking ahead, future researchers can reduce the uncertainty by optimizing the processing and analysis methods of remote sensing data. For example, combining higher-resolution remote sensing data with multi-source remote sensing data, such as high-resolution satellite imagery, can improve monitoring accuracy to some extent. In addition, further refinement of the methodology for constructing remote sensing ecological indices, such as introducing more variables related to ecological quality or adopting advanced techniques such as deep learning, may improve the meticulousness and reliability of ecological environment assessment. Further studies may also explore the combination of remotely sensed data with ground-based field observations to validate the remote sensing assessment results and enhance the credibility of the remotely sensed data.

Author Contributions

Conceptualization, P.Y. and Y.F.; methodology, Y.W.; software, Y.W. and H.G.; validation, H.G., X.Y. and Y.F.; formal analysis, P.Y.; investigation, P.Y.; resources, Y.W.; data curation, P.Y.; writing—original draft preparation, P.Y.; writing—review and editing, Y.F.; visualization, X.Y; supervision, X.Y. and Y.F.; project administration, H.G.; funding acquisition, X.Y. All authors have read and agreed to the published version of the manuscript.

Funding

This research was funded by the National Natural Science Foundation of China (42230714, U2243202).

Institutional Review Board Statement

Not applicable.

Informed Consent Statement

Not applicable.

Data Availability Statement

Data are subject to third-party restrictions.

Conflicts of Interest

The authors declare no conflicts of interest.

Abbreviations

The following abbreviations are used in this manuscript:
RSEIRemote Sensing Ecological Index
GEEGoogle Earth Engine
NDVINormalized Difference Vegetation Index
NDBSINormalized Difference Bare Soil Index
LSTLand Surface Temperature

References

  1. Qiu, B.; Chen, G.; Tang, Z.; Lu, D.; Wang, Z.; Chen, C. Assessing the Three-North Shelter Forest Program in China by a Novel Framework for Characterizing Vegetation Changes. ISPRS J. Photogramm. Remote Sens. 2017, 133, 75–88. [Google Scholar] [CrossRef]
  2. Willis, K.S. Remote Sensing Change Detection for Ecological Monitoring in United States Protected Areas. Biol. Conserv. 2015, 182, 233–242. [Google Scholar] [CrossRef]
  3. Xiong, Y.; Xu, W.; Lu, N.; Huang, S.; Wu, C.; Wang, L.; Dai, F.; Kou, W. Assessment of Spatial–Temporal Changes of Ecological Environment Quality Based on RSEI and GEE: A Case Study in Erhai Lake Basin, Yunnan Province, China. Ecol. Indic. 2021, 125, 107518. [Google Scholar] [CrossRef]
  4. Xu, H. A Remote Sensing Evaluation Index for Regional Ecological Environment Change. China Environ. Sci. 2013, 33, 889–897. [Google Scholar]
  5. Xu, H. Construction and Application of Urban Remote Sensing Ecological Index. Acta Ecol. Sin. 2013, 33, 7853–7862. [Google Scholar]
  6. Fu, K.; Jia, G.; Yu, X.; Chen, L. Evaluation of Ecological Environment Quality and Analysis of Driving Mechanisms in the Turpan-Hami Region Based on an Improved Remote Sensing Ecological Index. Acta Ecol. Sin. 2024, 44, 3911–3923. [Google Scholar] [CrossRef]
  7. Gorelick, N.; Hancher, M.; Dixon, M.; Ilyushchenko, S.; Thau, D.; Moore, R. Google Earth Engine: Planetary-Scale Geospatial Analysis for Everyone. Remote Sens. Environ. 2017, 202, 18–27. [Google Scholar] [CrossRef]
  8. Parastatidis, D.; Mitraka, Z.; Chrysoulakis, N.; Abrams, M. Online Global Land Surface Temperature Estimation from Landsat. Remote Sens. 2017, 9, 1208. [Google Scholar] [CrossRef]
  9. Huang, H.; Chen, W.; Zhang, Y.; Qiao, L.; Du, Y. Analysis of Ecological Quality in Lhasa Metropolitan Area during 1990–2017 Based on Remote Sensing and Google Earth Engine Platform. J. Geogr. Sci. 2021, 31, 265–280. [Google Scholar] [CrossRef]
  10. Airiken, M.; Li, S. The Dynamic Monitoring and Driving Forces Analysis of Ecological Environment Quality in the Tibetan Plateau Based on the Google Earth Engine. Remote Sens. 2024, 16, 682. [Google Scholar] [CrossRef]
  11. Zhang, L.; Zhang, H.; Xu, E. Information Entropy and Elasticity Analysis of the Land Use Structure Change Influencing Eco-Environmental Quality in Qinghai-Tibet Plateau from 1990 to 2015. Environ. Sci. Pollut. Res. 2022, 29, 18348–18364. [Google Scholar] [CrossRef] [PubMed]
  12. Zhao, Y.; Chen, D.; Fan, J. Sustainable Development Problems and Countermeasures: A Case Study of the Qinghai-Tibet Plateau. Geogr. Sustain. 2020, 1, 275–283. [Google Scholar] [CrossRef]
  13. Gao, Q.; Guo, Y.; Xu, H.; Ganjurjav, H.; Li, Y.; Wan, Y.; Qin, X.; Ma, X.; Liu, S. Climate Change and Its Impacts on Vegetation Distribution and Net Primary Productivity of the Alpine Ecosystem in the Qinghai-Tibetan Plateau. Sci. Total Environ. 2016, 554–555, 34–41. [Google Scholar] [CrossRef] [PubMed]
  14. Zhang, Q.; Yuan, R.; Singh, V.P.; Xu, C.-Y.; Fan, K.; Shen, Z.; Wang, G.; Zhao, J. Dynamic Vulnerability of Ecological Systems to Climate Changes across the Qinghai-Tibet Plateau, China. Ecol. Indic. 2022, 134, 108483. [Google Scholar] [CrossRef]
  15. Li, L.; Ni, W.; Li, T.; Zhou, B.; Qu, Y.; Yuan, K. Influences of Anthropogenic Factors on Lakes Area in the Golmud Basin, China, from 1980 to 2015. Environ. Earth Sci. 2020, 79, 20. [Google Scholar] [CrossRef]
  16. Li, W. An Overview of Ecological Research Conducted on the Qinghai-Tibetan Plateau. JORE 2017, 8, 1–4. [Google Scholar] [CrossRef]
  17. Cai, Z.; Zhang, Z.; Zhao, F.; Guo, X.; Zhao, J.; Xu, Y.; Liu, X. Assessment of Eco-Environmental Quality Changes and Spatial Heterogeneity in the Yellow River Delta Based on the Remote Sensing Ecological Index and Geo-Detector Model. Ecol. Inform. 2023, 77, 102203. [Google Scholar] [CrossRef]
  18. Shen, Z.; Gong, J. Spatial–Temporal Changes and Driving Mechanisms of Ecological Environmental Quality in the Qinghai–Tibet Plateau, China. Land 2024, 13, 2203. [Google Scholar] [CrossRef]
  19. Yeh, H.F.; Yeh, C.F.; Lee, C.H. Mann-Kendall Test and Theil-Sen Estimator for Long-Term Spatial and Temporal Trends of Streamflow in Taiwan. J. Chin. Soil Water Conserv. 2016, 47, 73–83. [Google Scholar]
  20. Sang, Y.-F.; Wang, Z.; Liu, C. Comparison of the MK Test and EMD Method for Trend Identification in Hydrological Time Series. J. Hydrol. 2014, 510, 293–298. [Google Scholar] [CrossRef]
  21. Zhao, Y.; Liu, L.; Kang, S.; Ao, Y.; Han, L.; Ma, C. Quantitative Analysis of Factors Influencing Spatial Distribution of Soil Erosion Based on Geo-Detector Model under Diverse Geomorphological Types. Land 2021, 10, 604. [Google Scholar] [CrossRef]
  22. Jiang, F.; Liu, C.; Zhao, J.; Jiang, B.; Fan, F. Habitat Quality Assessment on the Qinghai-Tibet Plateau across Vegetation Ecoregions Using InVEST and Geodetector Models. Front. Earth Sci. 2024, 12, 1432434. [Google Scholar] [CrossRef]
  23. Cao, J.; Wu, E.; Wu, S.; Fan, R.; Xu, L.; Ning, K.; Li, Y.; Lu, R.; Xu, X.; Zhang, J.; et al. Spatiotemporal Dynamics of Ecological Condition in Qinghai-Tibet Plateau Based on Remotely Sensed Ecological Index. Remote Sens. 2022, 14, 4234. [Google Scholar] [CrossRef]
  24. Zou, F.; Hu, Q.; Liu, Y.; Li, H.; Zhang, X.; Liu, Y. Spatiotemporal Changes and Driving Analysis of Ecological Environmental Quality along the Qinghai–Tibet Railway Using Google Earth Engine—A Case Study Covering Xining to Jianghe Stations. Remote Sens. 2024, 16, 951. [Google Scholar] [CrossRef]
  25. Luo, M.; Zhang, S.; Huang, L.; Liu, Z.; Yang, L.; Li, R.; Lin, X. Temporal and Spatial Changes of Ecological Environment Quality Based on RSEI: A Case Study in Ulan Mulun River Basin, China. Sustainability 2022, 14, 13232. [Google Scholar] [CrossRef]
  26. Yi, S.; Zhou, Y.; Zhang, J.; Li, Q.; Liu, Y.; Guo, Y.; Chen, Y. Spatial-Temporal Evolution and Motivation of Ecological Vulnerability Based on RSEI and GEE in the Jianghan Plain from 2000 to 2020. Front. Environ. Sci. 2023, 11, 1191532. [Google Scholar] [CrossRef]
  27. Wang, H.; Liu, C.; Zang, F.; Liu, Y.; Chang, Y.; Huang, G.; Fu, G.; Zhao, C.; Liu, X. Remote Sensing-Based Approach for the Assessing of Ecological Environmental Quality Variations Using Google Earth Engine: A Case Study in the Qilian Mountains, Northwest China. Remote Sens. 2023, 15, 960. [Google Scholar] [CrossRef]
  28. Liu, Z.; Zhang, W.; Lu, H.; Ji, J.; Yang, Z.; Chen, C. Exploring Evolution Characteristics of Eco-Environment Quality in the Yangtze River Basin Based on Remote Sensing Ecological Index. Heliyon 2023, 9, e23243. [Google Scholar] [CrossRef]
Figure 1. Study area location map.
Sustainability 17 03421 g001
Figure 2. The annual variation in the mean RSEI of the Qinghai Lake Basin from 1986 to 2022.
Sustainability 17 03421 g002
Figure 3. Spatial distribution patterns of the RSEI (1986–2022).
Sustainability 17 03421 g003
Figure 4. Qinghai Lake RSEI trends and significance test results for the trends.
Sustainability 17 03421 g004
Figure 5. Interactive detection results for different years: X1 represents the annual average precipitation; X2 represents the annual average temperature; X3 represents slope; X4 represents aspect; X5 represents elevation; X6 represents land use; and X7 represents population density (The darker the colour, the stronger the correlation).
Sustainability 17 03421 g005
Table 1. Main information and sources of data.
TypologyData NameResolutionUnitData Sources
Landsat 5/7/830 mGoogle Earth Engine (GEE)
Climate factorsAnnual average precipitation100 mmmChina’s Academy of Sciences Resource and Environmental Sciences Data Center (http://www.gscloud.cn (accessed on 1 January 2025))
Annual average temperature100 m°CChina’s Academy of Sciences Resource and Environmental Sciences Data Center (http://www.gscloud.cn (accessed on 1 January 2025))
Topographic factorsSlope30 m°China’s Academy of Sciences Resource and Environmental Sciences Data Center (http://www.gscloud.cn (accessed on 1 January 2025))
Aspect30 m°China’s Academy of Sciences Resource and Environmental Sciences Data Center (http://www.gscloud.cn (accessed on 1 January 2025))
Elevation30 mmChina’s Academy of Sciences Resource and Environmental Sciences Data Center (http://www.gscloud.cn (accessed on 1 January 2025))
Human
factors
Land use30 mChina’s Academy of Sciences Resource and Environmental Sciences Data Center (http://www.gscloud.cn (accessed on 1 January 2025))
Population density100 mpeople/km2National Earth System Science Data Center (http://www.geodata.cn (accessed on 1 January 2025))
This table summarizes the main datasets used in the ecological analysis of the Qinghai Lake Basin, including remote sensing data, climate factors, topographic data, and human activity datasets.
Table 2. Calculation formula for each remote sensing ecological indicator of RSEI.
IndicatorMethod of Calculation
NDVI N D V I = ρ n i r ρ r e d ρ n i r + ρ r e d
WET E T = 0.15511 ρ b l u e + 0.1973 ρ g r e e n + 0.3283 ρ r e d + 0.3407 ρ n i r 0.717 ρ s w i r 1 0.4559 ρ s w i r 2
NDBSI N D B S I = ( I B I + S I ) / 2
S I = ρ s w i r 1 + ρ r e d ρ n i r + ρ b l u e ρ s w i r 1 + ρ r e d + ρ n i r + ρ b l u e
I B I = 2 ρ s w i r 1 ρ s w i r 1 + ρ n i r ρ n i r ρ n i r + ρ r e d + ρ g r e e n ρ s w i r 1 + ρ r e d / 2 ρ s w i r 1 ρ s w i r 1 + ρ n i r + ρ n i r ρ n i r + ρ r e d + ρ g r e e n ρ s w i r 1 + ρ r e d
LST L S T = T / 1 + ln ε γ T ρ
Table 3. Interaction relations.
Type of InteractionComparison of q-Values
Nonlinear attenuationq(X1∩X2) < Min[q(X1), q(X2)]
One-factor nonlinear attenuationMin[q(X1), q(X2)] < q(X1∩X2) < Max[q(X1), q(X2)]
Two-factor enhancementq(X1∩X2) > Max[q(X1), q(X2)]
Independentq(X1∩X2) = q(X1) + q(X2)
Nonlinear enhancementq(X1∩X2) > q(X1) + q(X2)
Table 4. Factor detection results in different years.
Driving Factor20002005201020152020Average 2000–2020
qRankingqRankingqRankingqRankingqRankingqRanking
Annual average precipitation0.184130.180320.236020.005350.169720.15513
Annual average temperature0.065260.032060.076240.008040.080650.05245
Slope0.226320.108340.169430.173120.101830.15582
Aspect0.081740.074250.057450.068730.090040.07444
Elevation0.563910.621010.632710.245410.257810.46421
Land use0.008370.007570.015060.000670.004960.00727
Population density0.075950.150130.003970.000860.004170.04696
Disclaimer/Publisher’s Note: The statements, opinions and data contained in all publications are solely those of the individual author(s) and contributor(s) and not of MDPI and/or the editor(s). MDPI and/or the editor(s) disclaim responsibility for any injury to people or property resulting from any ideas, methods, instructions or products referred to in the content.

