Integrated Assessment Models (IAMs) play a crucial role in evaluating the complex interplay between economic, social, and environmental factors in the context of climate change. Among the prominent IAMs, the DICE model, developed by William Nordhaus, focuses on cost–benefit analysis to assess the economic impacts of climate policies, utilizing optimization techniques to find the most efficient pathways to mitigate climate change [
29,
30]. The Framework for Uncertainty, Negotiation, and Distribution (FUND) model emphasizes the uncertainties inherent in climate change impacts and policy responses, incorporating detailed sectoral impact analysis and regional differences [
31]. The Global Change Assessment Model (GCAM), developed by the Pacific Northwest National Laboratory, integrates human and Earth systems modeling, incorporating energy, water, land, and climate systems to explore technology pathways and provide regional detail [
32]. The Model for Energy Supply Strategy Alternatives and their General Environmental Impact (MESSAGE), developed by the International Institute for Applied Systems Analysis (IIASA), focuses on energy systems and their environmental impacts, integrating economic and environmental models for comprehensive policy analysis [
33]. The Regional Model of Investments and Development (REMIND) combines macroeconomic growth with energy system transitions and climate change mitigation, including a detailed representation of energy technologies and regional dynamics [
34]. The Integrated Model to Assess the Global Environment (IMAGE), developed by the PBL Netherlands Environmental Assessment Agency, links environmental and socio-economic systems, exploring long-term sustainability pathways through land-use, water, and climate change interactions [
35]. Lastly, the World Induced Technical Change Hybrid (WITCH) model integrates economic growth with endogenous technological change, assessing the role of innovation and technology diffusion in climate policy analysis, and includes game-theoretic elements to evaluate policy strategies [
36].
Building upon these studies and established methodologies, the proposed algebraic model for analyzing clean power plant construction rates extends the applicability of algebraic modeling to sustainable energy development. By combining mathematical analysis and scenario-based simulations, this model offers valuable insights into the interplay between various factors influencing construction rates. Stakeholders can use these insights to make informed decisions and optimize resource allocation in support of a transition to clean energy.
The proposed algebraic model provides a comprehensive framework for analyzing the construction rates of clean power plants. It integrates insights from the fission six-factor formula and the identified main factors and sub-factors. This model employs algebraic equations to capture the complex interactions between factors influencing construction rates, such as public acceptance, supply chain readiness, human resources, and land availability. By incorporating non-linear relationships and differential weighting, the algebraic model provides a robust tool for decision making and optimization in clean energy infrastructure development. Furthermore, the integration of external variables and scenario analysis enhances the model’s adaptability to different contexts and future projections. Through this algebraic approach, stakeholders and policy makers can gain valuable insights into the dynamics of clean power plant construction, enabling informed decision making and strategic planning for sustainable energy transition.
The development of the algebraic model builds upon the foundational principles of the fission six-factor formula and the insights derived from the analysis of main factors and sub-factors. By leveraging the mathematical rigor and analytical framework established in the discussion of the six-factor formula, the algebraic model extends this understanding to the specific context of clean power plant construction rates. Integrating factors identified in previous sections, such as public acceptance and supply chain readiness, the algebraic model provides a structured approach to modeling and optimizing construction rates. This bridges the gap between theoretical understanding and practical application in sustainable energy development.
3.1. Algebraic Mathematical Model Component and Implementation
Several components are incorporated in this proposed advanced model to optimize the SMR construction rate. Techniques such as polynomial or logistic regression are employed to capture complex, non-linear relationships between different factors. This allows for a better understanding of how variations in one factor can influence the overall construction rate.
The decision to use an algebraic modeling framework in this study stems from its transparency, adaptability, and suitability for policy-driven planning. Algebraic models provide a clear and interpretable structure, which is essential for decisionmakers and policymakers who require transparent justification for deployment strategies. Unlike machine learning, agent-based modeling, or Monte Carlo simulations—which often function as black-box approaches and require large datasets—algebraic models enable users to explore and compare deployment scenarios using adjustable input parameters and dynamic weights. The model can easily incorporate scenario-based simulations, factor interactions, and parameter sensitivities, making it particularly useful for long-term energy planning in both data-rich and data-scarce environments.
A differential weighting approach is used, meaning that the influence of each factor can vary based on the specific scenario [
38]. Weight coefficients (
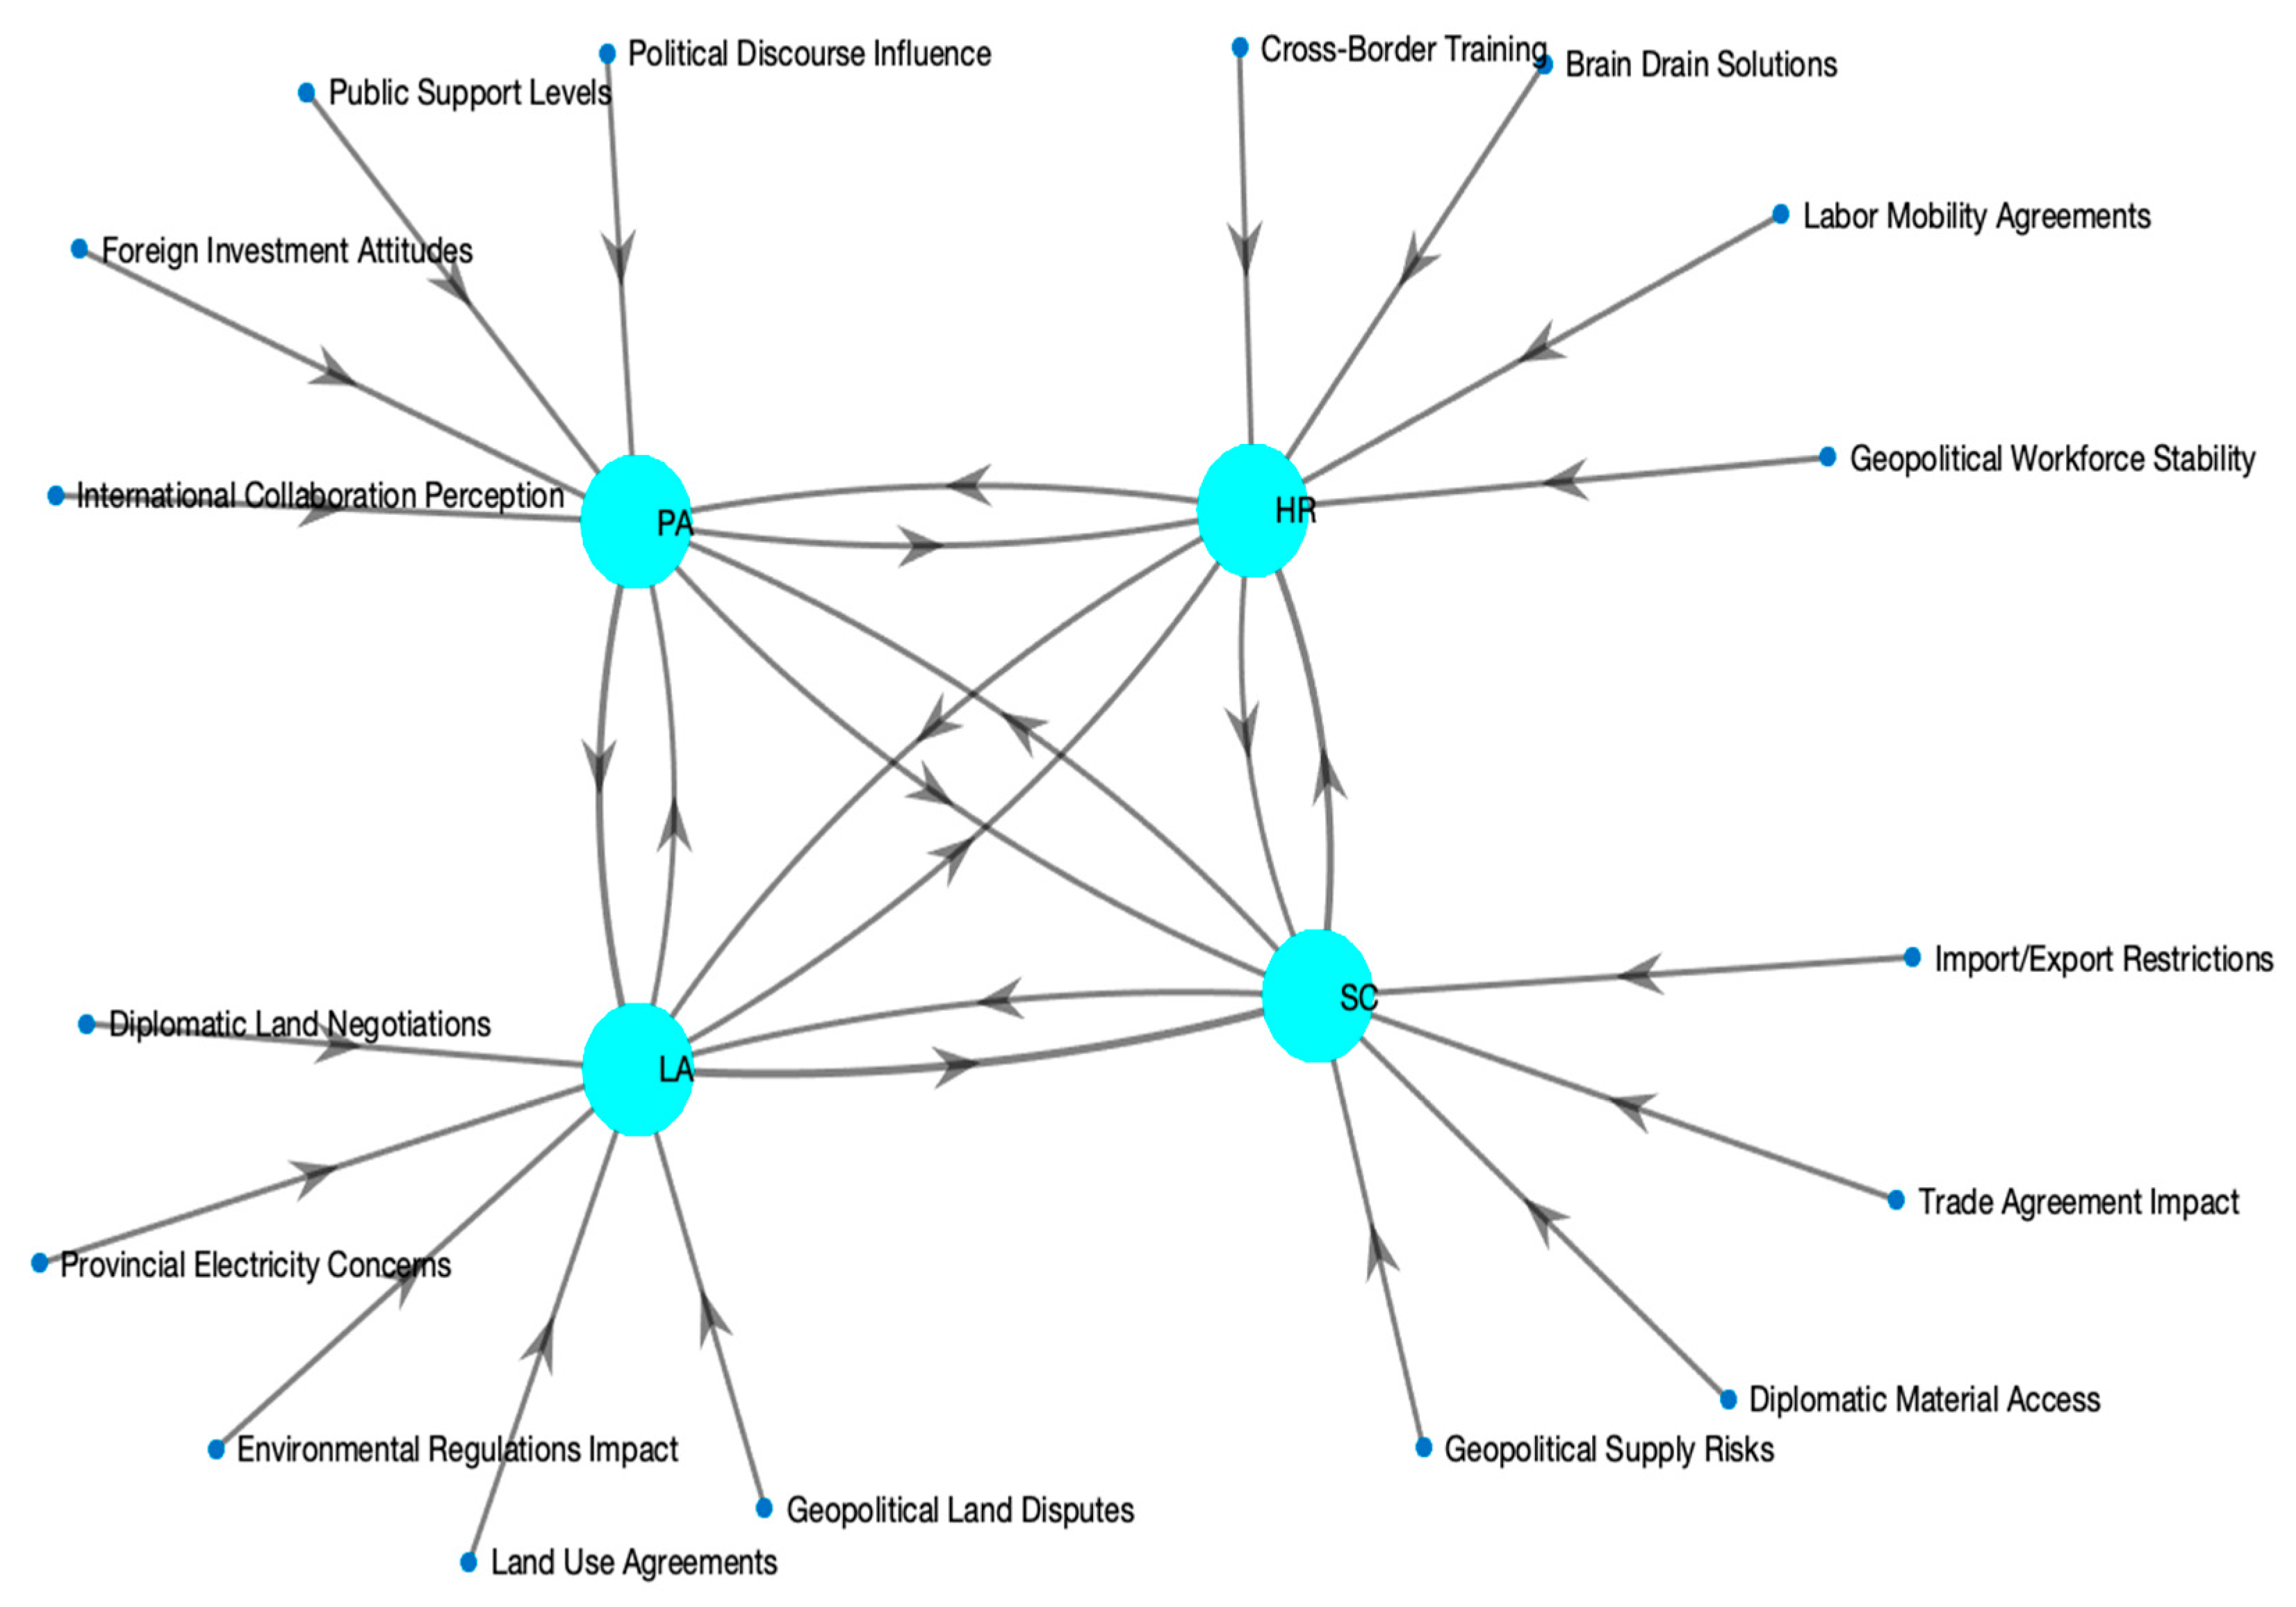
) were determined through a structured methodology that included historical data analysis, literature review, and expert judgment. This ensures that the relative importance of the four main factors—Public Acceptance (PA), Supply Chain Readiness (SC), Human Resource Availability (HR), and Land Availability (LA)—is appropriately represented within the model.
Interaction coefficients () were derived using a combination of historical correlation trends and expert elicitation. This approach captures synergistic or inhibitory relationships between the factors, thereby enhancing the robustness and realism of the model. These coefficients are not arbitrary; they reflect practical interactions grounded in empirical evidence. Depending on the data available, interaction coefficients can range from negative values—representing inhibitory effects—to positive values that indicate synergies. These coefficients are typically normalized between −1 and 1 or 0 and 1 to suit the model’s scaling requirements.
Additionally, the model integrates external variables, such as regulatory policies, environmental impact assessments, and economic forecasts. This enables a more holistic understanding of the context in which SMR construction occurs and enhances the model’s utility in supporting strategic decision making.
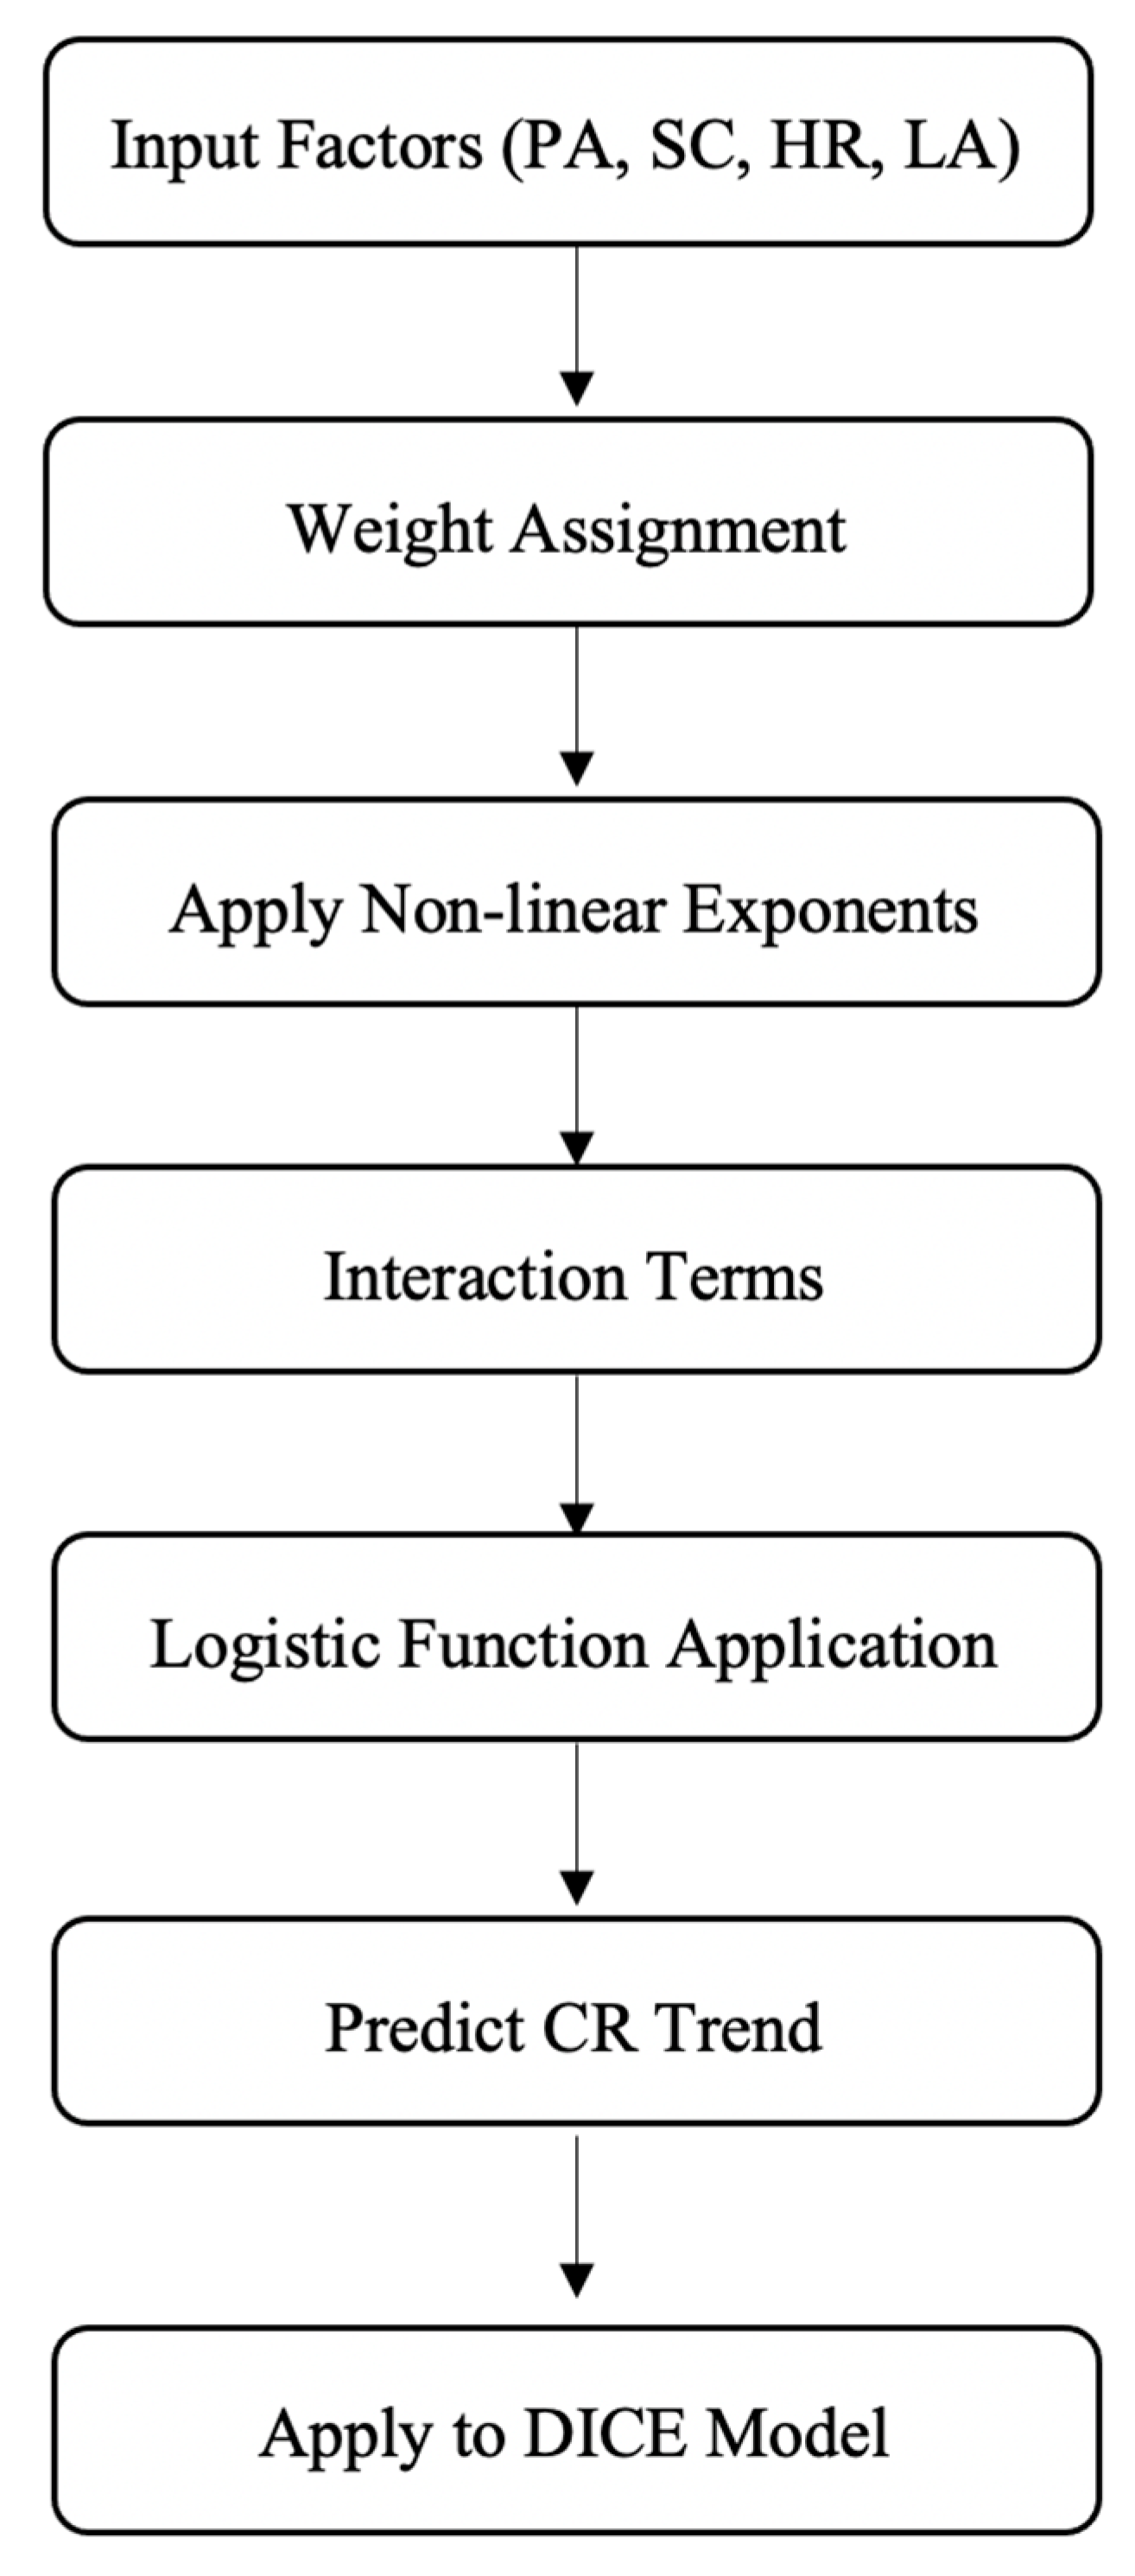
The construction rate () is defined as a function of weighted input factors, non-linear transformations, interaction terms, and external variables. The model uses non-linear functions, dynamic weights, and interaction coefficients to simulate realistic construction rate predictions. The factors represent Public Acceptance, Supply Chain Readiness, Human Resource Availability, and Land Availability, respectively.
The non-linear interaction model is represented as follows:
where
is a non-linear function, such as a logistic function, to map the input factors to the output
.
To model non-linear saturation effects in SMR deployment, a logistic (sigmoid) function was applied to the composite score derived from factor inputs, weights, exponents, and interaction terms. The function is represented as follows:
Here, L defines the upper limit for construction rate, k determines the steepness or sensitivity of the curve, and x0 is the inflection point where growth transitions from acceleration to saturation.
These parameters were not arbitrarily assumed but were selected through a rigorous process:
Upper Bound (L): Derived from historical nuclear deployment capacity observed during peak periods (e.g., in the U.S.), L ensures the model does not produce implausible construction rates and respects infrastructure and policy constraints.
Midpoint (x0): Identified by analyzing historical points where notable acceleration in construction occurred, often when combined readiness scores (e.g., PA and SC) exceeded a threshold. This value marks the tipping point of system readiness.
Slope (k): Calibrated through sensitivity analysis to produce smooth yet responsive transitions. The chosen slope captures the dynamic responsiveness of construction rates to changes in socio-technical readiness, while avoiding abrupt jumps.
These values were validated using cross-country data from the U.S., Japan, and Canada by matching peak construction patterns, slowdown periods, and plateau behaviors. This approach provides interpretability and policy relevance, enabling the model to simulate how readiness factors influence deployment pace under real-world constraints.
The parameters represent the degrees of non-linearity associated with each factor. These parameters allow the model to reflect diminishing returns or increased sensitivity as the values of input factors change. This flexible algebraic structure supports both sensitivity analysis and scenario modeling, making it a powerful tool for planning SMR deployment.
Extend the model to include external variables
as their weight:
Model as random variables to reflect uncertainty in their values. This can be done by specifying distributions for these parameters based on expert input or historical data. Note that in simplest form—if the weights are equal, all variables are certain (0% uncertainty), and there is no non-linearity (linearity), then the function, y, is a sum of four factors, .
For using the proposed mathematical formula to predict future SMR deployment trends, the values for key parameters in the model () must be estimated based on projected trends, expert assessments, and scenario modeling. The factor values can be sourced from global energy transition reports, industry roadmaps, and government policies on nuclear energy expansion. Historical trends, along with data from surveys, workforce projections, and regulatory frameworks, will inform how these factors evolve over time. The weights , which define the relative impact of each factor, can be adjusted dynamically using scenario-based analysis that considers policy shifts, economic conditions, and technological advancements. The interaction coefficients , capturing interdependencies among factors, can be estimated through historical correlation analysis, expert elicitation, or machine learning techniques that infer relationships from past nuclear deployment data. This approach ensures a data-driven framework for SMR deployment forecasting, supporting informed decision making in nuclear energy policy and infrastructure planning.
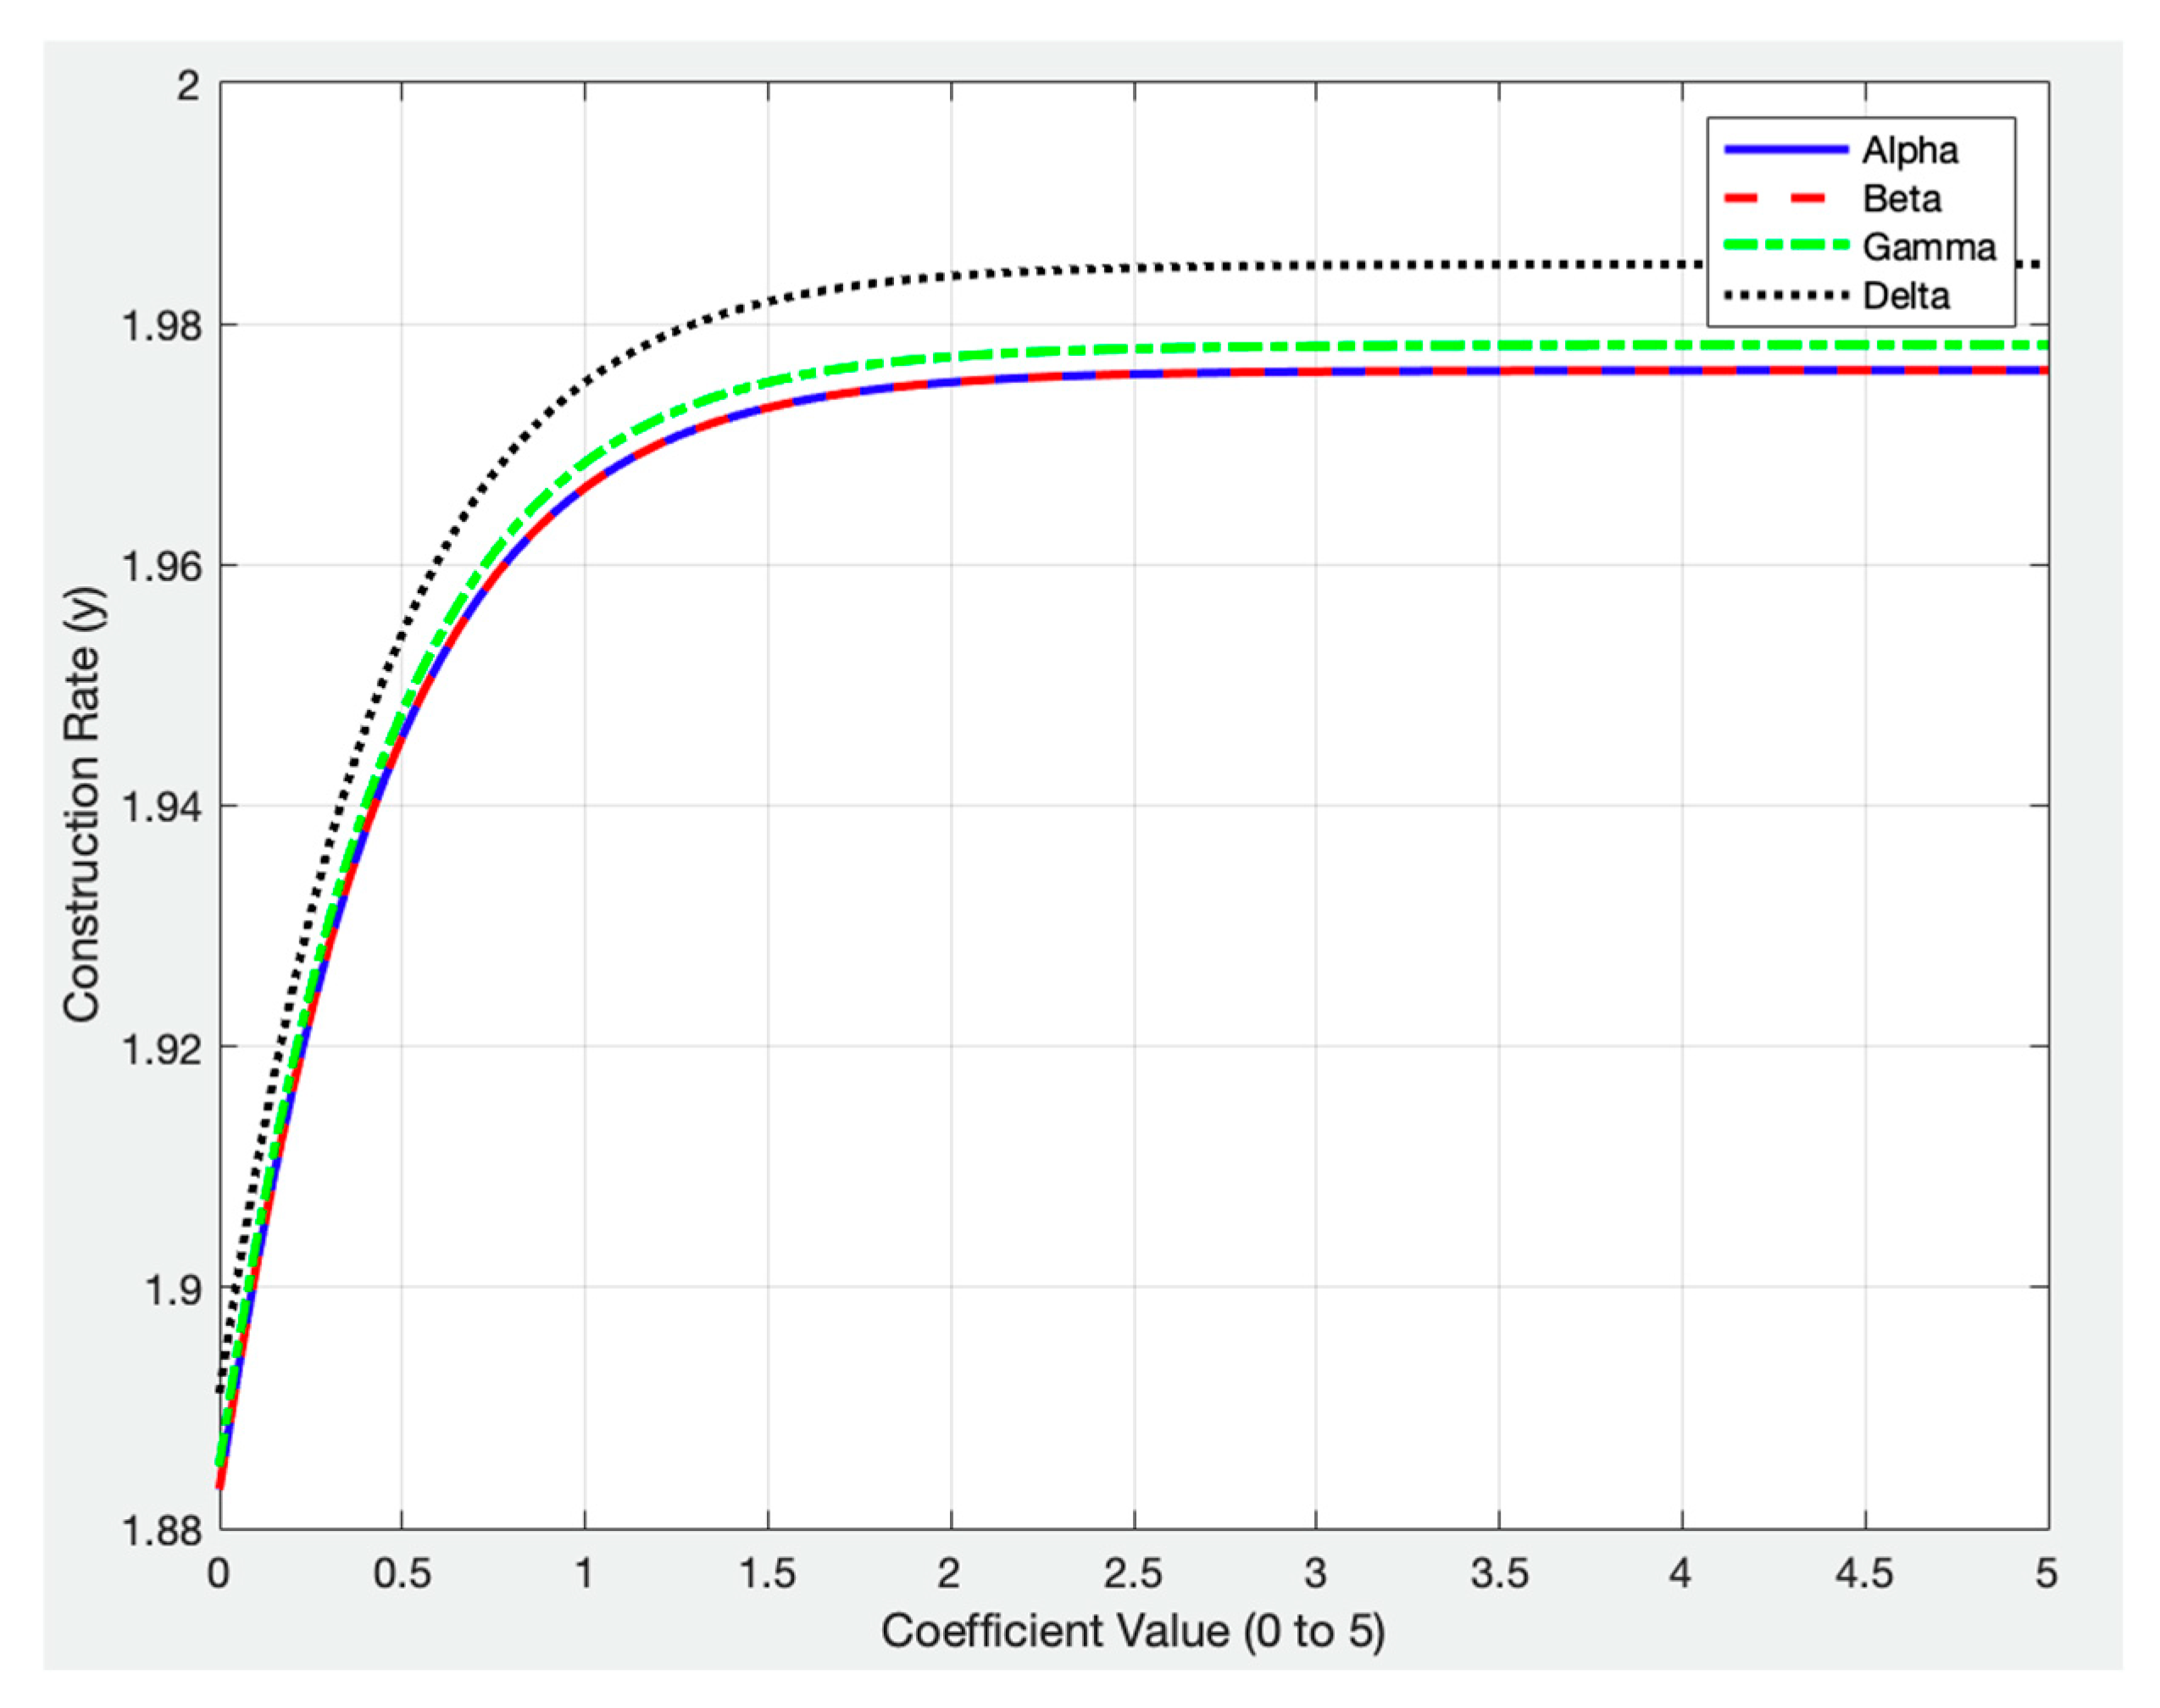
In establishing the boundaries for the coefficients in our model, we consider both the mathematical influence of each parameter and their practical interpretation within clean energy project dynamics. The non-linearity parameters (α, β, γ, δ) capture the responsiveness of construction rates to Public Acceptance, Supply Chain Efficiency, Human Resources, and Land Availability. As shown in
Figure 4, varying each parameter from 0.1 to 5 while keeping others constant confirms that these ranges provide flexibility in modeling scenarios from minimal to strong factor influences. The results indicate that Public Acceptance (α) has the most immediate impact, emphasizing its role in clean energy feasibility. Supply Chain Efficiency (β), Human Resources (γ), and Land Availability (δ) also play crucial roles in project execution, with their influence increasing as they are optimized.
Additionally, weight coefficients (wi) are constrained between 0 and 1, maintaining a proportionate influence of each factor. Interaction coefficients (θij) vary between −1 and 1, capturing synergistic and inhibitory relationships between factors. External variables (vk), such as regulatory shifts and economic changes, are also included, ranging from 0 to 1, to reflect varying degrees of influence. These constraints, supported by empirical data, enhance the model’s applicability and robustness in strategic planning for clean power plant deployment.
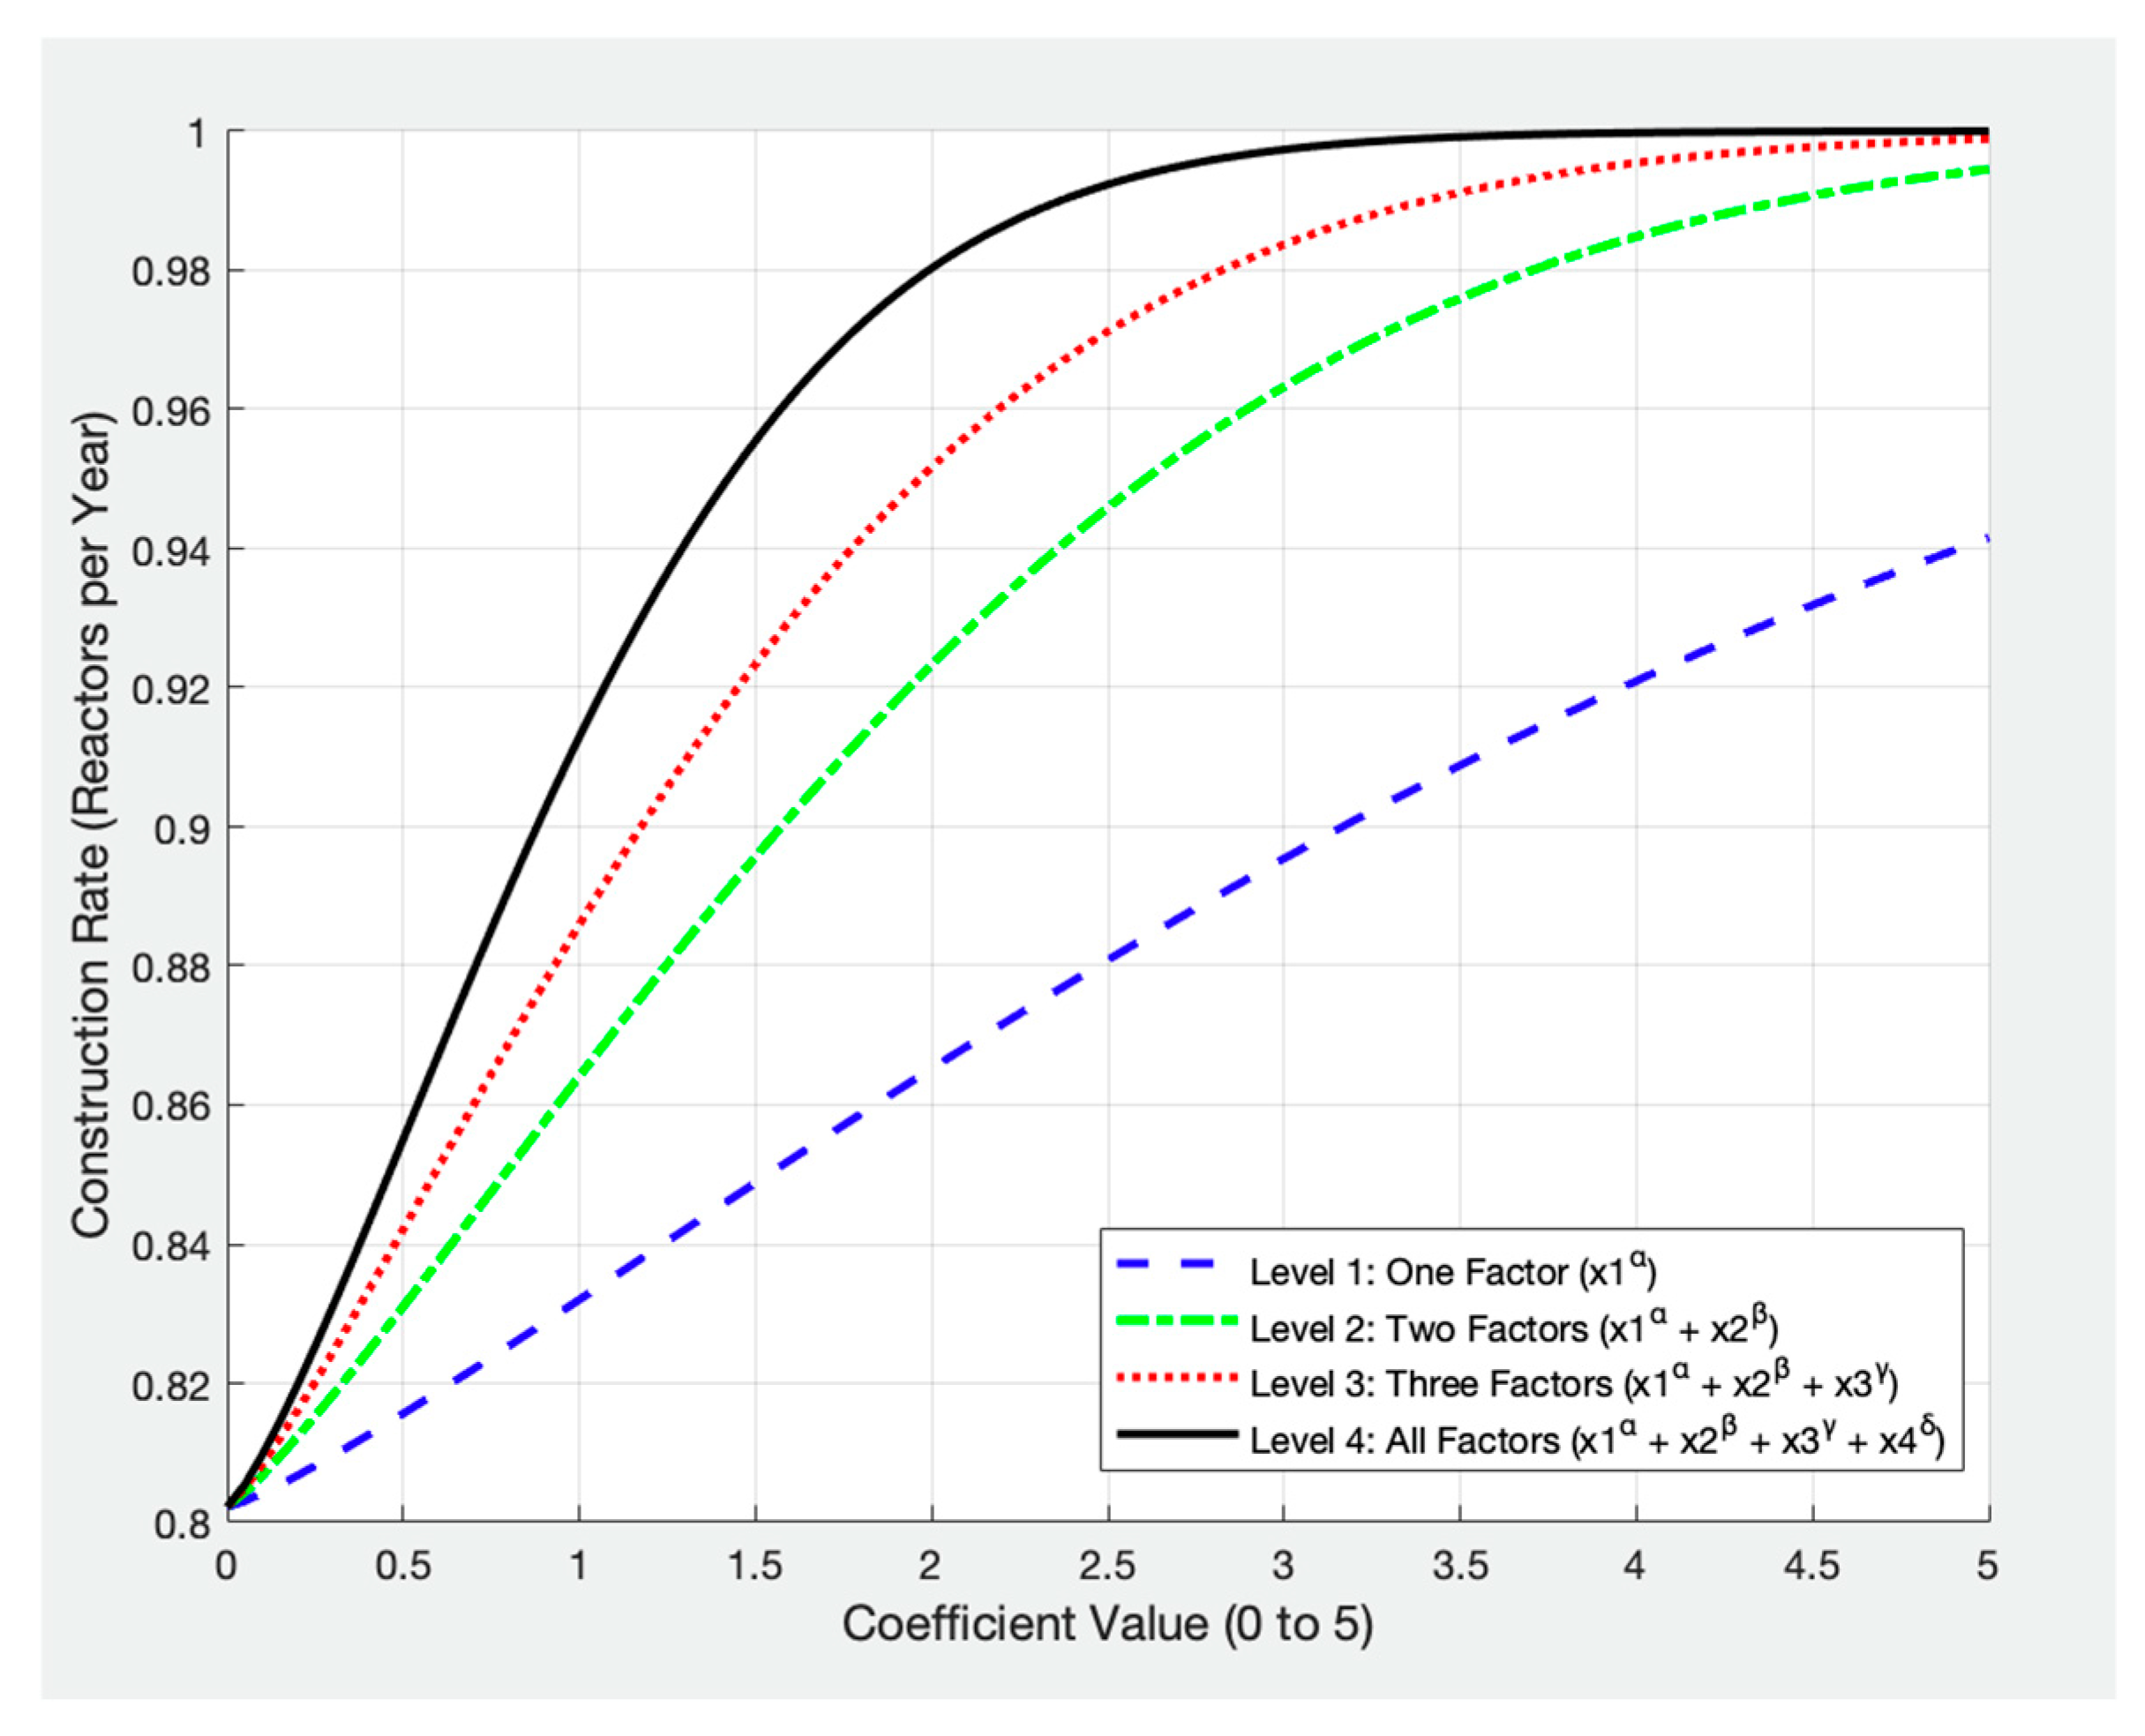
To further analyze the cumulative effect of multiple factors, a stepwise progression of factor influence is examined in
Figure 5, where each factor is sequentially introduced. The results confirm that as one factor improves, the construction rate experiences a moderate increase, but as additional factors improve, the rate increases more significantly. When all four factors reach their maximum values, the construction rate achieves its highest possible level. However, the logistic function introduces a plateau effect, meaning that beyond a certain threshold, further increases in factor contributions result in diminishing returns. This effect prevents overestimation of factor influence and ensures that projections remain realistic.
Following the proposal of our formula, it’s pertinent to draw parallels between the interaction dynamics within our model and those observed in nuclear reactor physics. In nuclear settings, parameters such as geometry and dimensions—or non-leakage probabilities—affect the effectiveness of neutron interactions and, thus, reactor criticality. In a similar vein, our model’s main factors—Public Acceptance (), Supply Chain Efficiency (), Human Resources (), and Land Availability ()—represent the foundational elements of the project environment. These factors are akin to the physical setup in nuclear reactors, influencing the efficiency and readiness of the operational environment in clean power plant construction. The interaction coefficients () in our model parallel the role of non-leakage probabilities in nuclear reactors, adjusting the impact of each factor based on their interrelationships. For example, synergistic effects between high public acceptance and available human resources can significantly expedite construction processes, akin to how optimal reactor geometries enhance neutron economy. Thus, while our model does not incorporate physical dimensions or material properties, it integrates strategic dimensions of project management and resource dynamics that are pivotal in dictating the efficiency and speed of construction projects. This systemic approach allows us to simulate and understand the complexities of implementing clean energy infrastructure effectively.
Building on our model’s formulation, it is essential to note a crucial distinction when comparing it with the six-factor formula used in nuclear reactor physics. While the six-factor formula quantitatively balances to a criticality condition where K-effective is equal to one, symbolizing a steady state in reactor operations, our model does not inherently balance to a specific numeric value. Instead, it adapts to the dynamic inputs reflecting the nuanced realities of construction environments, which may not necessarily converge to a singular ’critical’ point as in nuclear fission. This distinction highlights the adaptive nature of our model, designed to handle a broader range of variables and outcomes in clean energy project deployment.
3.2. Algebraic Mathematical Model Validation
To assess the applicability of the proposed algebraic mathematical model, a validation process was conducted by comparing its predicted nuclear reactor construction rate trends with historical construction patterns in the United States. The primary objective of this validation was to evaluate whether the model captures key shifts in construction activity over time rather than to serve as a precise forecasting tool for individual reactor counts. Since the model functions as an optimization multiplier for refining DICE model projections, achieving exact numerical accuracy was neither expected nor necessary. Instead, the validation focused on verifying that the predicted trend closely follows historical construction rate trends and responds appropriately to key influencing factors: public acceptance (PA), supply chain readiness (SC), human resource availability (HR), and land availability (LA).
The United States was selected for model validation not only because of the availability of reliable data but also due to its diverse history of nuclear development. U.S. nuclear deployment reflects a full spectrum of policy environments, from early expansion driven by energy security through significant disruptions following major nuclear accidents to recent policy shifts promoting nuclear as part of clean energy transitions. This broad range of historical phases makes it a representative case for evaluating the model’s performance in capturing the dynamic behavior of nuclear construction rates globally.
To ensure dataset diversity and test the model’s adaptability, additional validation was conducted using historical data from Japan and Canada, offering varied governance structures, regulatory frameworks, and public engagement processes. While the U.S. reflects a market-based system with federal regulation, Japan presents a hybrid model with centralized industrial strategy and local decision making, and Canada’s nuclear development is shaped at the provincial level. These variations provide a more comprehensive view of nuclear construction dynamics and strengthen the model’s global applicability.
Furthermore, the model was qualitatively applied to France, Russia, Germany, South Korea, and China—countries selected for their distinctive nuclear deployment strategies. These nations include both centralized and decentralized approaches, strong state-driven programs (Russia, China), and policy reversals or public opposition cases (Germany). Although detailed error metrics, such as RPE, were not calculated for these countries, visual comparisons of actual versus predicted construction reveal that the model reasonably captures key inflection points and overall deployment behavior across these different national contexts.
This multi-country validation approach confirms the generalizability of the model across a wide range of nuclear governance types, policy settings, and historical trends, supporting its potential for analyzing future SMR deployment not only in developed but also in developing regions where detailed historical datasets may be limited but strategic planning is emerging.
In regions facing data scarcity—where detailed historical records on nuclear construction are unavailable, incomplete, or unreliable—the model is designed to accommodate these limitations through scenario-based estimations, expert elicitation, and proxy indicators. For example, if public acceptance (PA) cannot be directly measured, regional opinion polls, energy transition policies, or international collaboration agreements can serve as proxies. Supply chain readiness (SC) can be inferred from industrial capacity reports, trade openness, or participation in global nuclear initiatives. Expert judgment fills the remaining gaps, especially in early-stage planning environments. This approach allows the model to remain operational and informative in data-scarce contexts, ensuring its applicability in emerging nuclear nations or future SMR deployment projections.
The validation process followed a structured approach: Step 1. Extracting historical construction data for operational U.S. reactors and calculating actual construction rates per decade; Step 2. Calculating predicted construction rate trends; Step 3. Applying the algebraic mathematical model using assigned weights and transition factors; and Step 4. Comparing the predicted construction rate trend with historical patterns and visually evaluating the model’s ability to replicate key peaks and declines.
Step 1—Collection of historical data on nuclear reactor construction rate trends and calculation of construction rate per decade—To establish a reliable benchmark for validation, historical data on nuclear reactor construction in the United States were gathered from publicly available sources [
39,
40]. The extracted data include a list of operational reactors in the U.S., providing detailed information on their construction start dates, commercial operation dates, and reactor types [
39]. Additionally, the construction rate per decade was calculated by determining the number of completed reactors each decade and dividing it by the corresponding 10-year period. This approach provides an estimated average construction rate (reactors/year) for each decade, offering a clearer visualization of long-term construction rate trends as summarized in
Table 3.
The data in
Table 3 reveal a significant rise in reactor construction during the 1970s and 1980s, followed by a sharp decline in the 1990s and beyond. The peak construction period occurred between 1970 and 1990, aligning with historical policy shifts, technological advancements, and industry expansion. The slowdown in construction post-1990 reflects factors such as regulatory changes and reduced public acceptance.
By incorporating this historical data into the algebraic model, we aim to validate whether the predicted trend follows these observed construction patterns. In the next step, we apply the model to analyze its ability to replicate these trends.
Step 2—Calculating predicted construction rate trends—The algebraic model integrates key socio-economic and infrastructure parameters to analyze historical nuclear construction rate trends. The goal is to assess whether the expected trend aligns with actual construction patterns, particularly capturing periods of peak deployment (1970–1990) and the subsequent decline (1990-present). The mathematical formulation of the model is expressed as follows:
where:
= Public Acceptance (PA);
= Supply Chain Readiness (SC);
= Human Resource Availability (HR);
= Land Availability (LA);
= Weight coefficients assigned to each factor, derived from historical data;
= Interaction coefficients between factors, capturing interdependencies;
= Logistic function for non-linearity, accounting for saturation effects in factor contributions.
This model does not forecast future construction rates but rather analyzes historical trends by identifying key drivers behind fluctuations in nuclear deployment rates. The logistic function ensures that increases in specific factors do not yield unbounded growth, reflecting real-world constraints. By applying this model to historical U.S. nuclear construction data, we evaluate its ability to replicate observed patterns of expansion, peak construction, and slowdown.
Step 3—Applying the algebraic mathematical model using assigned weights and transition factors—Since comprehensive real-world data for all parameters are not readily available, historical trends in Public Acceptance (PA) and Supply Chain Readiness (SC) were inferred from literature, policy shifts, and industry reports, as summarized in
Table 4. Human Resource Availability (HR) and Land Availability (LA) were held constant, as historical data indicate they have remained stable over time, as shown in
Table 5.
The historical values in
Table 4 illustrate how public sentiment and supply chain efficiency have evolved over time, shaped by major nuclear incidents, policy changes, and technological advancements. To maintain model simplicity, the relatively stable HR and LA factors were excluded from decade-specific variations, as shown in
Table 5.
As detailed in
Table 6, weight coefficients were assigned based on their historical significance to account for historical trends in nuclear construction.
The weights reflect how each factor influenced construction rate trends over time, ensuring that the algebraic model captures major industry shifts.
To model historical trends more accurately, non-linearity parameters and interaction coefficients were incorporated. These parameters account for historical diminishing returns and interdependencies that have shaped U.S. nuclear construction rates, as detailed in
Table 7 and
Table 8.
These coefficients ensure the model captures historical trends, including:
The decline in construction rates following major nuclear incidents (Three Mile Island 1979, Chernobyl 1986, Fukushima 2011).
The supply chain and workforce bottlenecks that slowed nuclear deployment post-1990.
The policy-driven nature of land availability.
The model uses a logistic function to accurately capture historical trends. This function accounts for non-linearity by ensuring that beyond a certain threshold, additional increases in PA, SC, and other parameters yield diminishing returns.
To compute the historical trend, the algebraic model was applied using MATLAB version R2020b, with the assigned weights, interaction coefficients, and non-linearity parameters. The next section compares predicted vs. actual trends.
Step 4—Comparing the predicted construction rate trend with historical patterns and visually evaluating the model’s ability to replicate key peaks and declines—To assess the model’s effectiveness in capturing historical nuclear construction trends, the algebraic mathematical model was applied to estimate the construction rate trend for different decades. The predicted values were then compared with actual historical data to evaluate the alignment of the model’s output with observed nuclear deployment trends. Since the algebraic model is designed to capture historical trends rather than predict exact construction rates, its validation focuses on whether the predicted trend aligns with observed historical patterns rather than achieving precise numerical agreement.
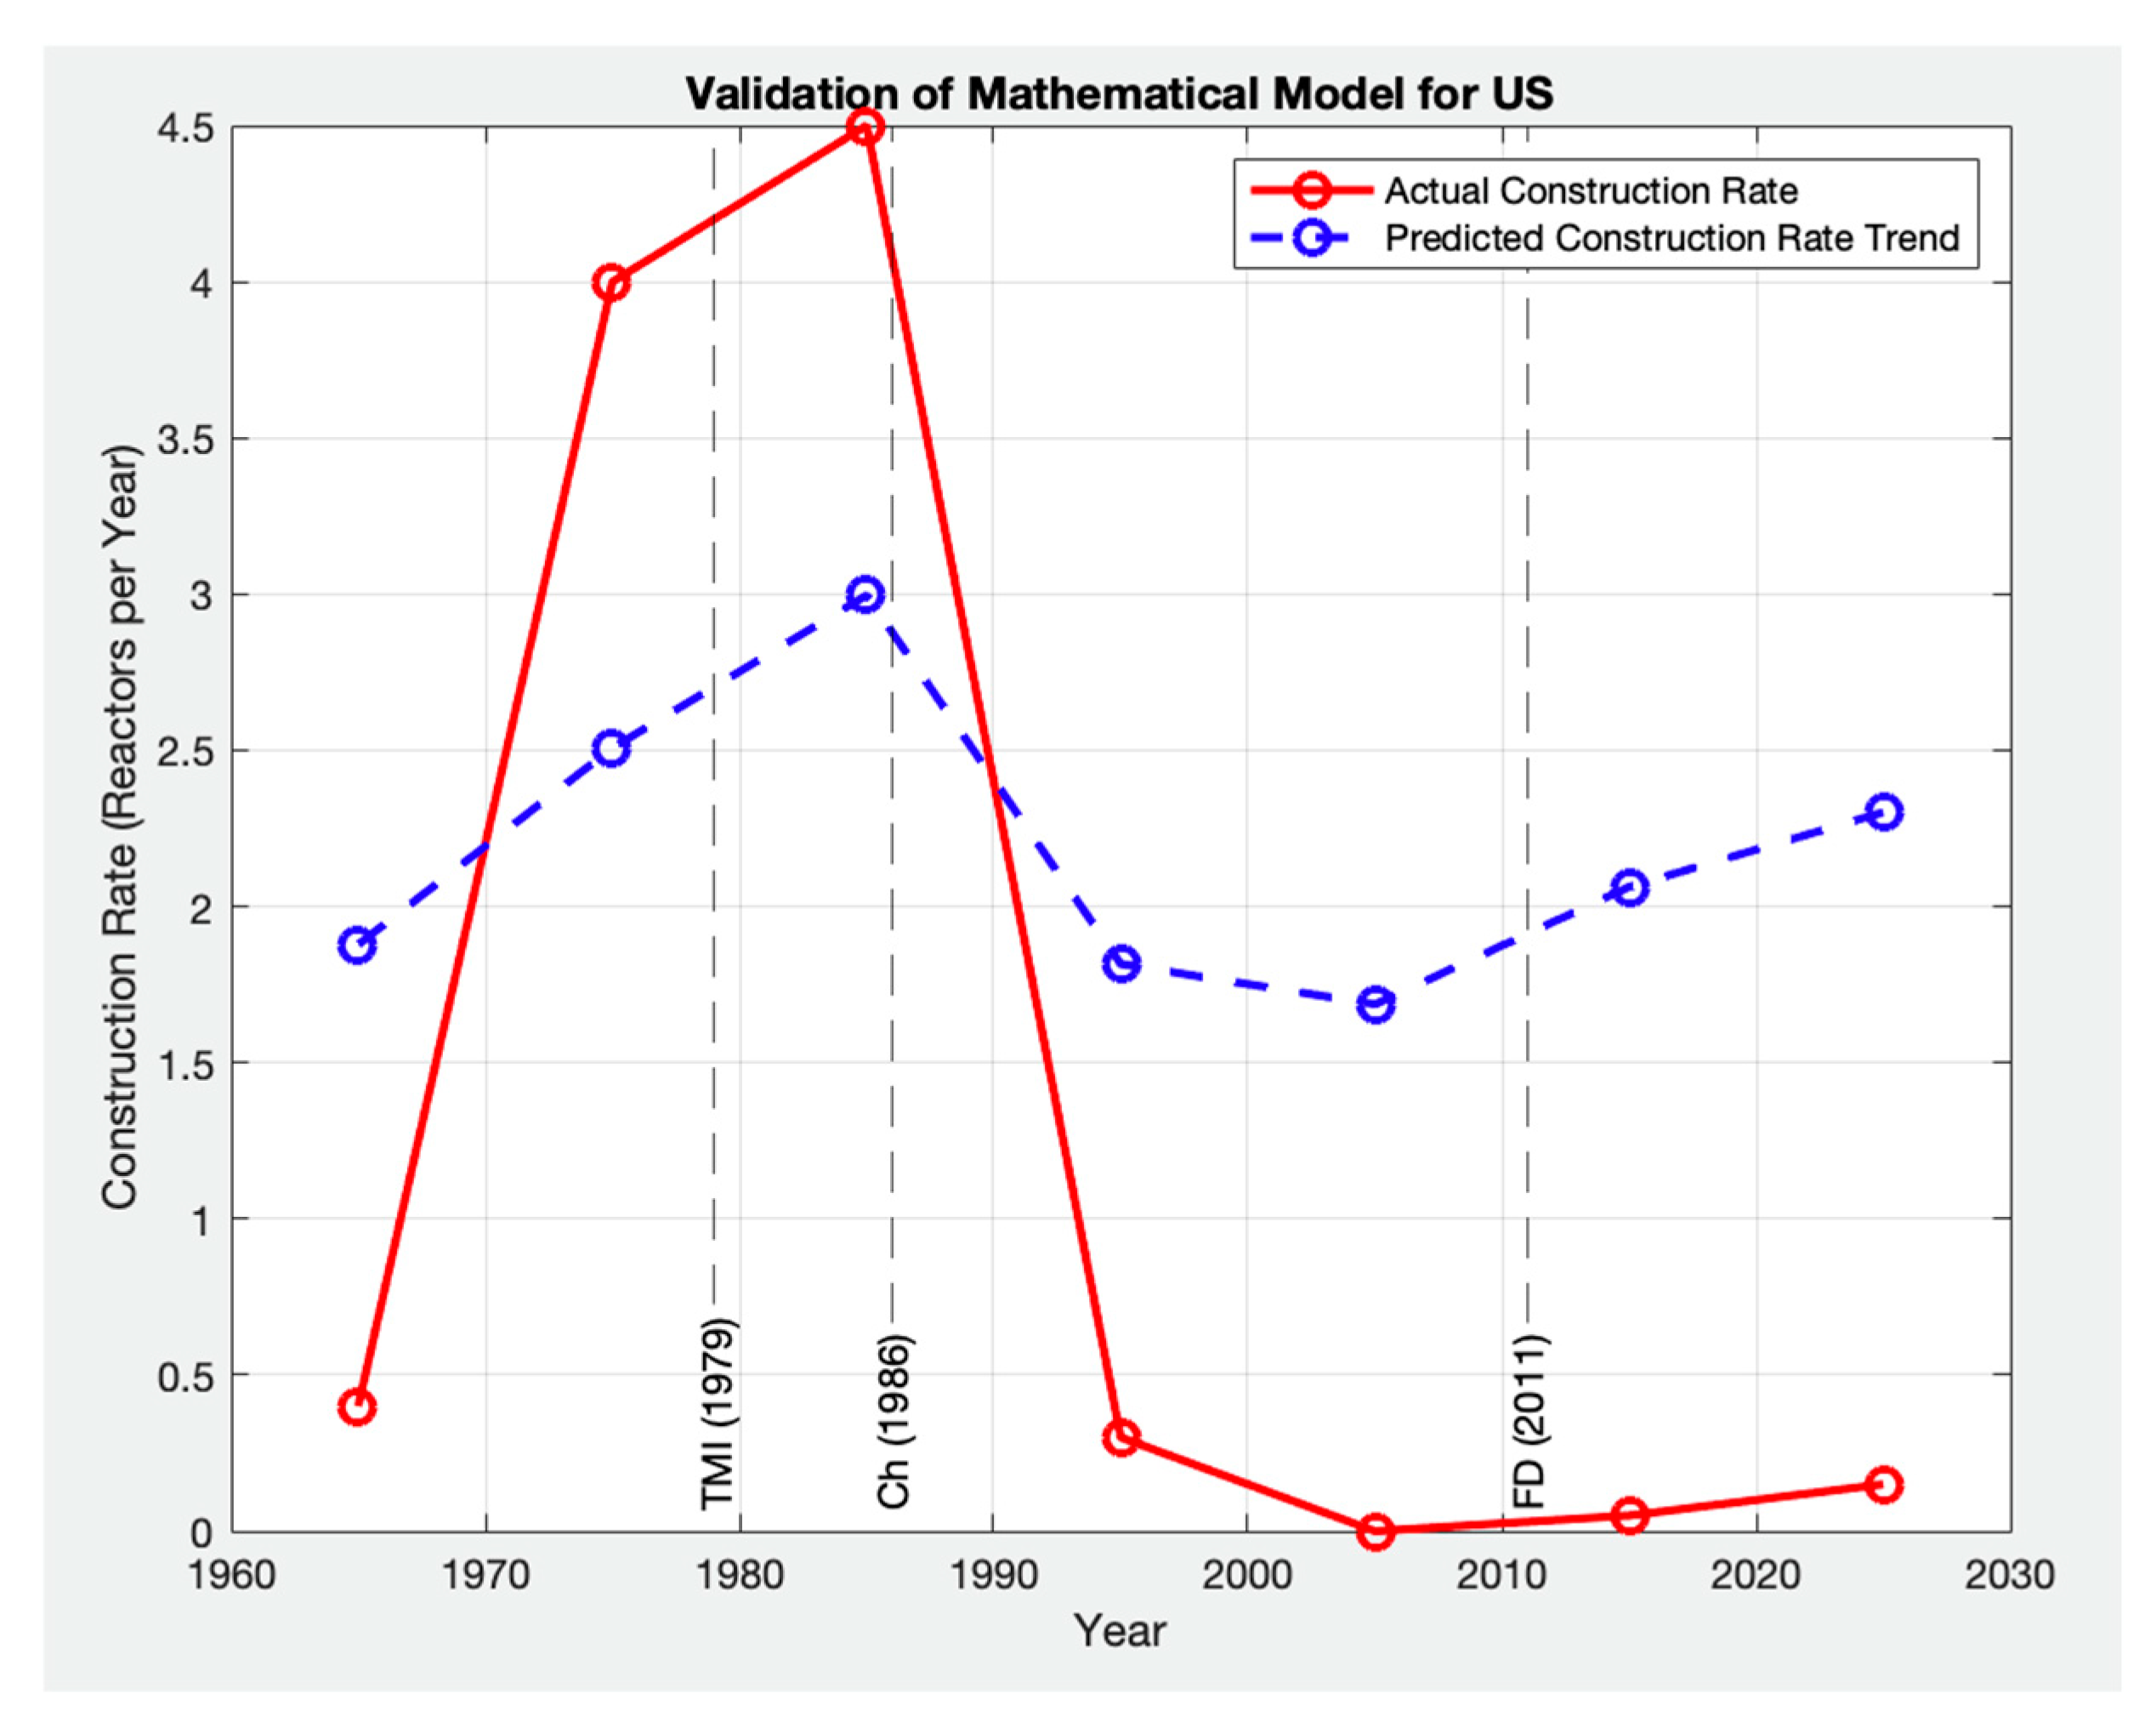
Figure 6 compares the actual historical construction rate trends (red solid line) with the predicted trend generated by the algebraic model (blue dashed line). The key observations from
Figure 6 are as follows:
The model correctly captures the overall trajectory of nuclear construction, reflecting the rise in reactor deployment during the 1970s and 1980s and the decline after 1990.
The peak in the 1970s–1980s aligns with historical data, corresponding to high public acceptance, strong supply chain readiness, and policy-driven expansion.
The model approximates the long-term downward trend after 1986, but the sharp post-1990 decline in actual construction is steeper, likely due to regulatory shifts and policy shocks (e.g., Three Mile Island in 1979, Chernobyl in 1986, and Fukushima in 2011).
In the post-2000 period, the model captures the slow recovery trend, suggesting that improvements in public acceptance and supply chain readiness contribute to a modest increase in potential deployment rates.
The algebraic model successfully captures key transition points in nuclear deployment history by incorporating major influencing factors such as the following:
Public sentiment toward nuclear energy (supporting early expansion, later declining post-1986).
Supply chain capacity and readiness, which influenced reactor construction timelines.
In conclusion, the results confirm that the algebraic model serves as a robust tool for analyzing nuclear construction trends, with a strong alignment between predicted and actual values. The algebraic model effectively represents historical nuclear construction rate trends, providing valuable insights into the factors influencing reactor deployment rates across different periods. By capturing these trends, the model serves as a useful tool for energy transition analysis and nuclear deployment planning, offering a structured approach to understanding the dynamics that have shaped nuclear energy growth over time.
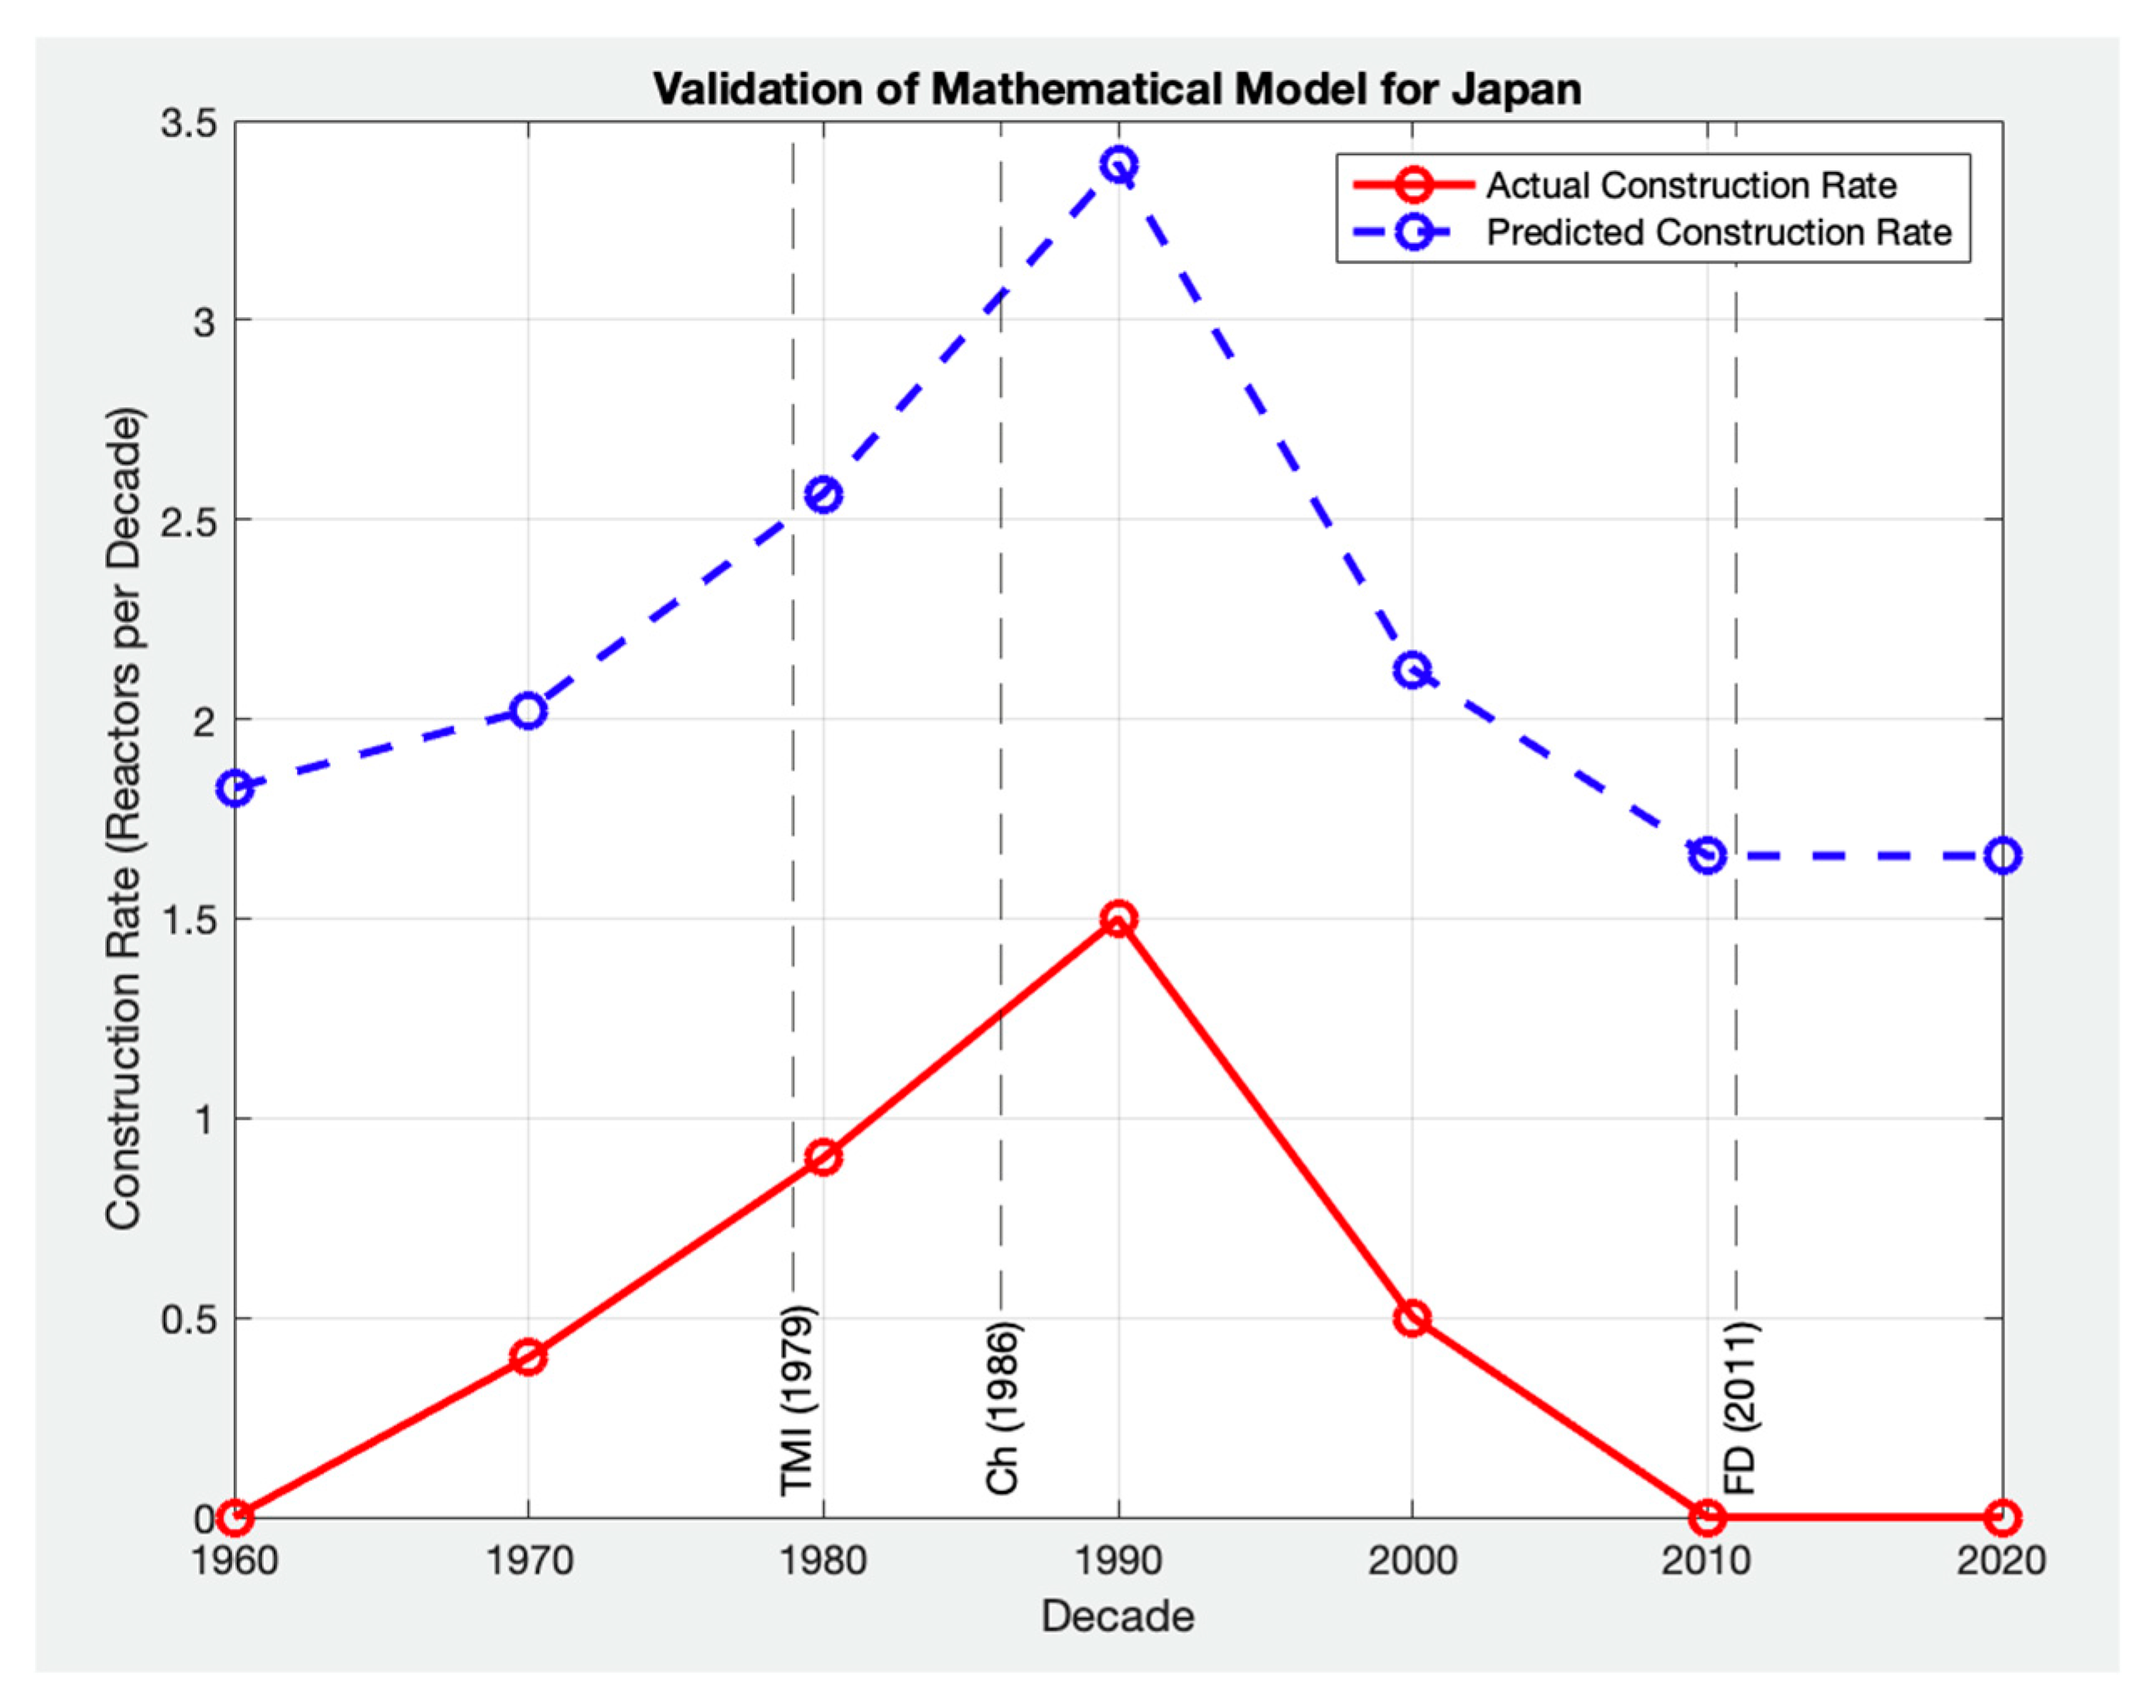
In addition to validating the model using historical data from the United States, we extended the validation process by applying the model to Japan [
67,
68,
69,
70,
71,
72] and Canada [
73,
74,
75,
76,
77,
78,
79].
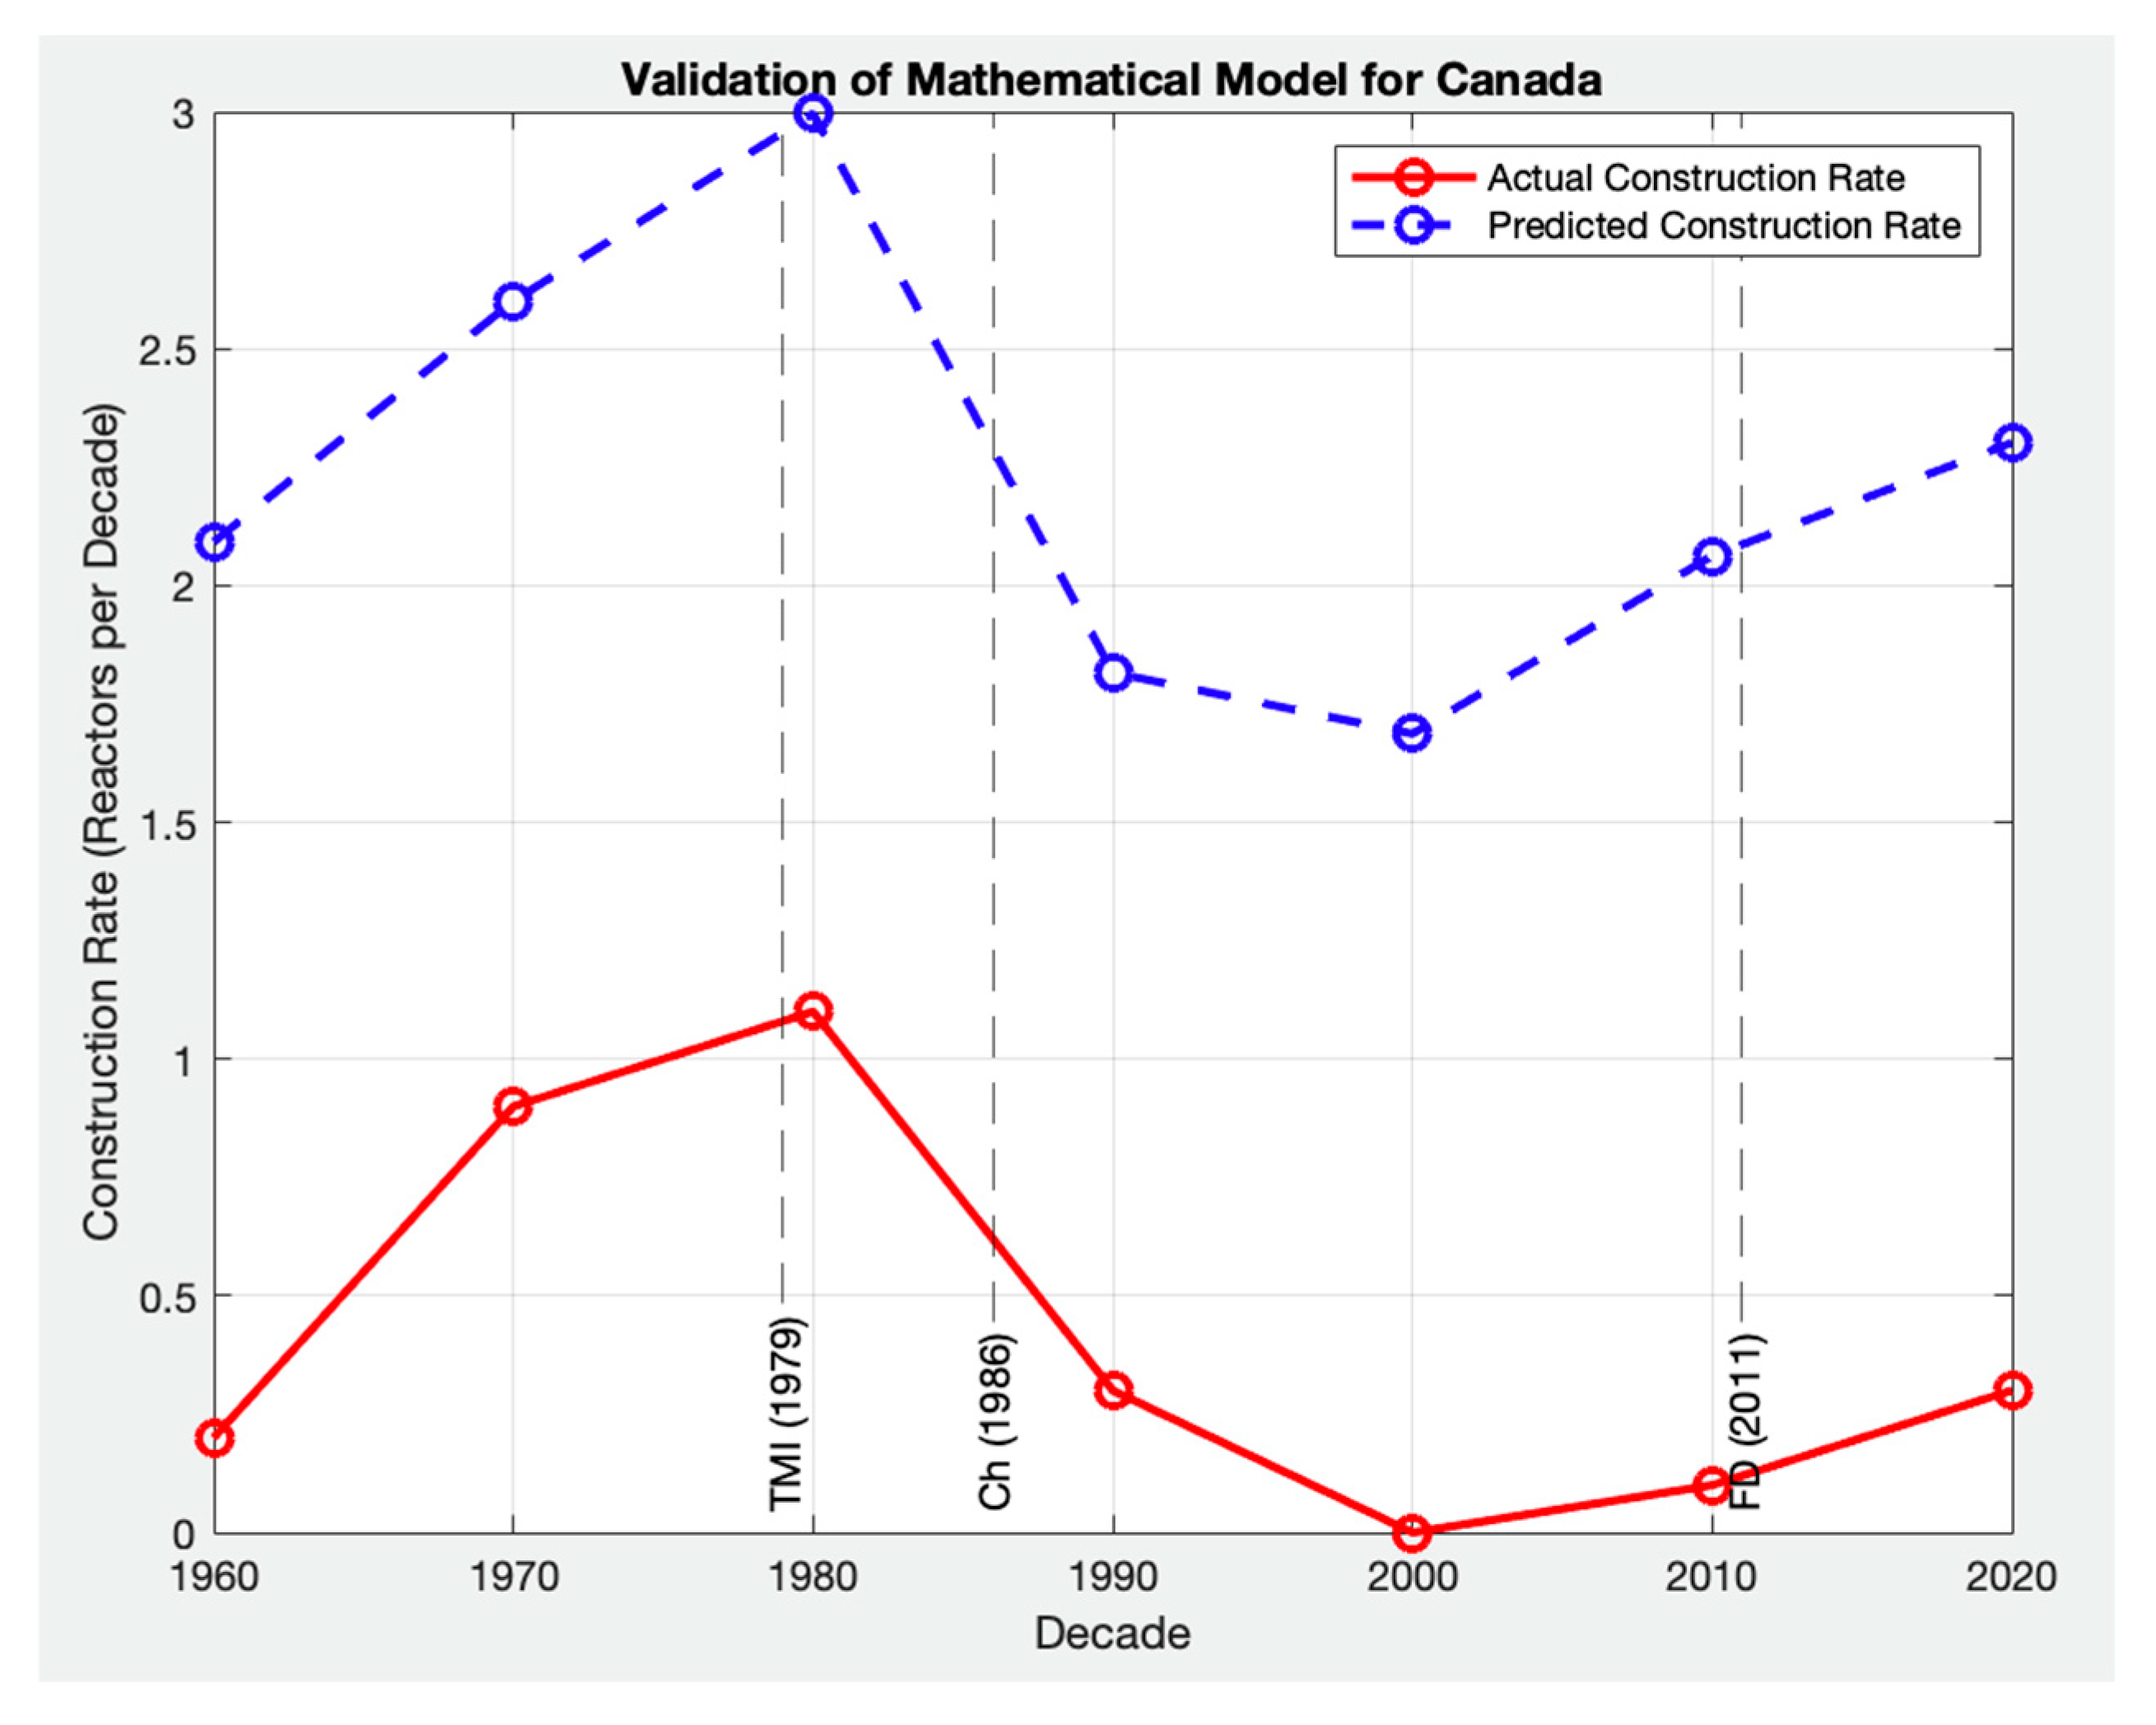
Figure 7 and
Figure 8 illustrate the comparison between actual historical construction rates, shown as red solid lines, and the predicted trends generated by the algebraic model, represented by blue dashed lines, for these three countries.
By expanding the validation across different datasets, we aimed to assess the model’s robustness in capturing nuclear construction trends in regions with varying historical data availability. The dataset for the United States contained significantly more data points, serving as a benchmark for validation. Japan had a moderate number of data points, allowing for a reasonable comparison, whereas Canada had the fewest data points, presenting a greater challenge for validation. Unlike the United States, where nuclear policy is managed at the national level, Canada’s nuclear development is determined at the provincial level. In Japan, nuclear policy is managed by federal and industrial sectors, while the ultimate decision (Yes or No) rests with the Prefectural governor’s office. This leads to regional variations in construction trends and policy decisions, influencing data availability and consistency. Additionally, Canada’s historical nuclear construction data are limited, reflecting only three provinces, with just two having modest single-plant deployments. This makes direct comparisons challenging and may not accurately represent future SMR rollouts, which are expected to follow different trajectories. Unlike traditional large nuclear plants, SMRs could be deployed off-grid, owned by non-utility entities, or even province-owned in Canada, fundamentally altering construction pathways. Given the slow progress of both global and Ontario’s clean energy transition, alternative and accelerated deployment strategies must be considered to meet net-zero targets within the required timeframe.
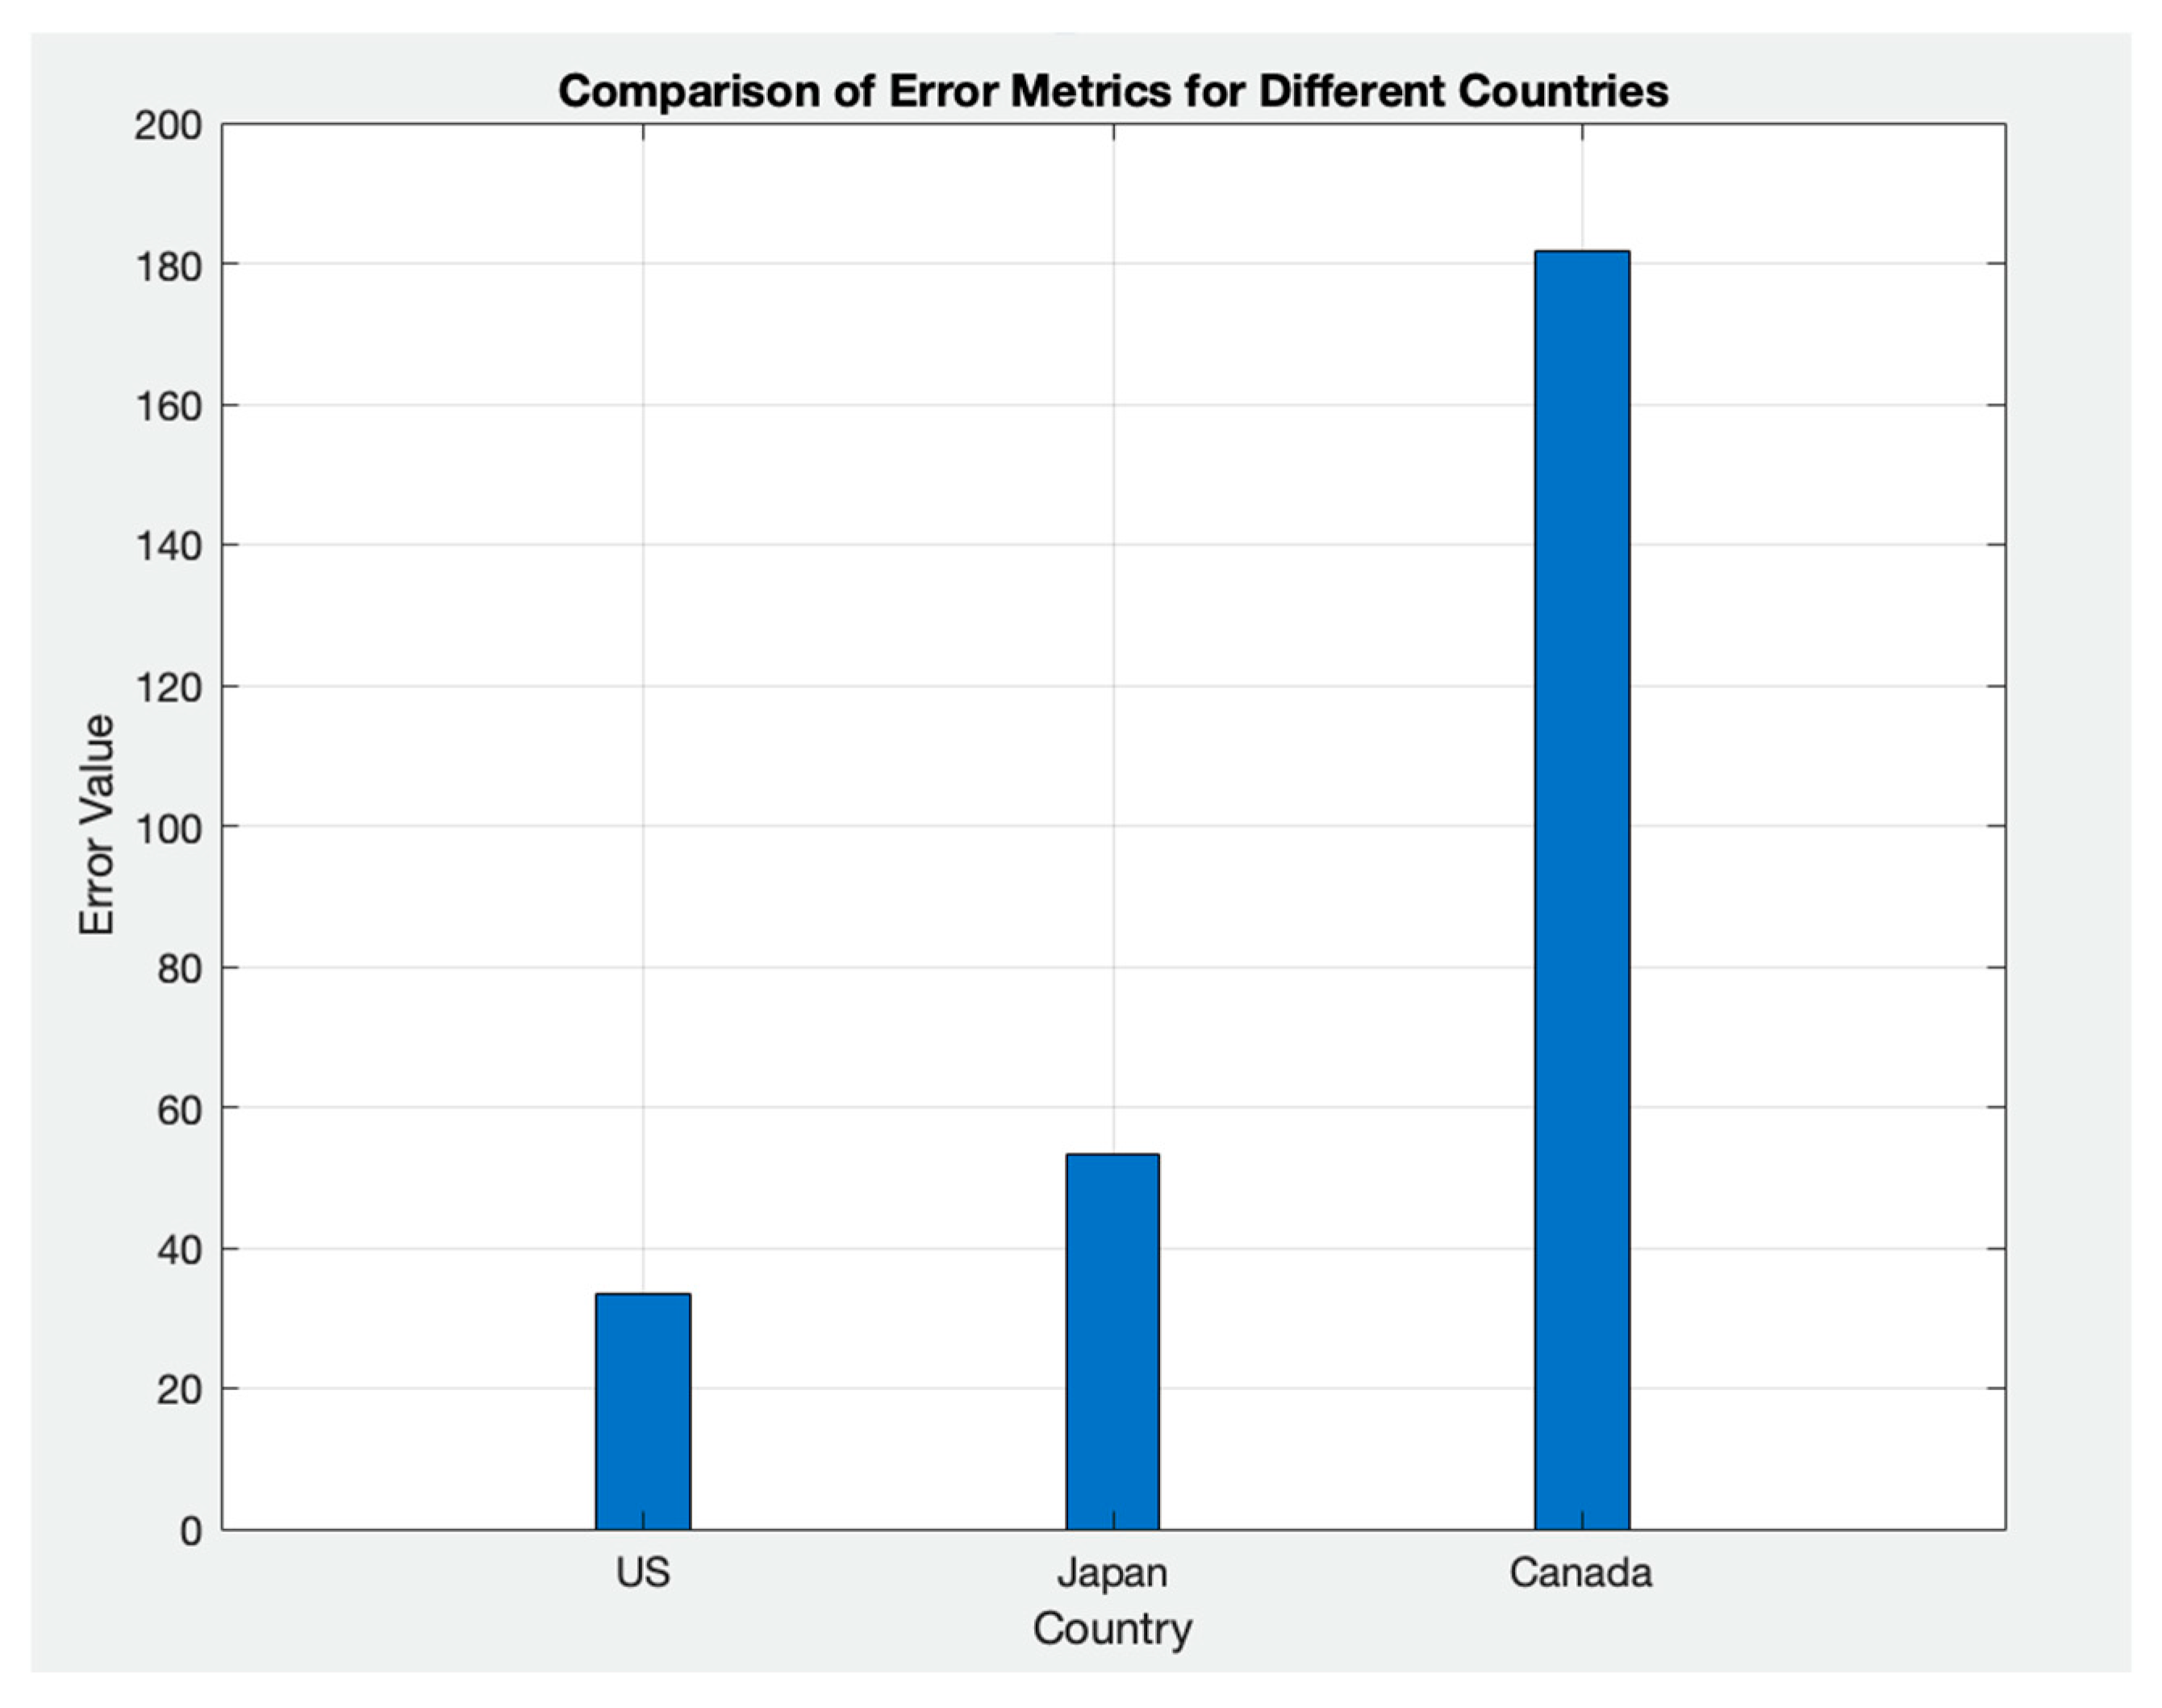
To evaluate model performance, we used Relative Percentage Error (RPE), as it is better suited for assessing how well the model captures construction rate trends over time rather than exact values. Unlike Root Mean Squared Error (RMSE), which emphasizes large deviations by squaring errors, or Mean Absolute Percentage Error (MAPE), which measures average percentage deviations from actual values, RPE provides a normalized measure that allows comparison across datasets with sparse or small historical values—common in nuclear deployment records. This aligns with the study’s core objective: capturing long-term behavior for policy and scenario planning, not precise forecasting. The RPE is calculated using the following formula:
where A represents the actual historical values, and P represents the predicted values generated by the model. This metric provides a normalized measure of error, allowing for a comparative assessment across datasets of varying sizes and historical trends [
80].
Figure 9 illustrates that the United States, with the most extensive dataset, exhibited the lowest error while successfully capturing the overall trend of nuclear construction rates. The model followed historical construction patterns, including trend shifts, peak construction periods, and post-1986 declines. While the predicted trend closely aligned with the actual historical trajectory, the predicted construction rate values did not always match the exact data points.
Similarly, in Japan, which had moderate historical data (~50 reactors before 2011), the model validation demonstrated a reasonable level of accuracy, capturing the overall trend but showing some deviations around peak construction periods. In contrast, Canada had the smallest dataset (<20 reactors) and exhibited the highest error despite the model successfully predicting the general trend of nuclear construction over time. For both Japan and Canada, the predicted trend is accurate; the difference indicates one or more composite factors that characterize CR versus decades in time. We note that the challenge in Canada stemmed from multiple plants located in just two sites (Ontario) and one unit, originally in Quebec and New Brunswick. The limited number of total plants constructed impacts the model’s ability to predict/characterize construction rates.
These findings highlight that while the model accurately predicts long-term trends across all three countries, its precision is influenced by the availability of the set of details surrounding the decisions to go forward, i.e., to construct. The United States dataset, with its comprehensive historical records, enabled the model to capture the “construction-to-connection” scenario. In contrast, the larger gaps for Japan and Canada support that the 6-factor model is largely correct but composite differences generate gaps. This analysis reinforces the idealized (legacy, circ 1960s) characterization of initial commitments to nuclear, compared to updated commitments to nuclear energy to address clean energy infrastructure deployment. Due diligence with respect to the circumstances that resulted in going forward, and repeated so is important. However, due to the decades that have passed, updating the details that comprise the will to go forward again under a similar and different impetus (circa 2025) is just as or even more important.
The validation of the proposed model against historical construction rates provides a foundation for assessing its applicability to future projections. While the historical construction rates of nuclear power plants, as presented in
Figure 6,
Figure 7 and
Figure 8, offer a useful reference for model validation, it is essential to acknowledge that SMRs differ significantly from traditional large-scale reactors in their deployment characteristics. Their smaller footprint, modular nature, and increased in-factory construction efficiency suggest that SMRs could achieve construction rates exceeding those historically observed for conventional nuclear plants. This distinction highlights the need for model parameters that account for the evolving nature of nuclear deployment strategies, ensuring that projections remain relevant to future energy transition scenarios.
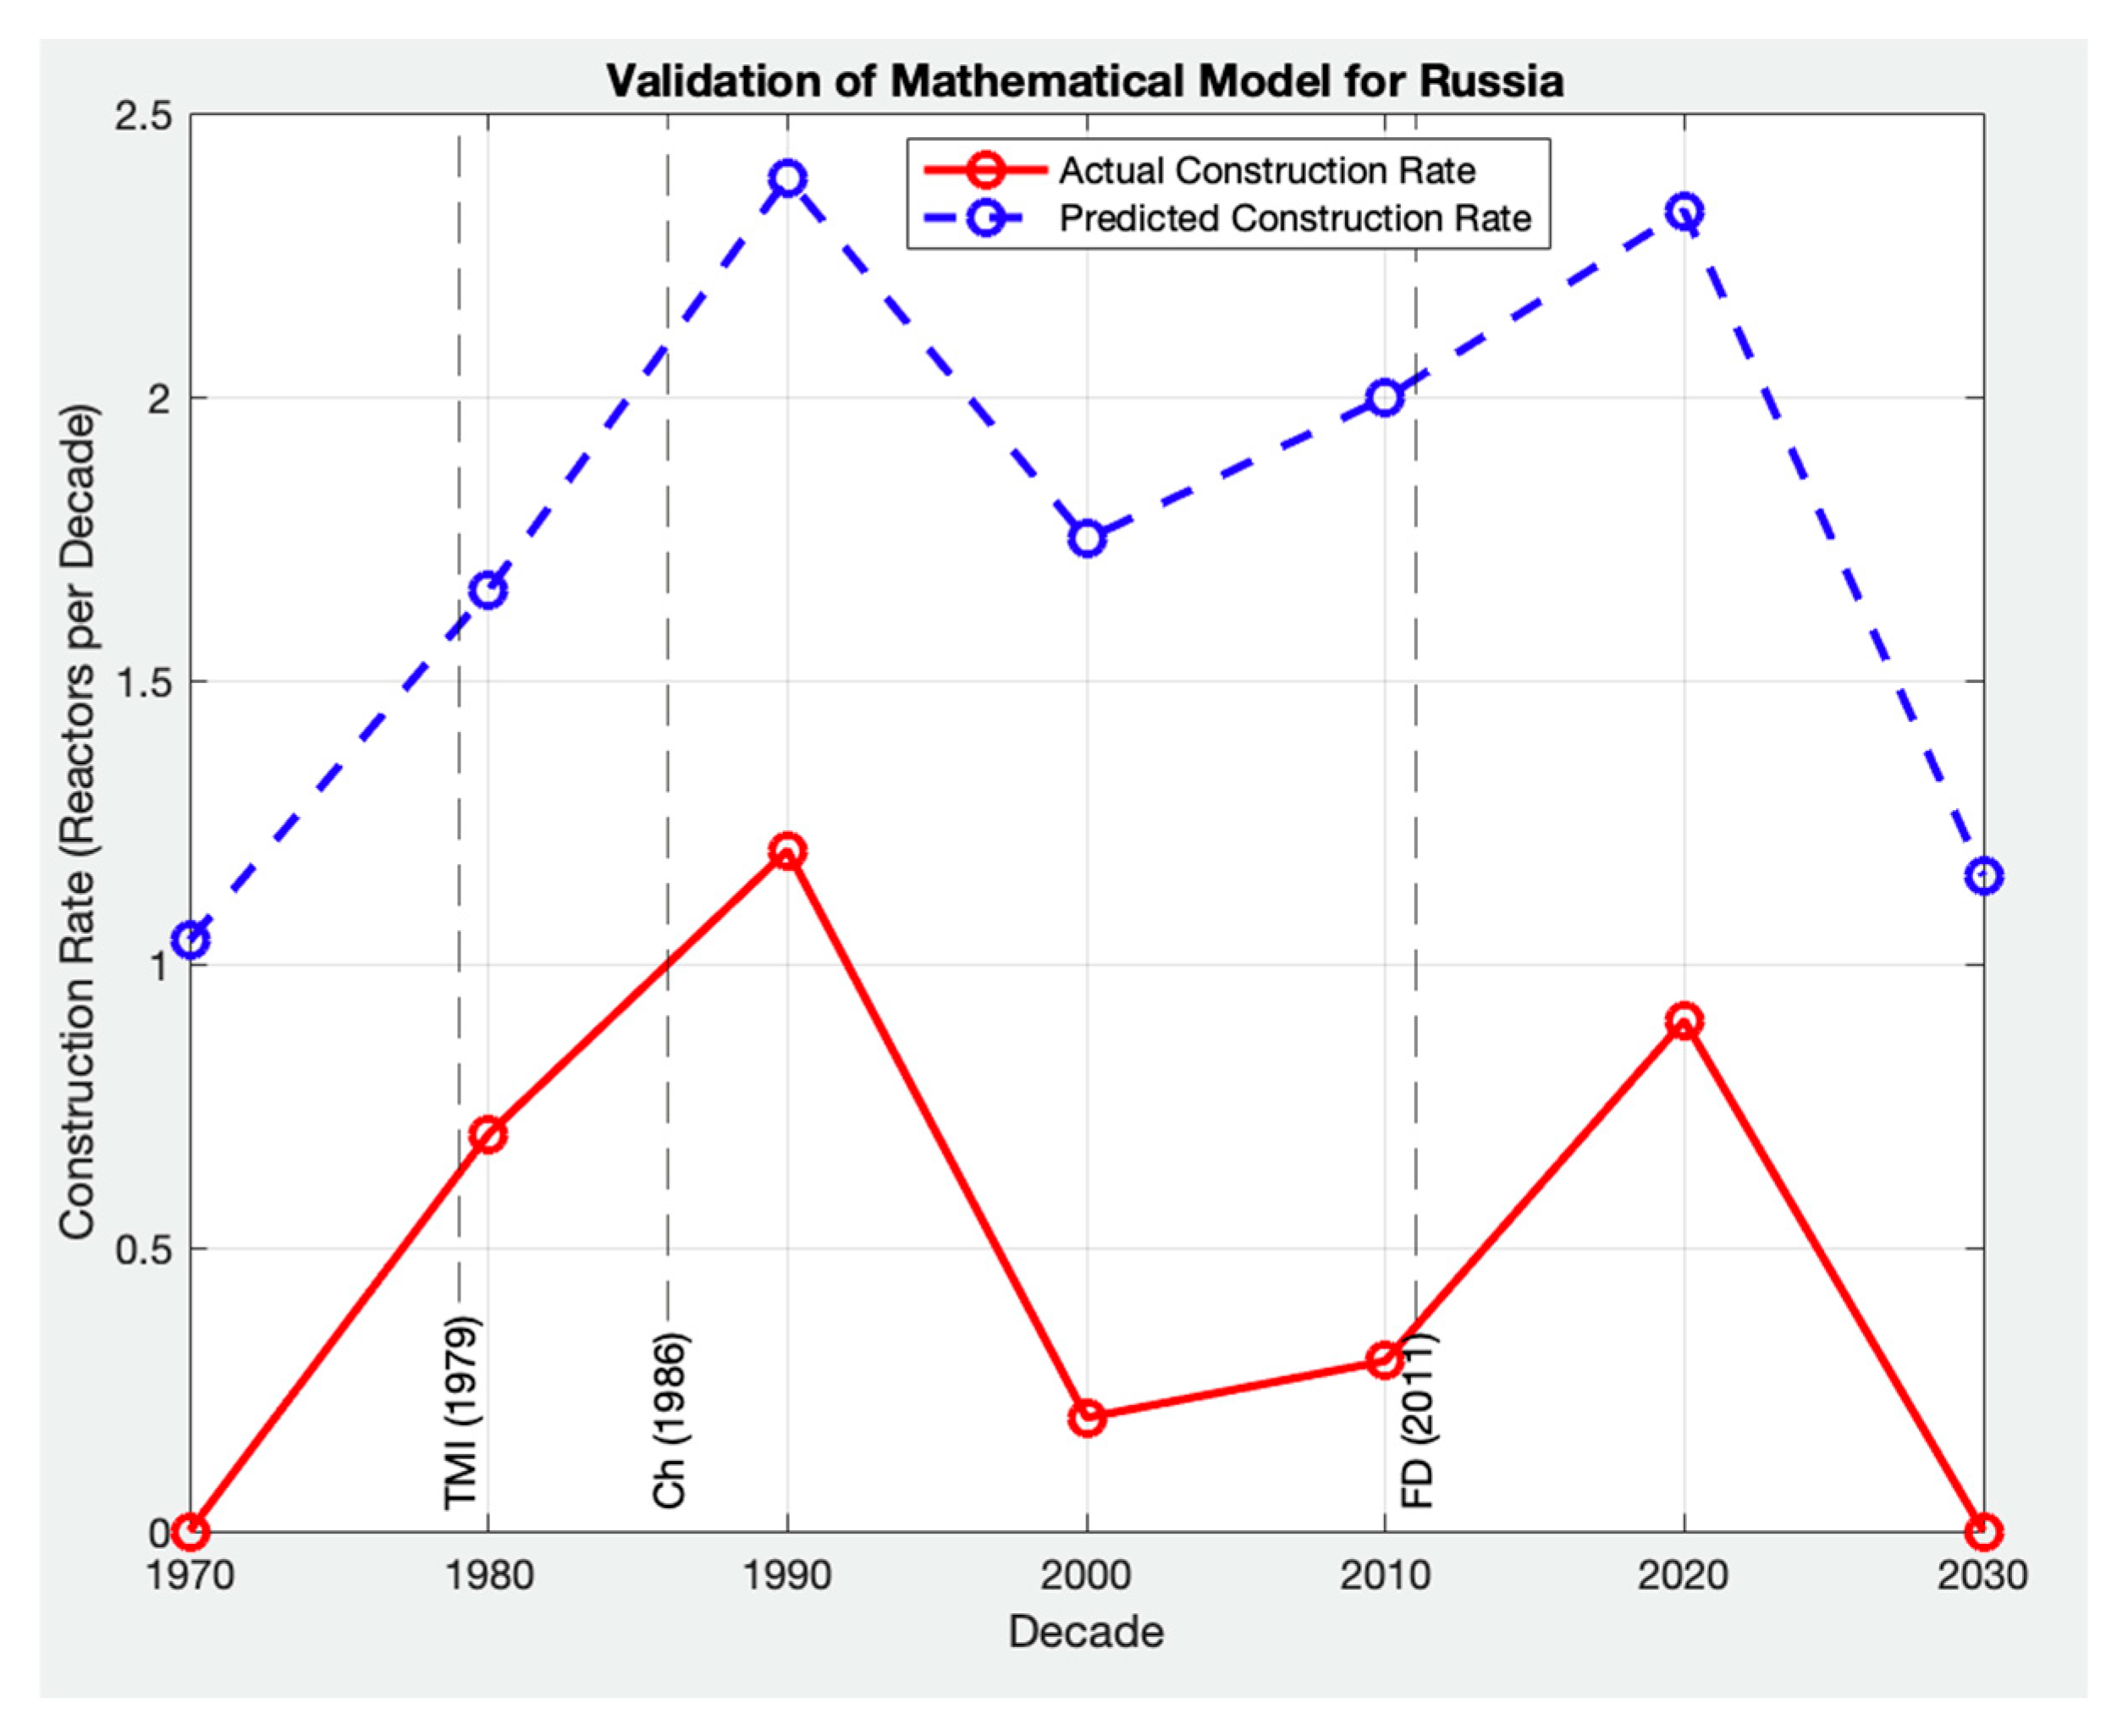
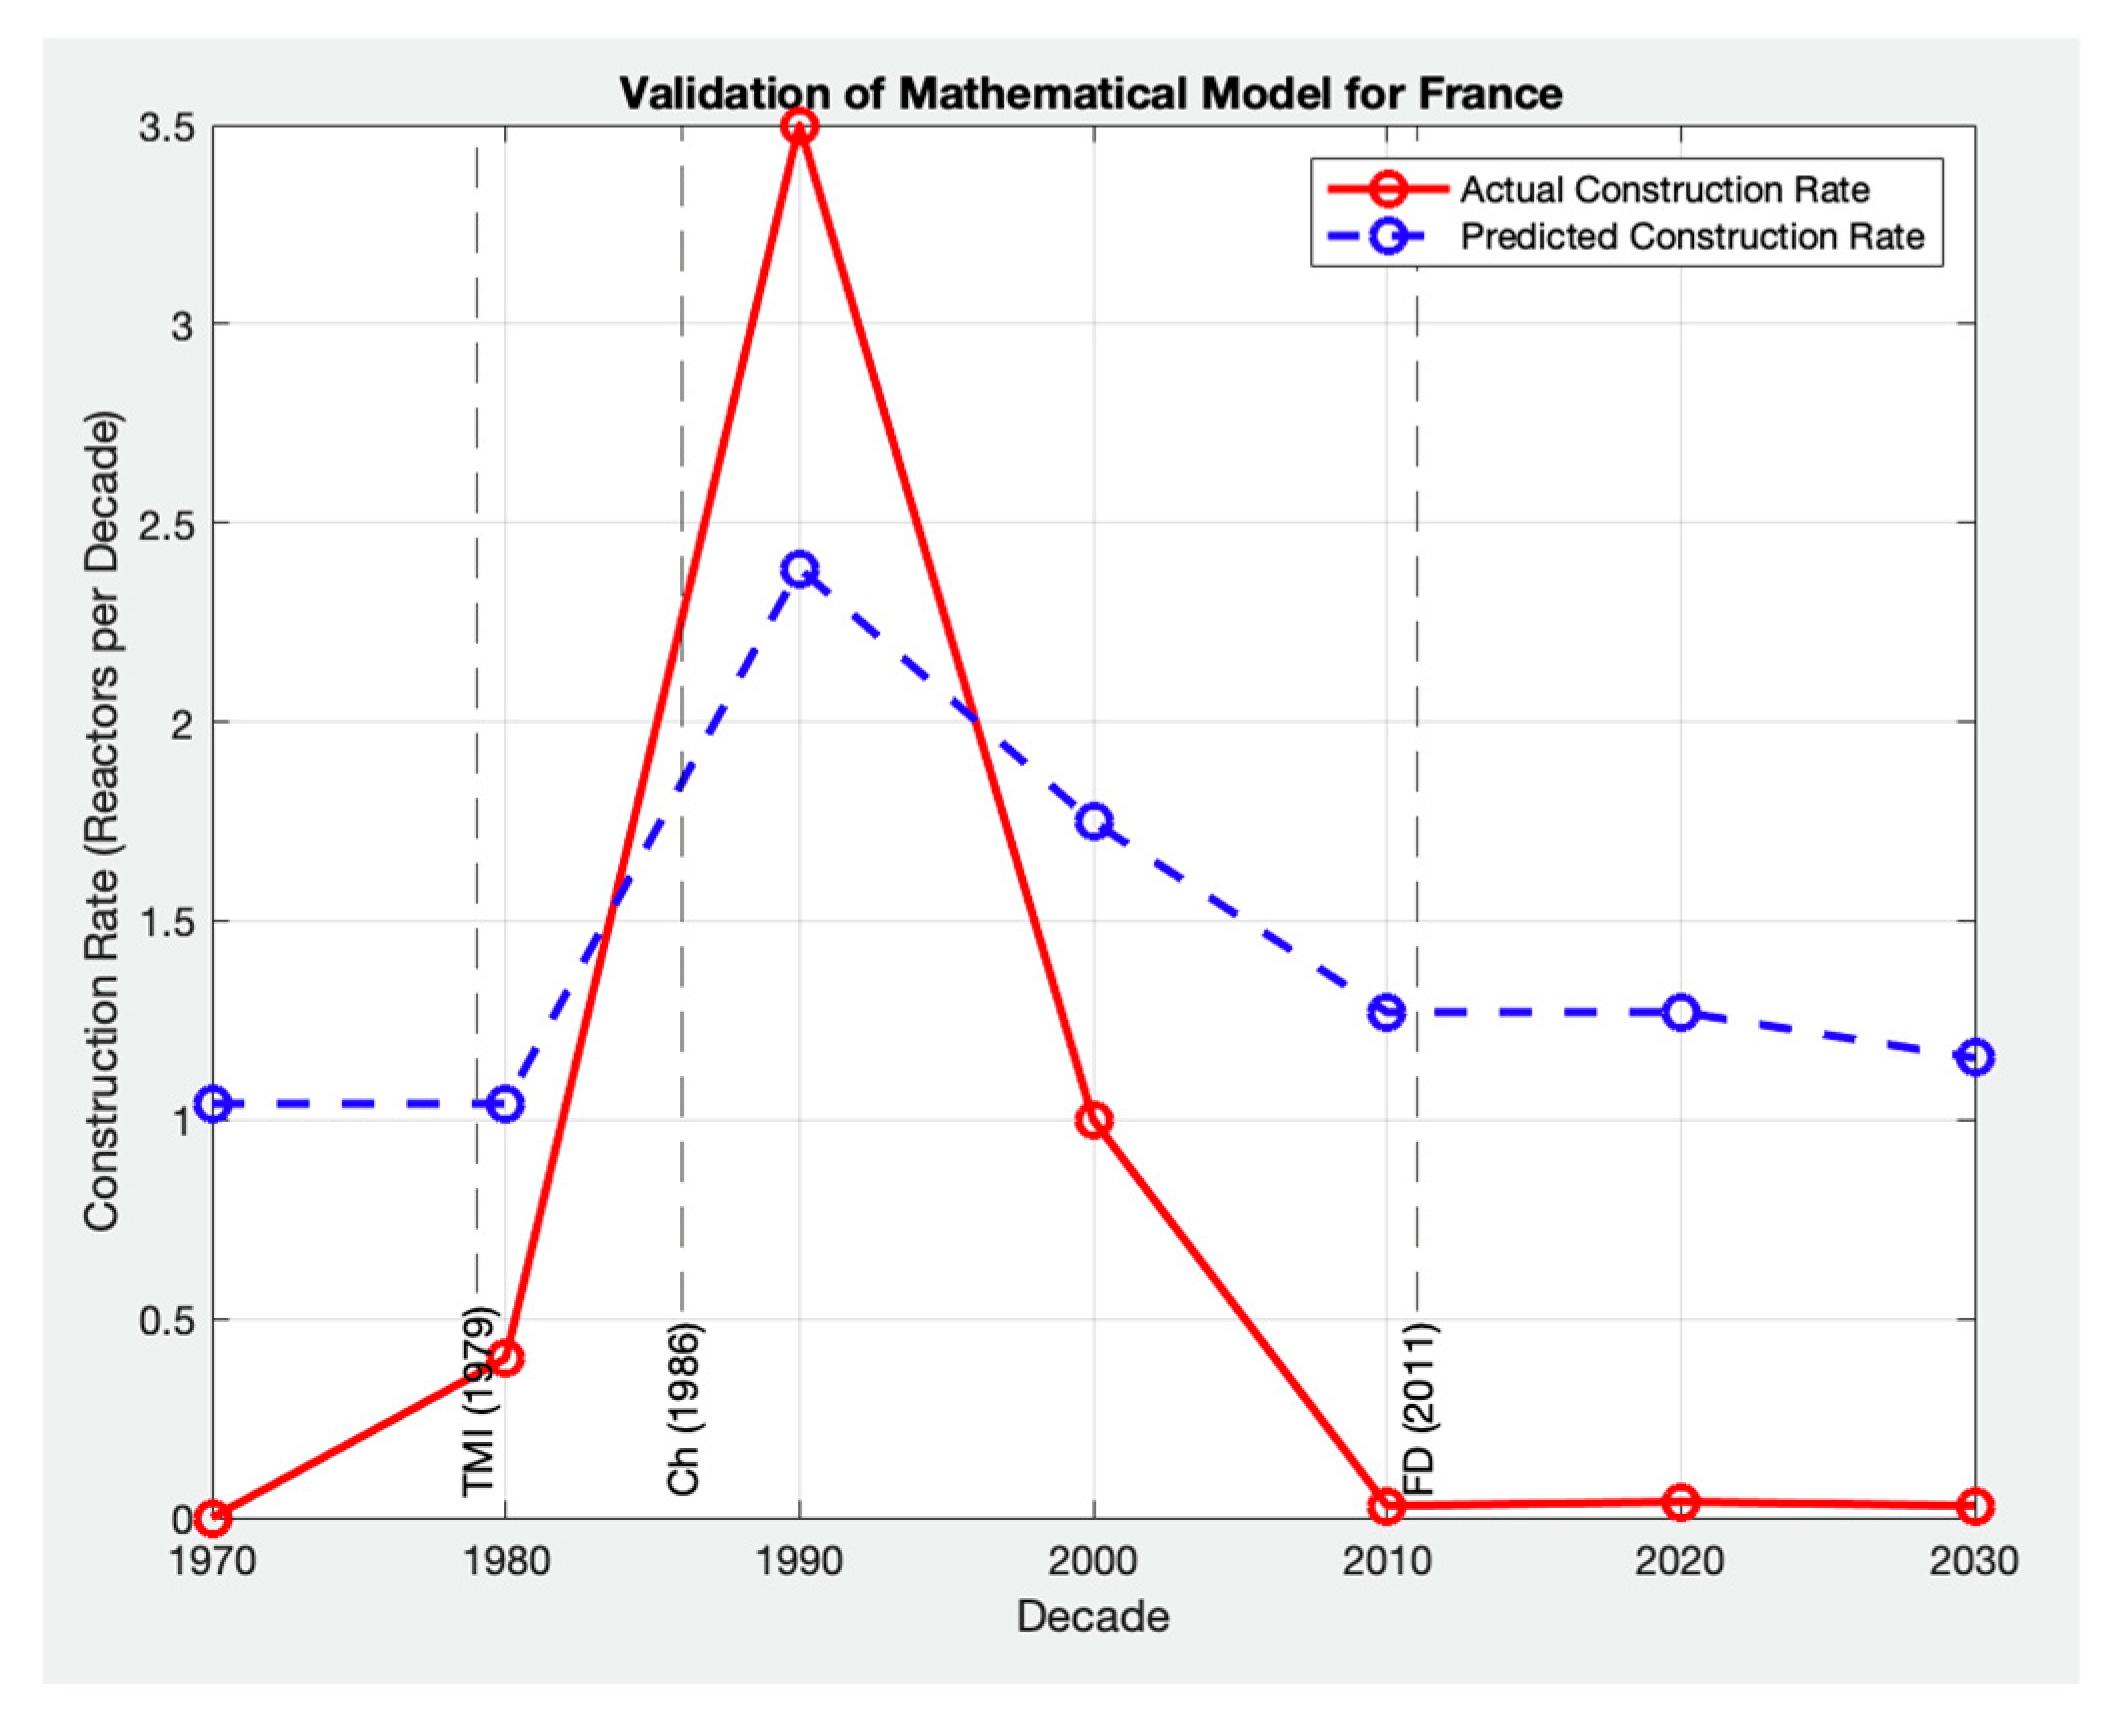
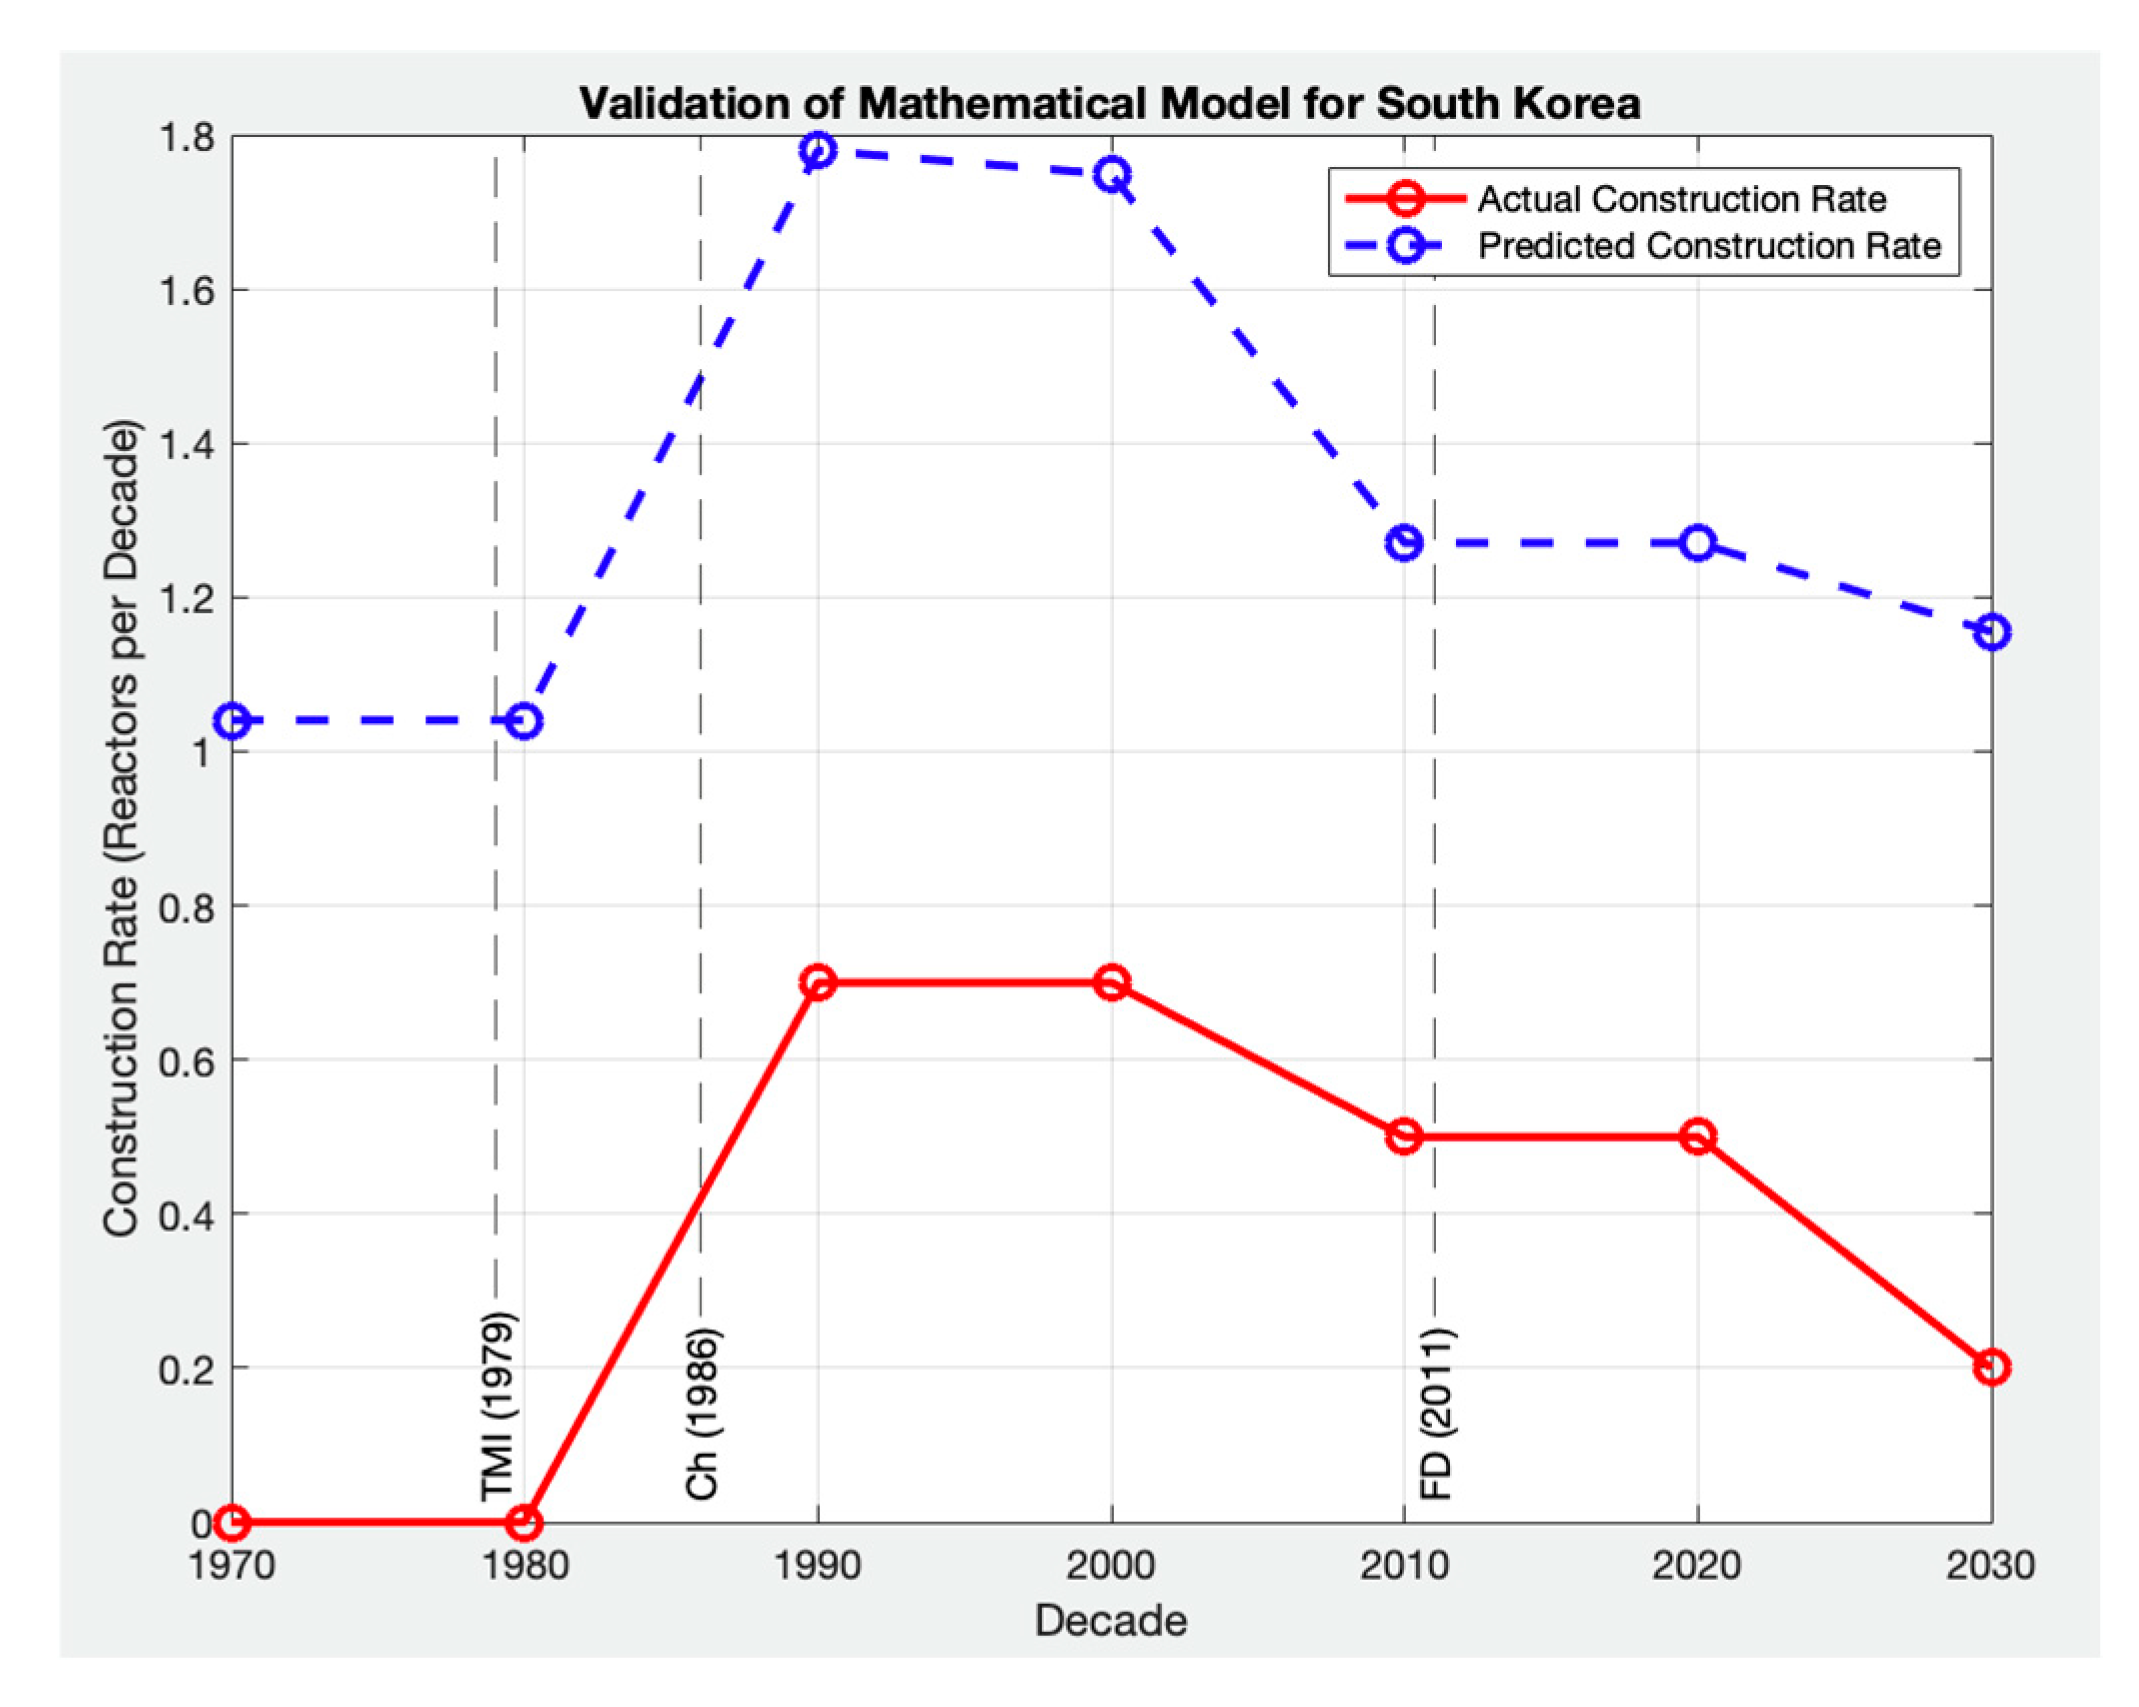
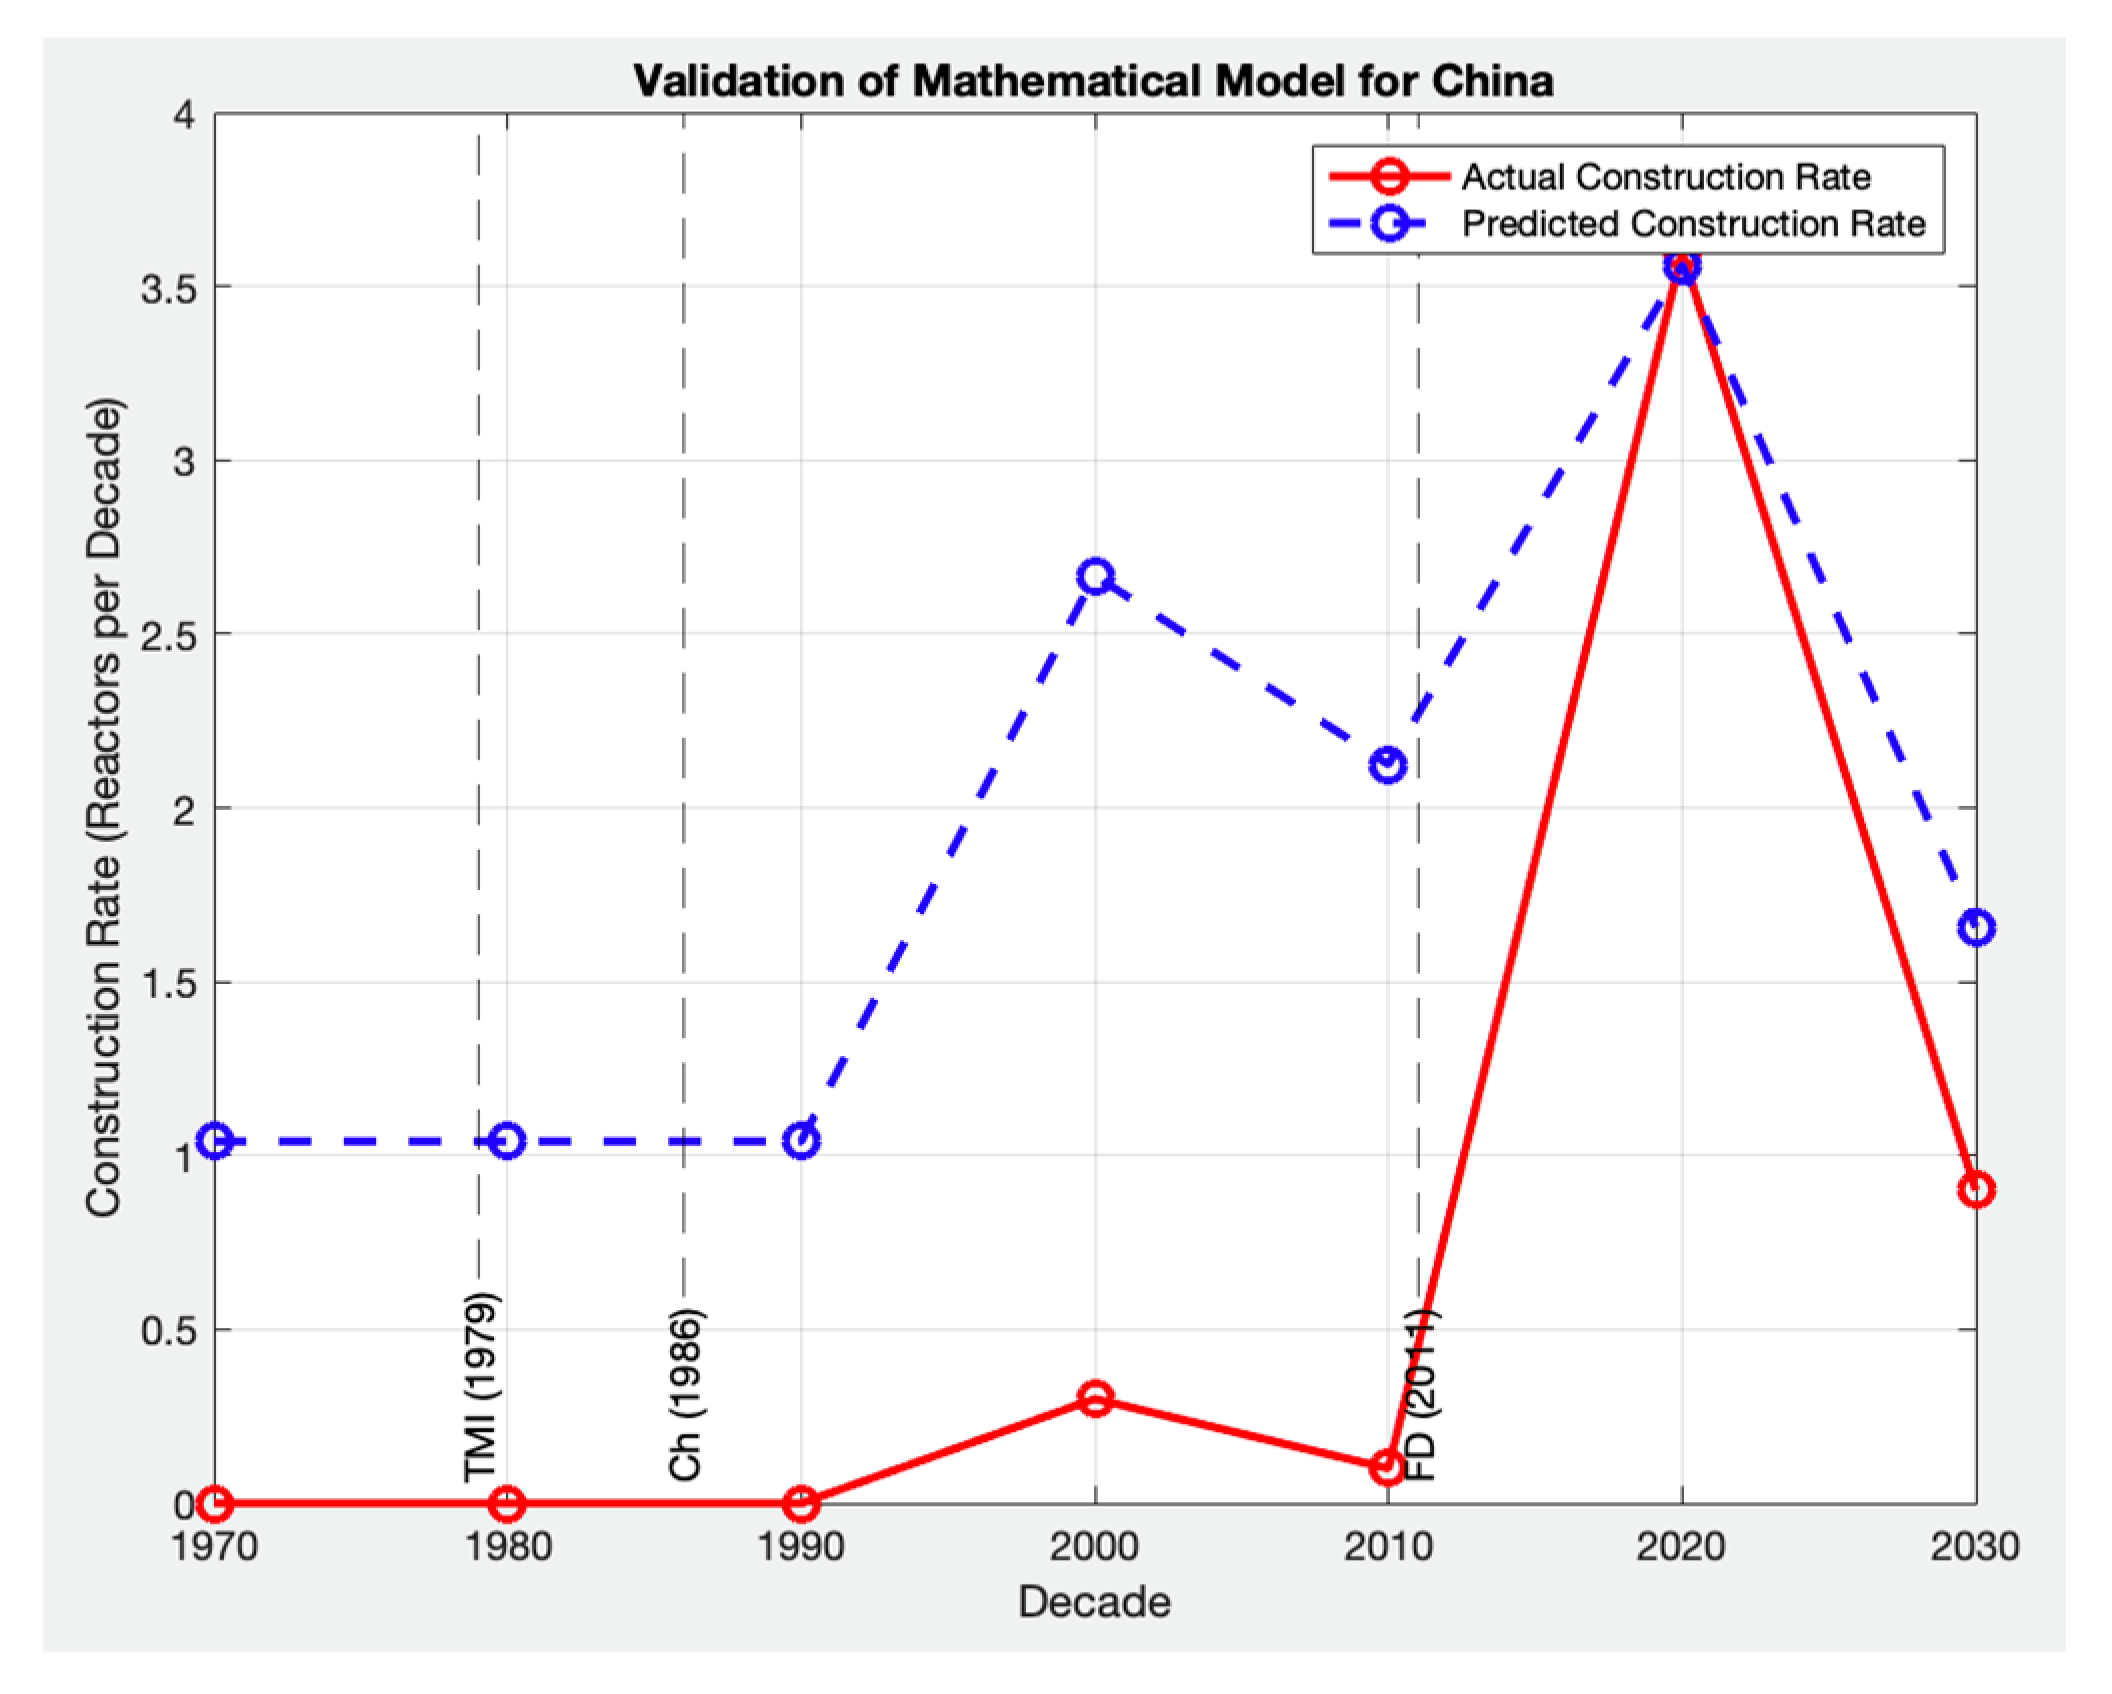
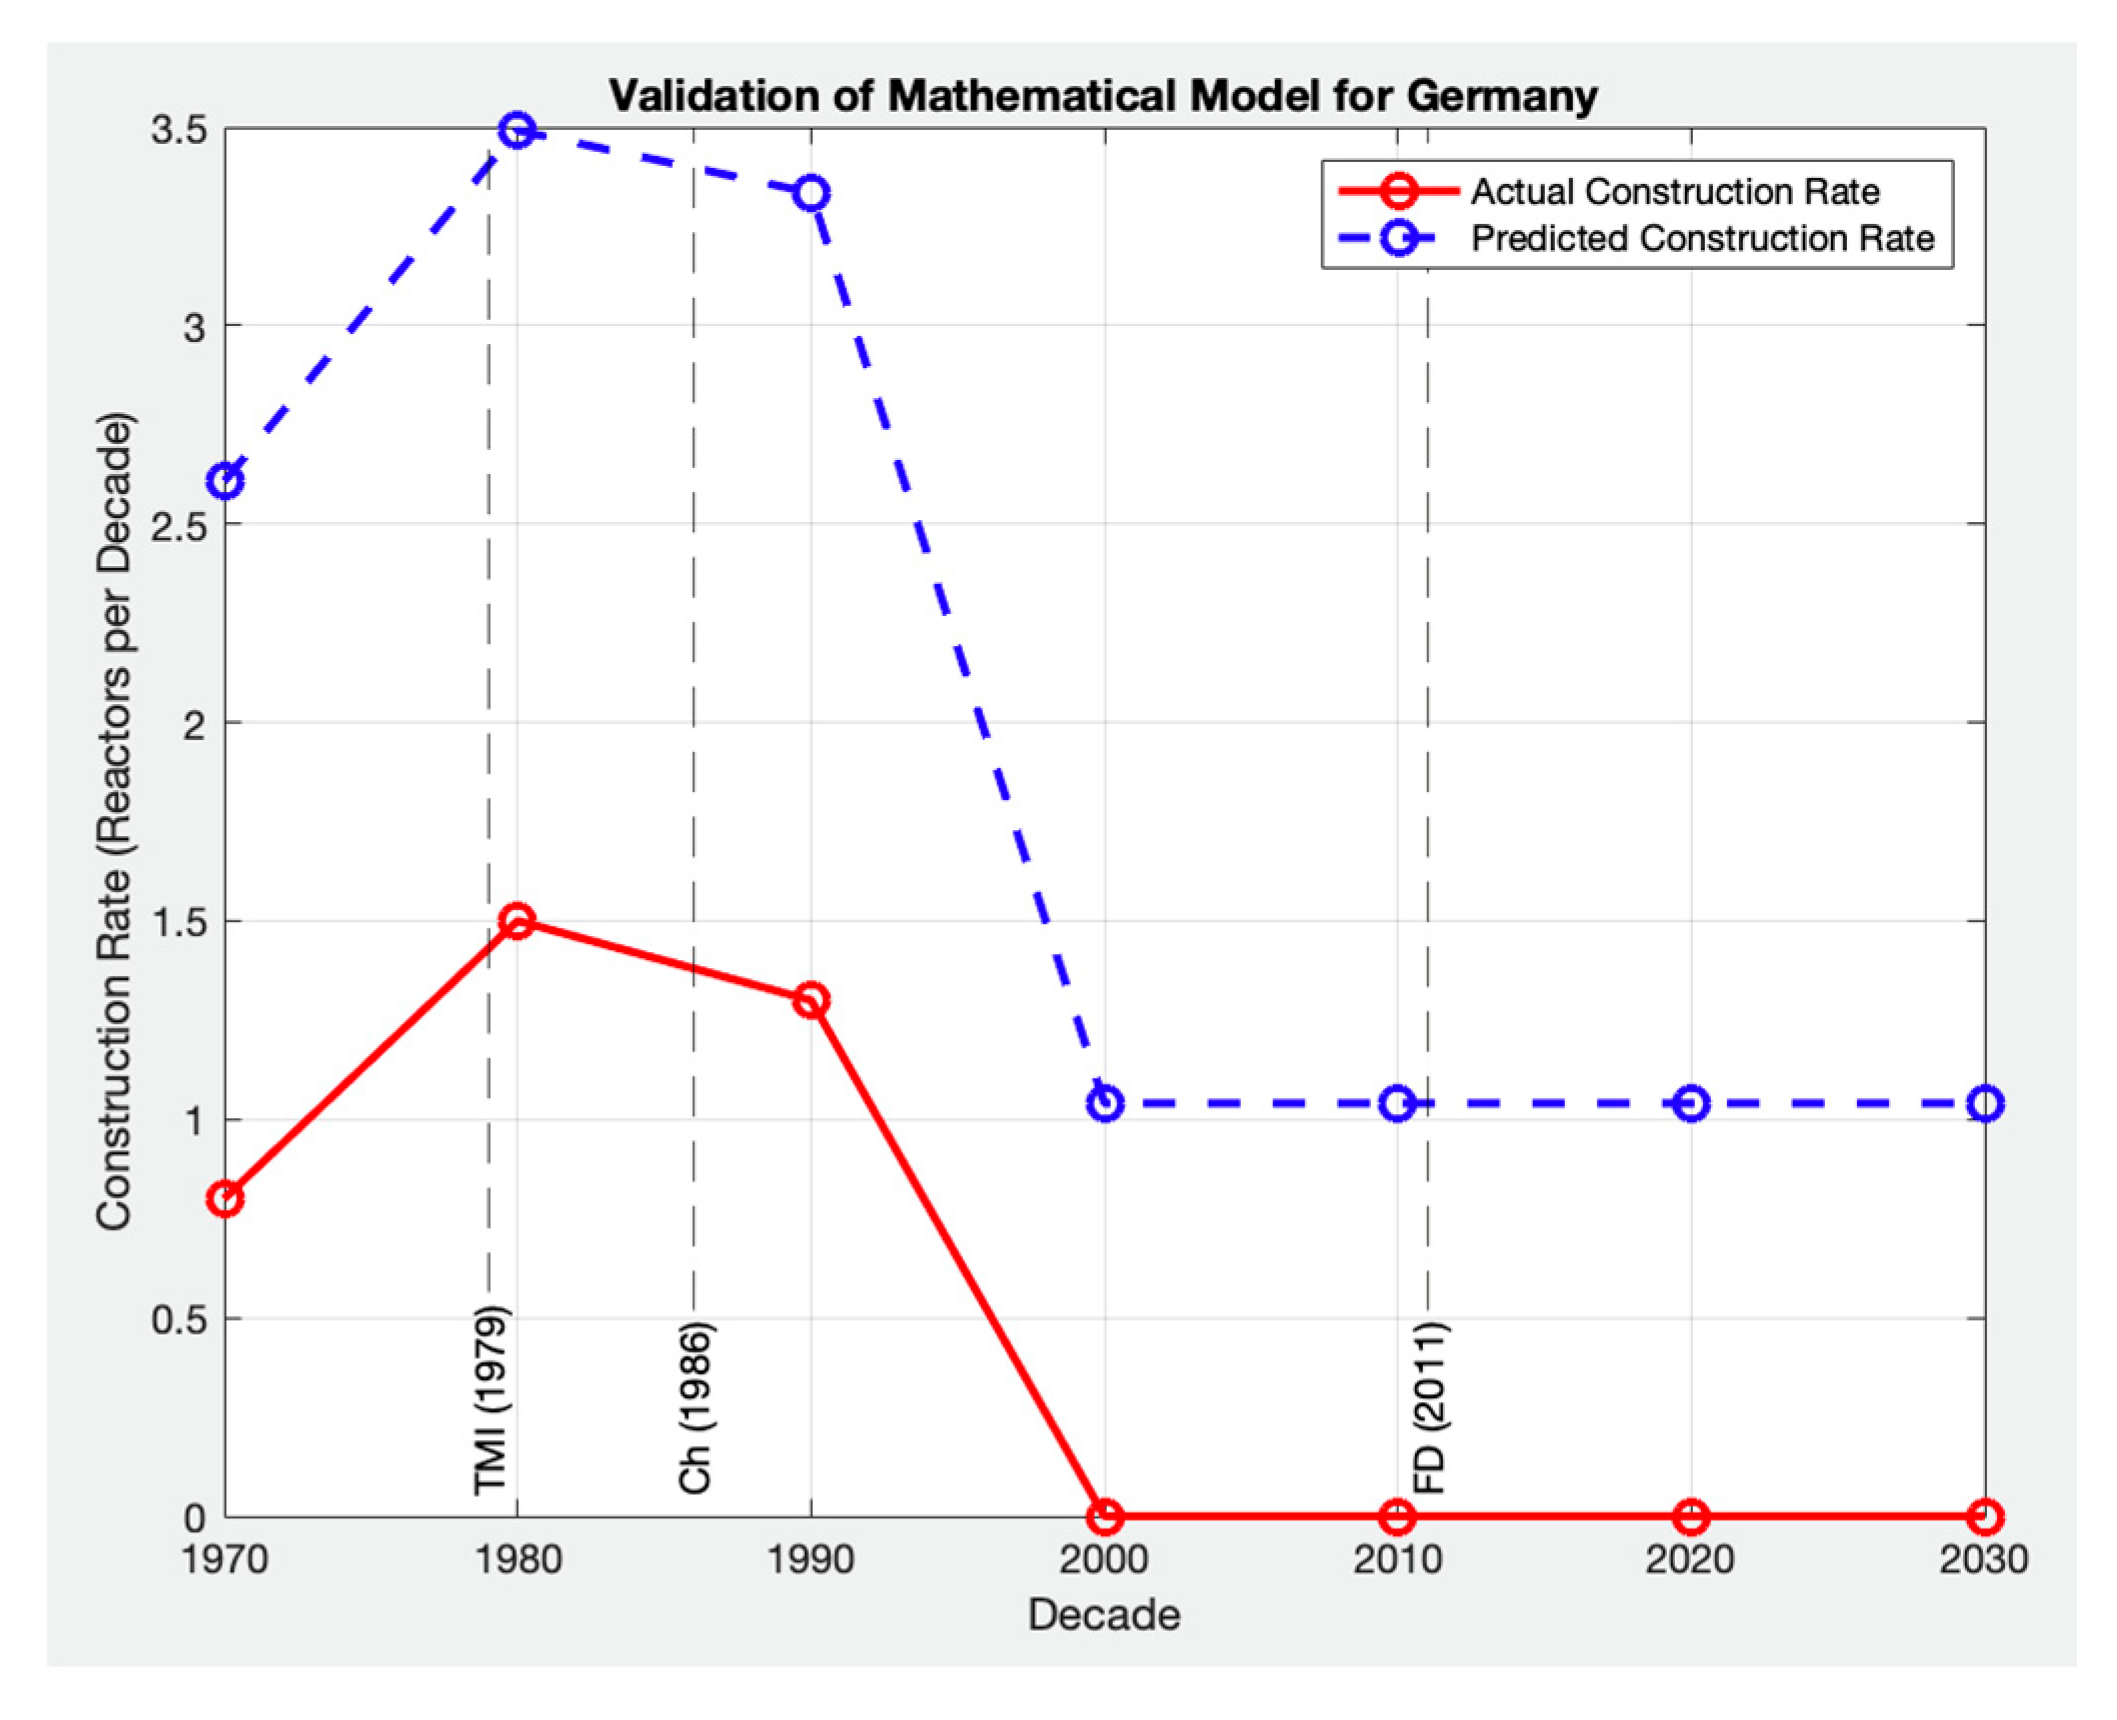
To further explore the model’s robustness and its adaptability to a broader range of policy, economic, and social conditions, the model was also qualitatively applied to France, Russia, Germany, South Korea, and China [
73]. These additional comparisons are presented in
Figure 10,
Figure 11,
Figure 12,
Figure 13 and
Figure 14 and showcase the model’s capacity to reflect different deployment trajectories shaped by diverse regulatory, political, and technological factors. While these countries were not included in the RPE analysis, they provide important reference points for assessing the global relevance of the model. This extended validation supports the notion that the model is capable of characterizing the key trends in nuclear deployment across countries with differing histories, offering a solid foundation for applying the model to predict future SMR deployment patterns globally.
While the model effectively captures the general trends in nuclear construction rates, several limitations must be considered. One key limitation is its sensitivity to parameter selection. The model relies on weight coefficients and interaction terms determined based on current industry trends and scenario-based projections, assuming that the identified influencing factors will continue to play a significant role in nuclear deployment from 2025 to 2050 to 2100. However, long-term shifts in policy, technological advancements, economic conditions, and geopolitical factors introduce uncertainties that are difficult to encapsulate fully. The model incorporates a logistic function to ensure that factor contributions are not unlimited, meaning that even if a factor (e.g., Public Acceptance or Supply Chain Readiness) increases significantly, its impact on the construction rate eventually levels off. However, in reality, decision-making processes involve delays, regulatory barriers, and unexpected disruptions, which may temporarily slow or halt construction, even when the model predicts otherwise. These external parameters are not explicitly accounted for, since their interconnectness can only be discerned via accessible information.
Despite these limitations, the model remains a valuable tool for long-term scenario analysis, allowing policymakers and industry leaders to assess potential pathways for nuclear expansion. However, the careful calibration of parameters is essential to ensure realistic (regional) projections. Future refinements should explore adaptive modeling techniques, dynamic parameter adjustments, and uncertainty quantification to enhance predictive accuracy and account for evolving global conditions.


