1. Introduction
This research examines the impacts of market participation on the household well-being of smallholder irrigation farmers. Smallholders and those participating in irrigation farming are seen as key contributors to rural food supply and livelihoods. They are encouraged to transition from subsistence farming to a more market-oriented approach. This shift is driven by the pressing issue of food insecurity across sub-Saharan Africa (SSA), where approximately 20.3% of the population struggles to meet their basic food consumption needs [
1]. As food demand continues rising due to population growth and changing consumption patterns, the pressure on the supply chain intensifies. This situation presents significant opportunities for smallholder farmers and small-scale irrigation schemes in SSA to effectively address supply-side challenges, ultimately enhancing food security and improving household well-being [
2,
3].
In South Africa, the constitutional recognition of the right to food places food systems and agricultural development squarely on the national development agenda. Hence, the policy prioritizes the inclusion of black subsistence farmers and small-scale irrigation schemes into the mainstream economy [
4]. Despite the agricultural sector’s modest contribution to the national gross domestic product (GDP), over two million small-scale or household farmers reside in rural areas, often isolated from critical markets and facing limited livelihood options, depend primarily on agriculture as their primary source of sustenance [
5,
6]. However, operating at a subsistence level prevents these smallholders from achieving the economies of scale needed to make investments in irrigation systems financially viable [
7].
Small-scale irrigation schemes are recommended to enhance agricultural productivity, food security, crop yields, and livelihoods. Adopting irrigation technologies can significantly benefit rural households by enabling farmers to optimize water use, grow various crops, and maintain consistent yearly production [
8]. Furthermore, South Africa ranks among the driest and most water-scarce [
9] countries globally in terms of water availability per capita, with annual rainfall amounting to about half of the global average. While about 70% of the country’s agriculture relies on rain-fed methods, only 35% of the land receives enough rainfall to support successful dryland farming [
8]. The combination of low rainfall and high evaporative demand leads to a water deficit that hinders dryland crop production in much of the country, making irrigated agriculture a crucial alternative. Despite covering a relatively small portion (3%) of irrigated land, small-scale irrigation schemes are significant due to their direct impact on rural communities. Consequently, many smallholder irrigation schemes have been revitalized, and new ones have been established across South Africa [
10]. The primary purpose of these schemes is to enhance rural livelihoods by promoting sustainable crop production, thereby contributing to food security and reducing poverty [
8]. However, access to suitable irrigation systems tends to favour wealthier farmers and those growing high-value crops, who benefit more from public and private investments in farmer-led irrigation expansion [
11].
Most smallholder farmers and minor irrigation schemes in the country are concentrated in the eastern regions, characterized by high levels of poverty and unemployment. This subjects farmers to limited access to credit, technical knowledge, and efficient irrigation technologies, hindering their ability to utilize irrigation effectively and improve their livelihoods. Varying in size, management, and technical sophistication, these schemes have not led to a corresponding income increase for impoverished households due to significant inequalities in access to and distribution of resources [
12]. Consequently, most households’ livelihoods have been compromised, leaving smallholders unable to achieve financial stability or meet their basic needs. Livelihoods require more than just food sustenance [
13], farmers must ensure food security while generating the necessary income to meet immediate consumption and social needs [
14]. Subsistence food crop production alone cannot meaningfully enhance rural incomes without incorporating market-oriented production systems.
Given these challenges, some scholars propose that the subsistence system of small-scale farmers should be replaced with more economically viable options, diversifying production beyond subsistence levels [
15]. This transformation requires enhancing agricultural production systems, increasing commercialization, and focusing on high-value crops [
16], alongside initiatives that develop efficient and well-functioning markets [
17]. Access to markets thus serves as a mechanism for ensuring profitability through exchange opportunities, enabling smallholders to secure a meaningful livelihood and income [
17,
18,
19,
20,
21,
22,
23]. Empirical evidence worldwide supports this perspective, demonstrating that market participation leads to higher incomes and improved welfare outcomes for smallholder farmers. For example, Dey and Singh [
24] found that in India, market participation significantly enhances both income and per capita consumption expenditure. Their study reported that market participants had an average yearly farm income exceeding INR 48,000, which is approximately ZAR 10,560 or USD 576. They further indicated that this enables farmers to spend much more on their consumption needs than non-participants. This implies that engaging in markets not only boosts farmers’ income but also improves their ability to meet their consumption needs, which can contribute to better overall welfare.
In Zambia, smallholder farmers who actively participate in markets have experienced a substantial 242% increase in total household income, leading to improved living standards [
25]. This study also demonstrated the equity-enhancing potential of market engagement, as it boosts total household income and reduces gender income disparities. In Ethiopia, a recent study observed a positive link between commercialization and household income among maize farmers, leading to increased wealth through asset ownership and accumulation [
26]. This study further found that commercialization reduces both income poverty rates and the poverty gap, with the most significant welfare improvements occurring among the poorest households, highlighting its potential to reduce rural inequality [
26]. Setoboli et al. [
27], while focusing on productivity and market potential in goat production, found similar results noting that although farmers face numerous challenges, those who participate in markets earn a higher gross margin than non-market participants, providing them with significant welfare benefits.
However, Huka et al. [
16] are of the opinion that, while participation in markets in general can lead to positive outcomes, a specific focus on high-value markets is a more effective pathway for long-term improvement in income. They argue that high-value markets, which include cash crops and other high-demand products, are more lucrative for agricultural produce compared to traditional markets and enables smallholder farmers to access better returns, thereby significantly boosting their income. This increased income helps farmers expand their asset base, which contributes to long-term economic stability and improved household welfare.
Beyond income gains, market participation significantly contributes to food security and overall household well-being. Viana et al. [
28] and Villar et al. [
29] emphasized that farmers engaged in agricultural markets experience improved food security, as increased income allows them to invest in better nutrition and enhance their household well-being. Ma et al. [
30] further highlighted that market participation enables farmers to access a broader variety of foods, which improves dietary diversity and nutritional outcomes. This, in turn, strengthens their financial resilience by providing greater security against seasonal fluctuations and market uncertainties. Additionally, market participation offers a more stable and diversified income stream, enabling farmers to better cope with economic challenges [
31]. However, achieving such success depends on creating a conducive environment that allows smallholders to access necessary resources such as market information and effective partnerships [
32]. Therefore, efforts in South Africa are focused on policies that establish an enabling environment that ensures equal access to opportunities for resource-limited small-scale farmers. This process involves market deregulation, trade liberalization, investments in agricultural funding, and revitalization of dormant small-scale irrigation schemes [
33,
34]. The aim is to enhance small-scale farmers’ ability to produce high-value crops, thereby increasing their chances of earning higher incomes and improving their general well-being.
When agricultural production is market-oriented, it allows farmers to specialize in goods with a comparative advantage, enabling them to trade surplus goods for other needed items and services they are less efficient at producing. This helps farmers to diversify their income sources, benefit from economies of scale, and adopt advanced technologies, contributing to faster growth in total productivity [
35].
However, while market participation offers significant benefits, not all farmers experience positive outcomes. Many smallholder farmers face numerous constraints that hinder their ability to engage in and benefit from agricultural markets. These barriers include limited access to credit, inadequate market information, small land sizes, and insufficient agricultural training [
7]. Without access to affordable credit, smallholders struggle to invest in essential farm inputs such as improved seeds, fertilizers, and mechanization, limiting their productivity and competitiveness in markets [
36]. Additionally, poor access to timely and accurate market information prevents farmers from making informed production and selling decisions, often resulting in price exploitation by intermediaries and an inability to negotiate fair prices for their produce [
37]. Structural challenges such as high transaction costs, poor road infrastructure, and limited access to modern production equipment and irrigation systems further exacerbate market exclusion for smallholder farmers [
36,
37]. Transport costs, including remote locations that lead to high transportation costs, and information asymmetry that affects decision-making, for instance, account for a significant proportion of marketing expenses, making it difficult for farmers in remote rural areas to access profitable urban markets [
12,
30]. Inadequate infrastructure, including poorly maintained roads and lack of storage facilities, contributes to post-harvest losses and reduces farmers’ ability to sell their produce at optimal prices [
38]. Additionally, a lack of business skills limits farmers’ potential to engage especially in high-value markets [
16]. Furthermore, the absence of irrigation systems forces many smallholders to rely on rain-fed agriculture, making their production highly susceptible to climate variability and unpredictable weather patterns [
33].
These systemic constraints have contributed to low market participation rates among smallholder farmers. Studies indicate that in specific areas within the Eastern Cape and Limpopo provinces, only around 33% of emerging farmers participated in market activities, and participation rates for small-scale irrigation farmers were as low as 38% [
37]. This limited engagement further restricts farmers’ ability to integrate into formal markets, reducing their income potential and economic resilience. Many smallholders who attempt to engage in the market frequently face substantial obstacles in maintaining the standards required for sustained viability and competitiveness, leading to high exit rates and irregular market participation [
33,
38,
39,
40]. Compliance with food safety regulations, grading standards, and certification requirements remains a significant barrier for many smallholder farmers, particularly those producing perishable commodities such as fruits and vegetables [
7]. As a result, smallholders continue to experience low levels of market integration, reinforcing the cycle of rural poverty and economic marginalization [
12,
41]. This situation emphasizes the need for effective support mechanisms, such as cooperatives and inclusive value chain models, to improve smallholder market access and economic outcomes [
26].
While a growing body of literature highlights the potential of smallholder irrigation systems to alleviate some of these challenges by improving productivity, in South Africa [
34,
42], a significant gap remains in empirical research that directly assesses the impact of market participation on the overall welfare of these farmers. Irrigation can increase crop yields and stabilize production, but it does not automatically guarantee that farmers can overcome market entry barriers, nor does it ensure sustained improvements in income and well-being. However, it is insufficient to merely acknowledge the potential benefits of market participation without concretely evaluating the long-term changes it brings to income, food security, and overall household well-being. Moving beyond assumptions and examining whether market participation indeed translates into better living standards is essential. Without such assessments, the full potential of market-oriented farming remains uncertain, and it is difficult to gauge whether the promoted strategies are achieving their intended outcomes in poverty alleviation and food security. This lack of rigorous, outcome-based research leaves policymakers and development practitioners without the necessary data to design interventions that effectively address the needs of smallholders and ensure that market participation delivers meaningful and lasting improvements to their livelihoods. A critical gap exists in understanding the real-world impacts of these interventions on the welfare of smallholder farmers. This underscores the importance of further empirical research to evaluate the effectiveness of market-oriented farming in alleviating poverty and enhancing the well-being of rural households. Therefore, this research provides an essential step towards filling this gap by providing evidence of the impacts of market participation on smallholder irrigation farmers’ well-being. This approach provides insights into whether commercializing smallholders and markets contributes to smallholder farmers’ economic empowerment and sustainability in regions like the Eastern Cape.
The paper is structured as follows: The following section describes the theoretical framework which underpins this study. The third section describes the methodology used in the study. The fourth section presents the results, followed by a discussion in the fifth section. The final section concludes the paper and offers recommendations.
2. Theoretical Framework
This study is grounded in random utility theory, which provides a framework for analyzing the decision-making processes of smallholder farmers regarding market participation. Random utility theory views smallholder farmers as rational decision-makers who evaluate their choices based on expected utility gains. Accordingly, whether acting as farmers or farmworkers, poor households employ various strategies to achieve food self-sufficiency and generate income to meet immediate consumption needs and social obligations [
43,
44]. According to this theory, farmers will engage in market activities if the perceived utility from participation, denoted as
exceeds the utility of not participating, represented as
[
17]. In essence, a farmer will engage in markets when the net utility, denoted as
, which is the difference between
and
, is greater than zero.
The unobserved net utility
can be expressed as a function of observable factors within a latent variable model:
In this model, is a binary indicator variable, taking the value of 1 if the net utility is greater than zero, indicating market participation, and 0 if not. α is a vector of parameters to be estimated, capturing the influence of various factors on market participation; xi is a vector representing observable characteristics of the farmer, such as gender, age, education level, farm size, and market information; and εi stands for the error term, accounting for unobservable factors that influence a farmer’s decision-making process.
The decision to participate in markets is then modelled as a binary outcome based on the latent utility
. Specifically,
is a binary indicator variable, taking the value of 1 if
is greater than zero, indicating market participation, and 0 if
is less than or equal to zero. This can be expressed as follows:
This expression captures the dynamic decision-making process in which farmers weigh the costs and benefits of market involvement by comparing the utility gained from market participation with that of not participating [
45,
46]. Essentially, farmers evaluate whether the benefits of engaging with the market outweigh the associated costs. The central premise is that farmers weigh the perceived advantages and disadvantages of market participation to determine whether the net utility is positive. If the benefits, such as higher income, outweigh the costs, including transportation expenses and time investment, farmers are more likely to engage in market activities. Therefore, the framework posits that farmers participate in markets when the perceived benefits outweigh the costs, resulting in positive net utility.
Building on this understanding, the decision-making process modeled in the theoretical framework will be used to assess how farmers’ decisions to participate in markets translate into positive net gains and improvements to their overall well-being. By quantifying the net utility derived from participation, the findings will shed light onto whether market engagement through irrigation-based farming represents a pathway to improved quality of life and whether the necessary investments are justified.
3. Materials and Methods
3.1. Study Area
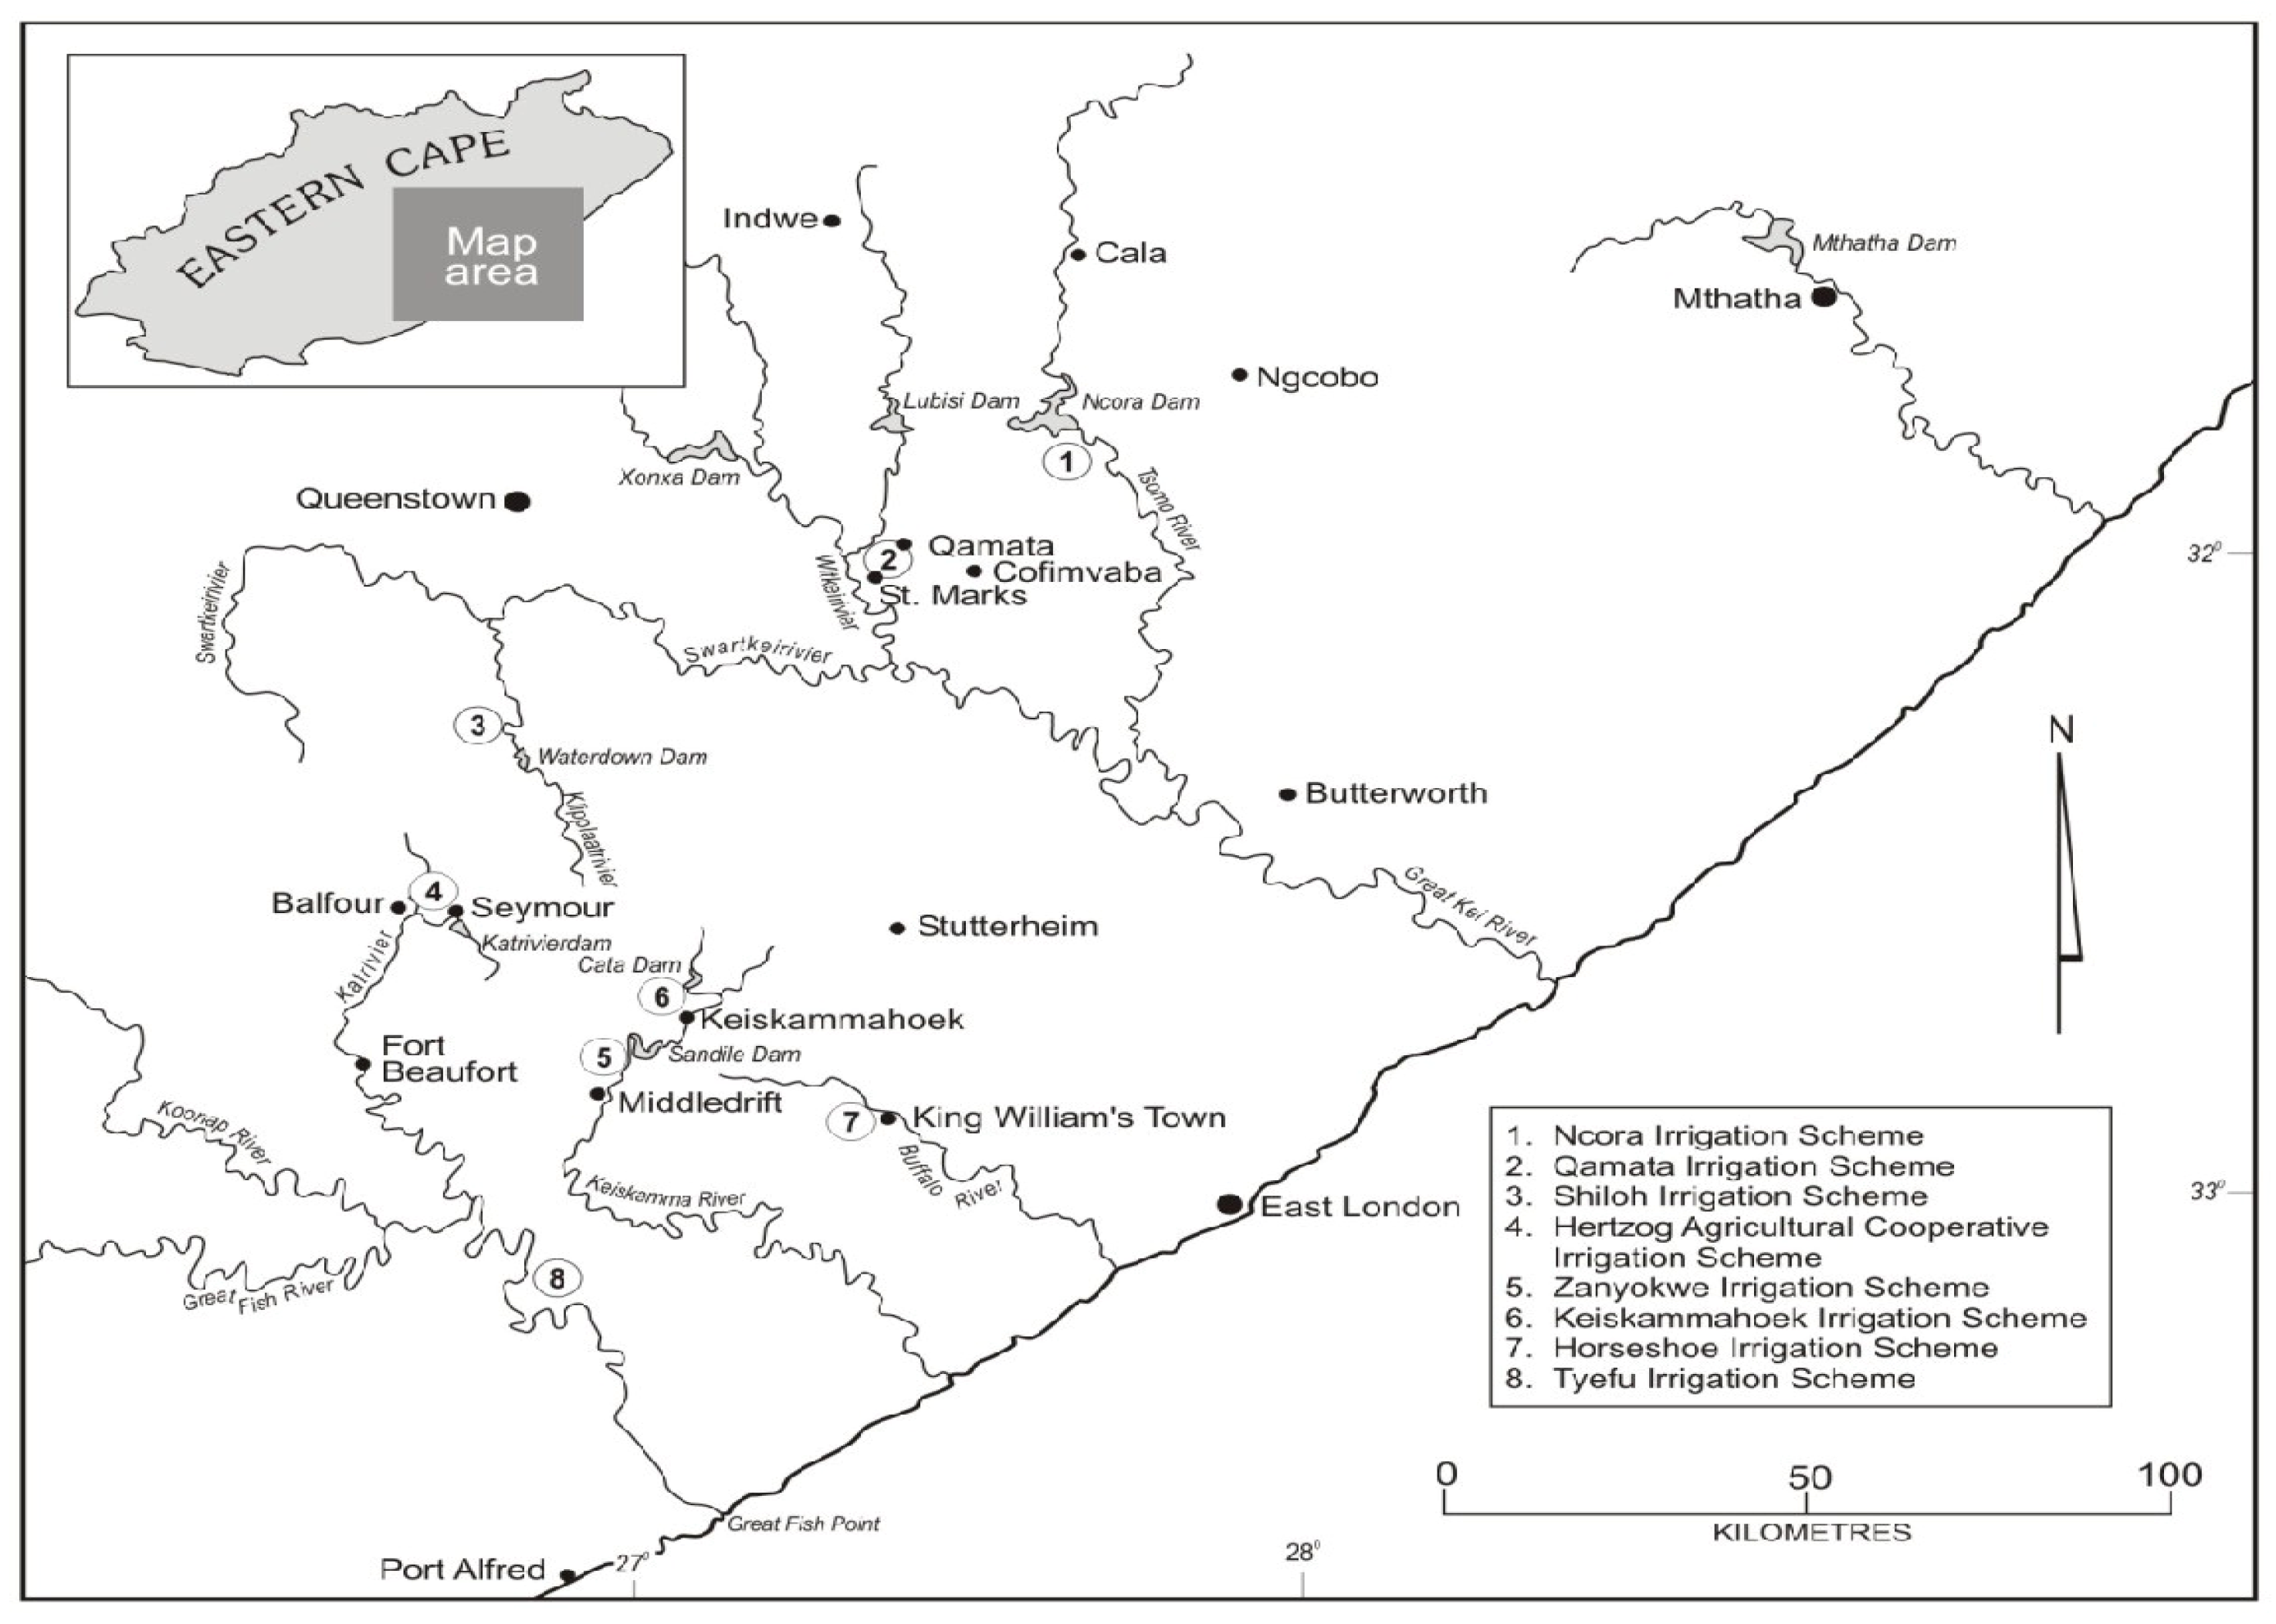
The study was conducted in the former homelands of Transkei and Ciskei, located in the Eastern Cape province. These regions are known for their fertile soils and abundant water resources, conditions that have historically supported agricultural activities and facilitated the development of small-scale irrigation schemes. The targeted population of the study comprised eight small-scale irrigation schemes, as illustrated in
Figure 1, which have been the target of efforts to enhance agricultural infrastructure and improve productivity [
8].
3.2. Sampling Procedure and Data Collection
The study utilized a multi-stage sampling approach, integrating both purposive and random sampling methods to address its complex research design. This design required several stages to identify the specific municipalities containing irrigation schemes, the communities within those municipalities, and the individual irrigation schemes within those communities.
In the initial stage, purposive sampling was employed to identify three prominent irrigation schemes, namely Qamata, Tyefu, and Zanyokwe, from a pool of eight schemes. This method was chosen because it allowed the researchers to intentionally select schemes based on specific criteria that would best represent the study’s objectives. The criteria for selection were primarily focused on the size and operational status of the schemes. These factors were crucial as they highlighted the schemes’ significance within their respective communities, especially in a region where many other irrigation schemes have been discontinued due to various challenges. The selected schemes were among the largest small-scale irrigation projects in the area and were still functioning, which provided an opportunity to examine the dynamics and impacts of operational irrigation schemes on local communities.
In the second stage of the study, attention was directed toward identifying farming communities or villages surrounding the selected irrigation schemes, from which non-scheme irrigators were randomly chosen. For example, the Qamata area consists of ten villages, namely Maya, Emthyintyini, Township Zwelitsha, Ngqanga, Shlahleni, Ntlakwefolo, Ntlonze, Bholokodlela, Ntshingeni, and Tyelera. Meanwhile, the Zanyokwe area includes six villages, and Tyefu comprises five. This stage was crucial in ensuring a representative selection of non-scheme irrigators who were not directly involved with the irrigation schemes but were still part of the broader agricultural landscape.
In the final stage, farmers’ households were the unit of analysis. We were assisted by the Farmer Organization and the Department of Agriculture in obtaining a list of potential participants and identifying both irrigation scheme members and non-scheme farmers who operated in close proximity to the irrigation schemes. All irrigation scheme members from the selected schemes were included in the survey, ensuring inclusivity and representation of farmers actively engaged in irrigation. The final sample comprised 210 scheme members and 40 randomly selected non-scheme members, resulting in a total of 250 smallholder farmers. It is important to note that the inclusion of both scheme and non-scheme farmers was not intended for direct comparison, but rather to ensure that the sample represented the broader farming community in the area. However, future studies could explore comparative analyses between these groups to gain further insights into the distinct impacts of market participation in irrigation versus non-irrigation settings.
3.3. Data Collection
Data were collected using structured questionnaires meticulously designed to capture detailed information on various aspects of smallholder farming. The questionnaire was designed to collect key variables related to farmers’ socioeconomic characteristics and market participation. Specifically, the market participation questions were to assess farmers’ level of engagement in market-oriented farming, including returns from the market. So they were asked questions including how much of their produce they sold, the price per unit received, their estimated farm income, and their total household income.
However, self-reported data are often subject to response bias, as farmers may underreport their income due to concerns about eligibility for support programs, while others may withhold full disclosure due to social expectations. Although farmers were asked to report honestly, we acknowledge that there may have been some level of underreporting or overreporting of income, which is common in surveys of this nature, particularly in contexts where farmers may not fully disclose their income. However, we made efforts to ensure respondents understood the confidentiality of the survey. The analysis proceeded with the assumption that most respondents provided truthful and consistent information, recognizing that while individual reporting may contain some discrepancies, broader trends across the sample could still offer meaningful insights into the relationship between market participation and rural household well-being. Despite these efforts, the inherent limitations of self-reported income remain a concern, and potential inaccuracies in the data cannot be entirely ruled out. To improve accuracy, income data were cross-checked with production levels.
To capture broader factors influencing market participation, the questionnaire also inquired about farmers’ distance to their market place, their farm size, and their access to financial support and extension services.
To ensure the questionnaire’s effectiveness, a rigorous pre-testing phase was undertaken to assess and validate its reliability, suitability, and appropriateness.
This pre-testing was conducted in the Ngqumashe and Khayamnandi rural areas within Raymond Mhlaba Municipality. These areas were chosen for their relevance to the study’s context, allowing for the refinement of the questionnaire’s clarity and relevance. Feedback collected during this phase was used to make necessary adjustments, enhancing the questionnaire’s ability to elicit accurate and meaningful responses. Although Ngqumashe and Khayamnandi were essential for the refinement process, they were not included in the final study sample.
The finalized questionnaire was subsequently used to collect data from the selected study sites, focusing on key areas such as farmer and farm characteristics and market participation, as detailed in
Table 1.
3.4. Data Analysis
The gathered data were initially coded in Excel and then transferred to STATA Version 15 and SPSS Version 25 for further analysis. Both descriptive and econometric methods were utilized in the analysis. Descriptive statistics were applied to summarize the data, while econometric models were used to determine the factors influencing market participation. To evaluate the welfare impacts, propensity score matching (PSM) was employed to account for selection bias.
3.5. Analytical Technique
Building on the utility framework, income gains are central to welfare improvements, as increased income enables households to meet basic needs and improve their standard of living [
47,
48]. Neoclassical economist Alfred Marshall’s principle emphasizes the strong correlation between income and well-being, positing that income growth is a crucial driver of enhanced welfare [
49]. As poorer households begin to participate more actively in income-generating activities, they are expected to experience gradual economic improvement. This process, driven by the assumption of diminishing marginal returns to scale, suggests that, over time, these households may begin to close the income gap with wealthier counterparts [
50]. Expanding on this understanding, an estimation of change due to market participation can be measured as follows:
where
is the income from market participation, and
is the income without market participation. An improvement in welfare is indicated by
>
. Thus,
captures the change in income due to market participation, with
reflecting the utility gained from either engaging in markets or abstaining from them. The overall change in welfare, as measured by household income, reflects the impact of market participation, highlighting how engagement in markets can enhance the economic status and living conditions of smallholder farmers.
The impact of market participation on household income can be evaluated using two primary metrics: the average treatment effect (ATE) and the average treatment effect on the treated (ATT). The ATE represents the expected difference in outcomes of market participation [
20], and it can be expressed as follows:
This expression illustrates the difference between the expected income resulting from market participation and the income a farmer would have earned prior to participating in the market. It represents the anticipated benefits of market participation.
The ATT represents the expected difference in outcomes for those who participate in the market, compared to what their outcomes would have been without participation. It addresses whether the outcomes of participation are advantageous for participants, demonstrating the actual benefits derived from market involvement. The ATT can be expressed as follows:
where
is a binary indicator of market participation. The expression reflects the actual outcomes experienced by participants due to their involvement in the market. However, we can only observe
, the outcome associated with market participation, while the counterfactual outcomes, what the participants would have experienced had they not participated
, remain unobserved. Consequently, a straightforward comparison of household income between participants and non-participants could produce biased estimates of the impact of market participation [
51]. Thus, using Equation (6) to estimate the ATT may result in biased estimates due to this selection bias (b):
where D is a binary variable for market participation (D = 1 if a farmer participates and D = 0 otherwise), and b represents the selection bias. Without a suitable benchmark for comparison, attributing changes in outcomes directly to market participation becomes challenging, as only the outcomes for participants are observable. This limitation complicates the comparison of market participation impacts between participants and non-participants when information about non-participants is unavailable [
20]. This situation reflects the issue of missing data [
52]. Furthermore, it is improbable that all sampled farmers would have participated in the output markets, introducing potential heterogeneity in outcomes among farmers. Therefore, the critical question is the impact of participation on a randomly selected farmer versus one who participated, as the outcomes are likely to differ due to variations in farmer characteristics. Thus, a method to adjust for these differences is necessary.
Having established the necessity of addressing selection bias, we can employ propensity score matching (PSM) as our methodological approach. To estimate the ATT, matching methods are employed to ensure that the comparison between participants and non-participants is as fair and unbiased as possible. By matching farmers who participate in the market with those who do not, based on similar observable characteristics, we create a synthetic control group that serves as the counterfactual for the treated group. This approach allows us to estimate the true impact of market participation on household income, isolating the effects of participation from other confounding factors [
53]. This technique has been successfully applied in various studies to evaluate the effects of market participation in the agricultural sector [
40,
51].
The first step in PSM is to estimate the propensity scores, which represent the probability of a farmer participating in the market based on a set of observable characteristics. This is achieved using a logistic regression model where the dependent variable is a binary indicator of market participation, and the independent variables include demographic factors, farm characteristics, and access to market information. The propensity score
can be estimated as follows:
where
is a binary variable indicating market participation (1 if participated, 0 otherwise),
represents a vector of observable characteristics (e.g., age, education, farm size), and
are parameters to be estimated.
After calculating the propensity scores, participants (treated group) were matched with non-participants (control group) with similar values of the estimated propensity scores
:
and
represent household income levels without and with market participation, respectively, where
indicates market participation and
indicates non-participation.
denotes the propensity score, which is the probability of being in the market participant group given the covariates
. The goal is to compare the outcomes of market participants with those of a control group that has similar characteristics, as indicated by their propensity scores, and to use this comparison to estimate the ATT. The mean effect of treatment is calculated as the average difference in outcomes between the treated group and the control group, conditional on the propensity scores. The ATT can be defined as follows:
This approach ensures that both groups can receive treatment (market participation) and enables estimation of the treatment effects by comparing the observed outcome
of the treated group with the outcome
of the untreated group to estimate what the outcome would have been without market participation. According to (Rosenbaum & Rubin, 1983) [
53], the probability of receiving treatment, given the explanatory variables, can be captured by the propensity score
;
When matching is precise at the propensity score, the distribution of the covariates
, which predict participation and outcomes, will be identical for both the participant and comparison groups [
52]. This requires sufficient overlap in the covariates between the two groups, ensuring that there is a common probability of being either a market participant or a non-participant. This concept is referred to as the region of common support, as described in [
54], and can be expressed as follows:
The overlap expression posits that farmers with identical values of
should have a similar probability of participating in markets. Farmers whose covariates fall outside the region of standard support are excluded from the analysis, as they do not provide a suitable match for the participants [
54].
The typical support region represents the overlap in propensity scores between the treated (participants) and control (non-participants) groups, ensuring that comparable units are available in both groups for accurate estimation of treatment effects. The mean propensity score within this region reflects the average likelihood of participation for the observed sample, while the range defines the boundaries for making valid comparisons. Thus, the validity of the ATT estimation relies on significant overlap in the values, indicating that the conditions for participation apply to both participants and non-participants.
Once the common support region is established and matching is performed, the ATT can be estimated using the matched sample. The ATT is calculated as the average outcome difference between participants and their matched non-participants within the standard support region [
55]. The formula for ATT using PSM is given by
where
denotes the number of treated units (participants in the market). It is the total number of individuals or households in the treated group. Σ
iϵT indicates the summation over all individuals who are part of the treated group TTT.
is the observed outcome for participant
,
represents the weighted sum of the outcomes of control units (non-participants) matched to the treated unit
and
is the weight assigned to control unit
when calculating the counterfactual outcome for treated unit
. These weights are determined by the matching algorithm and ensure that the comparison is as unbiased as possible.
is the outcome for matched non-participants
.
denotes the set of control units (non-participants) that are matched to a particular treated unit
. Essentially, it represents the group of non-participants who are most similar to the treated participant in terms of their propensity scores. The equation essentially calculates the average difference in outcomes between the treated units and their matched control units. It compares the actual outcomes of those who participated in the market
to the weighted average of outcomes for similar individuals who did not participate (
). By averaging this difference across all treated units (
Σ
iϵT), the ATT captures the impact of market participation on those who participated, accounting for any differences in observable characteristics between participants and non-participants. The weighting (
) helps to create a balanced comparison, ensuring that each treated unit is compared to the most similar control units.
5. Discussion
Based on the findings of this study, farmers in the study area earn above the poverty line, allowing them to meet basic needs and potentially have some discretionary income. However, the burden of supporting larger families can strain household resources significantly. Larger family sizes often result in higher dependency ratios, where fewer income earners must support more dependents, such as children and the elderly. This can reduce the production of marketable surpluses, as more of the farm’s output is used for immediate household consumption rather than being sold. Consistent with previous findings, larger family sizes increase competition for limited resources, emphasizing food consumption and household expenditures more than labor for production [
38]. While the study findings revealed moderate market participation among the farmers, with an average participation rate of 55%, this indicates that while a portion of the farmers are engaged in market activities, a significant number are not fully integrated into the market. This moderate level of participation aligns with the broader economic challenges these farmers face. One of the primary issues is the limited size of their farms, which average only a few hectares. This limited scale hinders their capacity to realize economies of scale [
19]. For these smallholders, the lack of scale means higher per-unit costs of production, which reduces their competitiveness in the market. The small size of the farms also curtails the production of marketable surpluses, limiting the quantity of produce available for sale after meeting household consumption needs. This situation hampers profitability, making it challenging for farmers to generate sufficient income to reinvest in their farms. As a result, they often struggle to invest in advanced technologies or inputs, such as high-quality seeds, fertilizers, and irrigation equipment, which could enhance productivity and increase their income potential.
In addition to the constraints of farm size, the geographical remoteness of smallholder irrigators poses further challenges to economic advancement. Many of these farmers are situated over 20 km from significant market centers, leading to higher transportation costs for selling produce and obtaining essential agricultural inputs [
60]. This remoteness limits market access, negatively impacting profitability by reducing the farmers’ ability to compete in more lucrative markets and respond quickly to market demand changes. Furthermore, the increased costs and logistical challenges associated with transporting goods over long distances make it difficult for farmers to sell their produce and acquire necessary supplies, further hindering their economic progress.
The logit model revealed several socio-economic factors that significantly influence market participation among smallholder farmers. Several critical factors influence market participation among farmers, including gender, marital status, education, access to extension services, and financial support. Among these, gender disparity is particularly pronounced. The findings reveal that men typically have better market access than women [
51]. This imbalance suggests that gender roles and societal norms might influence who participates in farming, rendering it a predominantly male occupation. This observation is consistent with literature documenting women’s unique challenges compared to their male counterparts. From a young age, women are socialized into caregiving roles, influencing their approach to agriculture [
61]. However, in conventional agricultural environments where masculine traits are valued, women may struggle to assert their identity as farmers [
61]. This cultural dynamic, including household responsibilities, can limit their opportunities and recognition in the field [
36]. This can be confirmed by the fact that there is a significant income disparity between male and female farmers, with men earning approximately ZAR 26.78 more per cropping season than their female counterparts [
10].
Education, access to extension services, and financial support are critical in enhancing market participation. According to Phakathi et al. [
40], education equips farmers with the knowledge and skills to interpret agricultural information, adopt innovative practices, and improve productivity. Educated farmers are better positioned to understand and leverage market information, negotiate prices, and implement new technologies to increase yields and profitability.
Access to extension services further supports market participation by providing farmers with essential information on market opportunities, crop management techniques, and sustainable agricultural practices. According to the literature, farmers who receive these services are more likely to engage in markets, as they provide valuable guidance on optimizing production and establishing connections with buyers [
40,
62]. This implies that extension services are a vital bridge between farmers and markets, facilitating knowledge transfer and improving farmers’ decision-making capabilities.
Financial support is equally vital in promoting market participation. Access to financial resources, such as credit and loans, allows farmers to seize market opportunities by purchasing necessary inputs and hiring transportation, ensuring they can access markets promptly. Haile et al. [
63] found that financial support bolsters farmers’ capacity, leading to increased production and a more robust market supply. With financial backing, farmers can purchase inputs promptly and hire labour to boost productivity, enhancing their market competitiveness.
Conversely, marital status presents a contrasting influence on market participation. Married farmers are generally less likely to participate in markets than their unmarried counterparts. This tendency is attributed to married individuals prioritizing home consumption and family needs over market sales. The focus on meeting domestic requirements limits their market activities to selling surplus produce [
62]. This behaviour may result in lower levels of market engagement and reduced income from market sales.
The average treatment effect on the treated (ATT) confirms significant income improvements for households participating in the market, with participants earning approximately 45% more than non-participants across all matching methods. The heterogeneity effects further suggest that market participants experience 20–23% higher gains, suggesting that market participants benefit more than the non-participants. This finding aligns with theoretical expectations that output market participation enhances revenue generation opportunities, ultimately boosting smallholder farmers’ economic well-being. It further corroborates previous research in South Africa, demonstrating that market participation significantly enhances smallholder farmers’ livelihoods. Hlatshwayo et al. [
38] found that market participation improved household dietary diversity, while Cele and Mudhara [
64] showed that market participation positively influenced household food security. These findings support the argument that increased income from market participation not only improves economic welfare but also contributes to better food security outcomes. These insights emphasize the importance of strengthening market access and integrating smallholder farmers into formal value chains to enhance their resilience and overall welfare.
6. Conclusions
Smallholders are well acknowledged for their contribution to food security and poverty reduction. Although they are mostly self-sufficient, there is a growing emphasis on encouraging them to utilize their limited resources effectively to increase production beyond home consumption, engage in markets, and generate the income necessary for their livelihoods, which depend not only on food supply but also on cash to purchase goods and services they cannot produce on their own. This transition is achievable through the establishment of well-functioning markets. However, farmers face numerous challenges, such as financial constraints, small farm sizes, inadequate training, poor infrastructure, and limited access to irrigation systems, which further hinder their capacity to engage effectively in markets. As a result, progress in market engagement remains sluggish. Nonetheless, for those who do participate, the findings show that market participation has led to considerable improvements in their income.
That said, while the findings of this study highlight considerable gains in the well-being of market participants, they also suggest that the full potential of market participation remains untapped. However, there are important limitations to consider. The study analysis is based on survey data collected from the selected irrigation schemes, which may not fully represent the experiences of all smallholder irrigators in the area. Moreover, although rigorous matching techniques were employed to estimate the average treatment effect on the treated and minimize selection bias, other unobserved factors such as risk preferences, informal networks, and individual decision-making processes may still affect how farmers engage with markets and the benefits they derive. Additionally, a one-time data collection point limits the study’s ability to assess long-term effects, it does not allow for the exploration of the ongoing impact of market participation on farmers’ income and well-being, nor does it capture seasonal or exogenous shocks. Future research should then adopt a longitudinal approach which will allow for tracking farmers over an extended period to determine the sustainability of income gains, understand the long-term effects of market participation on welfare, and identify the factors influencing farmers’ ability to remain in markets over time. Thus a longitudinal study could potentially bring to light informative observations regarding whether such enhancements over time are enduring or if they fade in later periods. Such studies could also consider incorporating seasonal variations and assessing gender-differentiated outcomes. In addition, integrating qualitative methods would provide deeper insights into the socio-cultural factors influencing market engagement.
For policymakers, these findings highlight the urgent need for interventions, with efforts focusing on improving rural infrastructure to facilitate smoother farm-to-market operations, enhancing access to credit and financial services, and increasing the visibility and effectiveness of extension services and agricultural training. Additionally, implementing quality control programs and certification schemes will help farmers meet market requirements and standards. Lastly, fostering partnerships with public and private enterprises will be crucial in creating a more supportive environment for smallholder farmers.


