Article

Impact of Three Decades of Conservation Management Systems on Carbon Management Index and Aggregate Stability

by
Murilo Veloso
1,
Fábio Farias Amorim
2,
Jéssica Pereira de Souza
2,* and
Cimélio Bayer
2
1
Institut Polytechnique UniLaSalle, SFR NORVEGE FED 4277, AGHYLE Rouen UP 2018.C101, 76130 Mont-Saint-Aignan, France
2
Pos-Graduation Program on Soil Science, Federal University of Rio Grande do Sul, Porto Alegre 91540-000, RS, Brazil
*
Author to whom correspondence should be addressed.
Sustainability 2025, 17(8), 3378; https://doi.org/10.3390/su17083378
Submission received: 18 February 2025 / Revised: 31 March 2025 / Accepted: 2 April 2025 / Published: 10 April 2025
(This article belongs to the Section Sustainable Agriculture)

Abstract

The sustainability of agroecosystems depends on the maintenance of soil organic matter (SOM) and soil aggregate stability, which are key components of soil health. The long-term effects of conservation management systems, such as the adoption of no till (NT) associated with cover crops, on soil quality are still unclear. The aim of this study was to evaluate the long-term effects of NT systems combined with cropping systems ecologically intensified by the presence of legumes on the carbon management index (CMI) and the state of soil aggregation, as sensitive tools to assess the quality of soil management systems. NT combined with autumn and spring legume cover crops increased the proportion of soil aggregates > 2 mm, resulting in higher weighted average diameters and higher aggregation index values in comparison to conventional tillage (CT), which favored the soil microaggregate proportion. The soil C content was favored by NT only in the surface layer, while the use of legume cover crops increased the C stock by 23% compared to the system without legume cover crops in the 0–20 cm layer. In the topsoil under NT, the stocks of particulate organic matter (POM) and mineral-associated organic matter (MAOM) were 100% and 37% greater than in CT, respectively. A greater CMI was observed under NT compared to CT in systems with no legumes (18%), with one legume (52%), and with two legumes (72%) as cover crops. These results highlight no till’s positive impact on soil health, further enhanced by the legume-based ecological intensification of cropping systems.

1. Introduction

Increasing the soil organic matter (SOM) on cropland is essential in maintaining soil health and crop productivity [1,2]. It is also a strategic solution for the mitigation of greenhouse gases and building climate-friendly agriculture [3,4]. In tropical and subtropical regions, the long-term adoption of conservation tillage (such as NT) generally implies higher soil C stocks compared to systems with continuous tillage (such as conventional tillage—CT). Since the C inputs into the soil in NT and CT are very similar, C stabilization in the soil under NT is one of the main factors driving soil C accumulation under conservation management systems [5,6,7].
Soil disturbances under CT modify the distribution and the stability of aggregates, reducing the proportion of macroaggregates and increasing that of microaggregates [8,9]. As a result, the SOM is exposed to microbial activity, especially that derived from macroaggregates, increasing the decomposition rates and reducing the soil C stocks [10]. In turn, in conservation management systems, the formation and permanence of aggregates is favored by not disturbing the soil, which acts by restricting microbial activity to a certain degree [11]. Around 20–30% of C accumulation in subtropical soils under NT occurs due to the physical protection of OM within soil aggregates [12,13].
In addition, the SOM stocks also depend on the biomass input by cropping systems. Cropping systems with high biomass content have greater potential for SOM accumulation [14]. In addition to the quantity of biomass, the quality of the residue can be a determining factor in aggregate formation and soil carbon stabilization [15,16,17].
This is because high-quality residues, especially through legume cultivation, contribute to increasing the microbial biomass and activity, as well as increasing the carbon use efficiency [18,19]. Microbial metabolites and by-products can act as soil aggregate cementing agents, increasing the soil aggregate stability or favoring the interaction between the organic matter and the soil mineral matrix (mineral-associated organic matter (MAOM)) [20,21,22,23,24,25]. Therefore, soil tillage and cropping systems can modulate the dynamics of MOS, nutrient cycling, soil quality, and the sustainability of agricultural systems.
The quality of OM can be assessed using physical fractionation techniques [26]. One of the most widely used techniques, due to its simplicity and low cost, is particle size fractionation, which separates particulate organic matter (POM) and MAOM, as originally proposed in [27]. These MO reservoirs have different formation pathways, functions, and stabilization mechanisms [28]. POM is formed by the input of structural compounds (greater biochemical recalcitrance) of plant and animal origin, is more susceptible to decomposition than MAOM, and is a short-term reservoir of nutrients for plants and edaphic microbiota [29].
On the other hand, the entry of low-molecular-weight organic compounds, whether of plant origin or by-products, and microbial necromass can form MAOM through organo-mineral and organo-organic association or be entirely mineralized and leave the system in the form of CO2 [18,19,30]. The chemical protection of MAOM associated with encapsulation in aggregates drastically reduces the accessibility of MO to microorganisms and their enzymes; thus, the permanence of MOAM can span decades, centuries, or even millennia [31]. Notably, calculating the carbon management index (CMI) using the C stocks in the POM and MAOM fractions can be valuable, since this general index assesses the impact of soil management systems on soil health [32]. Research in the highly weathered tropical and subtropical soils of South America, which make up nearly 50% of the global area under conservation agriculture (~56 million hectares) [33], remains limited.
In view of this, the hypotheses of this study were as follows: (i) a greater CMI was expected to be observed under NT associated with ecologically intensified cropping systems compared to CT with no legumes; (ii) there would be a positive interaction between the POM stock and soil macroaggregate formation. This study aimed to evaluate (i) the impact of conservation management systems combined with cropping systems ecologically intensified by the presence of legumes on different SOM fractions and on the carbon management index; (ii) the interaction between soil aggregation and C stocks in different fractions of SOM. To achieve these objectives, we performed the granulometric fractionation of soil organic matter and analyzed the state of soil aggregation and the CMI in a 30 y field experiment combining tillage and cropping systems with legume cover crops.

2. Material and Methods

2.1. Experimental and Treatment Characterization

This study was based on a long-term experiment initiated in 1985 at the Experimental Station of the Federal University of Rio Grande do Sul, located in Eldorado do Sul, RS, Brazil (30°50′5″ S and 51°38′08″ O). This area was previously cultivated under conventional tillage with plowing and harrowing. The region has a humid subtropical climate (Cfa, according to the Köppen classification), with an average annual temperature of 19.4 °C and annual rainfall averaging 1440 mm. The soil is classified as Acrisol [34], and its granulometric distribution is 540 g kg−1 of sand, 240 g kg−1 of silt, and 220 g kg−1 of clay, with the clay fraction dominated by kaolinite (720 g kg−1) and iron oxides (109 g kg−1 of Fe2O3).
In the 30 y field experiment, two tillage methods were included in the main plots (15 m × 20 m): no tillage (NT) and conventional tillage (CT). Each tillage method consisted of three cropping systems arranged on subplots of 5 m × 20 m, simulating the ecological intensification with zero, one, or two legume cover crops: oats (Avena strigosa Schreb)/maize (Zea mays L.) (O/M), vetch (Vicia sativa L.)/maize (V/M), and oats + vetch/maize + cowpea (Vigna unguiculata L.) (O+V/M+C). The experimental design comprised randomized blocks with subdivided plots, totaling 54 plots (3 cropping systems, 2 tillage methods, 3 blocks, and 3 soil layers). In the treatments used in this study, N was not added. Details of soil and crop management are described in [35].
Based on 30 years of historical data, the average annual C addition among the crops was 4.77, 6.28, and 8.92 Mg ha−1 for the O/M, V/M, and O+V/M+C cropping systems in CT and 5.21, 6.44, and 8.77 Mg ha−1 in NT. This estimate considers 30% of root addition from aboveground biomass and assumes that maize and cover crops contain 40% carbon. Data for 1985–2006 were compiled in [36] and updated for 2014.

2.2. Soil Sampling

Soil samples were collected in September 2014, at the end of the autumn crop cycle and before the establishment of the spring maize crop, in the three replications. Two 50 × 50 cm trenches were excavated in the middle of each sub-subplot of 5 × 10 m. The soil profile was sliced into three layers (0–5, 5–10, and 10–20 cm), where undisturbed samples used to evaluate the state of soil aggregation and the bulk density were collected. In the same layers, disturbed samples were also collected to evaluate the total organic C (TOC) content and for organic matter fractionation.

2.3. Determining the State of Soil Aggregation

Undisturbed soil samples were manually broken at weak points, passed through a 9.51 mm sieve, and air-dried. Two 50 g duplicates of aggregates < 9.51 mm were moistened overnight on a paper filter. The wet samples were transferred to a 1000 mL cylinder with 500 mL of water and shaken for two minutes at 16 rpm, according to the method proposed in [37]. The suspension was then placed on a vertical shaker with an individual capacity of 10 L, where the aggregates were placed on a set of five sieves (meshes of 4.76, 2.00, 0.50, 0.25, and 0.053 mm). Material < 0.053 mm was flocculated with 50 mL of 5% potassium alum and then dried at 105 °C. Aggregates on the sieves were dried for 24 h at 105 °C and weighed.
A dry aggregate analysis was performed with the same sample amount and sieves as mentioned above, using a vibrating machine (Telastem, Produtest model G) for 1 min per sample. Aggregates were transferred to aluminum containers, dried at 105 °C for 24 h, and weighed. The mean weight diameter (MWD) was calculated for both wet (WMWD) and dry sieving (DMWD) according to Equation (1).
M W D = i = 1 n ( x i · w i )
where wi = proportion of each size range in relation to the total; xi = average diameter of the size ranges, in mm.
The aggregate stability index (ASI) was calculated as the ratio of WMWD to DWMD, indicating the capacity of aggregates to resist disintegration, with higher values closer to 1.

2.4. Fractionation of SOM, C Analysis, and C Stock Calculation

The fractionation of OM by the granulometric method was carried out according to the methodology proposed in [27]. Briefly, 20 g of soil was placed in snap-cap flasks with a capacity of 100 mL, where 60 mL of sodium hexametaphosphate (5 g L−1) was added, and they were shaken for 16 h in a horizontal shaker (120 oscillations per minute). The suspension was then passed through a 0.053 mm sieve using a jet of water. The material retained on the sieve (POM) was dried in an oven at 50 °C and its mass was quantified. The whole soil and POM fractions were ground on an agate grater to pass through a 0.250 mm mesh sieve and analyzed for C content by dry combustion in a Thermo Electron Corp. (Milan, Italy) FlashEA analyzer.
Soil total C stocks were calculated using equivalent soil masses [38], with the CT O/M as a reference. Soil masses were obtained from soil density values measured with the volumetric ring method in the 0–5, 5–10, and 10–20 cm layers. The C stock in MAOM was determined by subtracting the POM fraction from the total soil C stock.

2.5. Calculation of Carbon Management Index

Soil from the CT O/M system was used as a reference (CMI = 100) to calculate the C stock index (CSI) (Equation (2)), C lability (L) (Equation (3)), and C lability index (CLI) (Equation (4)). From the CSI and CLI, the carbon management index (CMI) was calculated (Equation (5)).
CSI = TOCsample/TOCcontrol
L = POM/MAOM
CLI = Lsample/Lcontrol
CMI = CSI × ILC × 100
where TOCsample = total organic C stock (Mg ha−1) in each treatment; TOCcontrol = total organic C stock (Mg ha−1) in the reference treatment; POM = particulate organic carbon stock (Mg ha−1); MAOM = C stock associated with minerals (Mg ha−1); Lsample = soil C lability in each treatment; and Lcontrol = soil C lability in the reference treatment.

2.6. Statistical Analysis

Statistical analyses were carried out using the SAS 9.4 statistical package. Firstly, the data were tested for normality using the Shapiro–Wilk test (p < 0.05). Subsequently, an analysis of variance (ANOVA) was performed. When the ANOVA was significant (p < 0.05), the difference between the means was assessed using the Tukey test (p < 0.05). The statistical models used in the ANOVA for the distribution of aggregate size classes, MWD, CMI, concentration and C stock, POM, and MAOM in the soil profile were
Yijkl = μ + Bi + Pj + Error a(ij) + Sk + SPjk + Error b(ijk) + Cl + Error c(il) + PCjl + SCkl +
PSCjkl + Error d(ijkl).
where μ = overall mean of the data; B = block (i = 1, 2, 3); P = tillage system (j = 1, 2); S = cropping system (k = 1, 2, 3); C = layers (l = 1, 2, 3); Error = experimental error. To evaluate the TOC stocks, annual C accumulation rate, CSI, L, CLI, and CMI, the layer variable and its associated errors were removed from the statistical model.

3. Results

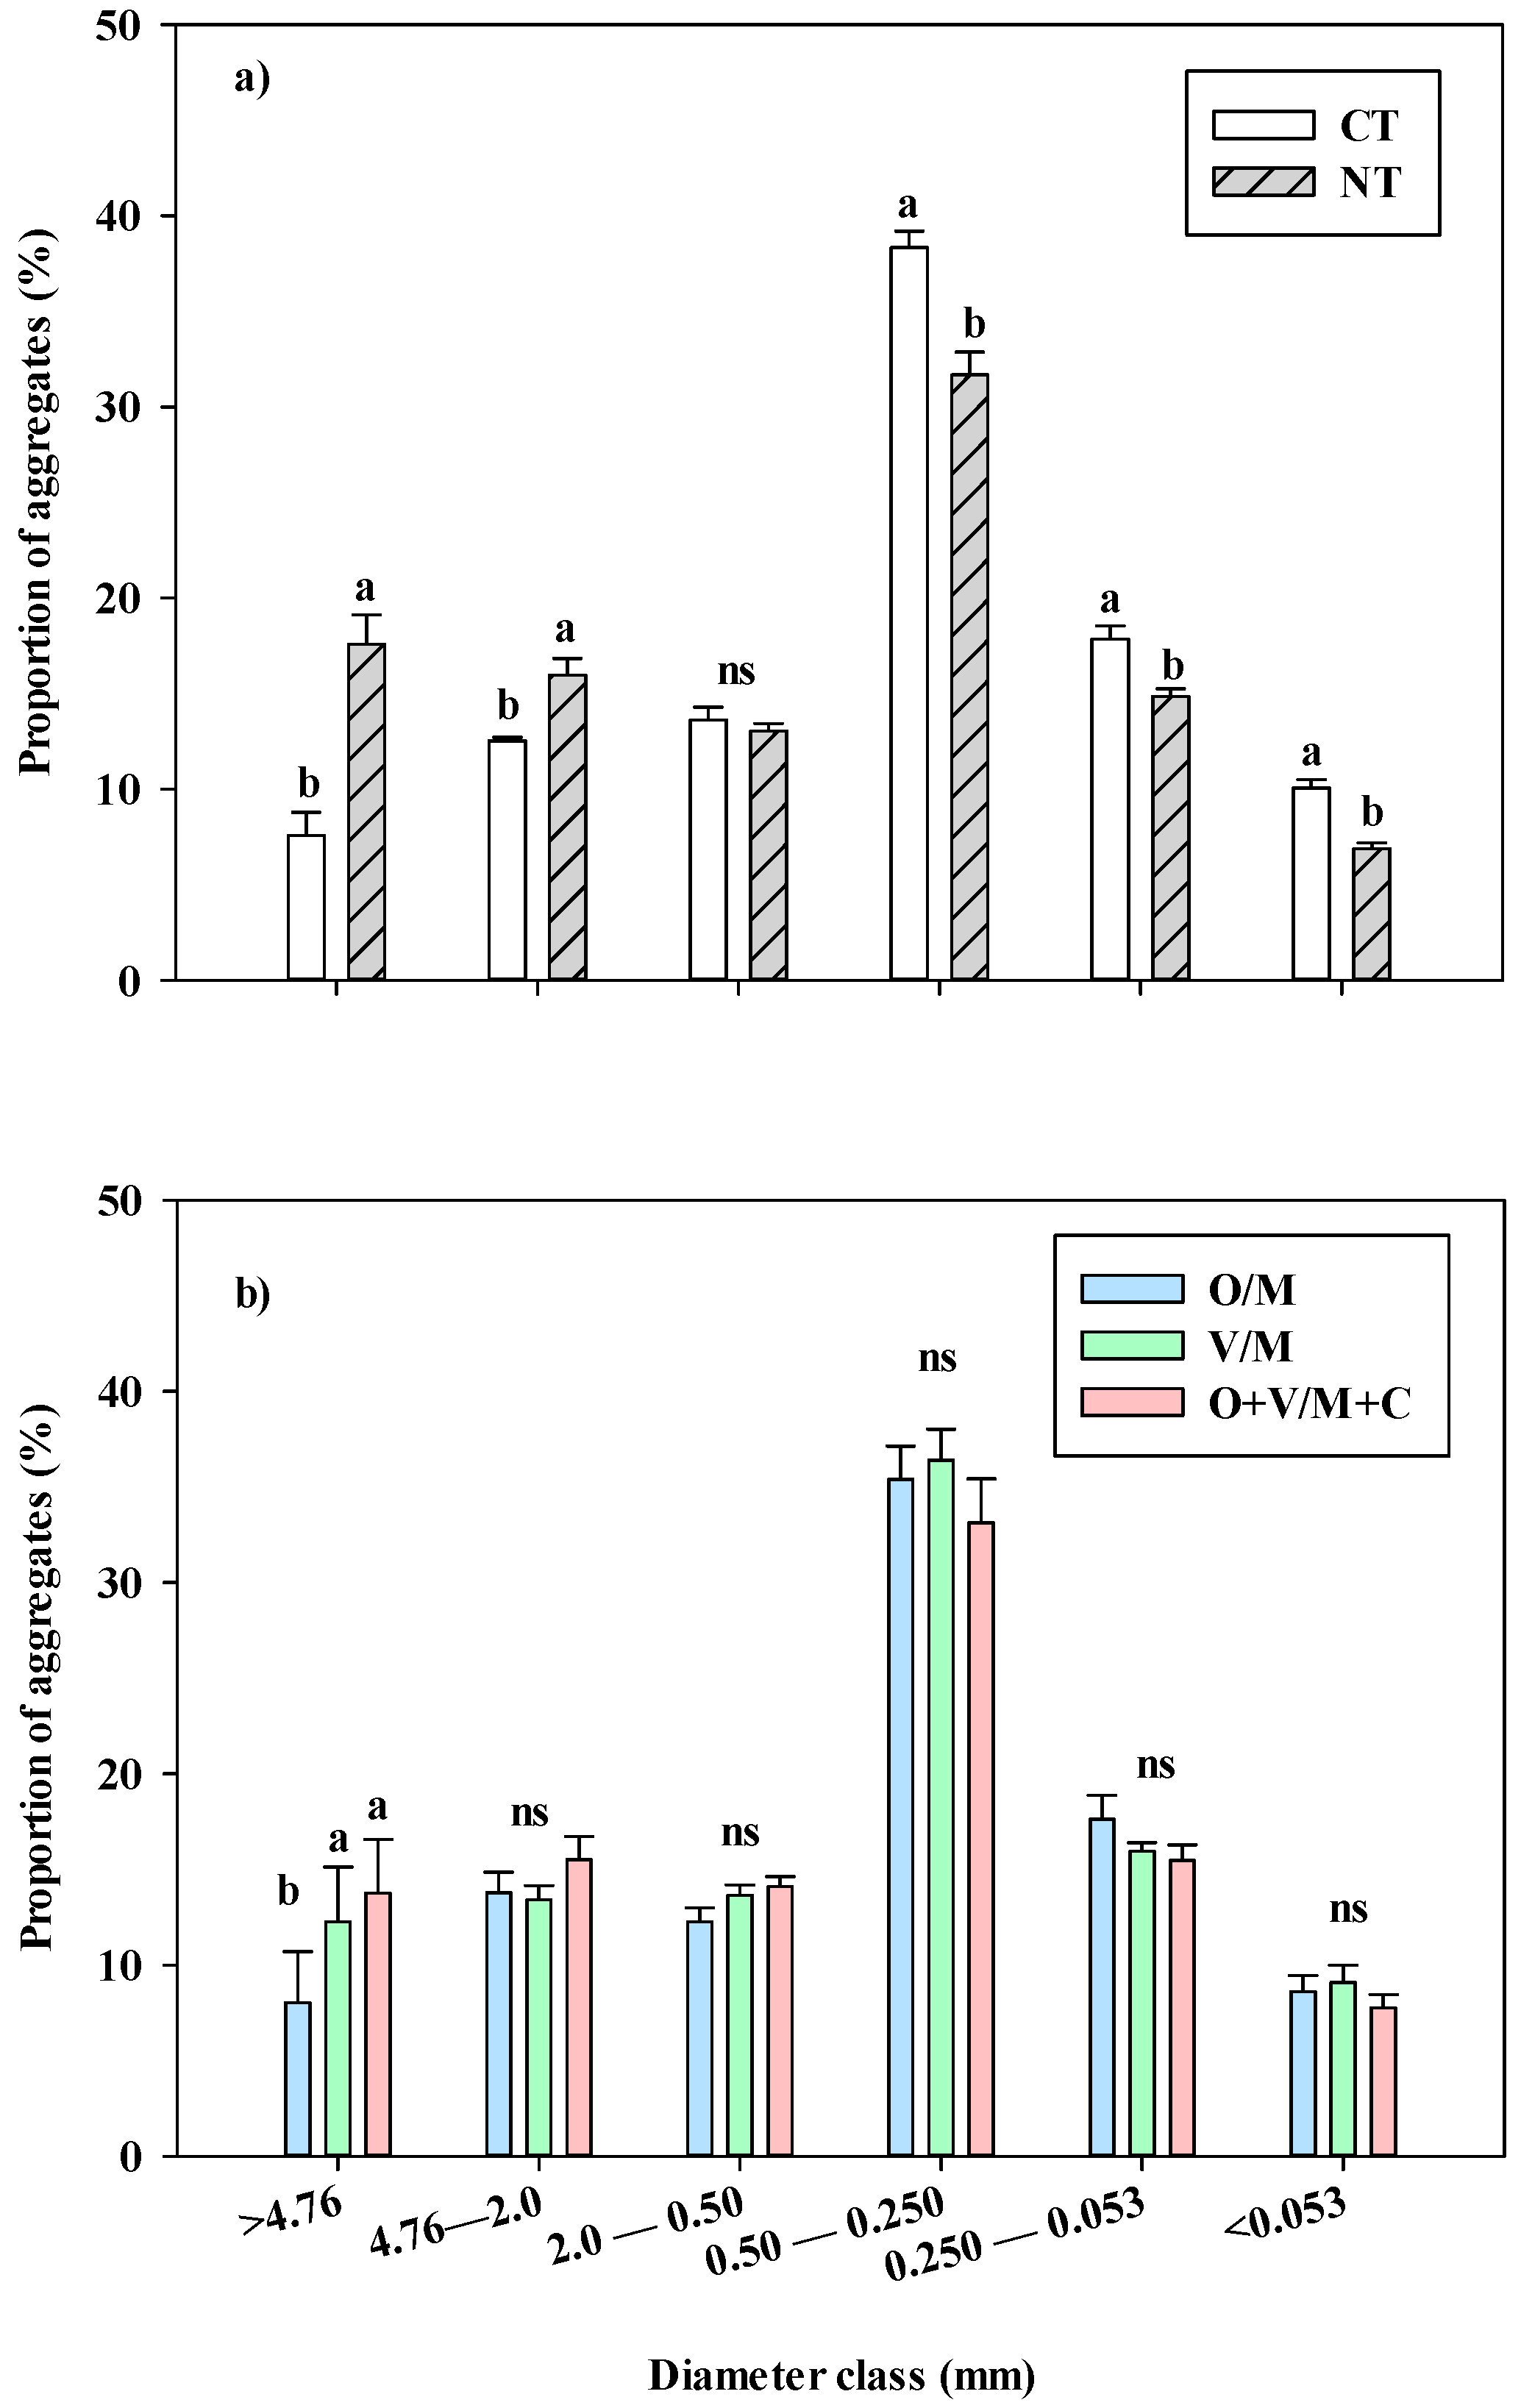
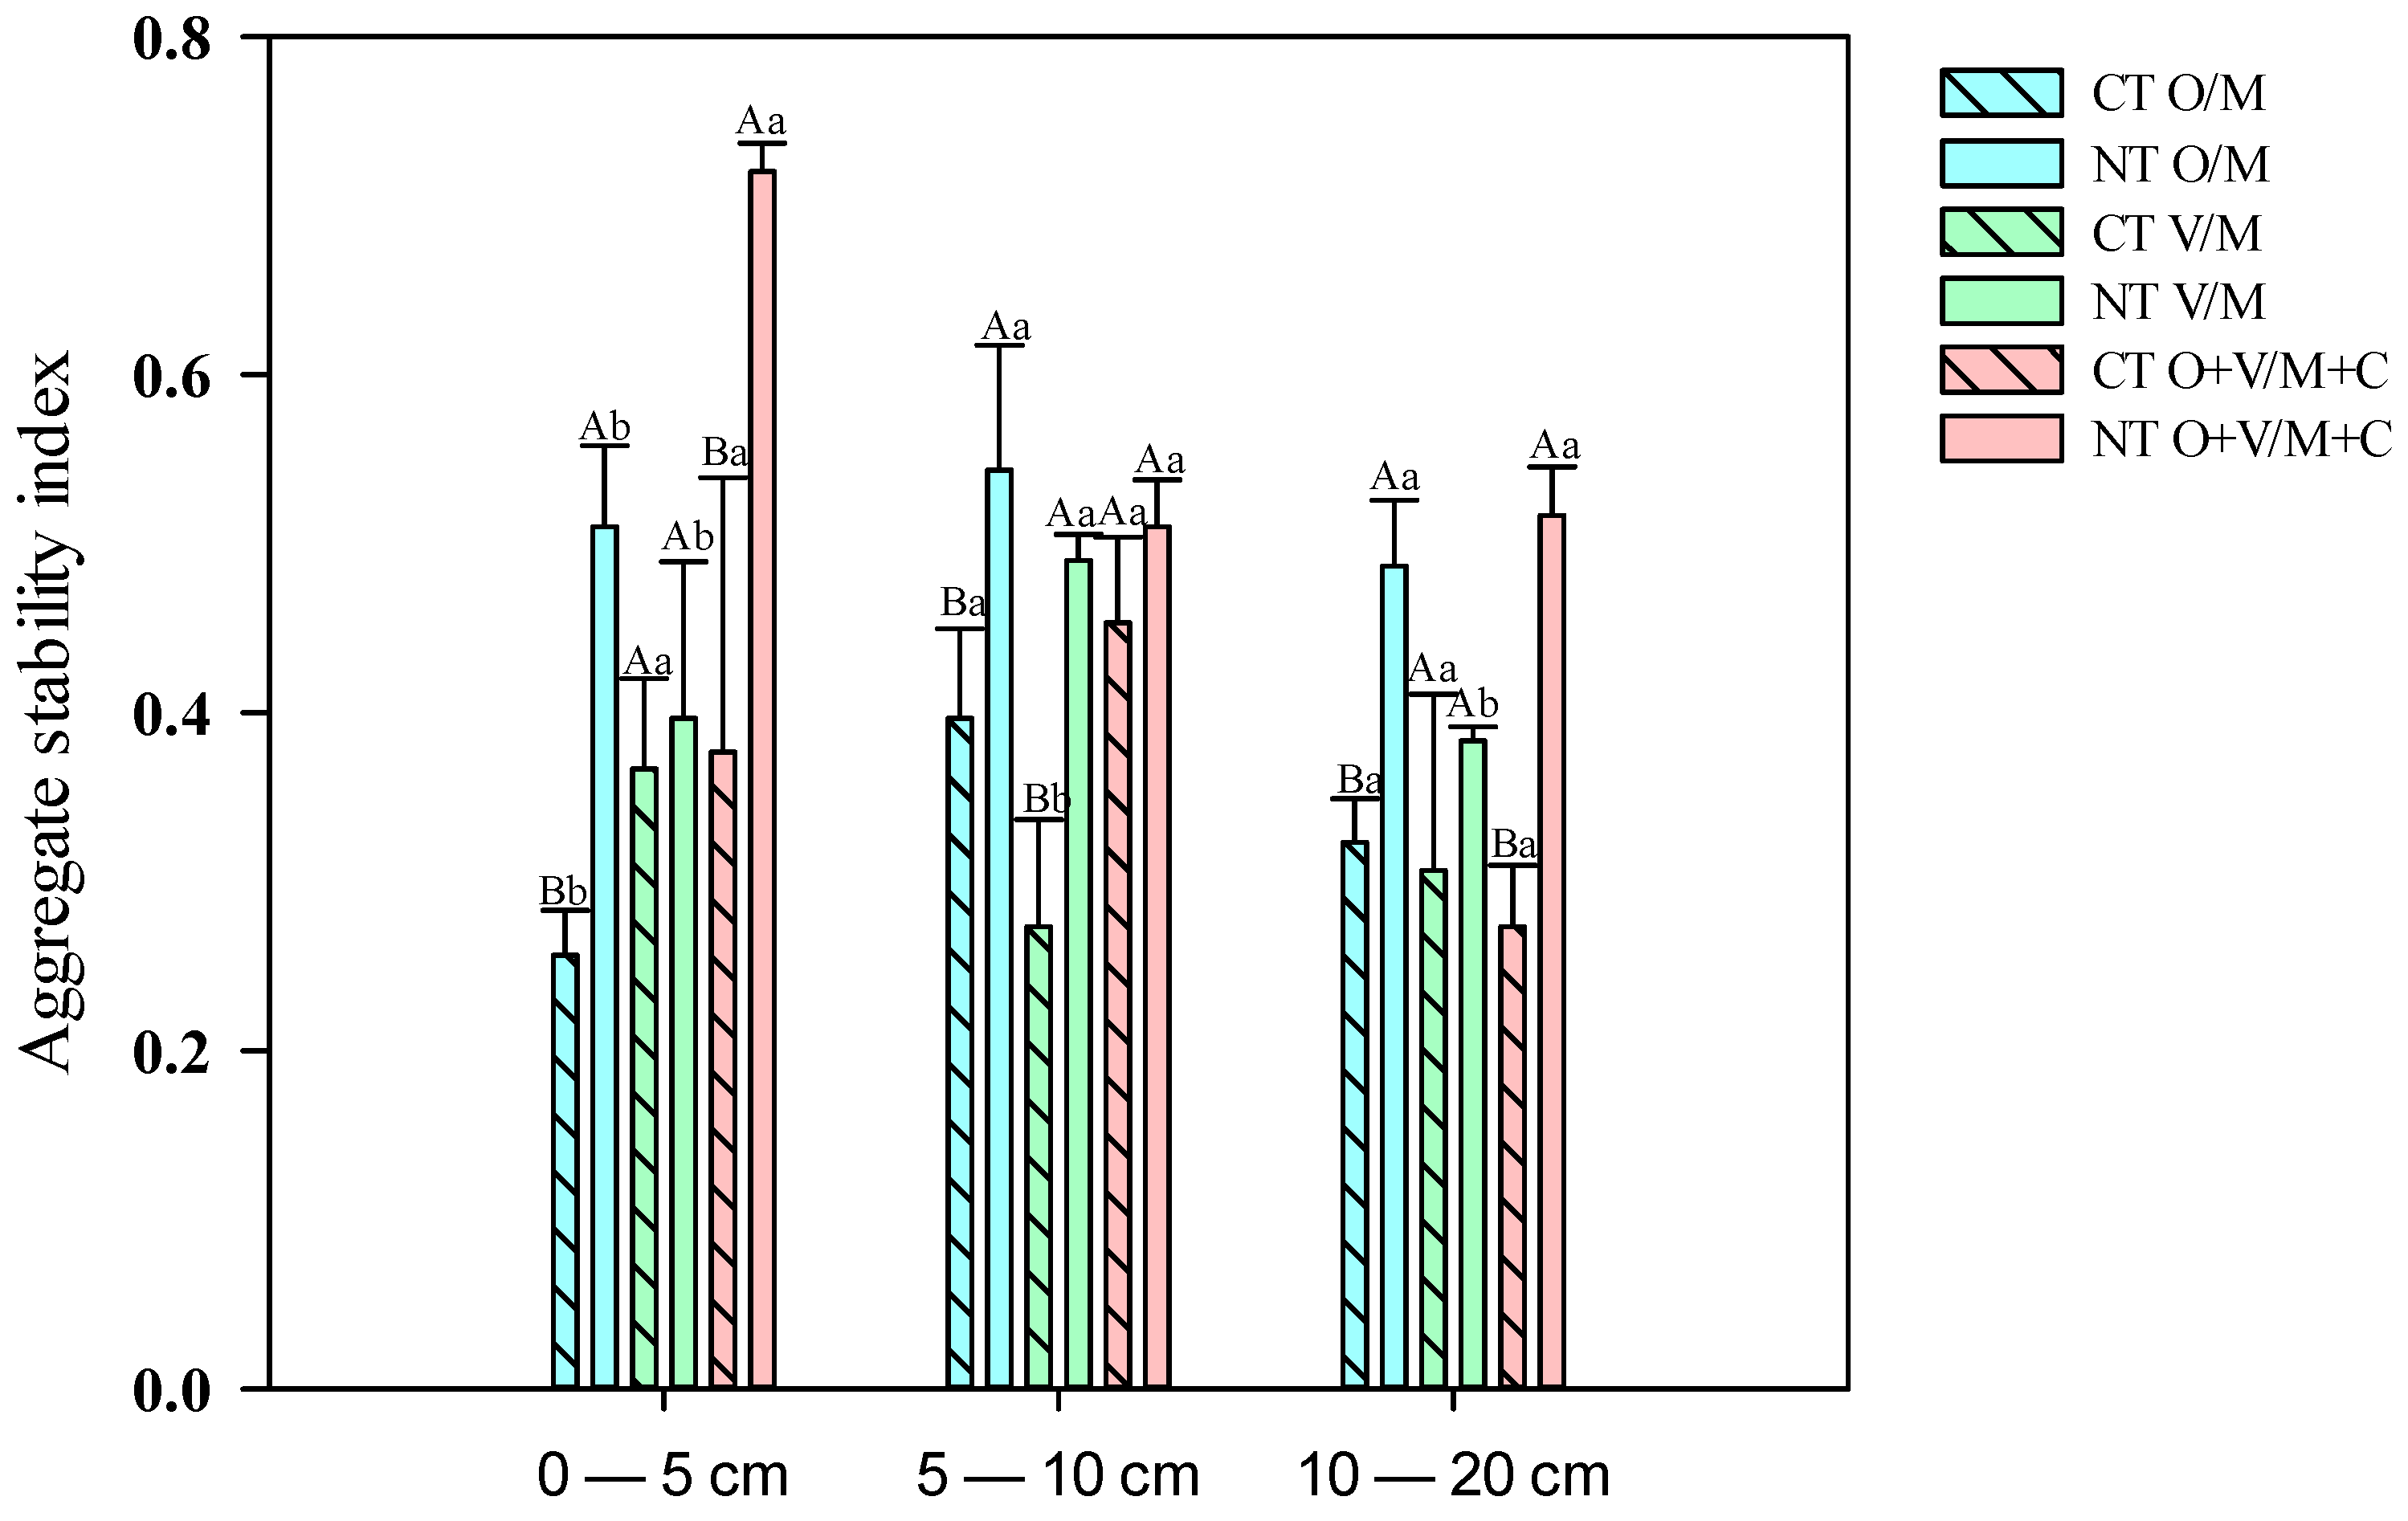
3.1. State of Soil Aggregation

The proportion of soil aggregates in the different size classes was impacted by the tillage and cropping systems, with no interaction between these two practices (Figure 1a,b). The aggregate proportions in the >4.76 and 4.76–2.00 mm size classes were 2.5 and 1.3 times greater in NT compared to CT. The soil under CT had a higher proportion of microaggregates (56%) than NT (47%) (Figure 1a). On average, the proportion of soil aggregates in the >4.76 mm class in the cropping systems with legume cover crops was 60% higher than in the system without legume cover crops (O/M) (Figure 1b). In the other soil aggregate classes, there was no effect of the cropping system (Figure 1b).
A greater wet mean weight diameter (WMWD) was observed under NT (2.0) in relation to CT (1.2) in the three soil layers evaluated and under all cropping systems (Figure 2a). In NT soil, the O+V/M+C system had a higher WMWD than the V/M system in the three evaluated layers, and this difference reached 59% in the surface soil layer. In the CT soil, the lowest WMWD was observed under the O/M system, especially in the 0–5 layer (0.75).
The effect of the tillage systems on the DMWD was not clear. A greater DMWD was observed in NT than CT, especially in the 0–5 cm soil layer (Figure 2a and Figure 3). However, a greater DMWD in CT than NT was observed in the 5–10 cm soil layer under V/M (Figure 2b).
A greater ASI was observed in NT (0.52) compared to CT (0.31), especially under the O/M and OV/MC systems (Figure 3). In the surface soil layer under O+V/M+C, the ASI was 1.8-fold greater in NT than CT (Figure 3).

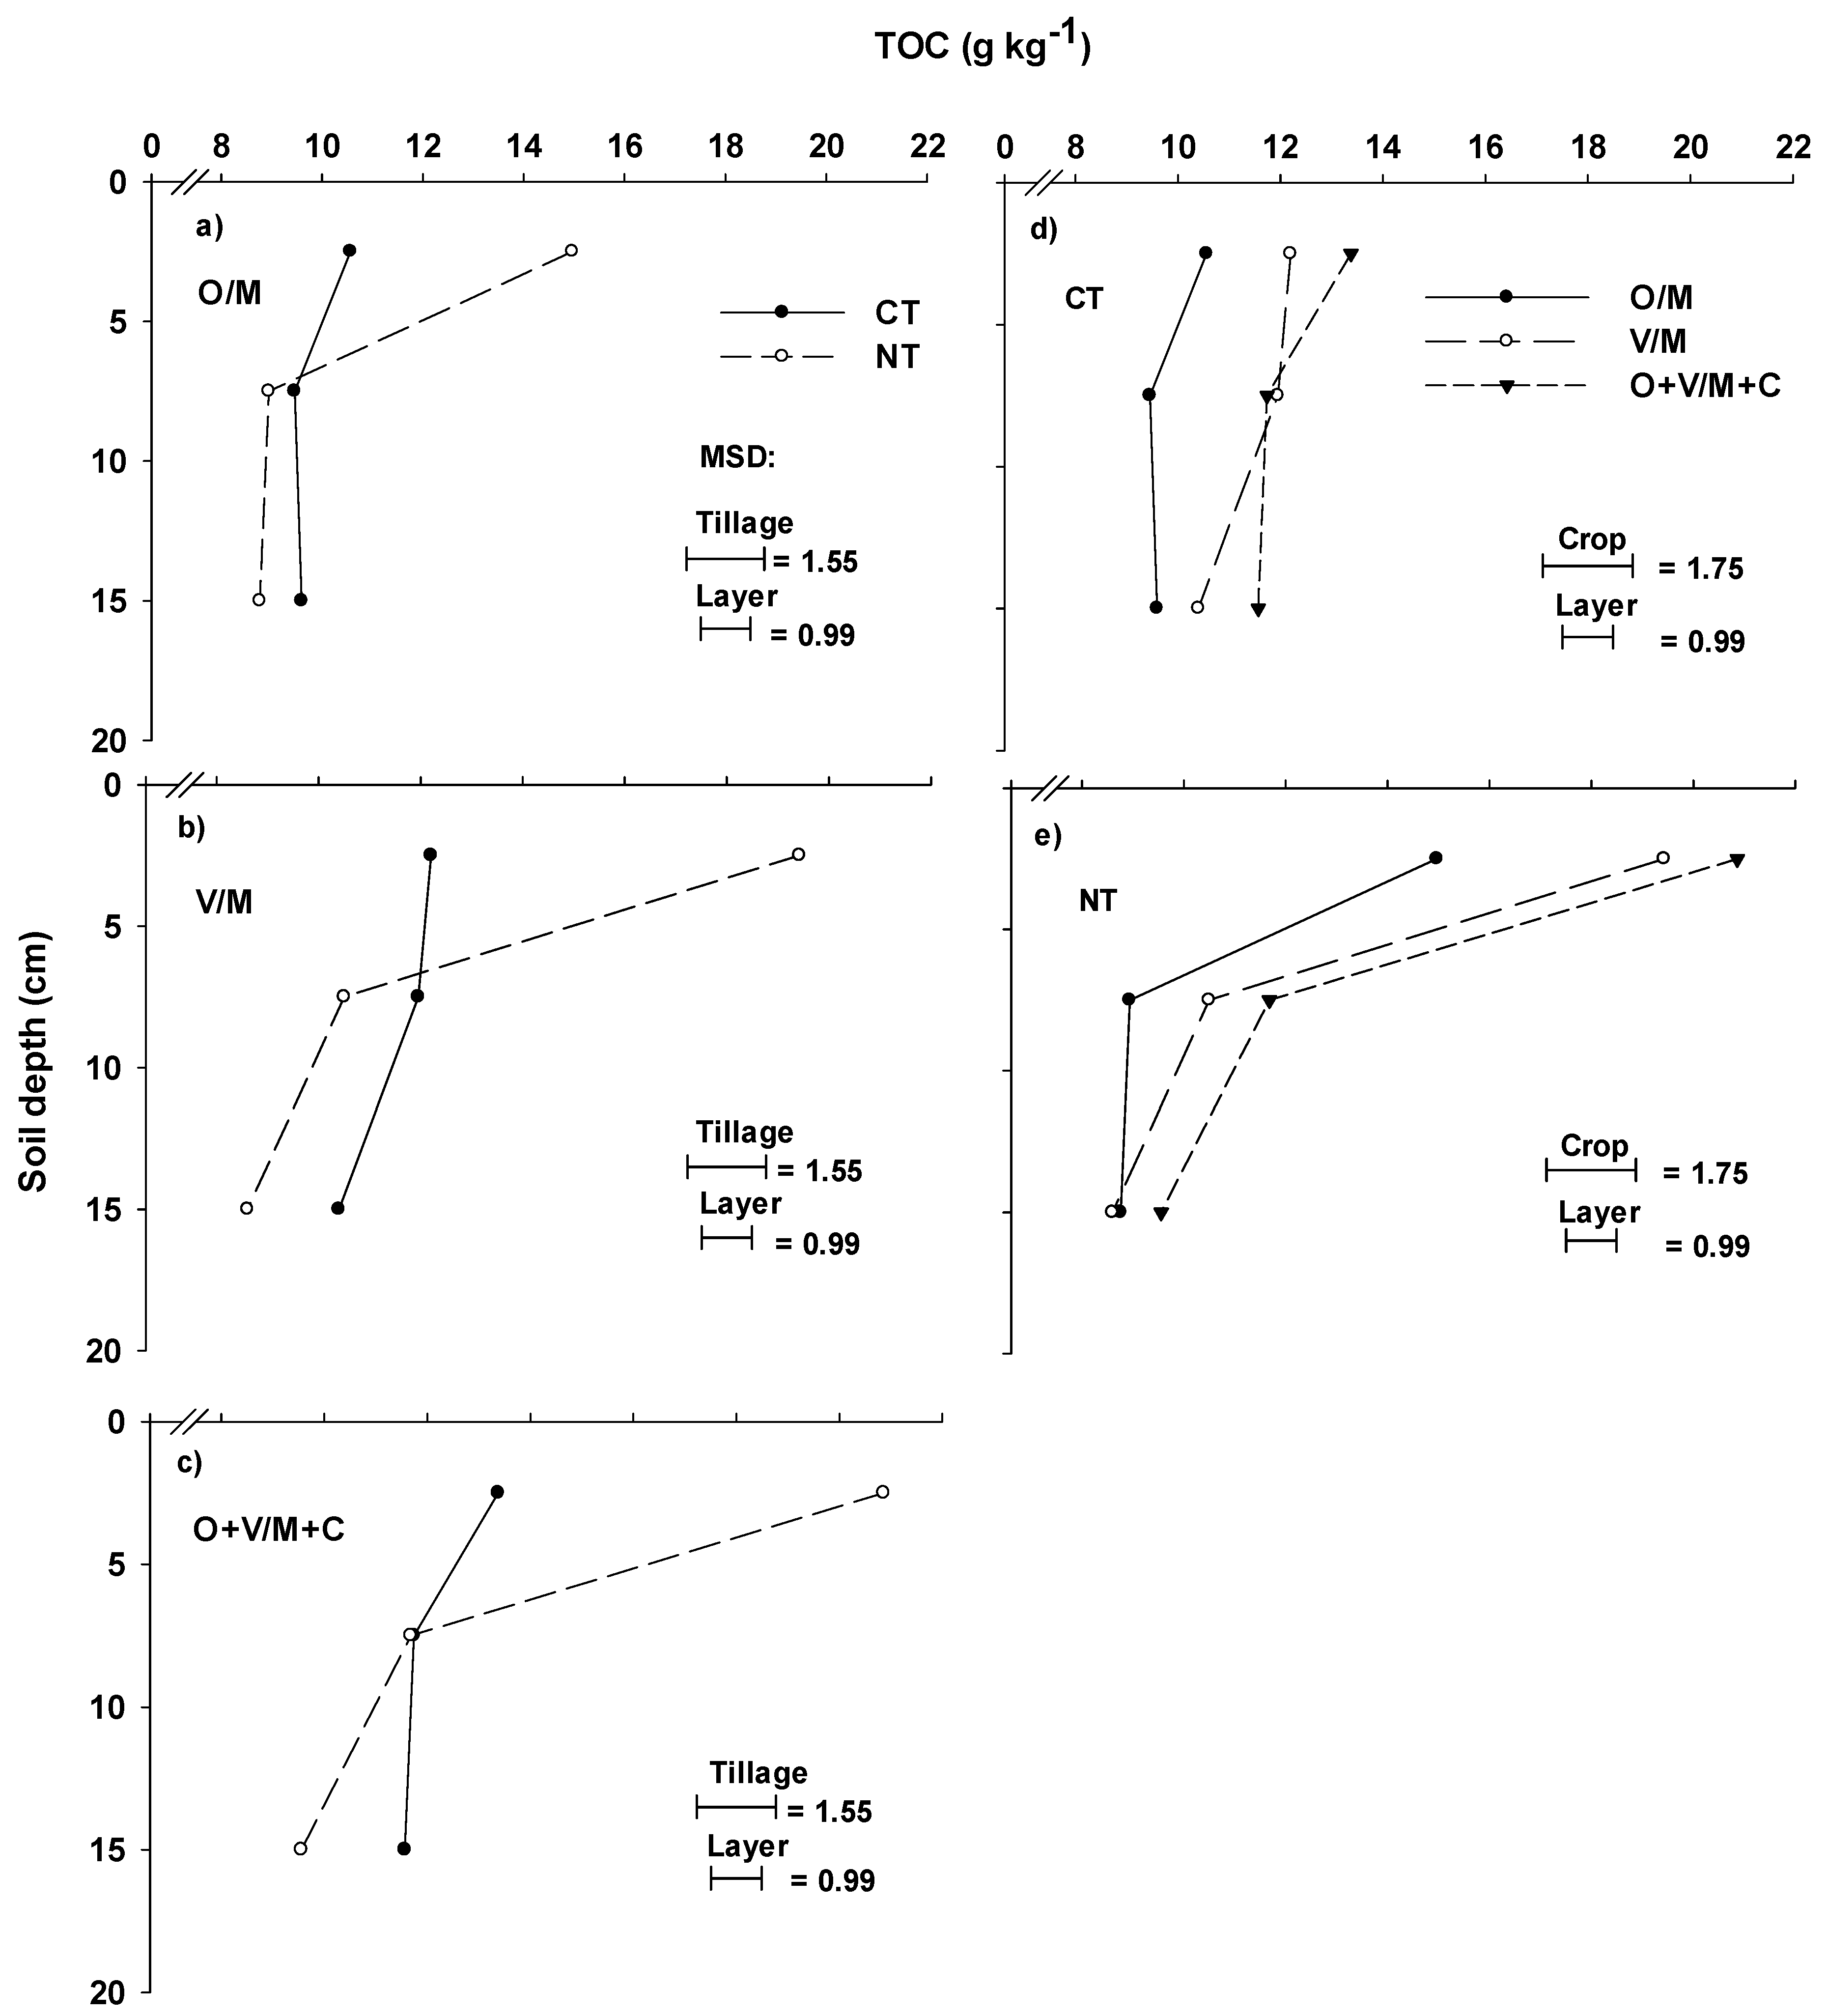
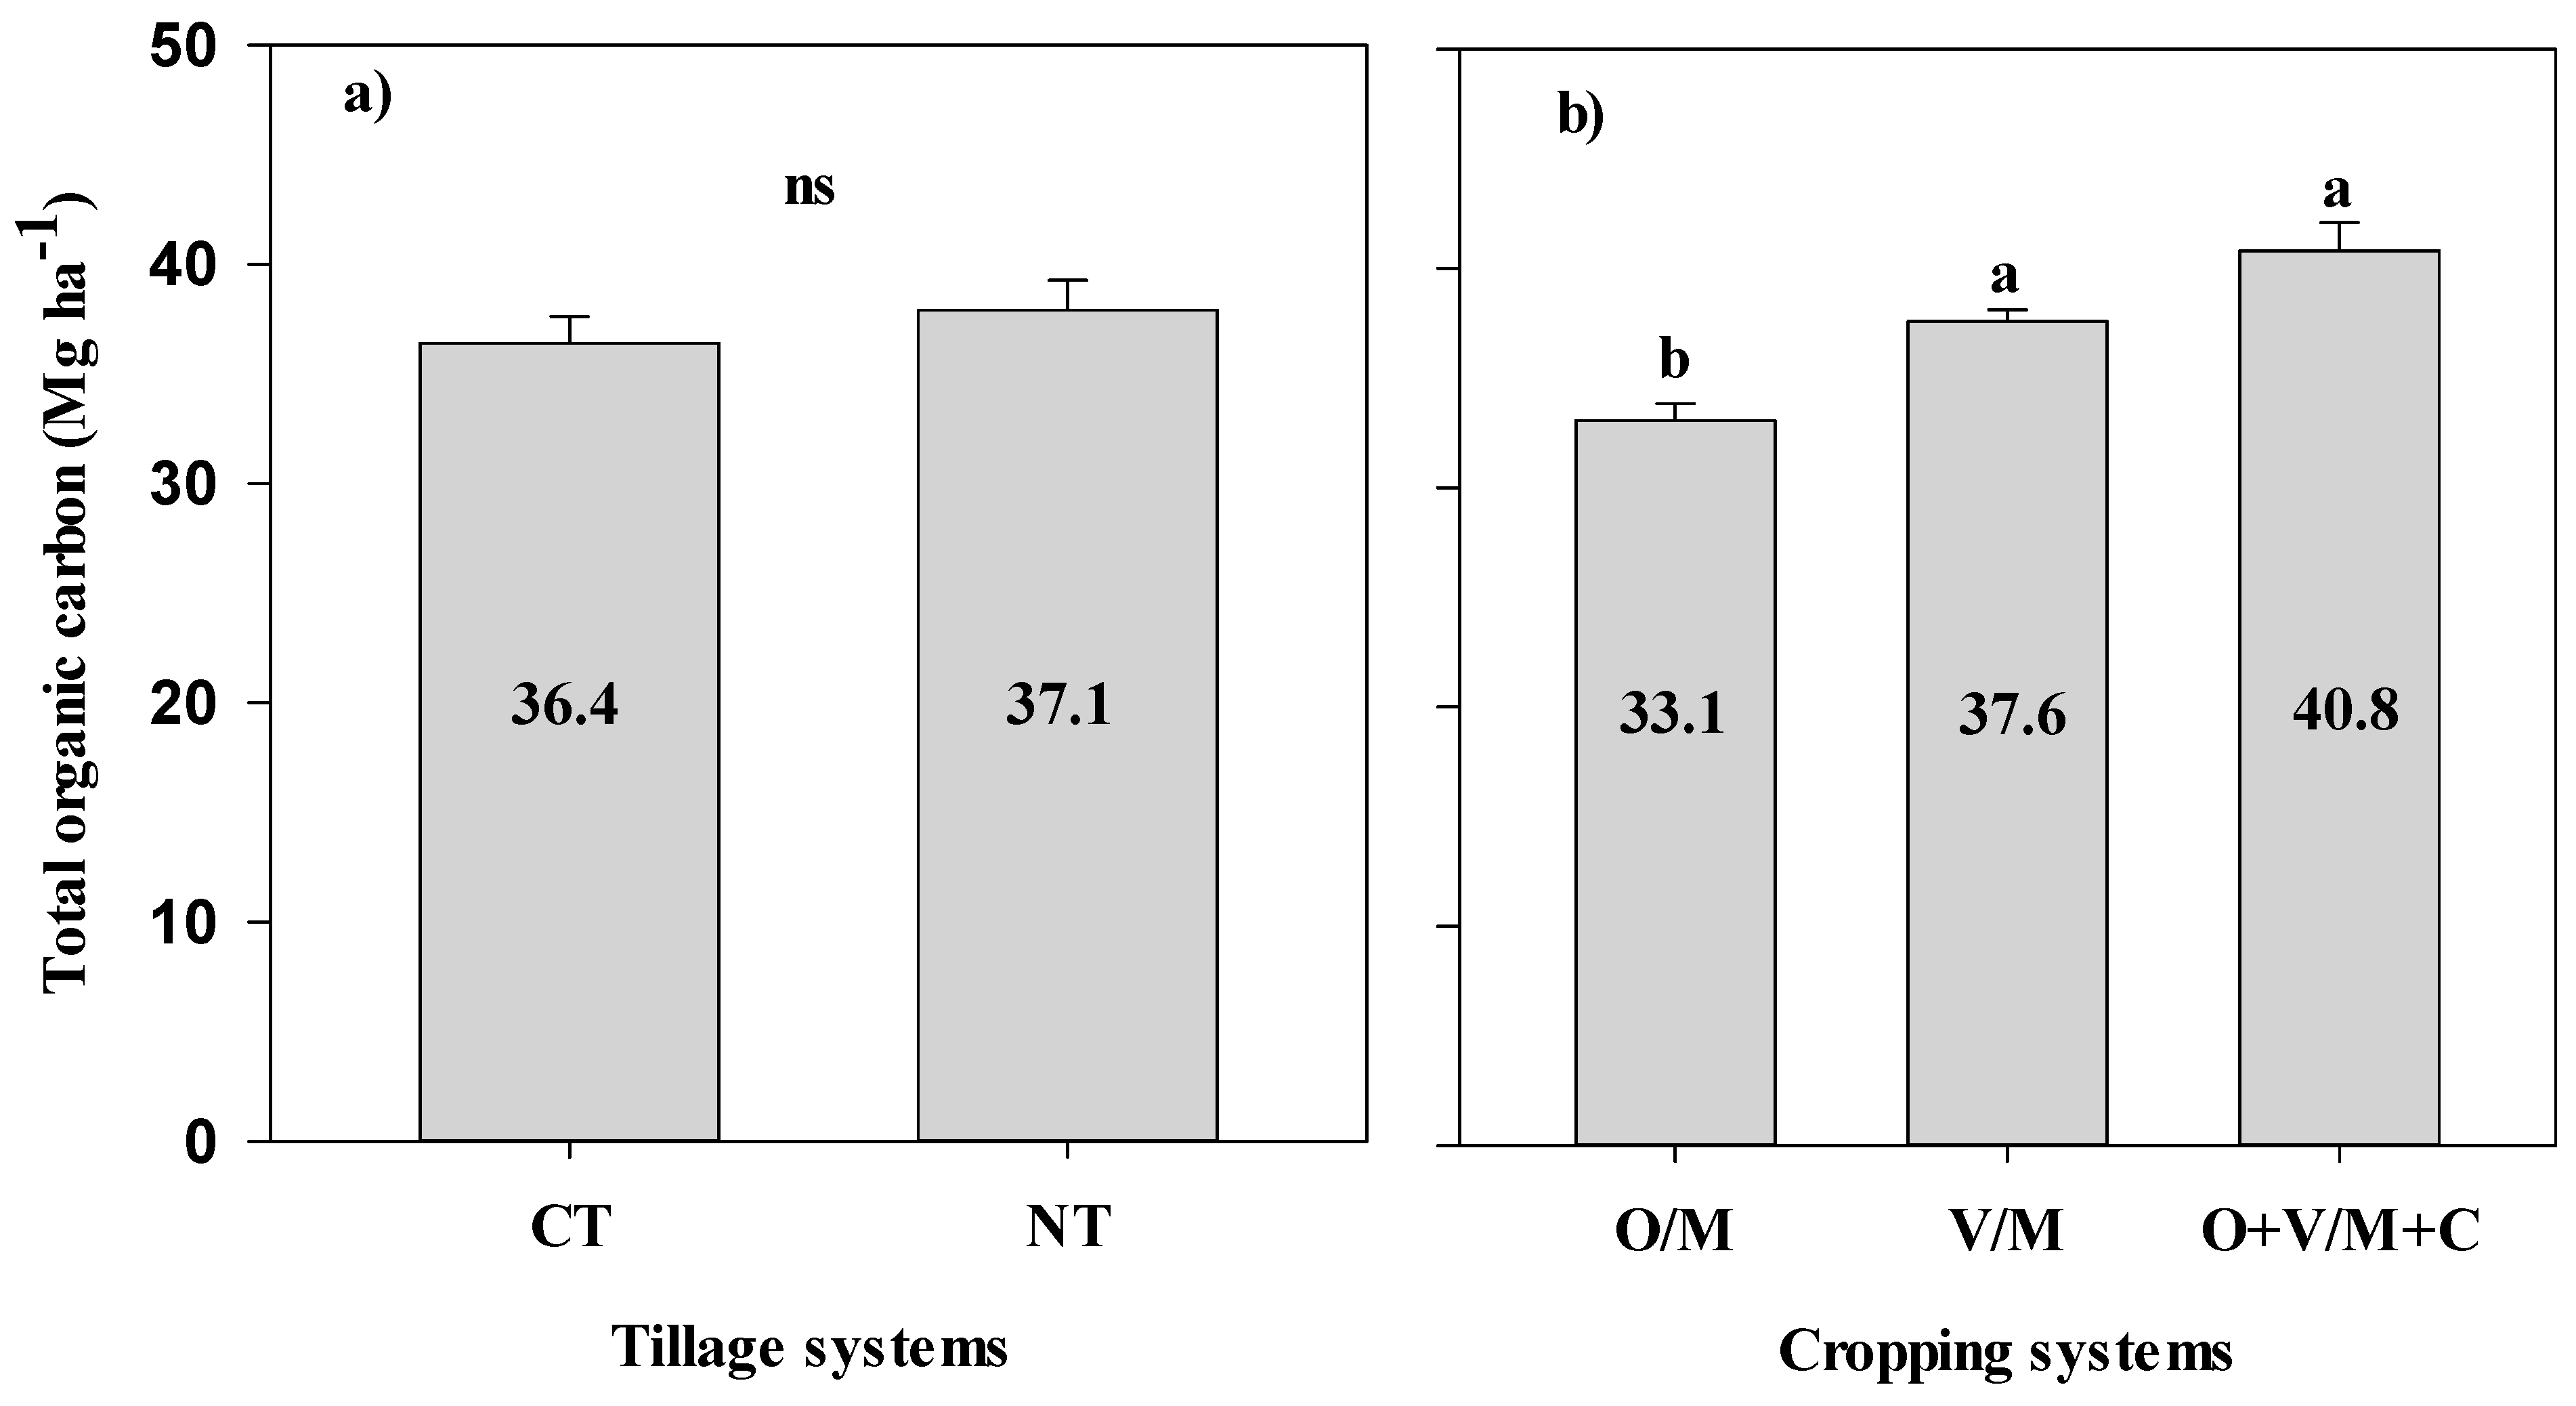
3.2. Concentration, Stock, and Accumulation Rate of Total Organic Carbon in the Soil

Overall, the TOC concentration was 58% higher in the surface layer of NT compared to CT, but 21% lower in the 10–20 cm layer (Figure 4b,c). This compensation between the surface and subsurface layers in CT and NT resulted in no difference in the TOC stock in the 0–20 cm layer (Figure 5), regardless of the cropping system (Figure 5a). Nevertheless, the soil accumulation rates under NT reached 0.07 Mg C ha-1 year-1 (Figure 6).
Unlike the tillage systems, the cropping systems influenced the concentration (Figure 4d,e) and stock of TOC (Figure 5b) up to a depth of 20 cm. Despite the less significant effect on CT, the TOC concentration was 39% higher under the O+V/M+C system compared to O/M in the surface layer of NT (Figure 4d,e). Consequently, the cropping system containing two legumes increased the TOC stock by 18% compared to the system without legumes (Figure 5b). Higher TOC stocks consequently resulted in higher accumulation rates under O+V/M+C, especially in NT, with 0.32 Mg ha−1 year−1 more than in the CT O/M system (Figure 6).

3.3. Soil Carbon Stock in the Granulometric Fractions of Soil Organic Matter

The POM fraction accounted for between 3 and 24% of the total soil C stock, with greater contributions in the surface compared to subsurface layers (Table 1). In the surface soil layer, the POM was, on average, 2.7 times greater in NT than CT. In NT, a pattern of POM accumulation in the 0–5 cm soil layer in all cropping systems was observed. On the other hand, a tendency for POM redistribution over the layers was verified in CT. A greater POM stock was observed under cropping systems with (0.78 Mg ha−1) than without (1.34 Mg ha−1) legumes, both in NT and CT (Table 1). In the surface layer of NT under O+V/M+C, the POM was 5.3 times greater than in CT under O/M. In the subsurface layers, the tillage methods and cropping systems did not significantly influence the POM stocks.
The MAOM stock represented between 76 and 97% of the TOC stock. In the surface soil layer, the MAOM stock was 38% greater in NT than CT (Table 1). However, in the 10–20 cm soil layer, a greater MAOM stock in CT compared to NT under V/M and O+V/M+C was observed (Table 1). In the 10–20 cm soil layer under CT, an effect of the cropping system was verified: a greater MAOM stock was observed under O+V/M+C (15 and 23%, respectively) compared to the O/M and V/M systems. In NT, a difference was observed in the 5–10 cm soil layer, where O/M had approximately 11 and 25% lower MAOM stocks than V/M and O+V/M+C, respectively.

3.4. Carbon Management Index

L ranged from 0.0763 to 0.142 and was globally greater in NT and in cropping systems with legume cover crops compared to CT and the cropping system without legume cover crops, respectively (Table 2). The CLI obtained in NT under V/M and O+V/M+C was almost twice the reference value (CT O/M). The CSI was, on average, 17 and 27% greater under V/M and O+V/M+C compared to O/M, respectively. The CMI was 52% greater, on average, in NT compared to CT (21% greater under O/M and 139% under cropping systems with legume cover crops) (Table 2).

4. Discussion

The adoption of NT along with high-C-input cropping systems with the insertion of legumes in winter and summer (OV/MC) in a degraded subtropical Acrisol resulted in an increase in TOC stocks, with differences of up to 9.6 Mg C ha−1 in the 0–20 cm layer compared to the system without legume cover crops (O/M) in CT. Legume cover crops were the predominant factor in increasing the content of TOC, with an important contribution of POM to the TOC in the surface soil layer (Figure 2, Figure 4, and Figure 6; Table 1 and Table 2).
The insertion of autumn and spring legume cover crops contributes to an increase in the contribution of N to the system, an increase in the production of subsequent crops, and, consequently, the contribution of C inputs [35,39]. When averaged over the whole experimental period, vetch and vetch + cowpea legume residues added 82 and 115 kg N ha−1 y−1, respectively, due to biological fixation [40], which improved the grain yield [41,42]. In addition, incorporating legumes into cropping systems can systematically reduce the reliance on mineral nitrogen fertilizers, providing both environmental and socioeconomic benefits [43].
The increase in POM stocks for the cropping systems containing legume cover crops is likely related mainly to the greater C input by these systems [17]. In addition, winter legumes have high lignin content in their plant tissues, which may also contribute to the POM increase [44]. A study carried out in the same experimental area with vetch and oat residues enriched with 13C-CO2 found that the POM stock was 65% greater under vetch than oat crops [45].
Including legume cover crops in the cropping systems, especially when associated with NT, also contributed to an increase in the ASI. The increase in the ASI in NT soil under cropping systems with legume cover crops (Table 2) can be explained by a reduction in aggregate turnover and a reduction in soil–residue interactions, which are benefits of NT [46,47,48]. These results are supported by studies that found that the absence of physical soil disturbances under NT favoring the physical protection of POM in water-stable aggregates [49]. POM acts as a macroaggregate-forming agent by providing soluble organic compounds that stimulate soil microbiota, leading to the production of polysaccharides that act as aggregate-binding agents [50]. The increase in POM in the surface soil layer due to the association between NT and legumes favored the accumulation of fungal components, which is associated with greater soil macroaggregation [49,51]. In turn, fungal hyphae increase aggregates’ resistance to mechanical breakdown and slaking [52]. A synergy between these attributes was observed, as the higher ASI likely contributed to the increase in POM by promoting the formation of stable aggregates, which physically shield POM from microbial activity and enzymatic degradation.
The CMI was sensitive to the improvement in soil quality in the cropping system O+V/M+C in NT. POM is a short-term reservoir of nutrients and energy that is more accessible to microorganisms and plants. It is fundamental in nutrient cycling and can respond quickly to changes in soil and crop management [53]. Our study shows that, in systems with legume cover crop insertion, there can be an increase in POM (labile SOM) without reducing the TOC stocks, which is an excellent benefit for the soil–plant–atmosphere system (Table 1 and Figure 6).
Therefore, POM accumulation proved to be a key factor in improving soil aggregation and, consequently, the soil quality, as indicated by the carbon indices. The higher CMI values in NT under O+V/M+V indicate that this cropping system has the greatest potential to improve soil health (Table 2). Regarding the indices that make up the CMI, the CSI was more sensitive to management in the short to medium term. This is in line with [13], which identified the greater sensitivity of the CSI to changes in soil management.
MOAM is an important fraction of the TOC stock, since it represents more than 60% of the TOC. However, this fraction is less sensitive to soil management, as differences were only observed between NT and CT in the subsurface soil layers (Table 1; Figure 6), where the MAOM was reduced in NT compared to CT. The higher MAOM stock in the subsurface layer under CT is attributed to the incorporation of residues into the soil, which promotes a more even carbon distribution throughout the profile, in contrast to NT, where the enrichment is more stratified. This explains the similar TOC stocks between NT and CT (Table 1; Figure 4 and Figure 6).
Our results show that the aggregate stability, POM accumulation, and soil quality verified by the CMI are interlinked. In fact, soil is a living system, where its components interact with each other and with other elements in a non-linear way [54]. Moreover, due to the phenomenon of resonance, small changes are felt throughout the system, and their magnitude depends on the system’s energy flow [55]. Therefore, any change in soil and crop management results in a series of changes in the soil system.
Our results demonstrate the benefits of no till and high (more than 8 Mg C ha−1 year−1) and diverse (grasses and legumes) residue inputs in improving the quality of the production system. This greater energy flow resulted in the increased stabilization of aggregates and the accumulation of TOC and POM in a subtropical Acrisol. We also found that these processes occurred synergistically; the attributes are connected and govern the properties of the system. This demonstrates the ability of conservation management systems to recover the quality of the agro-ecosystem from degraded soil, contributing to the sustainability of agricultural production under highly weathered soils.

5. Conclusions

Our findings demonstrate that ecologically intensified cropping systems based on legume cover crops play a key role in enhancing soil organic carbon, particularly through the accumulation of particulate organic matter (POM) in the surface layer of the subtropical Acrisol studied. This management-sensitive SOM fraction contributes significantly to the formation of macroaggregates, where it is concurrently protected from decomposition—highlighting the strong interaction between soil aggregation and SOM dynamics.
The carbon management index (CMI) confirmed the positive effect of conservation management systems, showing that no-till systems combined with ecologically intensified cropping systems based on legumes improve the soil quality and support long-term soil health. These practices promote the accumulation of more stable and functionally beneficial forms of organic matter.
Altogether, the integration of conservation tillage and ecologically intensified cropping systems emerges as a promising strategy to increase soil C stocks and enhance aggregation, contributing to climate-smart agriculture in subtropical environments. Further research under diverse soil types and climatic conditions will be essential to validate and scale these results, supporting more robust and sustainable land management practices.

Author Contributions

Conceptualization, F.F.A. and C.B.; Methodology, F.F.A.; Formal analysis, F.F.A.; Data curation, M.V. and J.P.d.S.; Writing—original draft, M.V.; Writing—review & editing, F.F.A., J.P.d.S. and C.B.; Supervision, C.B.; Project administration, F.F.A.; Funding acquisition, C.B. All authors have read and agreed to the published version of the manuscript.

Funding

This research received the financial support of the National Institute of Science and Technology in Low Carbon Emission Agriculture (INCT-ABC) sponsored by Brazil’s National Council for Scientific and Technological Development (CNPq, grant no. 406635/2022-6), the Foundation for Research Support of the State of Rio Grande do Sul (Fapergs, grant no. 22/2551-0000392-3), Bayer Crop Science S.A. through the ProCarbon Project, and the Ministry of Agriculture (MAPA) through providing research and extension fellowships.

Institutional Review Board Statement

Not applicable.

Informed Consent Statement

Not applicable.

Data Availability Statement

Data are contained within the article.

Acknowledgments

The authors express their gratitude to the field staff at the Agronomic Experimental Station of UFRGS for their dedicated efforts in conducting the long-term experiment.

Conflicts of Interest

The authors declare no conflict of interest.

References

  1. Oldfield, E.E.; Bradford, M.A.; Wood, S.A. Global Meta-Analysis of the Relationship between Soil Organic Matter and Crop Yields. Soil 2019, 5, 15–32. [Google Scholar] [CrossRef]
  2. Mahmood, S.; Nunes, M.R.; Kane, D.A.; Lin, Y. Soil Health Explains the Yield-Stabilizing Effects of Soil Organic Matter under Drought. Soil Environ. Health 2023, 1, 100048. [Google Scholar] [CrossRef]
  3. Paustian, K.; Larson, E.; Kent, J.; Marx, E.; Swan, A. Soil C Sequestration as a Biological Negative Emission Strategy. Front. Clim. 2019, 1, 482133. [Google Scholar] [CrossRef]
  4. Bieluczyk, W.; Asselta, F.O.; Navroski, D.; Gontijo, J.B.; Venturini, A.M.; Mendes, L.W.; Simon, C.P.; de Camargo, P.B.; Tadini, A.M.; Martin-Neto, L.; et al. Linking above and Belowground Carbon Sequestration, Soil Organic Matter Properties, and Soil Health in Brazilian Atlantic Forest Restoration. J. Environ. Manag. 2023, 344, 118573. [Google Scholar] [CrossRef] [PubMed]
  5. Ferreira, C.d.S.; Tavares, R.L.M.; Filho, S.V.d.P.; Cantão, V.C.G.; Simon, G.A.; Alves, J.M.; Nascimento, H.L.B.D.; Bilego, U.O. Stock of Carbon and Soil Organic Fractions in No-Tillage and Crop–Livestock Integration Systems. Sustainability 2024, 16, 3025. [Google Scholar] [CrossRef]
  6. Haruna, S.I.; Nkongolo, N.V. Tillage, cover crop and crop rotation effects on selected soil chemical properties. Sustainability 2019, 11, 2770. [Google Scholar] [CrossRef]
  7. Freitas, V.S.; Babos, D.V.; Guedes, W.N.; Silva, F.P.; Tozo, M.L.d.L.; Andrade, C.A.; Villas-Boas, P.R.; Milori, D.M.B.P.; Martin-Neto, L. Soil Organic Matter Dynamics and Soil Carbon Stocks from Tropical and Sub-Tropical Areas under No-till: An on-Farm Research. Catena 2024, 247, 108491. [Google Scholar] [CrossRef]
  8. Veloso, M.G.; Cecagno, D.; Bayer, C. Legume Cover Crops under No-Tillage Favor Organomineral Association in Microaggregates and Soil C Accumulation. Soil Tillage Res. 2019, 190, 139–146. [Google Scholar] [CrossRef]
  9. Hewelke, E.; Mielnik, L.; Weber, J.; Perzanowska, A.; Jamroz, E.; Gozdowski, D.; Szacki, P. Chemical and Physical Aspects of Soil Health Resulting from Long-Term No-Till Management. Sustainability 2024, 16, 9682. [Google Scholar] [CrossRef]
  10. Six, J.; Schultz, P.A.; Jastrow, J.D.; Merckx, R. Recycling of Sodium Polytungstate Used in Soil Organic Matter Studies. Soil Biol. Biochem. 1999, 31, 1193–1196. [Google Scholar] [CrossRef]
  11. Balesdent, J.; Balabane, M. Maize Root-Derived Soil Organic Carbon Estimated by Natural 15c Abundance. Soil Biol. Biochem. 1992, 24, 97–101. [Google Scholar] [CrossRef]
  12. Conceição, P.C.; Dieckow, J.; Bayer, C. Combined Role of No-Tillage and Cropping Systems in Soil Carbon Stocks and Stabilization. Soil Tillage Res. 2013, 129, 40–47. [Google Scholar] [CrossRef]
  13. Dieckow, J.; Mielniczuk, J.; Knicker, H.; Bayer, C.; Dick, D.P.; Kögel-Knabner, I. Composition of Organic Matter in a Subtropical Acrisol as Influenced by Land Use, Cropping and N Fertilization, Assessed by CPMAS 13C NMR Spectroscopy. Eur. J. Soil Sci. 2005, 56, 705–715. [Google Scholar] [CrossRef]
  14. Ardenti, F.; Capra, F.; Lommi, M.; Fiorini, A.; Tabaglio, V. Long-Term C and N Sequestration under No-till Is Governed by Biomass Production of Cover Crops Rather than Differences in Grass vs. Legume Biomass Quality. Soil Tillage Res. 2023, 228, 105630. [Google Scholar] [CrossRef]
  15. Sá, J.C.d.M.; Séguy, L.; Tivet, F.; Lal, R.; Bouzinac, S.; Borszowskei, P.R.; Briedis, C.; dos Santos, J.B.; Hartman, D.d.C.; Bertoloni, C.G.; et al. Carbon Depletion by Plowing and its Restoration by No-Till Cropping Systems in Oxisols of Subtropical and Tropical Agro-Ecoregions in Brazil. Land Degrad. Dev. 2013, 26, 531–543. [Google Scholar] [CrossRef]
  16. Six, J.; Conant, R.T.; Paul, E.A.; Paustian, K. Stabilization Mechanisms of Soil Organic Matter: Implications for C-Saturatin of Soils. Plant Soil 2002, 241, 155–176. [Google Scholar] [CrossRef]
  17. Winck, B.R.; Vezzani, F.M.; Dieckow, J.; Favaretto, N.; Molin, R. Carbono e Nitrogênio Nas Frações Granulométricas Da Matéria Orgânica Do Solo, Em Sistemas de Culturas Sob Plantio Direto. Rev. Bras. Cienc. Solo 2014, 38, 980–989. [Google Scholar] [CrossRef]
  18. Cotrufo, M.F.; Wallenstein, M.D.; Boot, C.M.; Denef, K.; Paul, E. The Microbial Efficiency-Matrix Stabilization (MEMS) Framework Integrates Plant Litter Decomposition with Soil Organic Matter Stabilization: Do Labile Plant Inputs Form Stable Soil Organic Matter? Glob. Change Biol. 2013, 19, 988–995. [Google Scholar] [CrossRef]
  19. Francesca Cotrufo, M.; Lavallee, J.M.; Zhang, Y.; Hansen, P.M.; Paustian, K.H.; Schipanski, M.; Wallenstein, M.D. In-N-Out: A Hierarchical Framework to Understand and Predict Soil Carbon Storage and Nitrogen Recycling. Glob. Change Biol. 2021, 27, 4465–4468. [Google Scholar] [CrossRef]
  20. Briedis, C.; Baldock, J.; de Moraes Sá, J.C.; dos Santos, J.B.; McGowan, J.; Milori, D.M.B.P. Organic Carbon Pools and Organic Matter Chemical Composition in Response to Different Land Uses in Southern Brazil. Eur. J. Soil Sci. 2020, 72, 1083–1100. [Google Scholar] [CrossRef]
  21. Creamer, C.A.; Foster, A.L.; Lawrence, C.; McFarland, J.; Schulz, M.; Waldrop, M.P. Mineralogy Dictates the Initial Mechanism of Microbial Necromass Association. Geochim. Cosmochim. Acta 2019, 260, 161–176. [Google Scholar] [CrossRef]
  22. Liang, C.; Schimel, J.P.; Jastrow, J.D. The Importance of Anabolism in Microbial Control over Soil Carbon Storage. Nat. Microbiol. 2017, 2, 17105. [Google Scholar] [CrossRef] [PubMed]
  23. Peixoto, L.; Elsgaard, L.; Rasmussen, J.; Kuzyakov, Y.; Banfield, C.C.; Dippold, M.A.; Olesen, J.E. Decreased Rhizodeposition, but Increased Microbial Carbon Stabilization with Soil Depth down to 3.6 M. Soil Biol. Biochem. 2020, 150, 108008. [Google Scholar] [CrossRef]
  24. Tisdall, J.M.; Oades, J.M. Organic Matter and Water Stable Aggregates in Soil. Soil Sci. 1982, 33, 141–163. [Google Scholar] [CrossRef]
  25. Zhu, X.; Xie, H.; Masters, M.D.; Luo, Y.; Zhang, X.; Liang, C. Microbial Trade-off in Soil Organic Carbon Storage in a No-till Continuous Corn Agroecosystem. Eur. J. Soil Biol. 2020, 96, 103146. [Google Scholar] [CrossRef]
  26. Sohi, S.P.; Mahieu, N.; Arah, J.R.M.; Powlson, D.S.; Madari, B.; Gaunt, J.L. A Procedure for Isolating Soil Organic Matter Fractions Suitable for Modeling. Soil Sci. Soc. Am. J. 2001, 65, 1121–1128. [Google Scholar] [CrossRef]
  27. Cambardella, C.A.; Elliott, E.T. Particulate Soil Organic-Matter Changes across a Grassland Cultivation Sequence. Soil Sci. Soc. Am. J. 1992, 56, 777–783. [Google Scholar] [CrossRef]
  28. Cotrufo, M.F.; Lavallee, J.M. Soil Organic Matter Formation, Persistence, and Functioning: A Synthesis of Current Understanding to Inform Its Conservation and Regeneration. In Advances in Agronomy; Academic Press Inc.: Cambridge, MA, USA, 2022; Volume 172, pp. 1–66. ISBN 9780323989534. [Google Scholar]
  29. Samson, M.E.; Chantigny, M.H.; Vanasse, A.; Menasseri-Aubry, S.; Royer, I.; Angers, D.A. Management Practices Differently Affect Particulate and Mineral-Associated Organic Matter and Their Precursors in Arable Soils. Soil Biol. Biochem. 2020, 148, 107867. [Google Scholar] [CrossRef]
  30. Lehmann, J.; Kleber, M. The Contentious Nature of Soil Organic Matter. Nature 2015, 528, 60–68. [Google Scholar] [CrossRef]
  31. Dungait, J.A.J.; Hopkins, D.W.; Gregory, A.S.; Whitmore, A.P. Soil Organic Matter Turnover Is Governed by Accessibility Not Recalcitrance. Glob. Change Biol. 2012, 18, 1781–1796. [Google Scholar] [CrossRef]
  32. Blair, G.J.; Lefroy, R.D.; Lisle, L. Soil Carbon Fractions Based on Their Degree of Oxidation, and the Development of a Carbon Management Index for Agricultural Systems. Aust. J. Agric. Res. 1995, 46, 1459–1466. [Google Scholar] [CrossRef]
  33. Friedrich, T.; Derpsch, R.; Kassam, A. Sustainable Development of Organic Agriculture; Taylor & Francis: London, UK, 2012; pp. 1–7. [Google Scholar] [CrossRef]
  34. FAO. World Reference Base for Soil Resources; FAO: Rome, Italy, 2002. [Google Scholar]
  35. Veloso, M.G.; Angers, D.A.; Tiecher, T.; Giacomini, S.; Dieckow, J.; Bayer, C. High Carbon Storage in a Previously Degraded Subtropical Soil under No-Tillage with Legume Cover Crops. Agric. Ecosyst. Environ. 2018, 268, 15–23. [Google Scholar] [CrossRef]
  36. Zanatta, J.; Bayer, C.; Dieckow, J.; Vieira, F.; Mielniczuk, J. Soil Organic Carbon Accumulation and Carbon Costs Related to Tillage, Cropping Systems and Nitrogen Fertilization in a Subtropical Acrisol. Soil Tillage Res. 2007, 94, 510–519. [Google Scholar] [CrossRef]
  37. Carpenedo, V.; Mielniczuk, J. Estado de Agregação e Qualidade de Agregados de Latossolos Roxos, Submetidos a Diferentes Sistemas de Manejo. Rev. Bras. Cienc. Solo 1990, 14, 99–105. [Google Scholar]
  38. Ellert, B.H.; Bettany, J.R. Calculation of Organic Matter and Nutrients Stored in Soils under Contrasting Management Regimes. Can. J. Soil Sci 1995, 75, 529–538. [Google Scholar] [CrossRef]
  39. Quintarelli, V.; Radicetti, E.; Allevato, E.; Stazi, S.R.; Haider, G.; Abideen, Z.; Bibi, S.; Jamal, A.; Mancinelli, R. Cover Crops for Sustainable Cropping Systems: A Review. Agriculture 2022, 12, 2076. [Google Scholar] [CrossRef]
  40. Adetunji, A.T.; Ncube, B.; Mulidzi, R.; Lewu, F.B. Management Impact and Benefit of Cover Crops on Soil Quality: A Review. Soil Tillage Res. 2020, 204, 104717. [Google Scholar] [CrossRef]
  41. Lovato, T.; Mielniczuk, J.; Bayer, C.; Vezzani, F. Adição de Carbono e Nitrogênio e Sua Relação Com Os Estoques No Solo e Com o Rendimento Do Milho Em Sistemas de Manejo. Rev. Bras. Cienc. Solo 2004, 28, 175–187. [Google Scholar] [CrossRef]
  42. Amado, T.J.C.; Bayer, C.; Conceição, P.C.; Spagnollo, E.; de Campos, B.-H.C.; da Veiga, M. Potential of Carbon Accumulation in No-Till Soils with Intensive Use and Cover Crops in Southern Brazil. J. Environ. Qual. 2006, 35, 1599. [Google Scholar] [CrossRef]
  43. Stagnari, F.; Maggio, A.; Galieni, A.; Pisante, M. Multiple Benefits of Legumes for Agriculture Sustainability: An Overview. Chem. Biol. Technol. Agric. 2017, 4, 2. [Google Scholar] [CrossRef]
  44. Redin, M.; Guénon, R.; Recous, S.; Schmatz, R.; de Freitas, L.L.; Aita, C.; Giacomini, S.J. Carbon Mineralization in Soil of Roots from Twenty Crop Species, as Affected by Their Chemical Composition and Botanical Family. Plant Soil 2014, 378, 205–214. [Google Scholar] [CrossRef]
  45. Rodrigues, L.A.T.; Giacomini, S.J.; Dieckow, J.; Cherubin, M.R.; Sangiovo Ottonelli, A.; Bayer, C. Carbon Saturation Deficit and Litter Quality Drive the Stabilization of Litter-Derived C in Mineral-Associated Organic Matter in Long-Term No-till Soil. Catena 2022, 219, 106590. [Google Scholar] [CrossRef]
  46. Li, Y.; Guo, L.; Wu, M.; Li, C. Effects of Long-Term Conservation Tillage on Soil Aggregate Carbon Fractions and Microbial Characteristics under Rice-Oilseed Rape Rotation Systems. Appl. Soil Ecol. 2025, 206, 105848. [Google Scholar] [CrossRef]
  47. Liu, X.; Song, X.; Li, S.; Liang, G.; Wu, X. Understanding How Conservation Tillage Promotes Soil Carbon Accumulation: Insights into Extracellular Enzyme Activities and Carbon Flows between Aggregate Fractions. Sci. Total Environ. 2023, 897, 165408. [Google Scholar] [CrossRef]
  48. Li, P.; Ying, D.; Li, J.; Deng, J.; Li, C.; Tian, S.; Zhao, G.; Wu, C.; Jiao, J.; Jiang, M.; et al. Global-Scale No-Tillage Impacts on Soil Aggregates and Associated Carbon and Nitrogen Concentrations in Croplands: A Meta-Analysis. Sci. Total Environ. 2023, 881, 163570. [Google Scholar] [CrossRef] [PubMed]
  49. Veloso, M.G.; Angers, D.A.; Chantigny, M.H.; Bayer, C. Carbon Accumulation and Aggregation Are Mediated by Fungi in a Subtropical Soil under Conservation Agriculture. Geoderma 2020, 363, 114159. [Google Scholar] [CrossRef]
  50. Beare, M.; Coleman, D.; Hendrix, P.F.; Odum, E.P. A Hierarchical Approach to Evaluating the Significance of Soil Biodiversity to Biogeochemical Cycling. Plant Soil 1995, 170, 5–22. [Google Scholar] [CrossRef]
  51. Yu, S.; Wang, T.; Meng, Y.; Yao, S.; Wang, L.; Zheng, H.; Zhou, Y.; Song, Z.; Zhang, B. Leguminous Cover Crops and Soya Increased Soil Fungal Diversity and Suppressed Pathotrophs Caused by Continuous Cereal Cropping. Front. Microbiol. 2022, 13, 993214. [Google Scholar] [CrossRef]
  52. Abiven, S.; Menasseri, S.; Chenu, C. The Effects of Organic Inputs over Time on Soil Aggregate Stability—A Literature Analysis. Soil Biol. Biochem. 2009, 41, 1–12. [Google Scholar] [CrossRef]
  53. Connell, R.K.; James, T.Y.; Blesh, J. A Legume-Grass Cover Crop Builds Mineral-Associated Organic Matter across Variable Agricultural Soils. Soil Biol. Biochem. 2025, 203, 109726. [Google Scholar] [CrossRef]
  54. Vezzani, F.M.; Mielniczuk, J. Agregação e Estoque de Carbono Em Argissolo Submetido a Diferentes Práticas de Manejo Agrícola. Rev. Bras. Ciência do Solo 2011, 35, 213–223. [Google Scholar] [CrossRef]
  55. Prigogine, I. As Leis Do Caos; Universidade: São Paulo, Brazil, 2002. [Google Scholar]
Figure 1. Distribution of the different diameter ranges of water-stable soil aggregates, in the 0–20 cm layer, in the two tillage systems (the average of the three cropping systems) (a) and in the three cropping systems (the average of the two tillage methods) (b), implemented on Acrisol for 30 years. Averages followed by different letters indicate a significant difference by Tukey’s test at the 5% significance level (ns = non-significant effect); error bars represent standard errors (n = 3). CT = conventional tillage, NT = no till, O = oats, V = vetch, M = maize, and C = cowpea.
Sustainability 17 03378 g001
Figure 2. Wet weight mean diameter (WWMD) (a) and dry weight mean diameter (DWMD) (b) of soil aggregates in three soil layers of a sandy clay loam Acrisol subjected to two tillage systems (a) and to three cropping systems. Lowercase letters compare cropping systems within each tillage method; uppercase letters compare tillage methods within each cropping system; and averages with the same letter do not differ statistically by Tukey’s test at the 5% significance level. Error bars represent standard errors (n = 3). CT = conventional tillage, NT = no till, O = oats, V = vetch, M = maize, and C = cowpea.
Sustainability 17 03378 g002
Figure 3. Aggregate stability index (ASI) in three soil layers of a sandy clay loam Acrisol subjected to two tillage systems and to three cropping systems. Lowercase letters compare cropping systems within each tillage method; uppercase letters compare tillage methods within each cropping system; and averages with the same letter do not differ statistically by Tukey’s test at the 5% significance level. Error bars represent standard errors (n = 3). CT = conventional tillage, NT = no till, O = oats, V = vetch, M = maize, and C = cowpea.
Sustainability 17 03378 g003
Figure 4. Concentration of total organic carbon (TOC) in the 0–20 cm layer of a sandy clay loam Acrisol subjected to two tillage systems (ac) and to three cropping systems (d,e). The comparisons between tillage systems are presented as the average of three cropping systems, and the comparisons between cropping systems are presented as the average of two tillage systems. CT = conventional tillage, NT = no till, O = oats, V = vetch, M = maize, C = cowpea. Horizontal bar indicates the minimum significant difference (MSD) by Tukey’s test at the 5% significance level (Tillage = tillage system, Crop = cropping system, and Layer = soil layer).
Sustainability 17 03378 g004
Figure 5. Total organic carbon (TOC) stock in the 0–20 cm layer of a sandy clay loam Acrisol subjected to two tillage systems (a) and to three cropping systems (b). The comparisons between tillage systems are presented as the average of three cropping systems, and the comparisons between cropping systems are presented as the average of two tillage systems. CT = conventional tillage, NT = no till, O = oats, V = vetch, M = maize, and C = cowpea. Averages followed by different letters indicate a significant difference using Tukey’s test at a 5% significance level (ns = non-significant effect); error bars represent standard errors (n = 3).
Sustainability 17 03378 g005
Figure 6. Annual rates of accumulation of total organic carbon (TOC) in the 0–20 cm layer of a sandy clay loam Acrisol subjected to two tillage systems and to three cropping systems. CT O/M system was taken as a reference. CT = conventional tillage, NT = no till, O = oats, V = vetch, M = maize, and C = cowpea. Averages followed by different letters indicate a significant difference using the Tukey test at a 5% significance level; error bars represent standard errors (n = 3).
Sustainability 17 03378 g006
Table 1. Stocks of particulate organic matter (POM) and mineral-associated organic matter (MAOM) in three soil layers and in different tillage methods (CT = conventional tillage, NT = no till) and crop systems (O = oats, V = vetch, M = maize, and C = cowpea), implemented on Acrisol for 30 years.
Cropping SystemSoil Layer (cm)Tillage Method
CTNTCTNT
POM (Mg ha−1)MAOM (Mg ha−1)
O/M0–50.68 ± 0.11 Bba1.53 ± 0.08 Aba7.16 ± 0.75 Bab9.60 ± 0.39 Aab
5–100.51 ± 0.18 Aaa0.40 ± 0.05 Aab7.49 ± 2.50 Aab7.05 ± 0.35 Abc
10–201.00 ± 0.07 Aaa0.70 ± 0.16 Aab15.62 ± 0.57 Aba14.48 ± 0.79 Aaa
V/M0–51.02 ± 0.14 Baba3.43 ± 0.56 Aaa8.04 ± 0.60 Bab11.01 ± 0.00 Aab
5–100.91 ± 0.11 Aaa0.89 ± 0.16 Aab9.06 ± 0.07 Aab7.87 ± 0.00 Aac
10–201.30 ± 0.28 Aaa0.40 ± 0.01 Bab16.71 ± 0.64 Aba14.51 ± 0.00 Baa
O+V/M+C0–51.51 ± 0.07 Baa3.60 ± 0.51 Aaa8.43 ± 0.74 Bab11.91 ± 1.53 Aab
5–100.81 ± 0.09 Aab0.75 ± 0.11 Aab8.98 ± 0.22 Aab8.99 ± 0.41 Aac
10–200.80 ± 0.30 Aab0.67 ± 0.16 Aab19.23 ± 0.98 Aaa15.89 ± 0.90 Baa
Lowercase letters compare crop systems within each tillage method and soil layer; uppercase letters compare tillage methods within each crop system and soil layer; lowercase letters in italics compare soil layers within each crop system and tillage method; and means with the same letter do not differ statistically (Tukey test at 5% significance level); error bars represent standard errors (n = 3).
Table 2. Carbon stock index (CSI) carbon lability (L), lability index (CLI), and carbon management index (CMI) of the soil in the 0–20 cm layer in different tillage methods and crop systems (O = oats, V = vetch, M = maize, and C = cowpea), implemented on Acrisol in the Brazilian subtropics for 30 years.
Tillage MethodCropping SystemCSILCLICMI
Conventional tillageO/M 11.00 ± 0.00 Ab0.073 ± 0.00 Aa1.00 ± 0.00 Aa100.0 ± 00.0 Aa
V/M1.15 ± 0.04 Aab0.096 ± 0.02 Ba1.33 ± 0.25 Ba151.8 ± 27.0 Ba
O+V/M+C1.23 ± 0.03 Aa0.086 ± 0.01 Ba1.18 ± 0.17 Ba144.7 ± 21.7 Ba
No tillO/M1.05 ± 0.7 Ab0.085 ± 0.01 Ab1.18 ± 0.14 Ab122.0 ± 7.9 Ab
V/M1.18 ± 0.03 Aab0.142 ± 0.02 Aa1.97 ± 0.30 Aa231.2 ± 31.6 Aa
O+V/M+C1.30 ± 0.09 Aa0.141 ± 0.03 Aa1.96 ± 0.46 Aa246.3 ± 43.1 Aa
1 System taken as reference: conventional A/M tillage. Lowercase letters compare crop systems within each tillage method; uppercase letters compare tillage methods within each crop system; and means with the same letter do not differ statistically by Tukey’s test at the 5% significance level; error bars represent standard errors (n = 3).
Disclaimer/Publisher’s Note: The statements, opinions and data contained in all publications are solely those of the individual author(s) and contributor(s) and not of MDPI and/or the editor(s). MDPI and/or the editor(s) disclaim responsibility for any injury to people or property resulting from any ideas, methods, instructions or products referred to in the content.

