Article

Farmers’ Preferences and Practices Regarding Bio-Based Fertilizers: A Croatian Perspective

1
Faculty of Agriculture, University of Zagreb, Svetošimunska 25, 10000 Zagreb, Croatia
2
IPS Konzalting, Ante Starčevića 66, 44000 Sisak, Croatia
3
Faculty of Bioscience Engineering, Ghent University, Copure Links 653, 9000 Ghent, Belgium
*
Author to whom correspondence should be addressed.
Sustainability 2025, 17(8), 3367; https://doi.org/10.3390/su17083367
Submission received: 17 March 2025 / Revised: 7 April 2025 / Accepted: 8 April 2025 / Published: 9 April 2025

Abstract

:
Sustainable agriculture requires a shift from mineral to bio-based fertilizers (BBFs), but farmer adoption has not been sufficiently studied in Croatia. This study examines Croatian farmers’ preferences, practices and barriers to adopting BBFs using a nationwide survey and regression analysis, filling gaps in research on fertilizer use. The results show that while farmers are satisfied with conventional options, they want more variety and express concerns about nutrient concentration and soil impact. Interest in BBFs is high—particularly for low-cost or high-impact products—but uptake is hindered by financial constraints and limited information. Notably, most farmers are willing to pay more for environmentally friendly fertilizers, despite being price sensitive. By highlighting key drivers and barriers, this study provides actionable insights that could provide strategies for policy makers, farmers and industry representatives to support Croatia’s transition to sustainable fertilizer practices, with implications for similar agricultural regions.

1. Introduction

With rising demand for food and water, driven by the elimination of widespread famine, epidemic outbreaks and recent wars, energy consumption and the use of non-renewable sources have increased. Therefore, the European Commission has initiated the “Circular economy action plan”, which finds solutions to environmental and social problems [1,2]. Agriculture plays a key role in accomplishing sustainability, with one of the main objectives being soil health [3].
Understanding soil health and fertility helps farmers properly dose fertilizers and nutrients. Thus, it reduces resource loss and potentially negative environmental impacts such as water contamination, leaching, volatilization, greenhouse gas emissions and deterioration of the soil [4,5].
In Europe, the total consumption of mineral fertilizers is estimated at 20–25 million tons annually, while organic fertilizers, which are under the influence of sustainability, are estimated to make up 5–10% of the total market (varies greatly from year to year). European agriculture, which includes Croatia, imports large amounts of nutrients through mineral fertilizers [6]. According to the International Fertilizer Association [7], the total global consumption of N, P2O5 and K2O was 109,173,000 tons, 44,093,400 tons and 34,656,700 tons, respectively. Around 13,138,657 tons of N are used in Europe, followed by P2O5 with 3,111,479 tons and K2O with 3,742,126 tons [8]. In Croatia, 88,431 tons of N, 32,415 tons of P2O5 and 40,009 tons of K2O are utilized [9]. Moreover, it has been reported that 30–35% of these nutrients leach or volatilize from mineral fertilizers [5,10]. On the other hand, organic fertilizers, which include a wide range of fertilizers (slurry, animal manure, sewage sludge, household bio-waste, digestate, straw, compost, green manure, food industry waste, meat-and-bone meal, ashes, etc.), are also a source of nutrients for plants [11,12,13]. All of these residual materials can be enhanced through several processing methods. In this way, recycled nutrients from agriculture can be converted into alternative bio-based fertilizers (BBFs) [14]. This applies in particular to areas with intensive livestock farming, where considerable quantities of animal manure are disposed of [6].
The main question worldwide is how to convince farmers to replace mineral fertilizers with BBFs. Firstly, farmers should know their environmental benefits as they are derived from renewable resources, making them a more sustainable replacement for conventional mineral fertilizers, which is today’s goal. Secondly, by enhancing soil health, they contribute to the long-term fertility of agricultural lands while also reducing environmental pollution. As mentioned, they align with the principles of the “Circular Economy” by utilizing organic waste materials and promoting resource efficiency, whereby they minimize waste and contribute to sustainable agricultural practices [2,3,7,15,16].
The term “BBF” refers to fertilizer products or resources made from waste or derived from renewable biomass-related sources (e.g., digestate) and used either directly or for the production of tailor-made fertilizers (TMFs). TMFs are specifically designed with a composition determined by the end user, using BBFs and mineral fertilizers as primary resources to meet crop requirements, soil fertility status and/or fertilizer management plans. BBF has gained increasing prominence in academic research, where it is used to describe a broad category of bio-derived materials designed to provide essential nutrients to crops [1,6,11,17,18].
Farmers’ preferences for BBFs depend on whether the nutrients and organic ingredients meet the needs of the plants, whether the price of the fertilizers is competitive compared to mineral fertilizers and whether they are easy to apply [17,18]. Furthermore, the lower price of animal manure should encourage farmers to replace mineral fertilizers with animal manure, if not entirely, then at least partially [6,12,19]. From an economic perspective, BBFs are proving profitable for farmers as they increase nutrient use efficiency (NUE), improve profit margins and reduce dependence on mineral fertilizers [20]. Bodake and Gaikwad [21] highlighted several major obstacles, including the lack of agricultural studies, insufficient financial resources, inadequate supply of BBFs in local village centers and limited support from agricultural departments. A study conducted by Malarkodi and Bharathi [22] highlighted that the lack of knowledge of application methods and uncertainty about results are the main factors hindering wider acceptance of BBFs. Moreover, the use of BBFs is becoming increasingly fashionable as an environmentally friendly alternative to conventional mineral fertilizers in agriculture. These are organic, resource-based fertilizers such as animal manure and other biodegradable wastes that have potential environmental benefits and are in line with circular economy themes. In various countries, farmers prefer concentrated BBFs with a guaranteed N content and a lower price compared to mineral fertilizers. Characteristics such as organic carbon content and nutrient release rate are relevant in some places, but not in all [1,6]. Farmers in Denmark, for example, demand BBFs with comparable properties to mineral fertilizers, including the safety of N content and sanitation, and are willing to pay up to 50% of the cost of mineral fertilizers [1]. BBFs can improve soil fertility and agricultural productivity and reduce the environmental impacts associated with mineral fertilizers. For example, algae-based fertilizers have been found to improve soil fertility and productivity without polluting the environment with inorganic pollutants [23]. Biochar-based N fertilizers have also been shown to improve NUE and reduce greenhouse gas emissions in tropical soils, making them an improved sustainable option [24]. Other work, e.g., on economic calculations, shows that BBFs can be more profitable for farmers than mineral fertilizers, especially when their ecological impact is taken into account [25]. Overcoming challenges is a long-term process, but the first step is always key.
Additionally, farmers’ perspectives and their dependence on manure and other farm-sourced nutrients have shifted with the widespread availability of mineral nutrients. They usually strive for mineral sources due to their well-known composition of nutrients unlike varieties of nutrient content in residual materials such as animal manure [6]. According to Case et al. [26], farmers considered animal manure waste, but after a fact-based evaluation, their perception of manure changed, acknowledging it as a valuable source of nutrients. With physical, chemical and biological processes, the composition of nutrients can be changed from its original state. This means that the characteristics of nutrient content would improve, more accurate amounts of N would be obtained and much easier usage and storage of these products would be achieved [6]. In this way, making new bio-based products from renewable sources could increase sustainability in general and become more acceptable to both farmers and markets [27]. Furthermore, the concept of using BBFs can also serve as a basis for the implementation of integrated farming systems. This does not only concern the future replacement of mineral fertilizers but also the creation of a circular system in arable farming at the regional level that can be adapted to different pedoclimatic conditions. By integrating animal husbandry, crop production and industrial waste management, this approach can optimize energy resources and improve sustainability [13].
The use of fertilizers in the European Union is strictly regulated by a variety of policies to ensure environmental protection, sustainable agriculture and food security. These policies aim to promote the use of BBFs as part of broader environmental and sustainability objectives. The EU Fertilizer Regulation (2019/1009) sets out harmonized rules for organic fertilizers and BBFs, including digestate and compost. It sets out quality, safety and labeling requirements to promote the circular economy through the recycling of nutrients from organic waste. It also promotes the use of recycled fertilizers, ensuring that they comply with environmental and health standards. The Nitrates Directive (91/676/EEC) aims to reduce water pollution by nitrates from agricultural fertilizers and requires member states to designate nitrate vulnerable zones, implement action programs to limit fertilizer use, set maximum nitrogen application rates (170 kg N/ha/year from livestock manure) and promote precision farming to optimize fertilizer use. The EU Circular Economy Action Plan promotes the recycling of nutrients from organic waste (e.g., digestate, sewage sludge), encourages the replacement of synthetic fertilizers with bio-based alternatives and supports innovative fertilizer technologies (e.g., the recovery of struvite from wastewater). The European “Green Deal & Farm to Fork” (F2F) strategy also aims to reduce nutrient losses by 50% by 2030 while maintaining soil fertility. One of the goals is also to reduce the use of synthetic fertilizers by at least 20% by 2030, promote organic farming (25% of agricultural land in the EU by 2030) and support digital agricultural tools (e.g., satellite-guided fertilization). National policies such as the Fertilizer Act (NN 39/2023), the Regulation on the Use of Sewage Sludge in Agriculture (NN 38/2008), the Regulation on the Protection of Agricultural Land from Pollution (NN 71/2019), the Regulation on the Content of the Action Program for the Protection of Waters from Pollution by Nitrates from Agriculture (NN 72/2021) and the act amending the Agricultural Land Act (NN 52/2022) regulate the application of fertilizers by farmers, including regulations on nutrient management, manure application and subsidies for sustainable agriculture, which complement measures at the EU level [28,29,30,31,32,33,34,35,36,37]. Kurniawati et al. [38] stated that policy maker engagement is essential to enhance public acceptance, encourage farmer adoption and ensure the availability of BBFs at affordable prices.
In relation to the EU’s Common Agricultural Policy (and consequently the Green Deal and Farm to Fork strategies), Croatia’s objectives also include ensuring food security, preserving rural areas, protecting the environment through sustainable agricultural practices, preserving biodiversity and adapting to climate change. The Strategic Plan of the Republic of Croatia within the Common Agricultural Policy for the period of 2023–2027 highlights that soil loss and declining fertility due to erosion are significantly higher in Croatia compared to the EU average, with 1 million ha of agricultural land facing a high risk of erosion. According to a monitoring study conducted by the Croatian Agency for Agriculture and Food on the condition of agricultural land in the Republic of Croatia, the humus content of the soils examined is critically low. The results show that 90% of soils have a humus content of less than 3%, while 55.4% of soils contain less than 2% humus [39]. This is a result of decades of intensive agricultural practices, including the prolonged use of synthetic and mineral fertilizers, pesticides, topsoil removal, insufficient vegetation cover and inadequate use of manure to replenish organic matter in the soil.
This study’s aims are as follows:
(i)
Investigate current fertilizer use practices among Croatian farmers.
(ii)
Assess farmers’ preferences and willingness to adopt new fertilizers, particularly BBFs.
(iii)
Identify key barriers to BBF adoption in Croatia.
Additionally, the study explores how socio-demographic factors and farm characteristics influence the acceptance of BBFs. Given the lack of research on fertilizer use in Croatia, particularly regarding bio-based alternatives, this study seeks to fill a research gap and provide an updated overview of current trends and challenges.

2. Materials and Methods

The questionnaire focused on understanding farmers’ opinions to explore current and future practices related to BBFs as the agricultural sector moves towards greater sustainability. To ensure the reliability and relevance of the survey, agricultural experts including agronomists, scientists and farmers were consulted in the questionnaire design. The questionnaire was tested on around 10 farmers prior to data collection in order to check its comprehensibility and clarity.
Our sample consisted of 203 farmers from Croatia. According to the latest data, there are 161,227 agricultural producers in Croatia [40] with an average farm size of 8.6 hectares (2023) and a total utilized agricultural area (UAA) of 1,486,053 hectares [41]. Organic farming accounts for 119,873 hectares or 8.10% of the UAA, including land under conversion [41]. For the purposes of the study, the authors divided Croatia into two main areas, Continental and Adriatic Croatia (after applying NUTS2 classification). In Adriatic Croatia, according to national databases, there are a total of 50,097 agricultural holdings (AH) or 31% of the total number of AH in Croatia, and in Continental Croatia, there are 111,130 AH or 69% of the total number of AH. The distribution of the sample corresponds to the population distribution: 77% of responses from Continental Croatia compared to 23% of responses from Adriatic Croatia. The sample was purposive.
Data collection took place between 2 January 2021 and 30 April 2021 (due to difficulties in collecting responses, the questionnaire remained open until the end of the year). In order to obtain a purposive sample, the survey was designed to reflect the diversity of farming practices in the country, including differences in farm size, crop type and geographical location.
  • Farm size: The questionnaire targeted farmers of all sizes, from small family farms to larger commercial farms. Farm size was considered important for understanding how different farm sizes affect attitudes toward BBFs. Larger farms may have more resources to invest in new technologies, while smaller farms may have different barriers or opportunities for adopting BBF.
  • Crop type: The Croatian agricultural sector is diverse, and different types of crops are grown in different regions (e.g., fruit, vegetables, cereals and vineyards). The survey aimed to involve farmers from all major crop categories to determine whether preferences and barriers to the adoption of BBFs vary by farm type.
  • Geographical region: Croatia’s agricultural landscape varies from coastal areas to inland plains. To capture the diversity of practices and challenges faced by farmers, the sample was stratified by geographic region. We ensured that major agricultural regions of Croatia (Continental and Adriatic) were represented in the sample.
The questionnaire was created using the Survey Sparrow platform. This data collection method automatically excludes producers lacking internet access and good computer skills. In general, it is quite challenging to collect a large number of responses (especially from farmers) when conducting surveys. In order to obtain a purposive sample, the survey was initially divided into two brainstorming sessions organized as part of a project in Croatia. These sessions served as a first attempt to engage stakeholders, but the response rate was lower than expected. To increase participation, the survey was further disseminated through a combination of online dissemination via specialized agricultural Facebook groups, contacting the consultancy and direct telephone contact with selected farmers from the consultancy’s database. Thanks to the consultancy company, a considerable number of respondents were recruited (203 valid questionnaires in total). Additionally, as it was difficult to reach farmers in the traditional way, the use of online platforms and direct outreach helped increase sample size and diversity. The use of a consultancy enabled access to a wider range of farmers, including those who are not regular users of online platforms. Respondents were assured anonymity and, during the survey, farmers agreed to participate in the survey. On average, the questionnaire took 10 min to complete, but no strict time limit was set so that participants could answer at their own pace.
The questionnaire consisted of three parts. The first part focused on farmers’ current practices regarding the fertilizers they use, the second part focused on farmers’ willingness to use innovative BBFs and farmers’ willingness to pay for this type of fertilizer. The third part examined socio-demographic and farm characteristics. The type of questions varied throughout the questionnaire, comprising mostly closed questions with one or more answer options, a 4-point scale (from very likely to very unlikely) to explore the acceptability of different types of BBFs and open questions to describe limitations in the use or non-use of BBFs.
The questionnaire was developed through a multi-step process to ensure comprehensiveness and consistency with the research objectives. It began with a literature review of relevant research and projects aimed at developing, integrating, testing and validating nutrient management strategies for the efficient recovery of mineral nutrients and other agronomically valuable products (such as organic supplements and biostimulants) from animal manures. This review enabled the identification of key issues and questions related to BBFs. To further refine the survey, internal workshops were held with project partners where stakeholders provided feedback to ensure that the questions were clear, relevant and in line with the project’s aim to develop reliable and safe fertilizers that could be competitive in the European market. These meetings provided valuable insights which, in combination with the results of previous studies, informed the careful formulation of the questions to cover the key areas of interest. The draft questionnaire was then sent to external reviewers from Belgium and the Netherlands, who assessed its clarity, structure and validity. Finally, it was pre-tested to ensure ease of use for farmers.
This thorough design process, which included a literature review, collaboration with experts and iterative testing, resulted in a well-rounded and reliable survey instrument. The questionnaire aimed not only to address the technical objectives of the project but also to identify end users’ preferences and willingness to purchase bio-based and tailor-made fertilizers.
The data were processed using the STATA v. 16 software package. First, descriptive statistics were used to provide a general description of the sample and opinions about current fertilizer practices and willingness to pay for innovative BBFs. In addition, a linear and logistic regression analysis was conducted to discuss three models and, more precisely, which independent variables influence the willingness to accept new fertilizers in general, BBFs in particular and the willingness to pay more for organic and environmentally friendly fertilizers. Each model contained one dependent and seven independent variables, referred to as multiple regression models [42]. In addition, the authors applied Firth’s penalized logistic regression to models 1 and 2 due to the high prevalence of positive outcomes (more than 85% “yes” for dependent variables), which can bias the maximum likelihood estimates in standard logistic regression [43]. For Model 3, the method was applied preemptively to avoid potential problems with sampling bias and to ensure consistent and unbiased parameter estimation. The results section highlights any (statistical) differences in the data between the application of linear regression, logistic regression and Firth’s logistic regression. In addition, linear and (Firth) logistic regression was used to test which factors influence the acceptance of different organic fertilizers. A multicollinearity analysis was conducted beforehand, and the variance inflation factor (VIF) and independent (categorical) dummy variables used for the regression analysis are described in Table 1.

3. Results

In total, there are 203 farms, mainly family farms (93.10%), with a small proportion of commercial companies (2.46%) and agricultural cooperatives (1.97%). The distribution of the data in the survey corresponds to that of the population [40]. The age range of participants ranges from under 20 years old (0.49%) to over 60 years old (6.40%), with the majority being between 30 and 50 years old (60.10%). In terms of education, most participants have a high school diploma (58.13%), while 39.41% have a university degree. The educational background of most farmers is technical (40.89%), followed by an agricultural background (27.59%). In total, 16.26% of respondents reported other educational backgrounds, mainly in biomedicine, law, education and hospitality.
The farm practices in the sample are diverse, with conventional farming being the most widespread (36.45%). Organic farming is practiced by 22.66% of participants, while 19.70% are in the conversion period from conventional to organic farming. Sustainable agriculture is practiced by 19.21% of farms and a small proportion (1.97%) practice other farming methods. In terms of production types, respondents could select several answers, so that crop production (for human consumption and livestock feed production) and horticulture are the most represented (56.16%). Only livestock farming is the least represented (8.87%). Farms are primarily small: 43.35% of participants own farms with an area of less than 5 ha, and a smaller percentage own larger farms (9.85% for both 20–50 ha and >50 ha). The distribution of farm size is consistent with the population data, as small farms account for the largest percentage [40]. More detailed information on the sample can be found in Appendix A.1.

3.1. Existing Fertilization Practices Among Croatian Farmers

The survey data shows that 43.35% of respondents are satisfied with the current supply of fertilizers on the market, suggesting that a significant proportion of users consider the available options to be adequate. Interestingly, 35.96% of respondents expressed satisfaction but still wished for more choice, indicating that while the current products meet their basic needs, more choice is desired. On the other hand, 12.32% of farmers are dissatisfied with fertilizers, and another 8.37% are both dissatisfied and looking for more options, indicating a niche that feels underserved (Figure 1).
The proportion of farmers using mineral fertilizers is the highest (32.84%), followed by manure (30.75%) and organic fertilizers (21.49%). The least used by farmers are animal by-products/manure from the farm (0.60%), smart fertilizers (1.49%), bio-based fertilizers (2.09%), tailor-made fertilizers (2.99%), organic-mineral fertilizers (5.67%) and other types (2.09%). The farmers’ preferred forms of fertilizer are solid fractions (39.73%) and granules (32.32%). Fertilizers in powder form, on the other hand, are used less frequently, with only 2.02% of farmers using them (Table 2).
The majority of farmers (71.43%) stated that they are satisfied with the fertilizers they currently use, indicating a general satisfaction with their performance. However, 14.29% expressed concerns about the low concentration of nutrients in the fertilizers, which could affect crop yields. A smaller proportion, 10.34%, pointed out that fertilizers cause problems with the soil, such as changes in soil pH. In addition, 3.94% of respondents selected “other” concerns, suggesting that some farmers have specific or less common problems that are not covered by the options given (Table 3). Overall, while most farmers are satisfied, a significant proportion have concerns about nutrient quality and the impact on soil health.

3.2. Farmers’ Preferences for Innovative Bio-Based Fertilizers in Croatia

The results of the survey in the Table 4 show that a large proportion of farmers in Croatia are willing to try new fertilizers, especially if they offer cost savings. In total, 37.93% of respondents are willing to try new types of fertilizers if they are cheaper than their current mineral fertilizers. In addition, 20.20% of farmers are willing to try new fertilizers if the benefits are clearly explained, e.g., their impact on soil structure and nutrient availability, showing that they are interested in transparent information. Another 14.29% of farmers are willing to try new products if they have better nutrient and fertilizer values than their standard mineral fertilizers, indicating a focus on efficiency and effectiveness. However, 15.27% of farmers indicated that they would like to maintain their current mineral or organic fertilizers, suggesting that a portion of the population prefers consistency over potential change. A smaller proportion, 12.32%, would consider switching to new fertilizers if they were cheaper than their organic options. Overall, there is a general willingness to try new fertilizers, especially if they offer clear, tangible benefits such as cost savings or better fertilizer results.
As BBFs have been shown to have a positive effect on soil quality, 87.19% of farmers agreed to use BBFs, indicating a strong interest in sustainable practices to improve soil health. Only 1.48% of farmers disagreed with the idea, indicating low resistance to this approach. However, 11.33% of respondents were unsure, possibly due to a lack of information or familiarity with BBF and their effects (Figure 2). Ultimately, the results show a high willingness to use bio-based fertilizers, especially if they make a positive contribution to soil quality, indicating a growing interest in sustainable and environmentally friendly farming methods.
The data in Table 5 show that BBFs from different sources are accepted to varying degrees (from 1—very unlikely to 4—very likely). Animal manure has the highest level of acceptance (mean 3.60), indicating that farmers are relatively open to using it as a source of fertilizer. Urban green waste (mean 3.31) and composted plant residues (mean 2.86) are also moderately accepted, indicating that these organic sources are preferred, albeit slightly less than animal manure. Sewage sludge ash (mean 1.74) and sewage sludge (mean 1.72), on the other hand, are the least accepted. It can be concluded that farmers are more willing to accept (WTA) BBFs from organic and natural sources such as animal manure and urban green waste but are less inclined to use materials such as sewage sludge or waste from the food industry and households.
The current cost of annual fertilization per hectare on farms varies (Figure 3), but many farmers, 39.41%, spend between EUR 200 and EUR 500 per hectare per year on fertilization. A remarkable 28.57% of farmers spend less than EUR 200, indicating more cost-efficient fertilization practices. In total, 18.23% of farmers reported spending between EUR 500 and EUR 1000 and 10.84% between EUR 1000 and EUR 5000 per hectare on fertilization. Only a small percentage, 1.97%, spend between EUR 5000 and EUR 7000, and an even smaller group, 0.99%, spend more than EUR 7000. These results show that most farmers are in the lower to medium range of fertilizer costs and only a few spend significantly more.
With regard to the fertilizer costs mentioned, a significant proportion of farmers stated that they would be willing to pay (WTP) more for organic and environmentally friendly fertilizers under certain conditions. In all, 47.78% of farmers would be willing to pay a premium if the quality of the fertilizer were better than their current options, indicating that quality is an important factor in their purchasing decisions. A smaller group, 8.87%, is generally willing to pay more regardless of quality, likely due to environmental concerns. However, 36.45% of farmers are not willing to pay more, suggesting that cost is a major barrier. In addition, 6.40% are not convinced of the efficacy of BBFs, while 0.49% are concerned about their safety, suggesting that further education and evidence of their efficacy and safety is needed. While a significant number of farmers are willing to pay more (56.65%), factors such as the cost and quality of fertilizers play an important role in their decision (Table 6).
Furthermore, using a WTP scale, the results show varying price tolerance among farmers when it comes to paying for BBFs compared to mineral fertilizers. A significant proportion (52.70%) of respondents are willing to pay the same price as they do for mineral fertilizers and are not willing to pay more, showing that a significant proportion of farmers are price-sensitive. In total, 20.69% of farmers are willing to pay 10% more, indicating some flexibility in prices if benefits justify higher costs. Only 2.96% of farmers are willing to pay 25% more and even fewer, 0.99%, would accept a price more than 25% higher, indicating that willingness decreases as the price premium increases (Figure 4). From these data, it can be concluded that product price plays an important role in the decision to use BBFs.

3.3. Restrictions on the Use of Bio-Based Fertilizers

Farmers indicated that they generally do not feel informed about BBFs. A total of 46.31% of farmers stated that they are not at all informed about important aspects such as regulations, certification, control, costs and profits. A slightly higher percentage, 46.80%, feel partially informed, indicating that they have some knowledge, but it is not comprehensive. Only 6.90% of farmers consider themselves well informed (Figure 5). These results suggest that better education, workshops and information dissemination about BBFs are needed to help farmers make informed decisions about their adoption and use.
The biggest obstacle to the use of BBFs is related to the financial/economic impact; 53.28% of respondents cited this as a major obstacle (Table 7). This indicates that the cost of bio-based fertilizers or the perceived economic impact of switching is a major concern for farmers. Overall, 28.69% of farmers cited the technical equipment required to apply BBFs as another major obstacle, indicating that there may be a lack of suitable machinery or tools for efficient use. A smaller proportion, 10.66%, cited the legal framework as an obstacle, meaning that regulatory issues could hinder adoption. Finally, 7.38% cited import/export restrictions on bio-based products as a limiting factor, although this is a minor issue compared to the other factors. The data show that financial concerns and the need for suitable equipment are the biggest challenges standing in the way of the wider adoption of BBFs.
Overall, farmers are positive about bio-based fertilizers but are concerned about the use of conventional fertilizers on neighboring plots and how this problem can be solved. They also believe that BBF only contains a small amount of nutrients and are unsure about their effectiveness. Other concerns are high prices, which were frequently mentioned by farmers, the limited availability of products, questionable quality and a lack of information about the possibilities and benefits of BBFs. The habit of using mineral fertilizers also affects the acceptance of BBFs.

3.4. Influence of Socio-Demographic Characteristics and Farm Characteristics on the Acceptance of Bio-Based Fertilizers

Table 8 shows how various factors (independent variables) are related to farmers’ attitudes and preferences towards new types of fertilizer (more on the variables in Appendix A.2). More specifically, three models were analyzed that influence farmers’ willingness to use new fertilizers in general (Model 1), to use BBFs (Model 2) and to pay more for BBFs (Model 3). The main independent variables include agricultural education, farm type, age, education level, farming practice, crop production and farm size. Farmers with an agricultural education background are more willing to try new fertilizers (0.141, p < 0.05) but show no significant preference for adopting or paying a higher price for them. Adoption (0.117, p < 0.05) and willingness to pay more (0.145, p < 0.05) for BBFs are positively influenced by specific farm practices. This means that farmers who farm organically, are in the conversion phase and use sustainable practices are more willing to use BBFs. Due to the high prevalence of outcomes (dependent variables) in Model 1 and Model 2 (85% and 87%), Firth’s penalized logistic regression method was additionally used for Model 1 and Model 2 to reduce bias in parameter estimates and ensure that the results accurately reflect the true relationships between predictors and outcomes, even with unbalanced data [43]. For Model 3, the Firth method was applied preemptively to avoid separation or sampling bias. The results of the Firth method were compared with standard logistic regression and no differences were found in the data. No differences were found in the comparison with the linear regression analysis (Table 8) either (see Appendix A.3).
In addition, the authors investigated which socio-demographic variables influence the willingness to accept different BBFs (Table 9). The data show that some socio-demographic data only influence the acceptance of some BBFs. For example, older farmers are less willing to use sewage sludge (−0.147, p = 0.033); on the other hand, farmers who practice crop farming show a statistically significant positive effect (0.131, p = 0.019). The acceptance of waste from the food industry is influenced by the type of production and the size of the farm. Crop production has a statistically significant positive effect, meaning that farmers who produce crops are more likely to use food industry waste (0.142, p = 0.046). In addition, larger farms are more likely to use food industry waste (0.152, p = 0.044). With regard to urban green waste, acceptance is influenced by education. This means that farmers with higher education are more inclined to use urban green waste (0.117, p = 0.039). Ash as biofertilizer is readily used by larger farms but in smaller quantities. The larger farm variable has a statistically significant negative influence on the possible acceptance of ash (−0.162, p = 0.032). There was no statistically significant influence on the acceptance of animal manure, sewage sludge ash and household waste (p > 0.05). As with the three previous models, Firth’s penalized logistic regression method was used to investigate the influence of different socio-demographic variables and farm characteristic variables on the use of different types of BBFs, as respondents were predominantly using animal manure and urban green waste and, on the other hand, were less willing to use sewage sludge and sewage sludge ash. The results of the Firth method were compared with the standard logistic regression and no differences were found in the data. No differences were found in comparison with the linear regression analysis (Table 9) either (see Appendix A.4).
Although the regression analysis shows some relationships, it is not able to explain a significant portion of the variance. The authors suggest that this is typical for social science and agricultural studies where human behavior plays a role. In Table 8 and Table 9, R2 values are low, probably due to the complex and multifaceted nature of the factors influencing organic fertilizer use. According to Xu et al. [44], R2 values were generally above 0.8 in most technical papers, but in studies related to people and environmental issues, the R2 value was often <0.1.

4. Discussion

Following the analysis, we can confirm that less than a third of farmers in Croatia use organic practices, which is in line with previous research (e.g., [
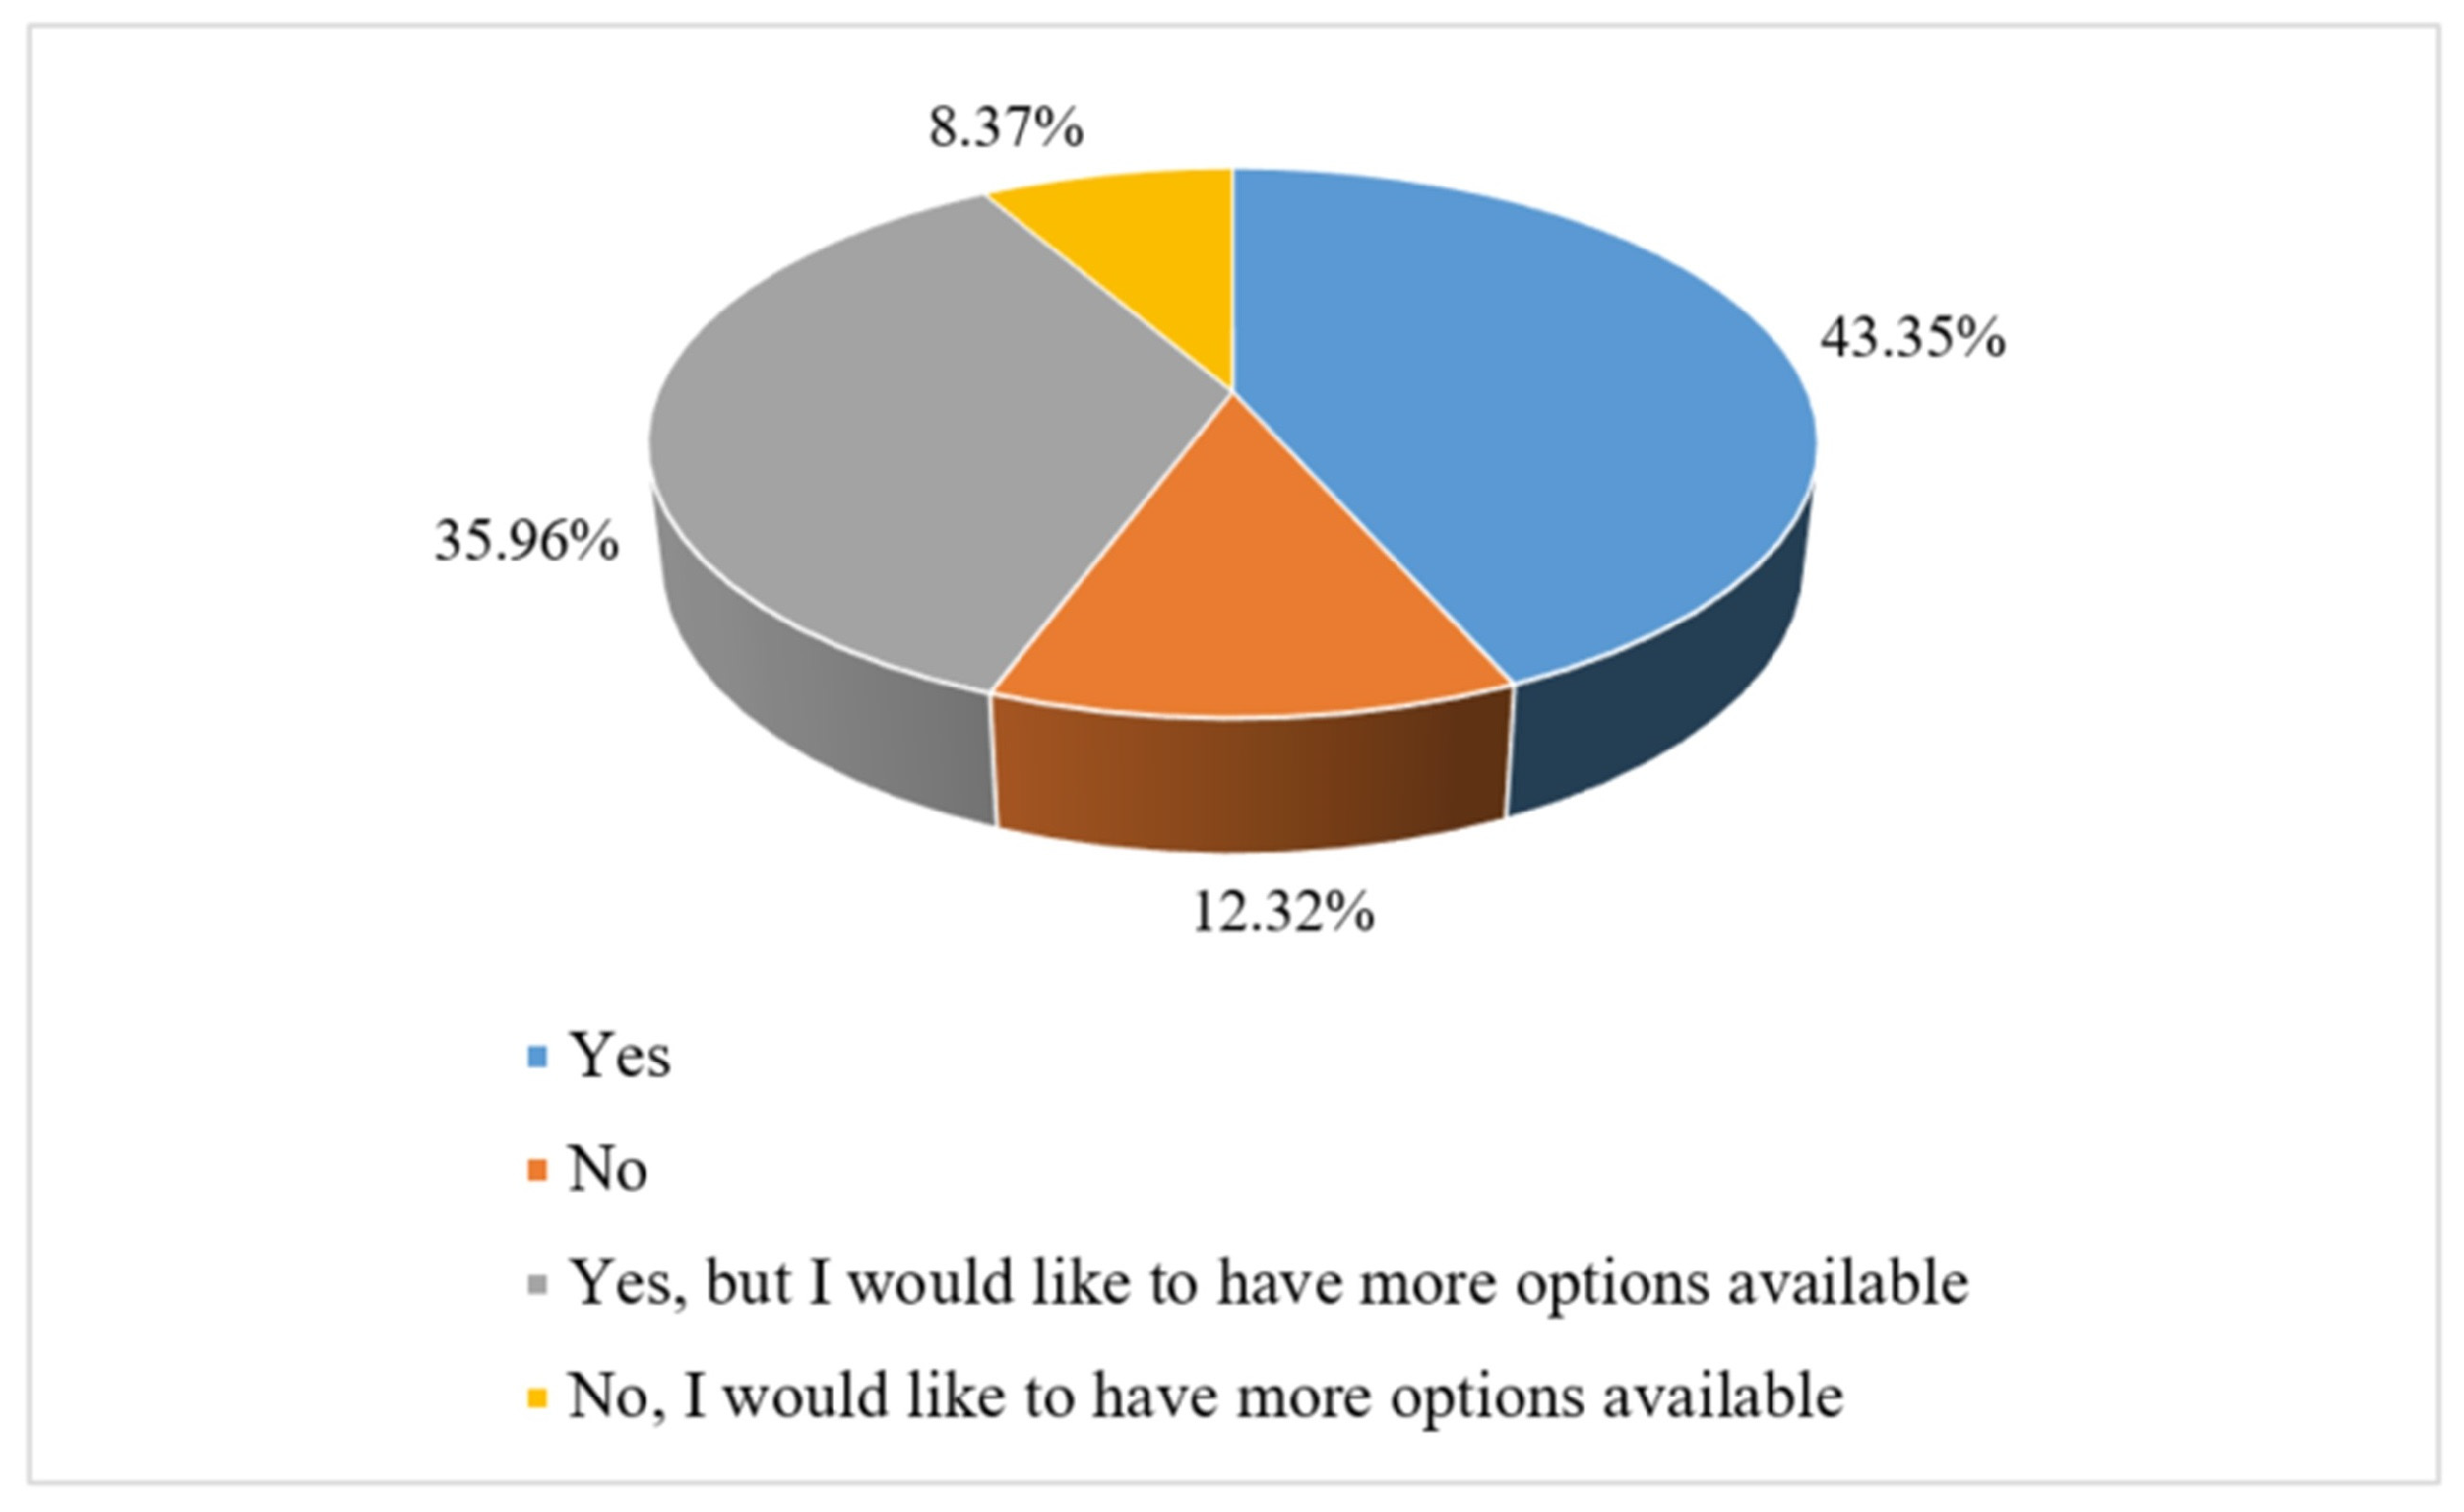
45]). Most respondents in Croatia are satisfied or partially satisfied with the supply of fertilizers in general but stated that there is a need for more diverse fertilizer options on the market. In comparison, Tur-Cardona et al. [6] found that around 40% of respondents were satisfied with the current fertilizer use in the European market. This suggests that the introduction of new products could increase market satisfaction and satisfy unmet needs. We must keep in mind that the market for BBFs is currently smaller and at an early stage compared to the market for conventional mineral fertilizers [18,46]. On the other hand, Alvarez Salas et al. [18] found that the price increase in mineral fertilizers could represent an opportunity for the BBF industry [47]. The relatively low dissatisfaction rates indicate that most farmers are satisfied, but the desire for diversity points to opportunities for innovation in the fertilizer market, with the aim of protecting the environment. In Croatia, farmers use mineral fertilizers most frequently (32.84%), while only 21.49% use organic fertilizers. In Denmark, for example, 12% of people do not currently use organic fertilizers, while around 80% of them use at least one type of organic fertilizer. Research conducted in Sweden showed that older participants were the most resistant, while younger participants indicated the possibility of using alternative organic fertilizers [48]. This shows the low level of acceptance of BBFs among Croatian farmers. The comparison of current usage with conventional mineral fertilizers is particularly interesting as it makes it possible to determine the competitive position of the newly developed bio-based alternatives, thus providing useful insights for the design of marketing strategies and policy development [45].
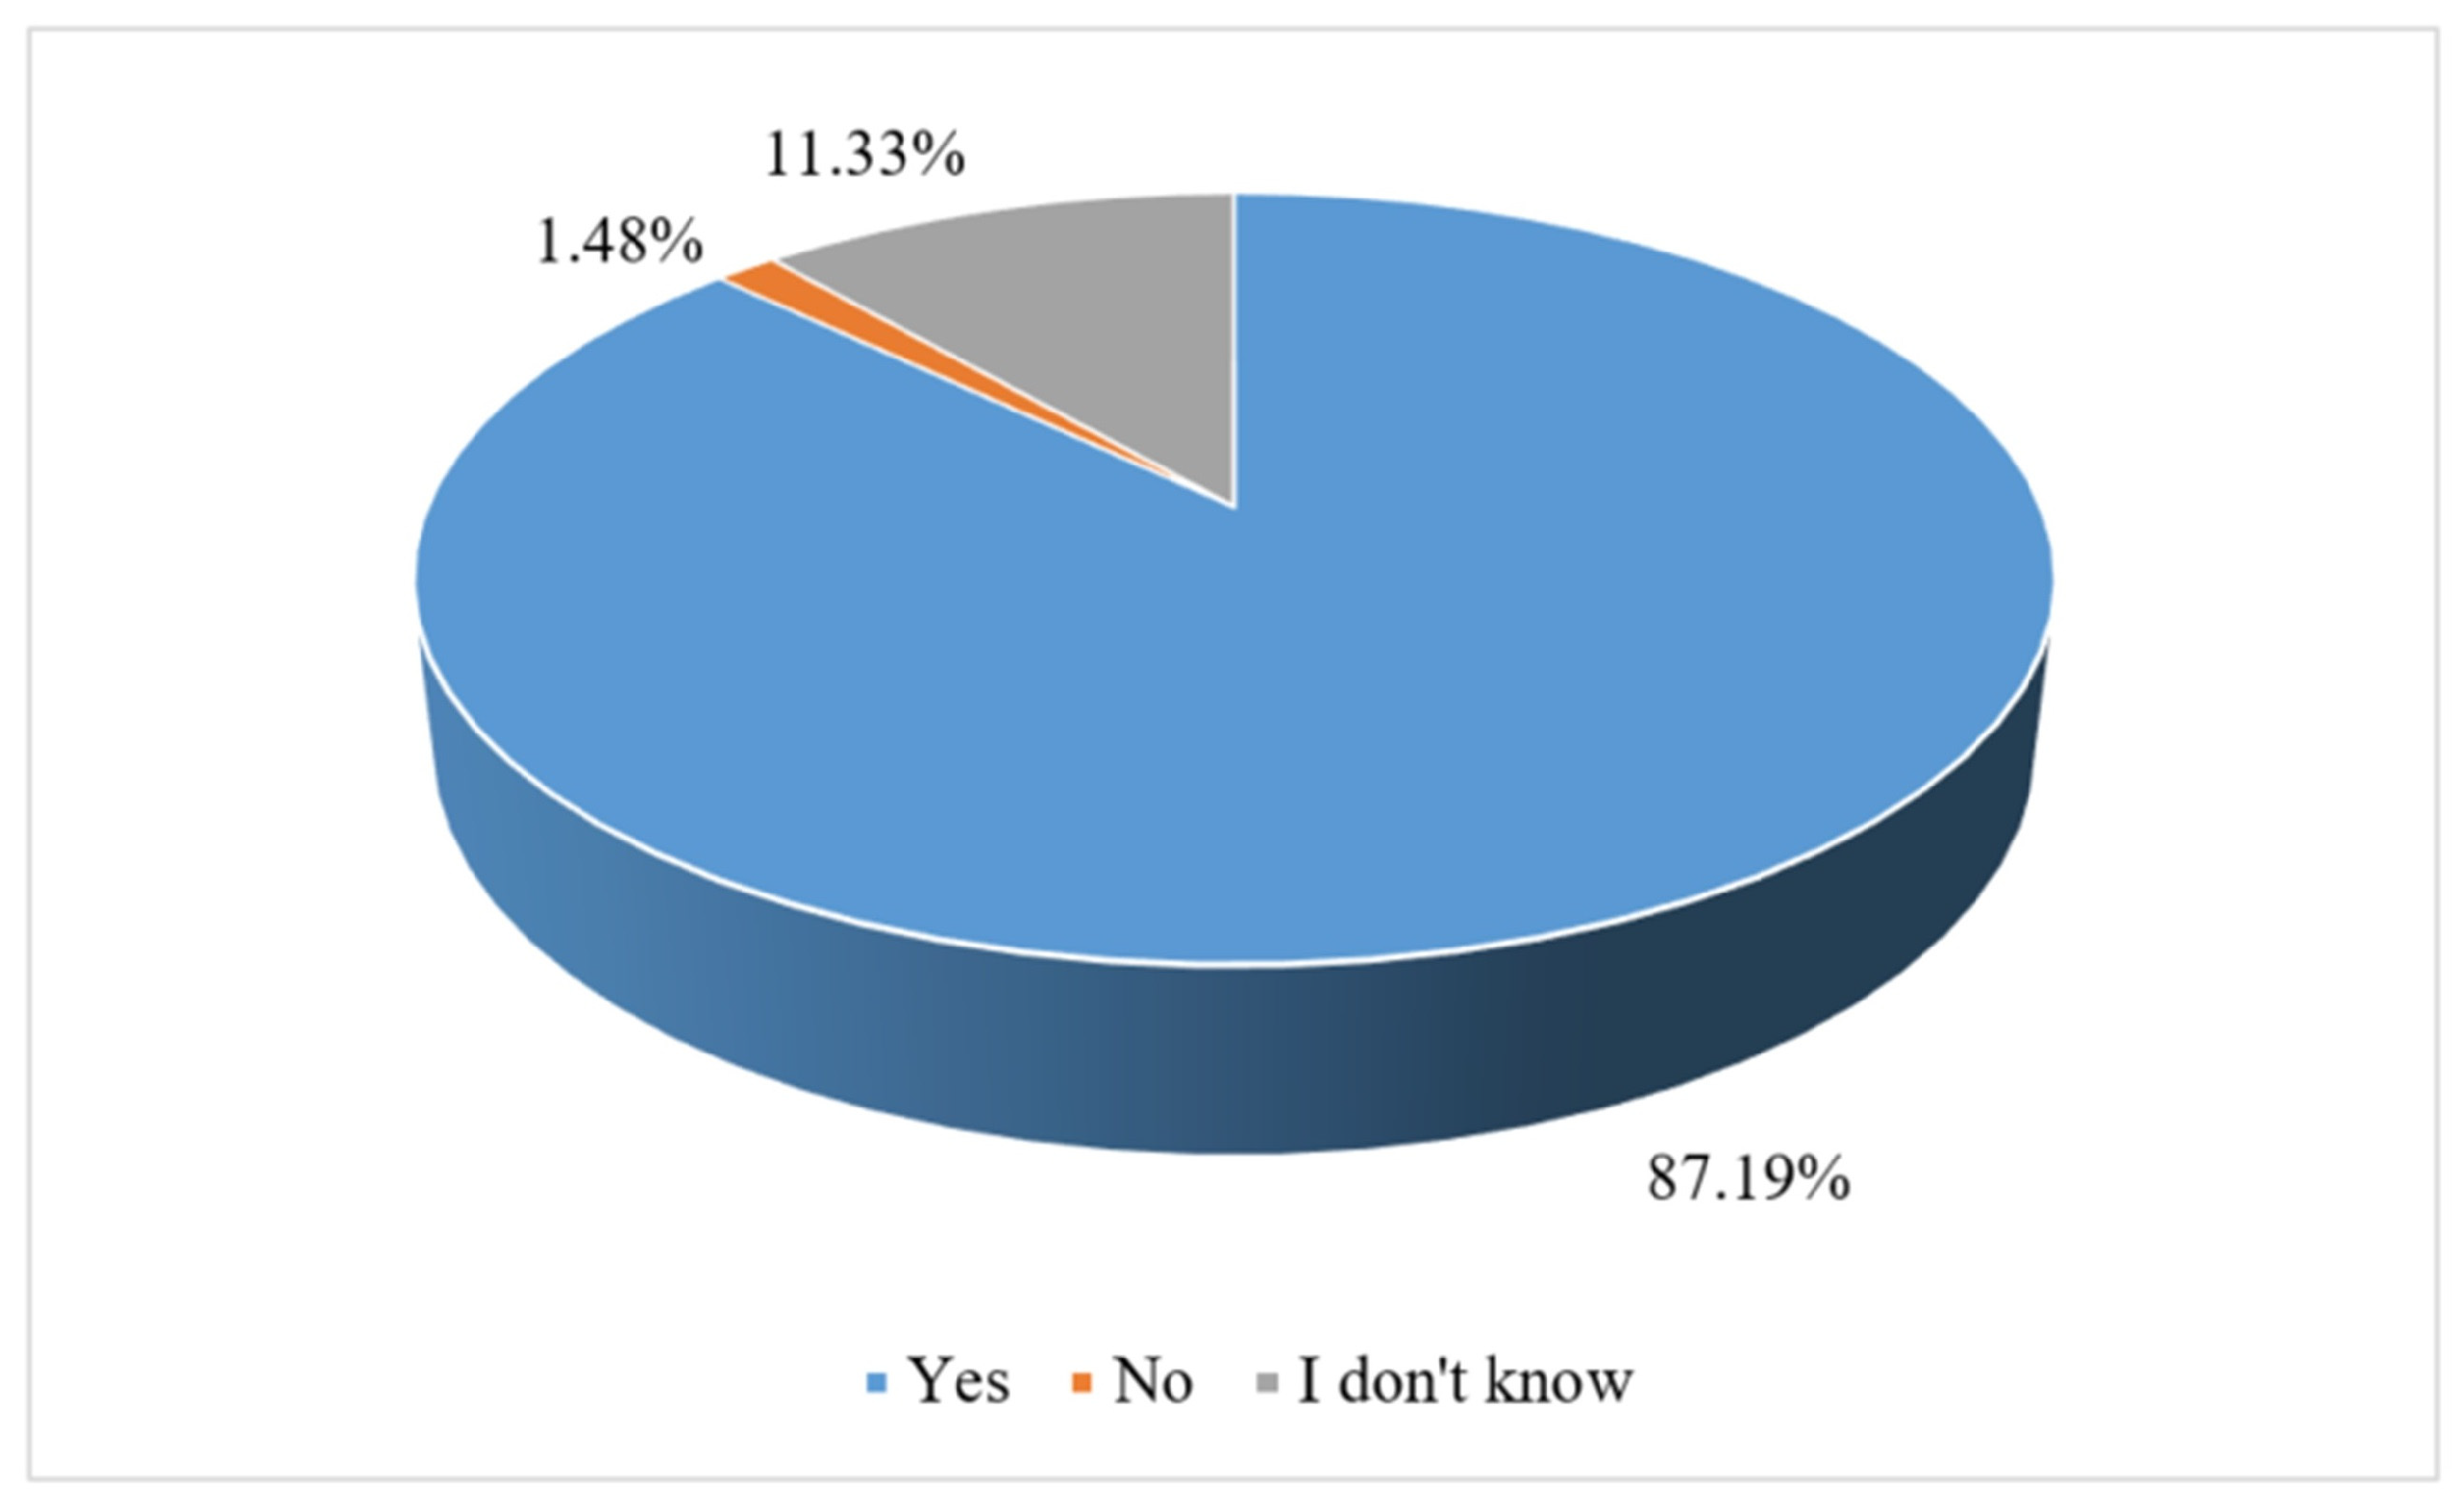
Croatian farmers are generally open to trying new fertilizers, with a clear majority (87%) expressing their willingness to use BBFs due to their positive impact on soil quality, but the lack of availability of alternative organic fertilizers is a challenge. This is consistent with the finding that soil health can be improved through the use of BBFs, as evidenced by another study [13]. The accessibility and distribution of these fertilizers needs to be improved to meet farmers’ demand and support sustainable agricultural practices. Farmers prefer BBFs from organic and natural sources, such as animal manure and urban green waste. This preference is in line with the findings of Tur-Cardona et al. [6], according to which 87% of farmers are aware of BBFs in various forms and over 90% of farmers use fertilizers on their fields. However, almost half of these farmers have experienced macro- or micronutrient deficiencies when relying on conventional fertilizers.
Hills et al. [49] also found that 78% of respondents were already using organic fertilizers, which is consistent with Croatian farmers’ interest in BBFs. Despite this interest, there is a notable gap in the availability of alternative organic fertilizers. While the interest in alternative unprocessed manure and urban waste-derived fertilizer is relatively low (just over 20%), the interest in alternative processed manure is significantly higher, expressed by almost half of the respondents. However, more than two-thirds of farmers interested in alternative organic fertilizers do not have access to them, which is a significant barrier to adoption [26].
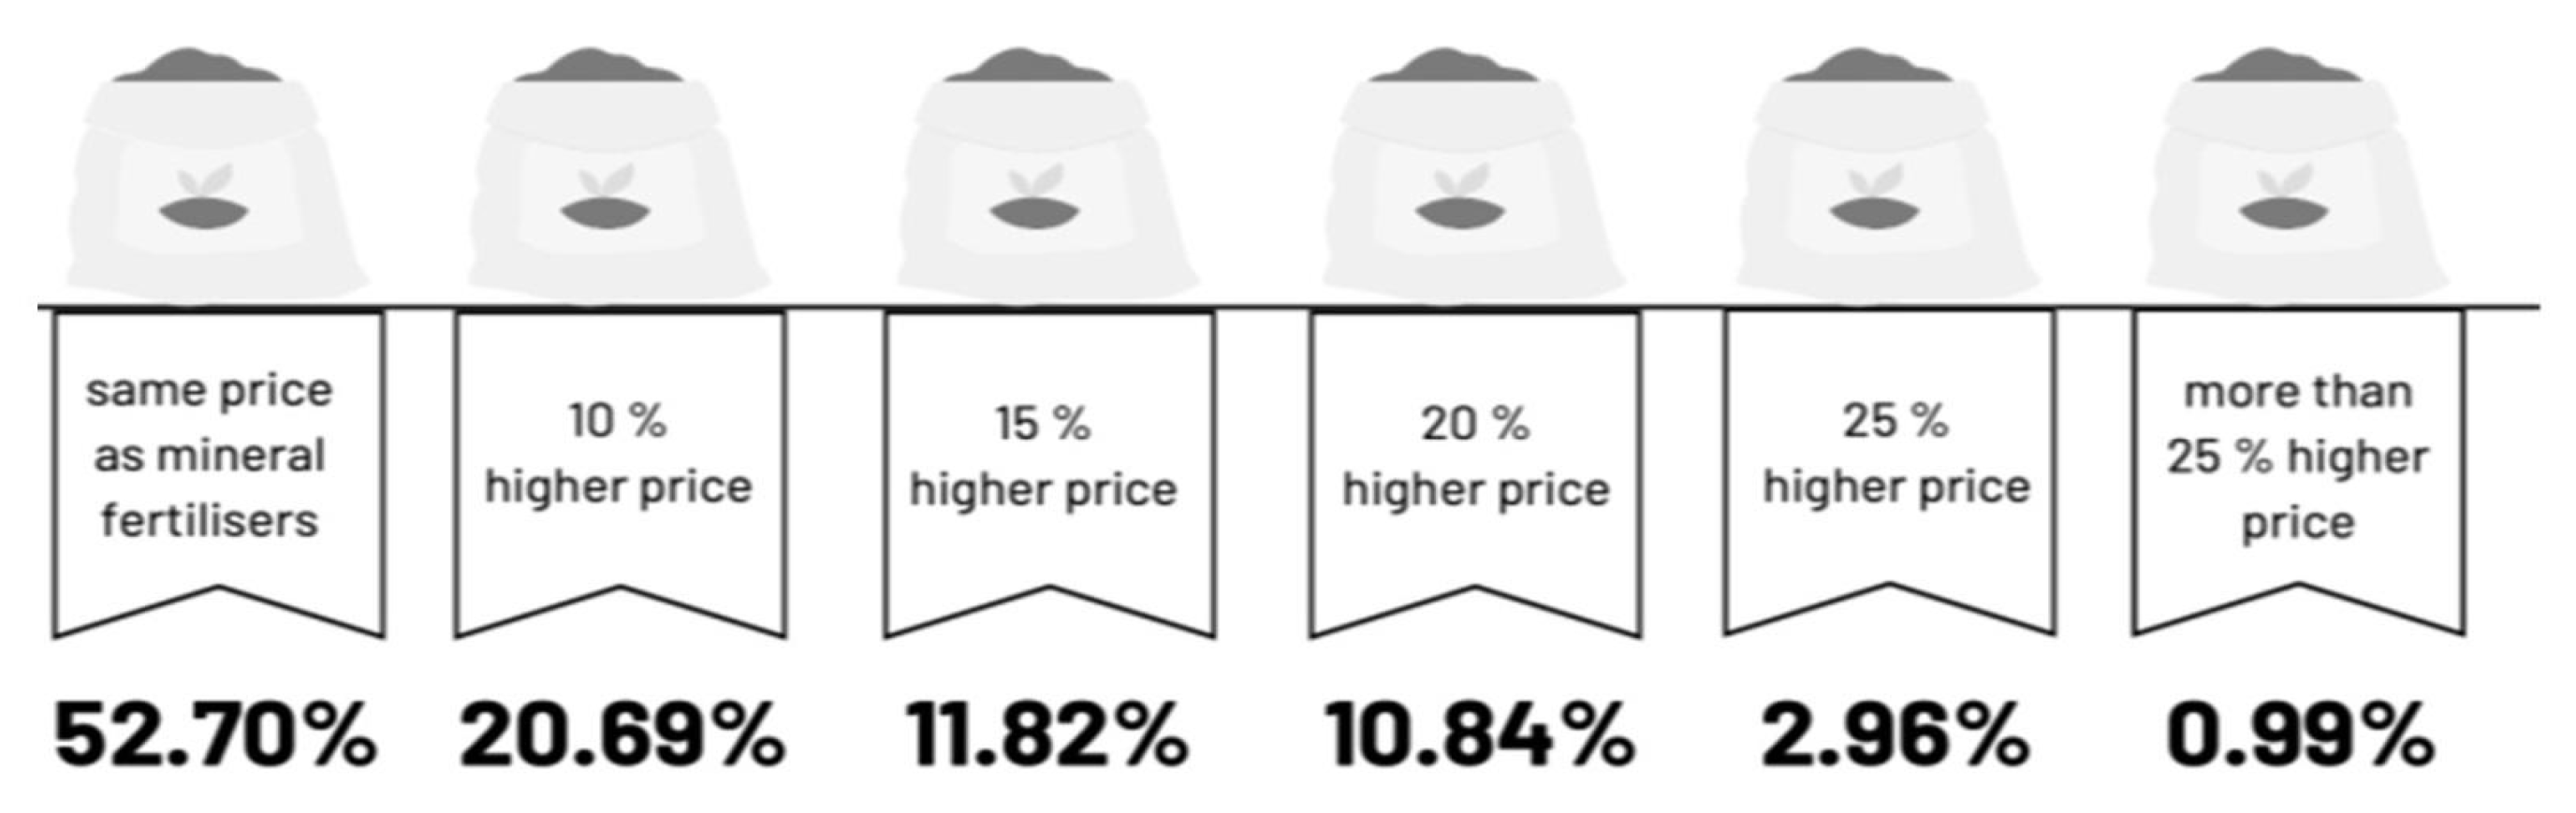
In terms of current fertilizer costs and willingness to pay for BBFs, most farmers pay on average between EUR 200 and EUR 500 annually per hectare. Using the WTP scale, we found that half of the respondents are willing to pay the same price as they do for mineral fertilizers, and only 20% are willing to pay 10% more than the current fertilizer price. Kragt et al. [50] stated that respondents were highly price sensitive. But, if farmers are more WTP, it is mostly affected by higher incomes and affordable prices of products [6,45,51]. On the other hand, farmers are reluctant due to cost sensitivity, uncertainty about the effectiveness of BBFs and the lack of strong financial incentives. While many farmers are open to the use of biofertilizers, only a small percentage are WTP more unless clear economic and productive benefits are demonstrated [6,45].
Recent research showed that farmers are WTP a premium for bio-based fertilizers that have certain desirable properties (e.g., granular, solid form, hygienic or containing organic carbon), compared to fertilizers lacking these properties [6]. According to the same study, the optimal selling price for bio-based fertilizers in Europe is estimated to be 76.6% of the price of equivalent mineral fertilizers with similar nutrient content, taking into account all preferred properties (solid form, consistent volume, reliable nitrogen content, hygienic conditions and rapid nutrient release). In their experiment, Hills et al. [49] found that respondents preferred the hypothetical BBF alternative with a lower price. But Moshkin et al. [45] stated that to ensure the rapid adoption of BBFs, a discount of 30–46% compared to mineral fertilizers is required.
Although interest in BBFs is growing among various stakeholders, their adoption is still held back by a mix of financial and technical challenges. High production and transport costs, limited financial incentives and strong competition from conventional mineral fertilizers make BBFs less economically attractive. In addition, inconsistent nutrient levels, the lack of clear regulations and compatibility issues with current agricultural equipment further complicate matters. Concerns about biosafety and negative consumer perceptions add to the reluctance of growers to make the switch [6,17,38].
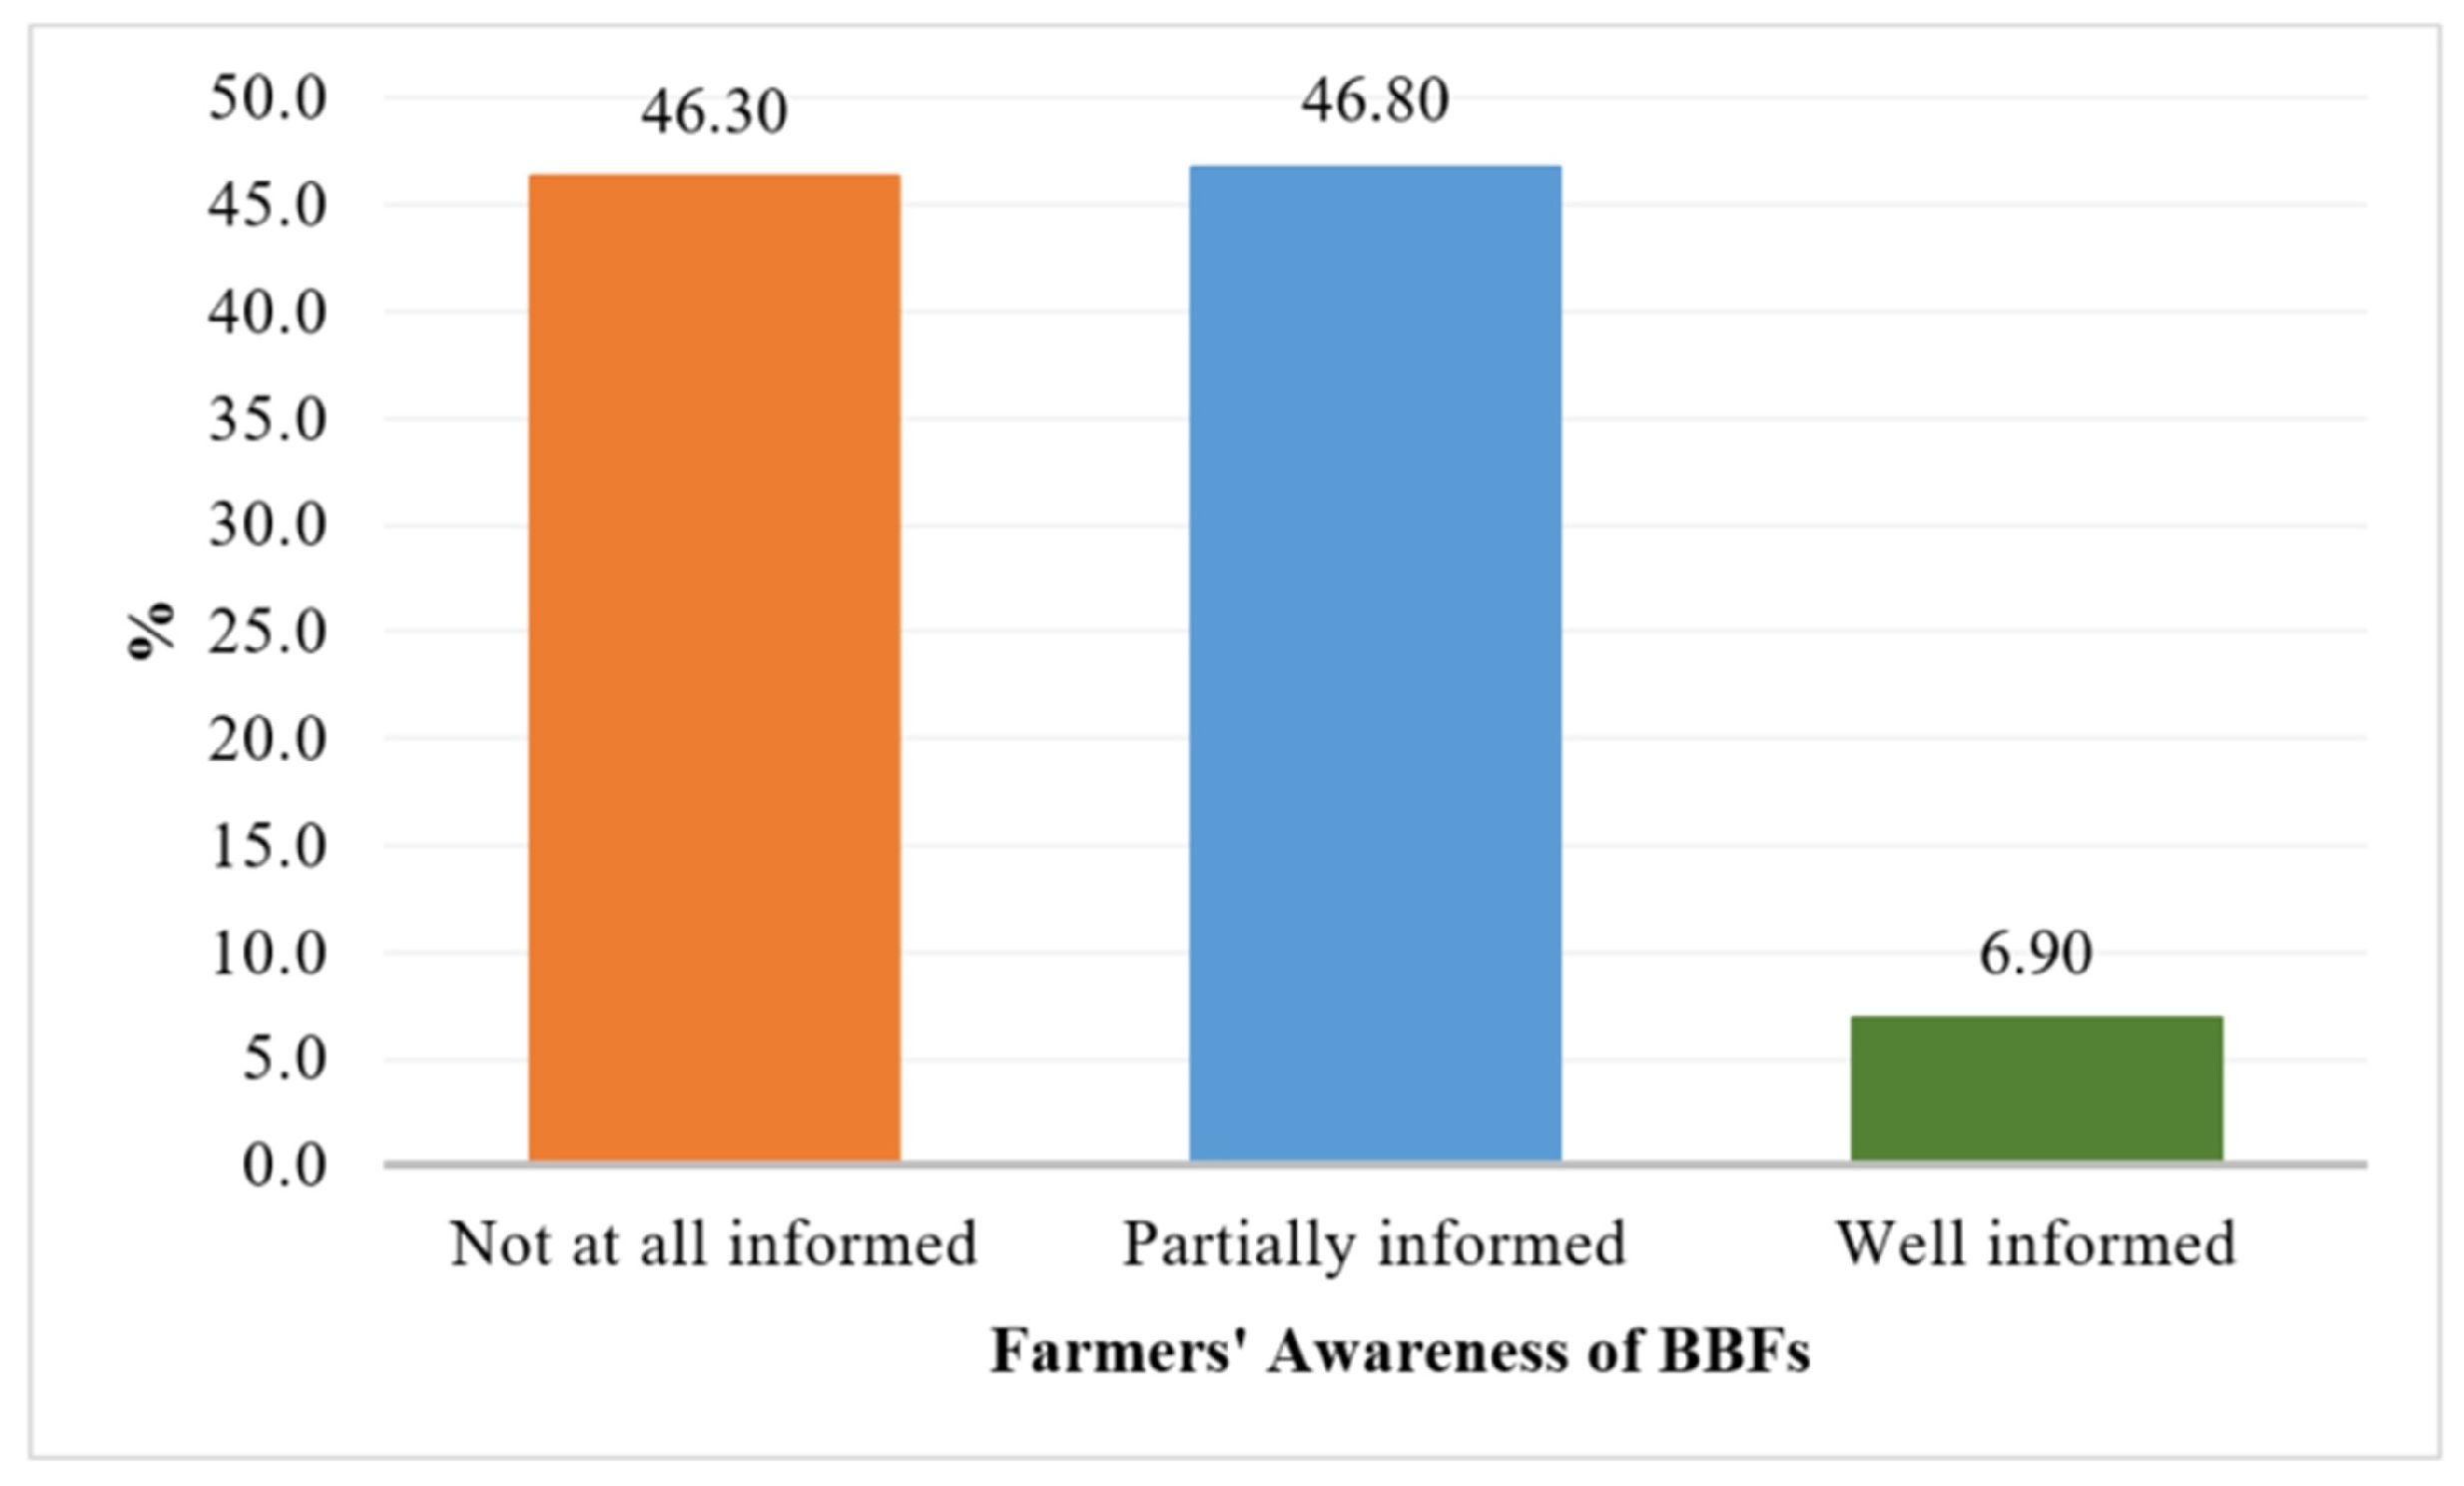
According to the survey results, many farmers feel that they do not have enough information about BBFs, which significantly affects their willingness to use them. Cost is the biggest concern—BBFs are often seen as too expensive, and many also cite the need for specialized equipment as a major barrier. A smaller number of farmers cite regulatory issues and import/export restrictions as additional barriers. Tur-Cardona et al. [6] also point out that high logistics and production costs may reduce farmers’ willingness to adopt BBF. In addition, some farmers remain skeptical about the actual effectiveness of BBFs, especially in terms of nutrient content.
To make BBFs more attractive to farmers and encourage their wider adoption, some important steps are needed: clearer and more accessible information, better training, financial support, investment in the right equipment, improved regulations and continuous technological development.
From the study of socio-demographic data and farm characteristics, it can be concluded that respondents with an agricultural educational background are more willing to try new fertilizers in general. On the other hand, farms that are organic, in the conversion period and use sustainable practices on the farm are more willing to use bio-based fertilizers and more WTP for bio-based fertilizers. Rachman et al. [51] stated that farmers with more education are more likely to appreciate the benefits of BBFs and thus are WTP more, which is not consistent with our data. Older farmers tend to resist the introduction of new technologies, relying instead on traditional farming practices and long-standing knowledge acquired over time. A major obstacle to the adoption of BBF technology is the lack of awareness and knowledge of its benefits. Furthermore, implementing BBFs requires additional work and effort, which can be a significant deterrent for older farmers with limited physical capacity. In addition, older farmers often prefer to use animal manure as a fertilizer, as it is a natural by-product of livestock farming and costs little. Its accessibility makes it a convenient and economically viable option, especially for those who are already raising livestock [18,46,52,53]. Furthermore, the authors concluded that the choice of different organic fertilizers depends on the size of the farm, type of production, higher education and age of the farmer.

5. Conclusions

This study provides valuable insights into the current practices and preferences of Croatian farmers regarding innovative bio-based fertilizers. The results show that although a significant proportion of farmers are aware of BBFs, their use is hindered by factors such as high costs, uncertainty about nutrient content and a strong dependence on conventional fertilizers. Farmers are willing to use BBFs, especially if they have certain desirable characteristics, such as a solid granule form, hygienic conditions and reliable nutrient release. However, the transition to BBFs is also influenced by socio-economic factors such as age, farm size and access to information.
The contribution of this study lies in the assessment of current fertilization practices and farmers’ attitudes towards BBFs in Croatia. The study provides empirical evidence on the factors (high costs, lack of infrastructure and lack of awareness) influencing farmers’ adoption of sustainable fertilization practices and identifies barriers and opportunities for wider adoption. By analyzing farmers’ preferences, the study supports the development of targeted measures, policy interventions, education campaigns and financial incentives to promote BBFs as an alternative to conventional fertilizers. By encouraging collaboration between researchers, policy makers, traders and farmers, Croatia can promote the adoption of sustainable agricultural practices and reduce dependence on mineral fertilizers. In addition, the paper contributes to the growing knowledge of circular economy practices in agriculture, with a focus on the Croatian market.
To avoid financial and logistical setbacks in the implementation of BBF schemes, policy makers should adopt strategic approaches that improve market transparency, financial support and stakeholder engagement. Firstly, the establishment of a central BBF database at the EU level would improve market accessibility by providing up-to-date prices, quality standards and availability, thus promoting informed decision-making. Secondly, targeted financial mechanisms, such as subsidies linked to carbon pricing (connection to agri-food sector) and common agricultural policy (CAP) incentives, would encourage the uptake of BBFs by offsetting higher production costs and rewarding sustainable agricultural practices. In addition, incentives for collaboration between stakeholders, including farmers, industry and researchers, through grants and joint initiatives can increase efficiency and cost-effectiveness. By ensuring clear funding mechanisms and improving the flow of information, these strategies can mitigate economic risks, promote adoption and support the transition to sustainable agricultural practices.
One of the limitations of this study is its geographical scope, as the research was conducted exclusively in Croatia, which may affect the generalizability of the results. In addition, further research should be conducted with farmers who only practice arable farming or horticulture, for example, instead of analyzing farmers in different production areas. Self-reporting by farmers may lead to biases in perception and actual practices. To reduce biases, incorporating a behavioral approach (and using experimental methods) and investigating behavioral and/or psychological factors in future research may help to gain detailed insights into what influences farmers’ preferences for BBFs. Future research should include longitudinal studies and cross-country comparisons as well as long-term field trials to demonstrate the effectiveness of BBF and explore innovative strategies to improve its accessibility and affordability. Ultimately, the switch to BBF is a crucial step towards sustainable agriculture and environmental protection in Croatia.

Author Contributions

Conceptualization, M.Š.V. and T.Č.; methodology, M.Š.V., A.M.Š., N.V. and T.Č.; formal analysis, A.M.Š., N.V. and T.Č.; data curation, M.Š.V. and T.Č.; writing—original draft preparation, M.Š.V. and T.Č.; writing—review and editing, M.Š.V., L.Č., A.M.Š., N.V., E.M. and T.Č. All authors have read and agreed to the published version of the manuscript.

Funding

This study was conducted as a part of the FERTIMANURE project (Innovative nutrient recovery from secondary sources—Production of high-added value FERTIlisers from animal MANURE), which received funding from the EU Horizon 2020 Research and Innovation Programme under grant agreement No. 862849. See https://www.fertimanure.eu/en/ for more information.

Institutional Review Board Statement

Approval for the study was not required in accordance with local legislation.

Informed Consent Statement

Informed consent was obtained from all subjects involved in the study.

Data Availability Statement

The data that support the findings of this study are available from the corresponding author [M.Š.V.] upon reasonable request.

Conflicts of Interest

Authors Ana Marija Špicnagel and Natalija Vugrin were employed by IPS Konzalting. The remaining authors declare that the research was conducted in the absence of any commercial or financial relationships that could be construed as a potential conflict of interest.

Abbreviations

The following abbreviations are used in this manuscript:
BBFBio-based fertilizers
TMFTailor-made fertilizers
UAAUtilized agricultural area
WTAWilling to accept
WTPWilling to pay

Appendix A

Appendix A.1. Sample Description

VariablesSample
Type of legal form of agricultural businessFrequency (percentage)
 Family farm—physical person189 (93.10%)
 Commercial company5 (2.46%)
 Agriculture cooperative4 (1.97%)
 Other5 (2.46%)
Year
 <20 years 1 (0.49%)
 20–30 years old 41 (20.20%)
 30–40 years old 60 (29.56%)
 40–50 years old62 (30.54%)
 50–60 years old26 (12.81%)
 >60 years13 (6.40%)
Education level
 Elementary level 5 (2.46%)
 High school level118 (58.13%)
 College level (BSc—bachelor’s degree)25 (12.32%)
 College level (MSc—master’s degree)54 (26.60%)
 Other (PhD)1 (0.49%)
Educational background
 Technical40.89%
 Agricultural background27.59%
 Economic14.29%
 Chemical0.99%
 Other16.26%
Farm practices
 Conventional farming78 (38.42%)
 Organic farming46 (22.66%)
 Conversion period—from conventional to organic40 (19.70%)
 Sustainable farming39 (19.21%)
 Other4 (1.97%)
Type of production
 Crop and horticulture production114 (56.16%)
 Mixed farming production (crop and animal production)26 (12.81%)
 Intensive livestock production18 (8.87%)
 Other45 (22.17%)
Farm size (ha)
 0 ha8 (3.94%)
 <5 ha88 (43.35%)
 5–10 ha40 (19.70%)
 10–20 ha27 (13.30%)
 20–50 ha20 (9.85%)
 >50 ha20 (9.85%)

Appendix A.2. Descriptions of Variables Used for Logistic Regression

VariableDescriptionMeanSTDMinMax
Willingness to try new types of fertilizers=1 if respondents are willing to try new fertilizers; =0 otherwise.0.850.3601
Willingness to use bio-based fertilizers=1 if respondents are willing to use bio-based fertilizers; =0 otherwise.0.870.3401
Wiligness to pay more for bio-based fertilizer=1 if respondents are willing to pay more for bio-based fertilizer; =0 otherwise.0.570.5001
Animal Manure=1 if respondents are likely or very likely to accept animal manure as a bio-based fertilizer; =0 otherwise.0.940.2401
Sewage Sludge=1 if respondents are likely or very likely to accept sewage sludge as a bio-based fertilizer; =0 otherwise.0.170.3701
Sewage Sludge Ashes=1 if respondents are likely or very likely to accept sewage sludge ashes as a bio-based fertilizer; =0 otherwise.0.190.3901
Household Biowaste=1 if respondents are likely or very likely to accept household biowaste a as bio-based fertilizer; =0 otherwise.0.460.5001
Food Industry Waste=1 if respondents are likely or very likely to accept food industry waste as a bio-based fertilizer; =0 otherwise.0.340.4701
Urban Green Waste=1 if respondents are likely or very likely to accept urban green waste as a bio-based fertilizer; =0 otherwise.0.850.3601
Ashes=1 if respondents are likely or very likely to accept ashes as a bio-based fertilizer; =0 otherwise.0.660.4801

Appendix A.3. Firth’s Penalized Logistic Regression Analysis of Farmers’ Willingness to Adopt and Pay More for Bio-Based Fertilizers

VariableModel 1Model 2Model 3
Coef. (St. Err.)
Family farm−0.048 (0.924)−1.589 (1.485)−0.553 (0.618)
Age_>500.008 (0.533)0.439 (0.623)−0.369 (0.378)
High education−0.241 (0.431)−0.436 (0.473)0.219 (0.318)
Agri_educational background1.301 * (0.598)0.053 (0.492)0.652 (0.345)
Farm practices−0.595 (0.449)1.003 * (0.437)0.594 * (0.303)
Crop production0.755 (0.426)0.390 (0.447)0.330 (0.306)
Large farm0.030 (0.444)0.109 (0.471)−0.179 (0.356)
Wald chi2 (7)9.467.4011.90
Prob > chi20.2210.3880.104
Penalized log likelihood−73.999−66.968−122.947
Observations203203203
* p < 0.05.

Appendix A.4. Firth’s Penalized Logistic Regression Analysis of Factors Influencing Farmers’ Use of Various Organic Fertilizer Sources

Animal ManureSewage SludgeSewage Sludge AshesHousehold BiowasteFood Industry WasteUrban Green WasteAshes
Coef. (St. Err.)
Family farm−0.074 (0.069)0.0236 (0.784)0.361 (0.770)0.927 (0.622)0.806 (0.670)−0.195 (0.928)0.356 (0.585)
Age_>50−0.057 (0.044)−1.307 * (0.693)−1.002 (0.600)0.297 (0.376)−0.486 (0.421)−0.403 (0.485)−0.715 (0.384)
High education0.020 (0.037)−0.098 (0.419)−0.026 (0.391)0.396 (0.316)−0.021 (0.323)0.971 * (0.490)0.471 (0.336)
Agri_educational background−0.050 (0.040)0.647 (0.418)0.502 (0.396)0.287 (0.334)0.427 (0.341)0.030 (0.469)0.416 (0.358)
Farm practices0.006 (0.035)0.063 (0.399)0.185 (0.380)0.514 (0.304)0.194 (0.319)0.040 (0.400)0.041 (0.313)
Crop production0.013 (0.036)0.935 * (0.425)0.623 (0.389)0.056 (0.305)0.640 * (0.326)0.347 (0.405)−0.038 (0.316)
Large farm0.020 (0.038)0.394 (0.415)0.535 (0.389)−0.561 (0.328)0.672 * (0.335)0.248 (0.442)−0.712 * (0.335)
Wald chi2 (7)4.5611.088.8712.8710.806.8710.26
Prob > chi20.7140.3150.2620.0760.1480.4430.174
Penalized log likelihood−39.361−77.958−86.611−123.389−115.076−75.879−116.134
Observations203203203203203203203
* p < 0.05.

References

  1. Chojnacka, K.; Moustakas, K.; Witek-Krowiak, A. Bio-based fertilizers: A practical approach towards circular economy. Bioresour. Technol. 2020, 295, 122223. [Google Scholar] [CrossRef] [PubMed]
  2. European Commission. Informativni Članak o Programu Ruralnog Razvoja Republike Hrvatske za Razdoblje 2014–2020. 2023. Available online: https://agriculture.ec.europa.eu/document/download/a787bd34-d7fa-4dbd-9bf7-c7eb32935f80_hr?filename=rdp-factsheet-croatia_hr.pdf (accessed on 25 January 2025.).
  3. Food and Agriculture Organization (FAO). Bio-Based Fertilizers for Sustainable Agriculture. 2023. Available online: https://www.fao.org/3/ca5256en/ca5256en.pdf (accessed on 30 January 2025.).
  4. Javed, A.; Ali, E.; Binte Afzal, K.; Osman, A.; Riaz, S. Soil Fertility: Factors Affecting Soil Fertility, and Biodiversity Responsible for Soil Fertility. Int. J. Plant Anim. Environ. Sci. 2022, 12, 21–33. [Google Scholar] [CrossRef]
  5. Wang, Y.; Zhu, Y.; Zhang, S.; Wang, Y. What could promote farmers to replace chemical fertilizers with organic fertilizers? J. Clean. Prod. 2018, 199, 882–890. [Google Scholar] [CrossRef]
  6. Tur-Cardona, J.; Bonnichsen, O.; Speelman, S.; Verspecht, A.; Carpentier, L.; Debruyne, L.; Marchand, F.H.; Jacobsen, B.; Buysse, J. Farmers’ reasons to accept bio-based fertilizers: A choice experiment in seven different European countries. J. Clean. Prod. 2018, 197, 406–416. [Google Scholar] [CrossRef]
  7. IFA. IFA Short-Term Fertilizer Outlook. Paris. 2023. Available online: https://www.scribd.com/document/785499165/2023-Ifa-Short-Term-Outlook-Report (accessed on 12 February 2025).
  8. IFA (International Fertilizer Association). IFA Medium-Term Fertilizer Outlook. Paris. 2022. Available online: https://www.scribd.com/document/595530313/2022-Ifa-Medium-Term-Outlook-Report (accessed on 12 February 2025).
  9. FAOSTAT. Food and Agriculture Organization on the United Nations. Faostat Analytical Brief 90. Inorganic Fertilizers 2002–2022. Available online: https://openknowledge.fao.org/server/api/core/bitstreams/c0e0bb8b-3a6f-4b04-b503-99542965b3d4/content (accessed on 25 January 2025).
  10. Špicnagel, A.-M.; Đukić, B.; Crespo, D.C.; Godoy Reyes, F.A. D1.2—Report on the Market Landscape Analysis and End-User Preferences in the Project Participating EU States. 2021. Available online: https://www.fertimanure.eu/en/publication/consult/13 (accessed on 2 February 2025).
  11. Hansen, J. EU Must Get Serious About Promoting the Circular Economy [WWW Document]. 2018. Available online: https://www.theparliamentmagazine.eu/partner/article/eu-must-get-serious-about-promoting-the-circular-economy (accessed on 20 January 2025).
  12. Tröster, M.F. Assessing the Value of Organic Fertilizers from the Perspective. Agriculture 2023, 13, 1057. [Google Scholar] [CrossRef]
  13. Kurniawati, A.; Toth, G.; Ylivainio, K.; Toth, Z. Opportunities and challenges of bio-based fertilizers utilization for improving soil health. Org. Agric. 2023, 13, 335–350. [Google Scholar] [CrossRef]
  14. Gontard, N.; Sonesson, U.; Birkved, M.; Majone, M.; Bolzonella, D.; Celli, A.; Angellier-Coussy, A.; Jang, G.-W.; Verniquet, A.; Broeze, J.; et al. A research challenge vision regarding management of agricultural waste in a circular bio-based economy. Crit. Rev. Environ. Sci. Technol. 2018, 48, 614–654. [Google Scholar] [CrossRef]
  15. Shahpasand, M.R. Relationship between Awareness of Sustainable Agriculture and Fertilizer Usage by Iranian Farmers in the City of Bajestan in Khorasan Province: A Case Study. J. Agric. Sustain. 2014, 5, 104–124. [Google Scholar]
  16. European Environment Agency (EEA). Bio-Based Fertilizers and Soil Health. Available online: https://www.eea.europa.eu/ (accessed on 25 January 2025).
  17. Egan, A.; Saju, A.; Sigurnjak, I.; Meers, E.; Power, N. What are the desired properties of recycling-derived fertilisers from an end-user perspective? Clean. Responsible Consum. 2022, 5, 100057. [Google Scholar] [CrossRef]
  18. Salas, M.A.; Sica, P.; Rydgard, M.; Sitzmann, T.J.; Nyangáu, J.O.; El Mahid, J.; Moshkin, E.; de Castro e Silva, H.L.; Chrysanthopolous, S.; Kopp, C.; et al. Current challenges on the widespread adoption of new bio-based fertilizers: Insights to move forward toward more circular food systems. Front. Sustain. Food Syst. 2024, 8, 1386680. [Google Scholar] [CrossRef]
  19. Nigade, D.D.; Kamble, V.B.; Dhulgand, V.G. Knowledge and Adoption of Bio-Based Fertilizers by the Sugarcane Growers; Contemporary Research in India: Solapur, India, 2017; Volume 7. [Google Scholar]
  20. Mishra, P.; Dash, D. Rejuvenation of biofertilizer for sustainable agriculture and economic development. Cons. J. Sustain. Dev. 2014, 11, 41–61. [Google Scholar]
  21. Bodake, H.D.; Gaikwad, S.P.; Shirke, V.S. Study of constraints faced by the farmers in adoption of bio-fertilizers. Int. J. Agric. Sci. 2009, 5, 292–294. [Google Scholar]
  22. Malarkodi, M.; Bharathi, K. Strategies for Promoting Biofertilizers among Farmers for Sustainable Agriculture. Agric. Update 2010, 5, 29–31. [Google Scholar]
  23. Ammar, E.E.; Aioub, A.A.; Elesawy, A.E.; Karkour, A.M.; Mouhamed, M.S.; Amer, A.A.; El-Shershaby, N.A. Algae as Bio-fertilizers: Between current situation and future prospective. Saudi J. Biol. Sci. 2022, 29, 3083–3096. [Google Scholar] [CrossRef]
  24. Puga, A.P.; Grutzmacher, P.; Cerri, C.E.P.; Ribeirinho, V.S.; de Andrade, C.A. Biochar-based nitrogen fertilizers: Greenhouse gas emissions, use efficiency, and maize yield in tropical soils. Sci. Total Environ. 2020, 704, 135375. [Google Scholar] [CrossRef]
  25. Sigurnjak, I.; Michels, E.; Crappé, S.; Buysens, S.; Tack, F.M.; Meers, E. Utilization of derivatives from nutrient recovery processes as alternatives for fossil-based mineral fertilizers in commercial greenhouse production of Lactuca sativa L. Sci. Hortic. 2016, 198, 267–276. [Google Scholar] [CrossRef]
  26. Case, S.D.C.; Oelofse, M.; Houb, Y.; Oenema, O.; Jensena, L.S. Farmer perceptions and use of organic waste products as fertilisers—A survey study of potential benefits and barriers. Agric. Syst. 2017, 151, 84–95. [Google Scholar] [CrossRef]
  27. Martinez, J.; Dabert, P.; Barrington, S.; Burton, C. Livestock waste treatment 724 systems for environmental quality, food safety, and sustainability. Bioresour. Technol. 2009, 100, 5527–5536. [Google Scholar] [CrossRef]
  28. Regulation (EU) 2019/1009 of the Europena Parlament and of the Council. Available online: https://eur-lex.europa.eu/eli/reg/2019/1009/oj/eng (accessed on 1 April 2025).
  29. Council Directive 91/676/EEC of 12 December 1991 Concerning the Protection of Waters Against Pollution Caused by Nitrates from Agricultural Sources. Available online: https://eur-lex.europa.eu/eli/dir/1991/676/oj/eng (accessed on 1 April 2025).
  30. European Comission. Circular Economy Action Plan. 2023. Available online: https://environment.ec.europa.eu/strategy/circular-economy-action-plan_en (accessed on 1 April 2025).
  31. European Comission. Green Deal. Available online: https://commission.europa.eu/strategy-and-policy/priorities-2019-2024/european-green-deal_en (accessed on 1 April 2025).
  32. European Comission. Farm to Fork Strategy. Available online: https://food.ec.europa.eu/horizontal-topics/farm-fork-strategy_en (accessed on 1 April 2025).
  33. Fertilizer Act (Official Gazette NN 39/2023). Available online: https://narodne-novine.nn.hr/clanci/sluzbeni/2023_04_39_672.html (accessed on 1 April 2025).
  34. Regulation on Use of Sewage Sludge in Agriculture (Official Gazette NN 38/2008). Available online: https://narodne-novine.nn.hr/clanci/sluzbeni/2008_04_38_1307.html (accessed on 1 April 2025).
  35. Regulation on the Protection of Agricultural Land from Pollution. (Official Gazette NN 71/2019). Available online: https://narodne-novine.nn.hr/clanci/sluzbeni/2019_07_71_1507.html (accessed on 1 April 2025).
  36. Regulation on the Content of the Action Program for the Protection of Waters from Pollution by Nitrates from Agriculture (Official Gazette NN 72/2021). Available online: https://narodne-novine.nn.hr/clanci/sluzbeni/2021_06_72_1355.html (accessed on 1 April 2025).
  37. Act Amending the Agricultural Land (Official Gazette NN 52/2022). Available online: https://narodne-novine.nn.hr/clanci/sluzbeni/2022_05_57_806.html (accessed on 1 April 2025).
  38. Kurniawati, A.; Stankovics, P.; Shafiyuddin Hilmi, Y.; Toth, G.; Smol, M.; Toth, Z. Understanding the future of bio-based fertilisers: The EU’s policy and implementation. Sustain. Chem. Clim. Action 2023, 3, 100033. [Google Scholar] [CrossRef]
  39. Hefer, H.; Andrišić, M.; Zegnal, I.; Rašić, D.; Halter, J.; Lončarić, Z. Kemijska svojstva tala i tumačenje klasa opskrbljenosti (Soil chemical properties and interpretation of supply classes). In Zbornik Sažetaka 56. Hrvatski i 16. Međunarodni Simpozij Agronoma; Rozman, V., Antunović, Z., Eds.; Fakultet agrobiotehničkih znanosti Sveučilišta Josipa Jurja Strossmayera u Osijeku: Osijek, Croatia, 2021; pp. 18–19. [Google Scholar]
  40. Agency for Payments in Agriculture, Fisheries and Rural Development (APPRRR). Farmer’s Register for 2024. Available online: https://www.apprrr.hr/upisnik-poljoprivrednika/ (accessed on 20 January 2025).
  41. Državni Zavod za Statistiku (DZS). Površina Ekološkog Korištenoga Poljoprivrednog Zemljišta po Kategorijama u Hektarima, HR NUTS 3 (HR_NUTS 2021.) PC-Axis Baze Podataka. Available online: https://web.dzs.hr/PXWeb/Selection.aspx?px_tableid=EP22.px&px_path=Poljoprivreda,%20lov,%20%c5%a1umarstvo%20i%20ribarstvo__Ekolo%c5%a1ka%20poljoprivreda&px_language=hr&px_db=Poljoprivreda,%20lov,%20%c5%a1umarstvo%20i%20ribarstvo&rxid=3d41be5c-23b0-4265-b34c-7cea71b55d98 (accessed on 16 January 2025).
  42. Šošić, I.; Serdar, V. Uvod u Statistiku; Školska knjiga: Zagreb, Hrvatska, 2002. [Google Scholar]
  43. Suhas, S.; Manjunatha, N.; Kumar, C.N.; Benegal, V.; Rao, G.N.; Varghese, M.; Gururaj, G. Firth’s penalized logistic regression: A superior approach for analysis of data from India’s National Mental Health Survey, 2016. Indian J. Psychiatry 2023, 65, 1208–1213. [Google Scholar] [CrossRef]
  44. Xu, X.; Du, H.; Lian, Z. Discussion on regression analysis with small determination coefficient in human-environment researches. Indoor Air 2022, 32, e13117. [Google Scholar] [CrossRef] [PubMed]
  45. Moshkin, E.; Garmendia Lemus, S.; Bamelis, L.; Buysse, J. Assessment of willingness-to-pay for bio-based fertilisers among farmers and agricultural advisors in the EU. J. Clean. Prod. 2023, 414, 137548. [Google Scholar] [CrossRef]
  46. Kvakkestad, V.; Brod, E.; Flø, B.E.; Hanserud, O.; Helgesen, H. Circulation of nutrients through bio-based fertilizer products: Perspectives from farmers, suppliers, and civil society. Front. Sustain. Food Syst. 2023, 7, 1239353. [Google Scholar] [CrossRef]
  47. Buysse, J.; Cardona, J.T. Economics of biobased products and their mineral counterparts. In Biorefinery of Inorganics; Meers, E., Velthof, G., Michels, E., Rietra, R., Eds.; John Wiley & Sons, Ltd.: Hoboken, NJ, USA, 2020; pp. 311–328. [Google Scholar]
  48. Lima, P.D.M.; Aronsson, H.; Strand, L.; Björs, M.; Pantelopoulos, A. Farmers’ perceptions on organic fertilisers towards circularity–a case study in Sweden. Acta Agric. Scand. Sect. B—Soil Plant Sci. 2024, 74, 2290247. [Google Scholar] [CrossRef]
  49. Hills, K.; Yorgey, G.; Cook, J. Demand for bio-based fertilizers from dairy manure in Washington State: A small-scale discrete choice experiment. Renew. Agric. Food Syst. 2020, 36, 207–214. [Google Scholar] [CrossRef]
  50. Kragt, M.E.; Dempster, F.; Subroy, V. Black soldier fly fertilisers by bioconversion of livestock waste: Farmers’ perceptions and willingness-to-pay. J. Clean. Prod. 2023, 411, 137271. [Google Scholar] [CrossRef]
  51. Rachmah, M.A.; Darwanto, D.H.; Mulyo, J.H. Farmers’ Willingness to Pay for Bio-slurry Fertilizer in Central Java. Agro Èkon. 2018, 31, 121–134. [Google Scholar] [CrossRef]
  52. Ruzzante, S.; Labarta, R.; Bilton, A. Adoption of agricultural technology in the developing world: A meta-analysis of the empirical literature. World Dev. 2021, 146, 105599. [Google Scholar] [CrossRef]
  53. Amare, D.; Darr, D. Can a sequential analysis provide a more robust understanding of farmers’ adoption decisions? An example from an agroforestry adoption study in Ethiopia. For. Policy Econ. 2023, 153, 102997. [Google Scholar] [CrossRef]
Figure 1. Satisfaction with the current supply of fertilizers on the market.
Sustainability 17 03367 g001
Figure 2. Willingness to use bio-based fertilizers as they have a positive effect on soil quality.
Sustainability 17 03367 g002
Figure 3. Cost of annual fertilization per hectare on the farm.
Sustainability 17 03367 g003
Figure 4. Percent of farmers willing to pay for bio-based fertilizers in relation to mineral fertilizers.
Sustainability 17 03367 g004
Figure 5. Feeling informed about biofertilizers (regulations, certification, inspection, costs, profits, etc.).
Sustainability 17 03367 g005
Table 1. Summarized descriptive statistics of the most important socio-demographic and farm-related variables included in the models.
VariableDescriptionMeanSTDMinMax
Family farm=1 if the respondent describes the business as a family farm; =0 otherwise.0.930.2501
Age_>50=1 if the age of the respondent is higher than 50 years; =0 otherwise.0.190.3901
High education=1 if the respondent has a university degree; =0 otherwise.0.390.4901
Agri_educational background=1 if the respondent has an agricultural background; =0 otherwise.0.280.4501
Farm_practices=1 if the respondent’s agricultural practices are organic, in transition and sustainable; =0 otherwise.0.620.4901
Crop production=1 if the respondent is active in food and feed crop production and horticultural production; =0 otherwise.0.560.5001
Large farm=1 if the respondent’s farm is larger than 10 ha; =0 otherwise.0.330.501
Table 2. Fertilizer categories most used on the farm.
Percentage
Mineral (inorganic) fertilizers32.84%
Manure30.75%
Organic fertilizers21.49
Organic–mineral fertilizers5.67%
Tailor-made fertilizers2.99%
Bio-based fertilizers (e.g., digestate)2.09%
Other2.09%
Smart fertilizers1.49%
Animal by-product/manure from the farm0.60%
Table 3. Problems with the fertilizer currently used.
Percentage
Yes, fertilizer causes soil issues.10.34%
Yes, concentrations of nutrients in the product(s) that are available on the market are too low.14.29%
No, I am satisfied with the current fertilizers on the market.71.43%
Other.3.94%
Table 4. Farmer’s willingness to try new types of fertilizers.
Percentage
Yes, if they were cheaper than the mineral fertilizers I currently use.37.93%
Yes, if they were cheaper than the organic fertilizers I currently use.12.32%
Yes, if the fertilizer benefits are clearly explained (effect of fertilizers on soil structure, nutrient form, etc.).20.20%
Yes, if they had better nutrition/fertilization values than standard mineral fertilizers.14.29%
No, I would like to continue using existing mineral and/or organic fertilizers.15.27%
Table 5. Willingness to accept bio-based fertilizers from different sources.
VariableMeanSDMinMaxMedian
Animal manure3.600.71144
Urban green waste3.310.92144
Ashes2.861.02143
Household biowaste2.321.12142
Food industry waste2.081.00142
Sewage sludge ashes1.740.89141
Sewage sludge1.720.90141
Table 6. Willingness to pay more for bio-based and environmentally friendly fertilizer.
Percentage
Yes, I am willing to pay more.8.87%
Yes, I am willing to pay more if the quality of the fertilizer is better than that of the one I use.47.78%
No, I am not willing to pay more.36.45%
No, I am not convinced of the efficacy of bio-based fertilizers.6.40%
No, I am not convinced of the safety of bio-based fertilizers.0.49%
Table 7. Obstacle for using BBFs.
Percentage
Financial/economic effect53.28%
Technical equipment for application of BBFs28.69%
Legislative framework10.66%
Import/export restriction on bio-based products7.38%
Table 8. Regression analysis of farmers’ willingness to adopt and pay more for bio-based fertilizers.
VariableModel 1Model 2Model 3
Coef. (St. Err.)
Family farm−0.036 (0.103)−0.137 (0.097)−0.134 (0.142)
Age_>500.008 (0.066)0.051 (0.062)−0.087 (0.091)
High education−0.038 (0.056)−0.044 (0.052)0.053 (0.076)
Agri_educational background0.141 * (0.059)0.011 (0.055)0.155 (0.080)
Farm practices−0.069 (0.053)0.117 * (0.050)0.145 * (0.073)
Crop production0.097 (0.054)0.045 (0.051)0.080 (0.074)
Large farm0.0001 (0.057)0.015 (0.053)−0.042 (0.078)
R-squared0.0580.0460.065
Adj R-squared0.0240.0120.032
Observations203203203
* p < 0.05.
Table 9. Regression analysis of factors influencing farmers’ use of various organic fertilizer sources.
Animal ManureSewage SludgeSewage Sludge AshesHousehold BiowasteFood Industry WasteUrban Green WasteAshes
Coef. (St. Err.)
Family farm−0.074 (0.069)0.045 (0.107)0.067 (0.114)0.223 (0.142)0.178 (0.136)−0.039 (0.104)0.078 (0.137)
Age_>50−0.057 (0.044)−0.147 * (0.069)−0.132 (0.073)0.071 (0.091)−0.103 (0.087)−0.048 (0.067)−0.162 (0.088)
High education0.020 (0.037)−0.021 (0.058)−0.010 (0.061)0.097 (0.077)−0.009 (0.073)0.117 * (0.056)0.105 (0.074)
Agri_educational background−0.050 (0.040)0.099 (0.061)0.084 (0.064)0.068 (0.080)0.099 (0.077)0.006 (0.059)0.091 (0.077)
Farm practices0.006 (0.035)0.009 (0.055)0.030 (0.058)0.124 (0.073)0.044 (0.070)0.005 (0.053)0.009 (0.070)
Crop production0.013 (0.036)0.131 * (0.055)0.099 (0.059)0.014 (0.074)0.142 * (0.070)0.051 (0.054)−0.011 (0.071)
Large farm0.020 (0.038)0.056 (0.059)0.087 (0.063)−0.135 (0.078)0.152 * (0.075)0.039 (0.057)−0.162 * (0.075)
R-squared0.0250.0650.0510.0710.0600.0400.055
Adj R-squared−0.0090.0310.0170.0380.0270.0060.021
Observations203203203203203203203
* p < 0.05.
Disclaimer/Publisher’s Note: The statements, opinions and data contained in all publications are solely those of the individual author(s) and contributor(s) and not of MDPI and/or the editor(s). MDPI and/or the editor(s) disclaim responsibility for any injury to people or property resulting from any ideas, methods, instructions or products referred to in the content.

