
Exploring the Industrial Heat Island Effects and Key Influencing Factors in the Guangzhou–Foshan Metropolitan Area


Abstract
1. Introduction
2. Materials and Methods
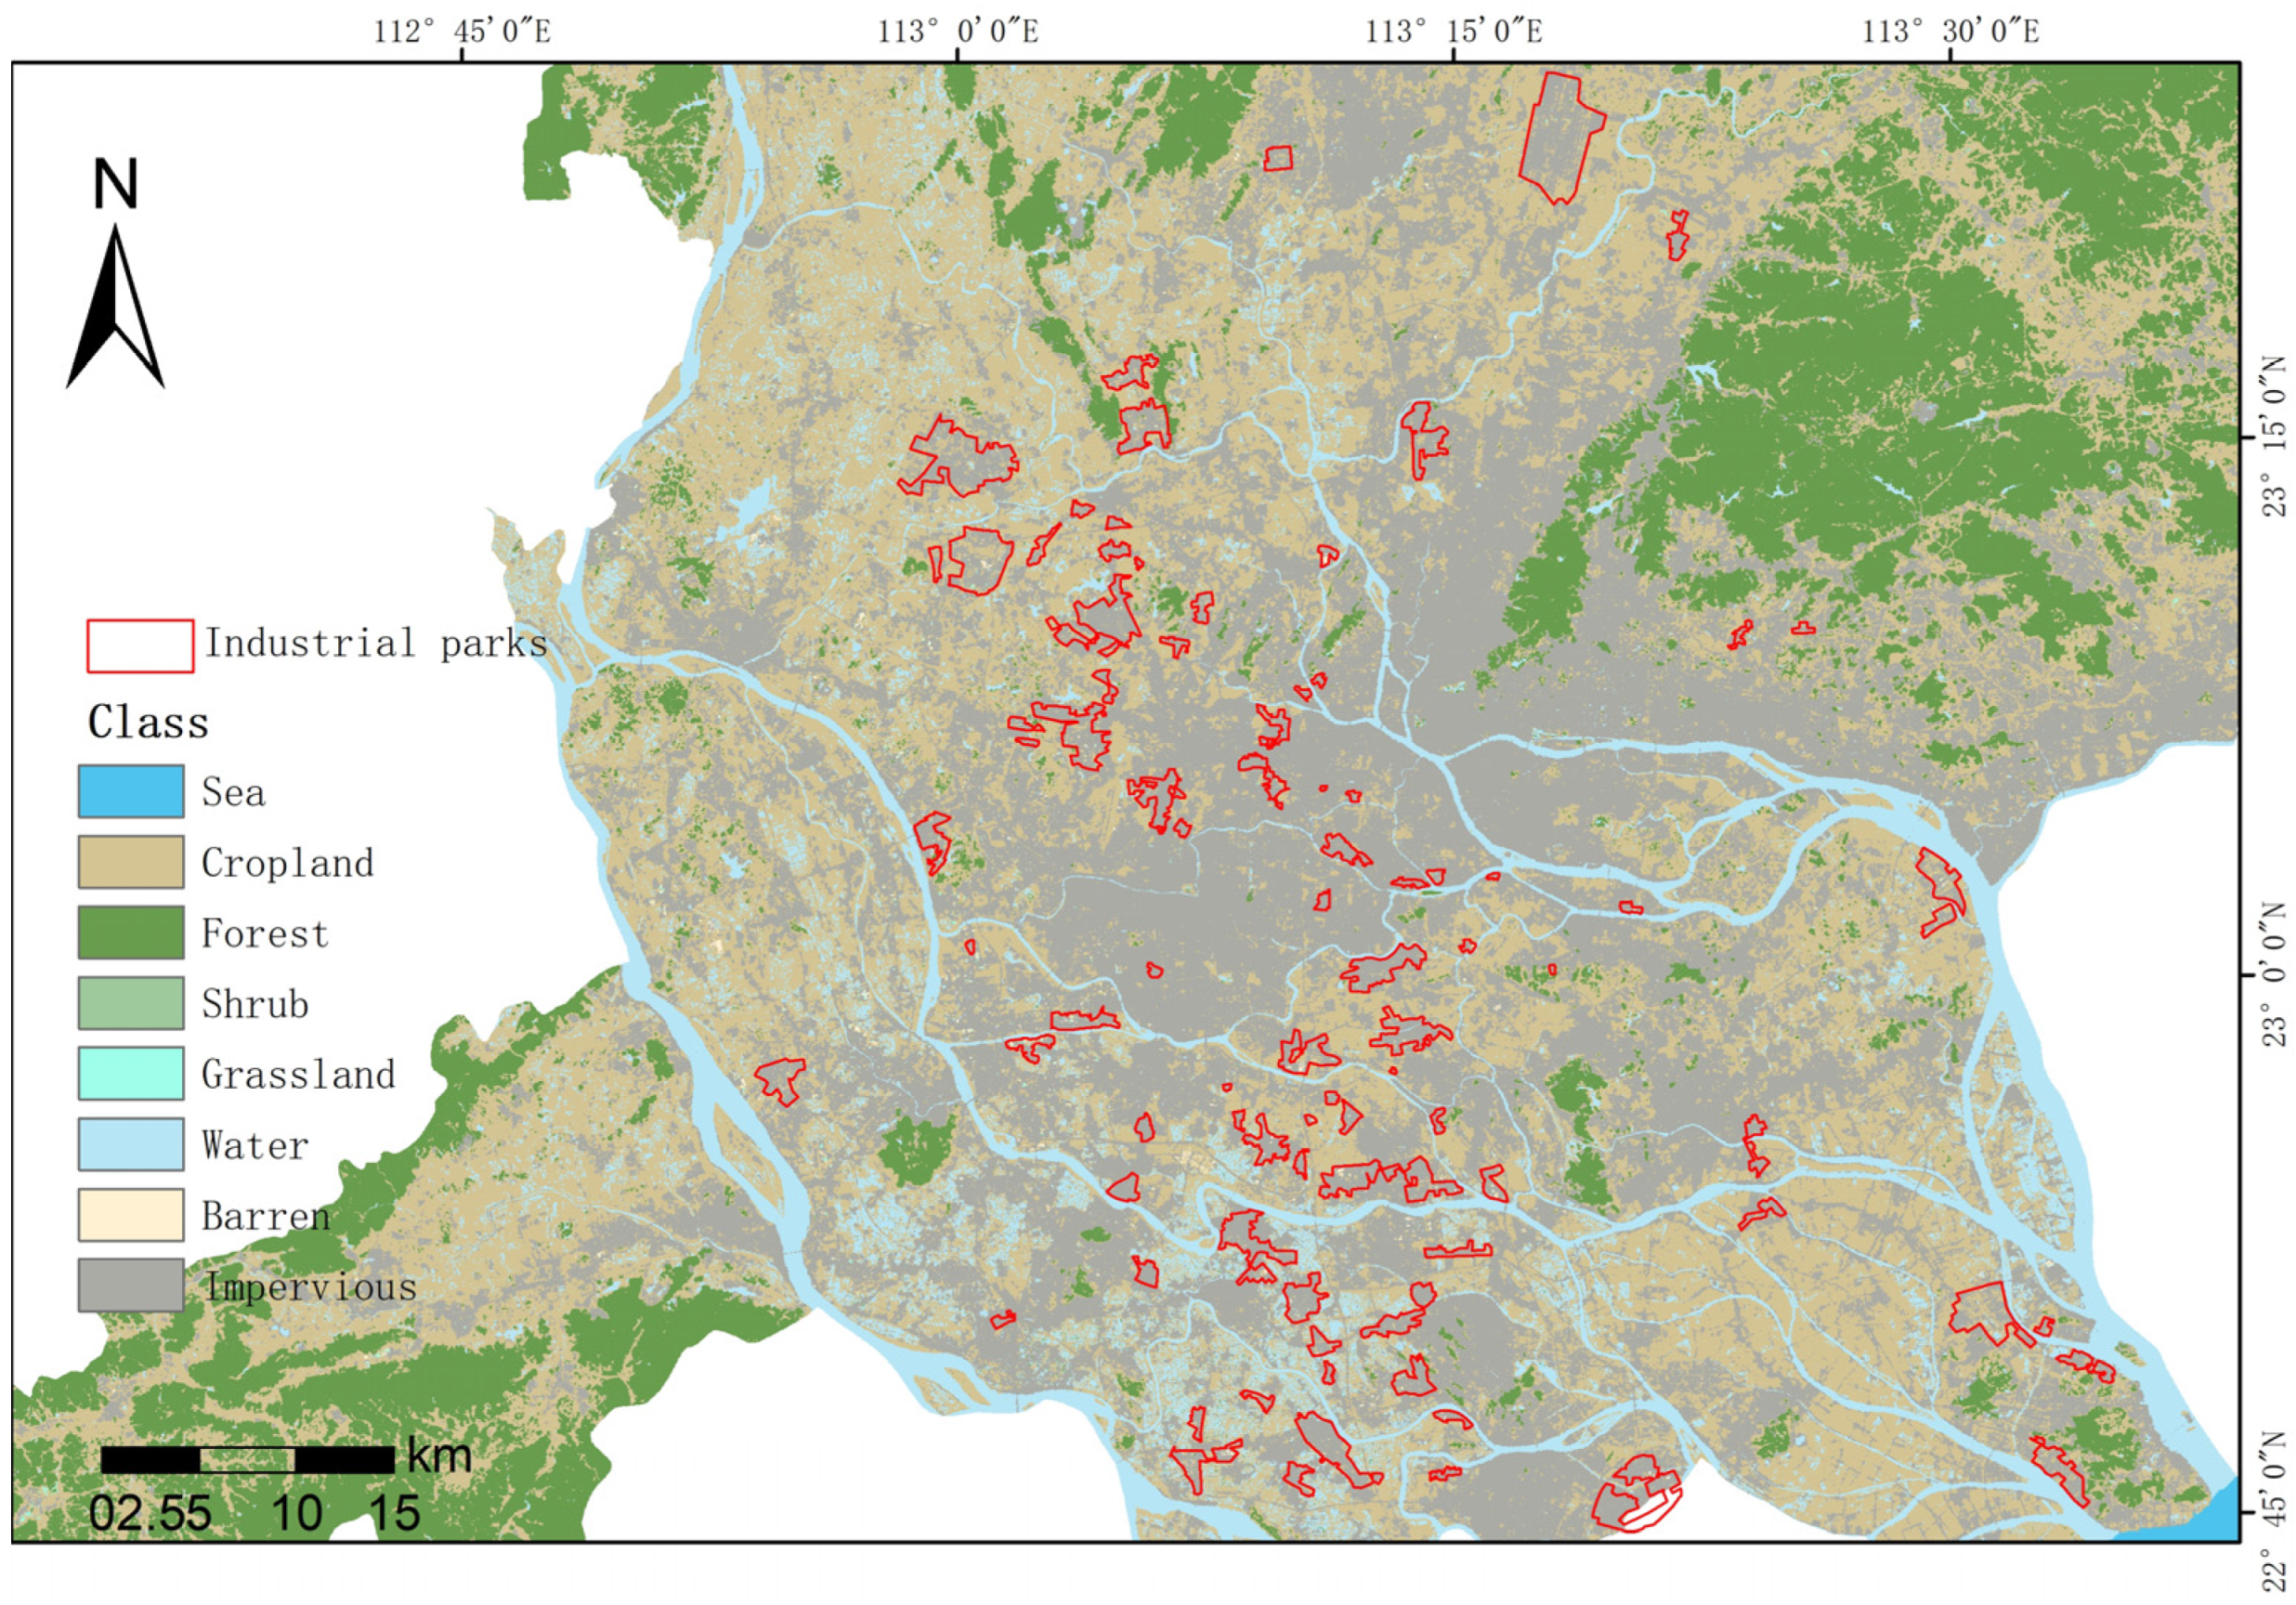
2.1. Study Area
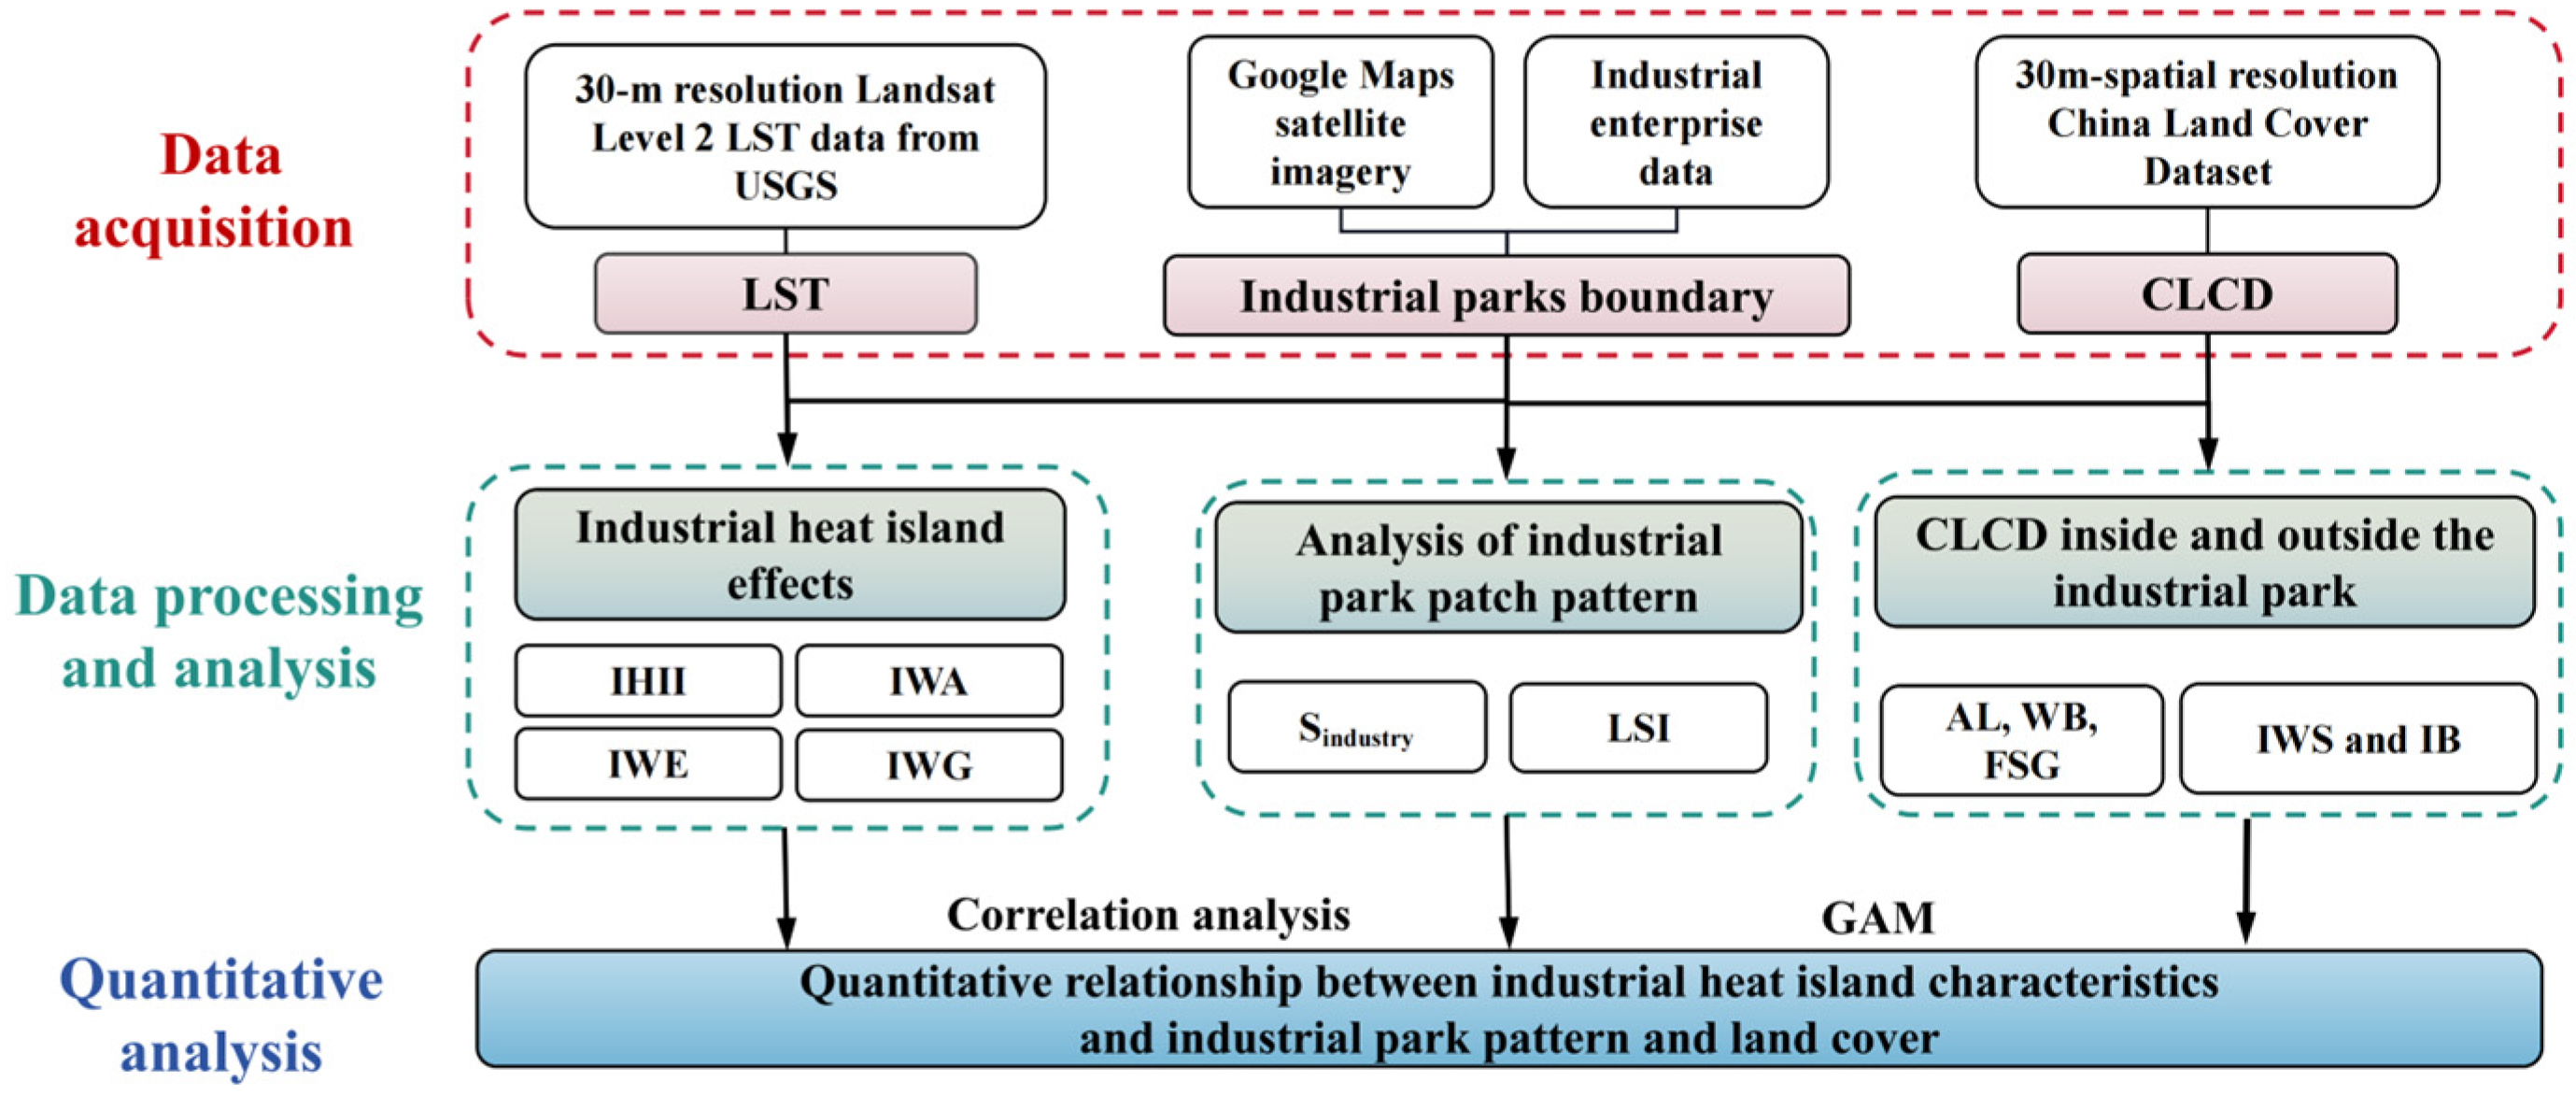
2.2. Data Source
2.3. Methods
2.3.1. Classification of Urban Surface Thermal Environment
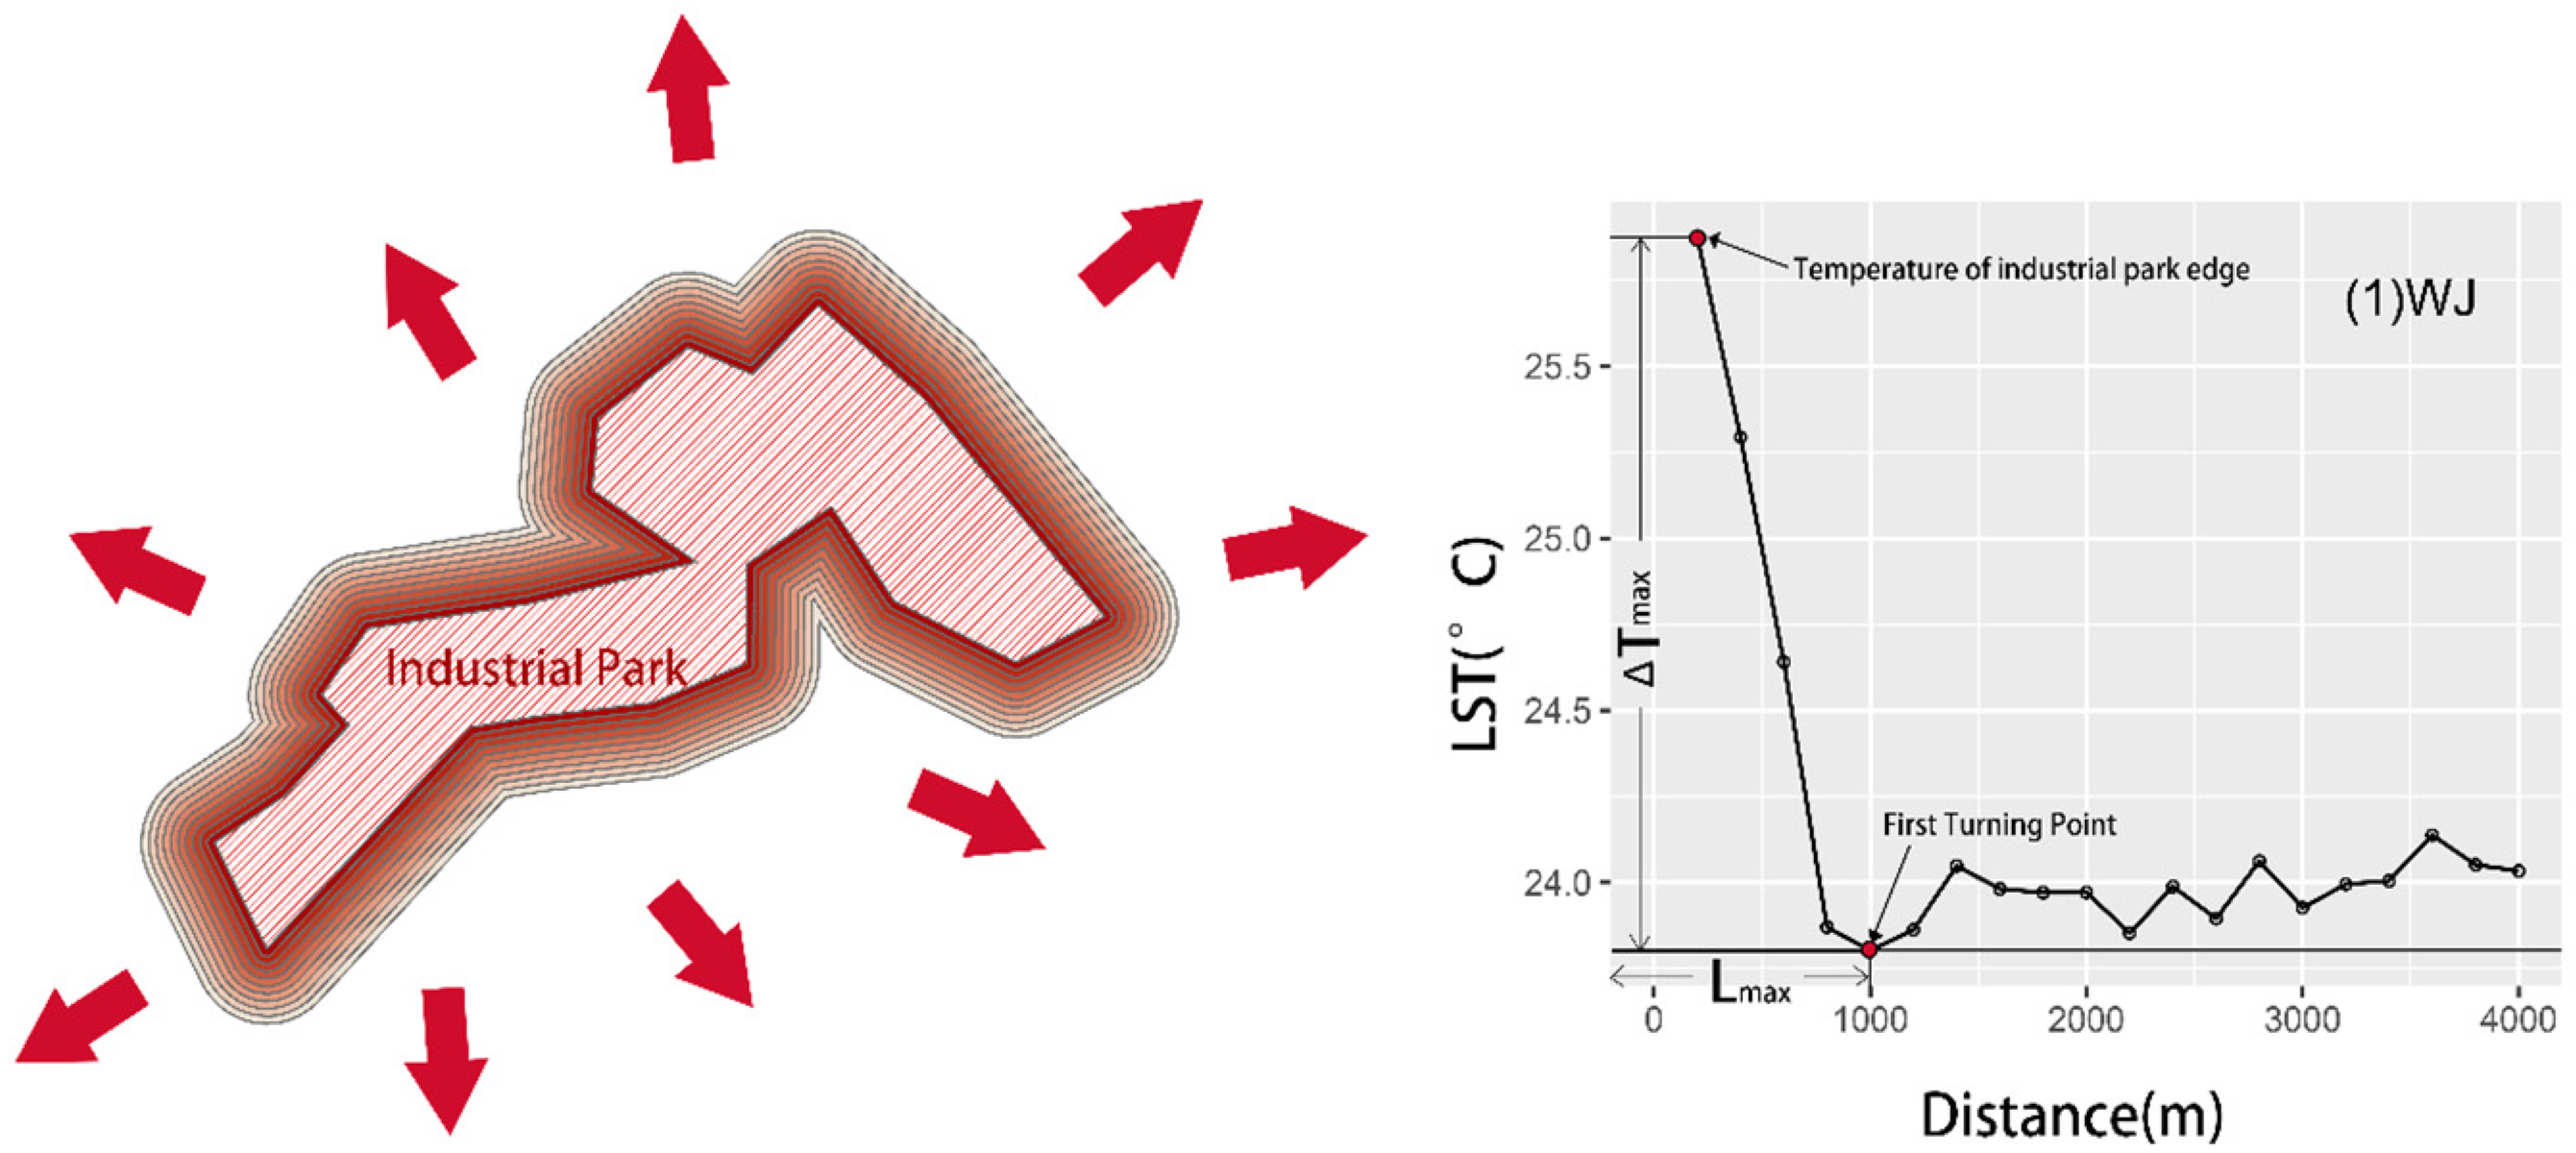
2.3.2. Quantifying the Industrial Heat Islands (IHIs) Effect
2.3.3. Potential Explanatory Factors
2.3.4. Generalized Additive Model (GAM) Application
3. Results
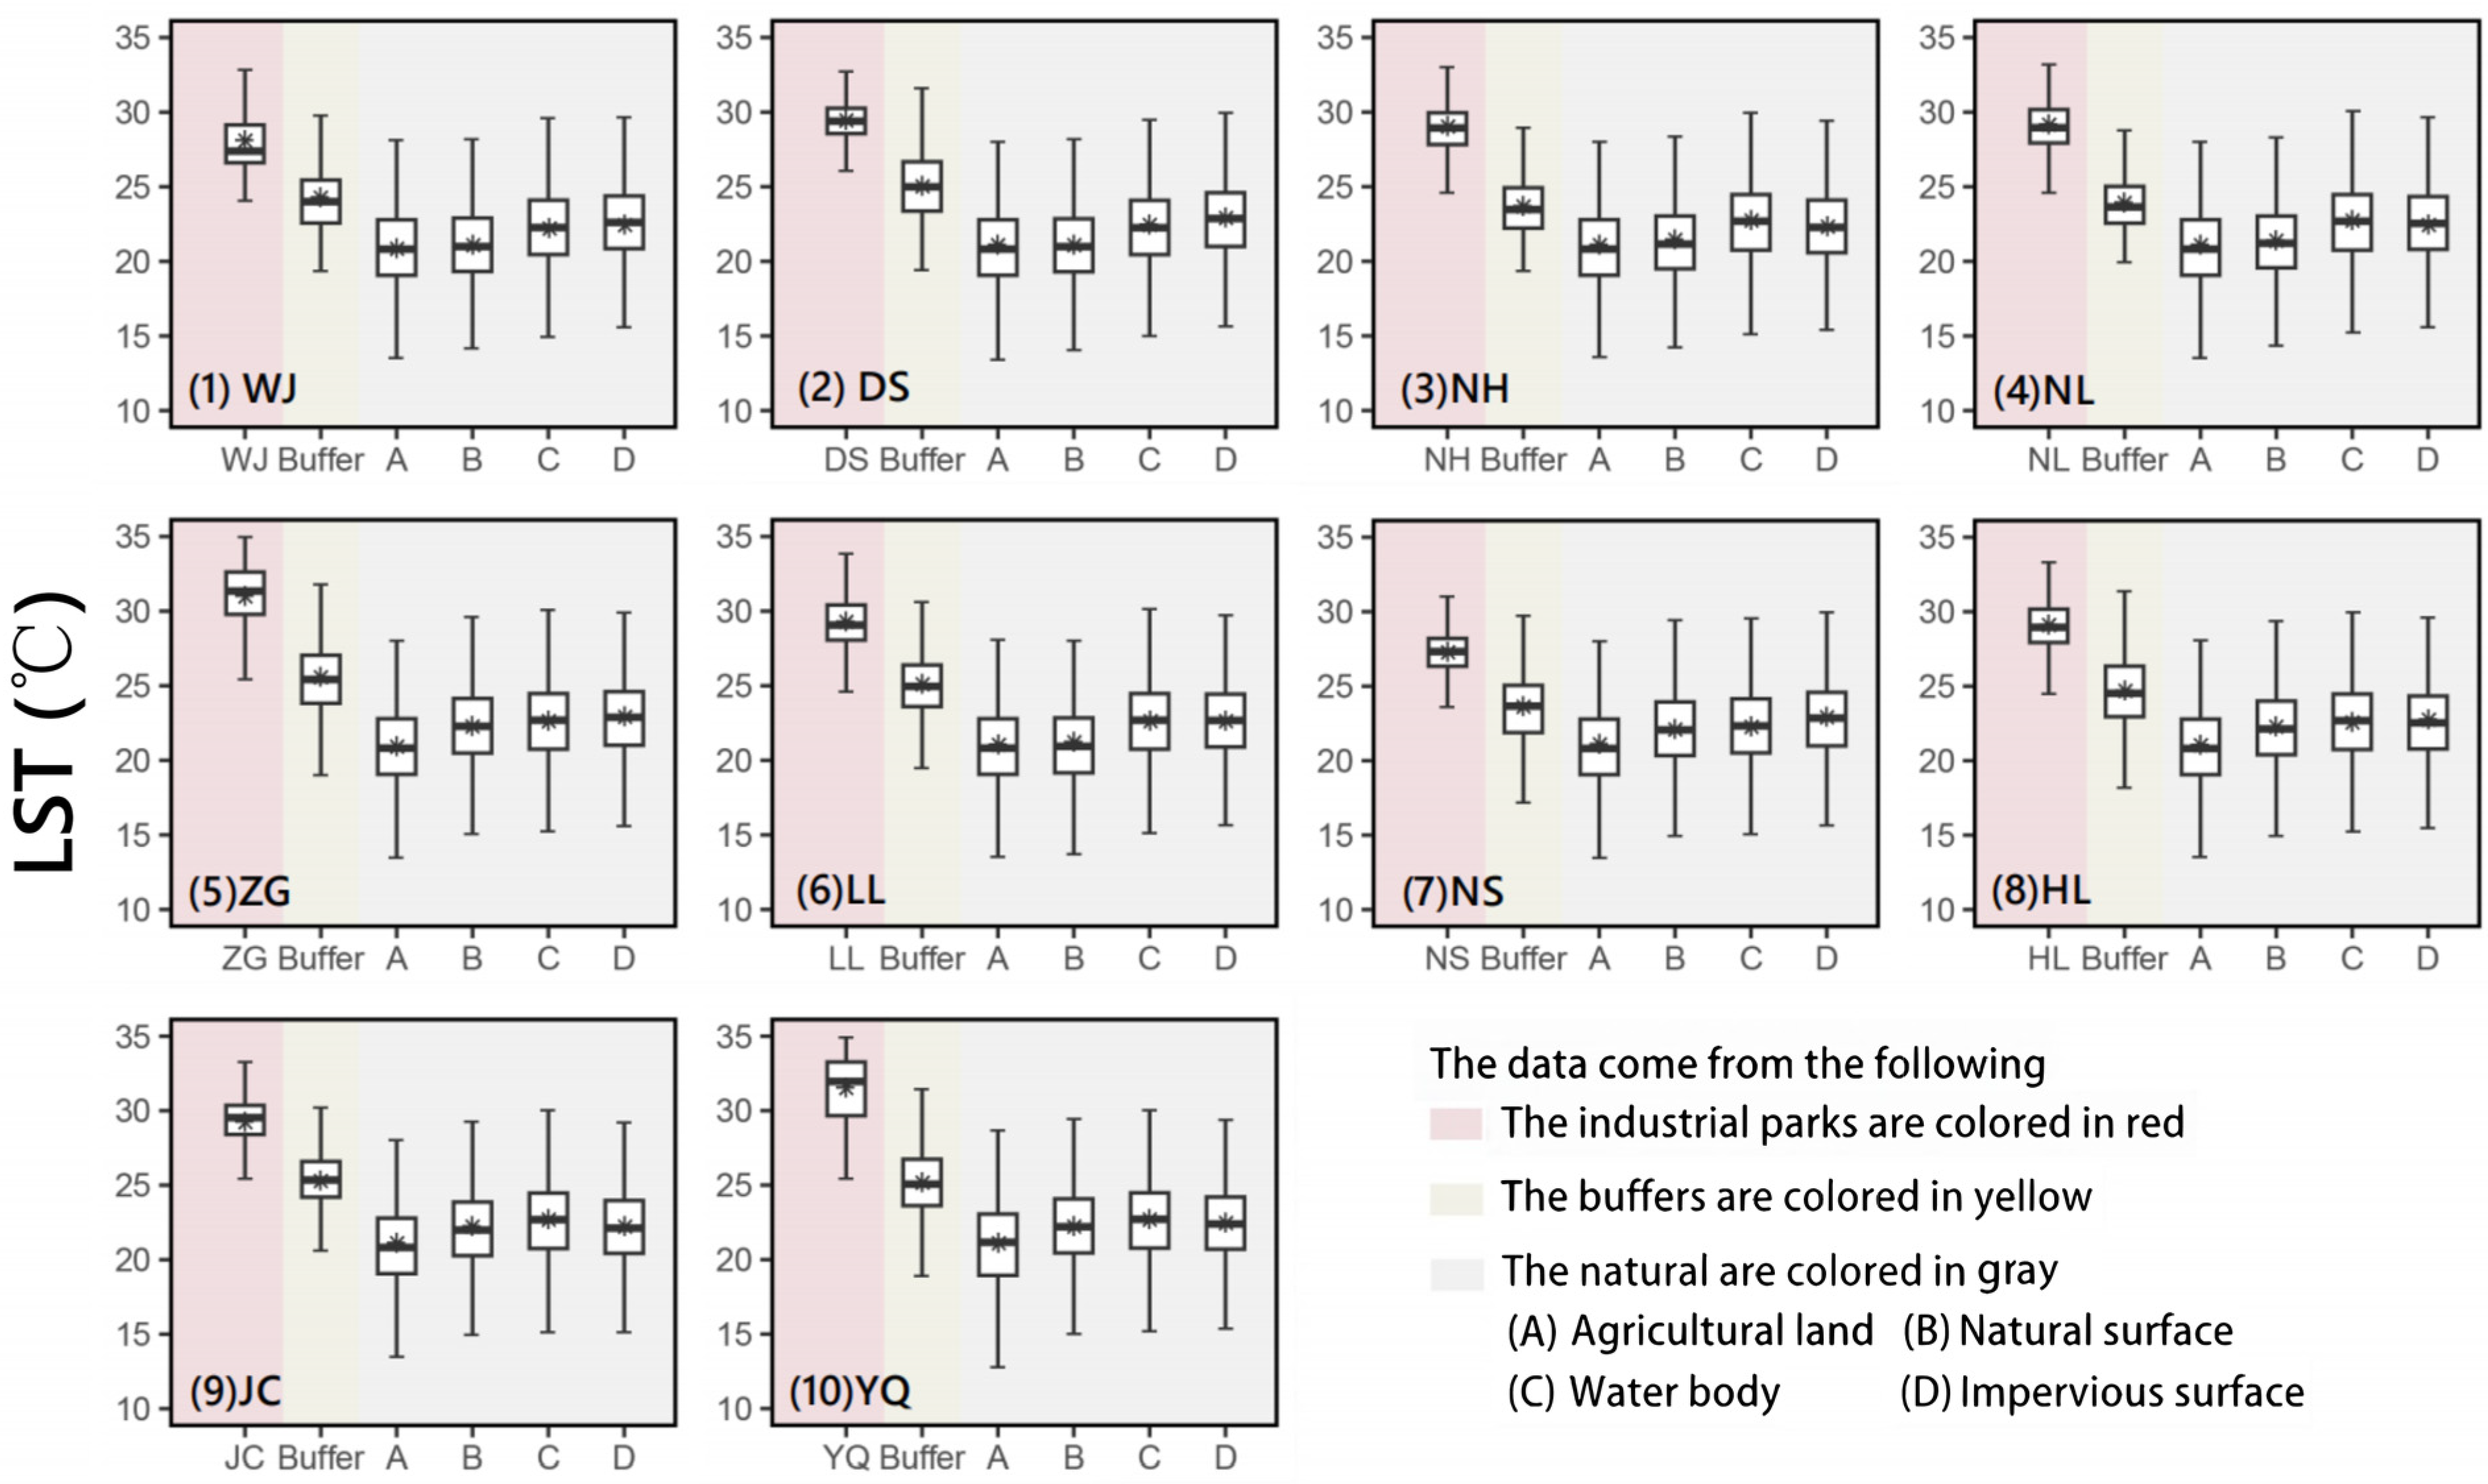
3.1. Impact of Industrial Parks on the Urban Thermal Environment
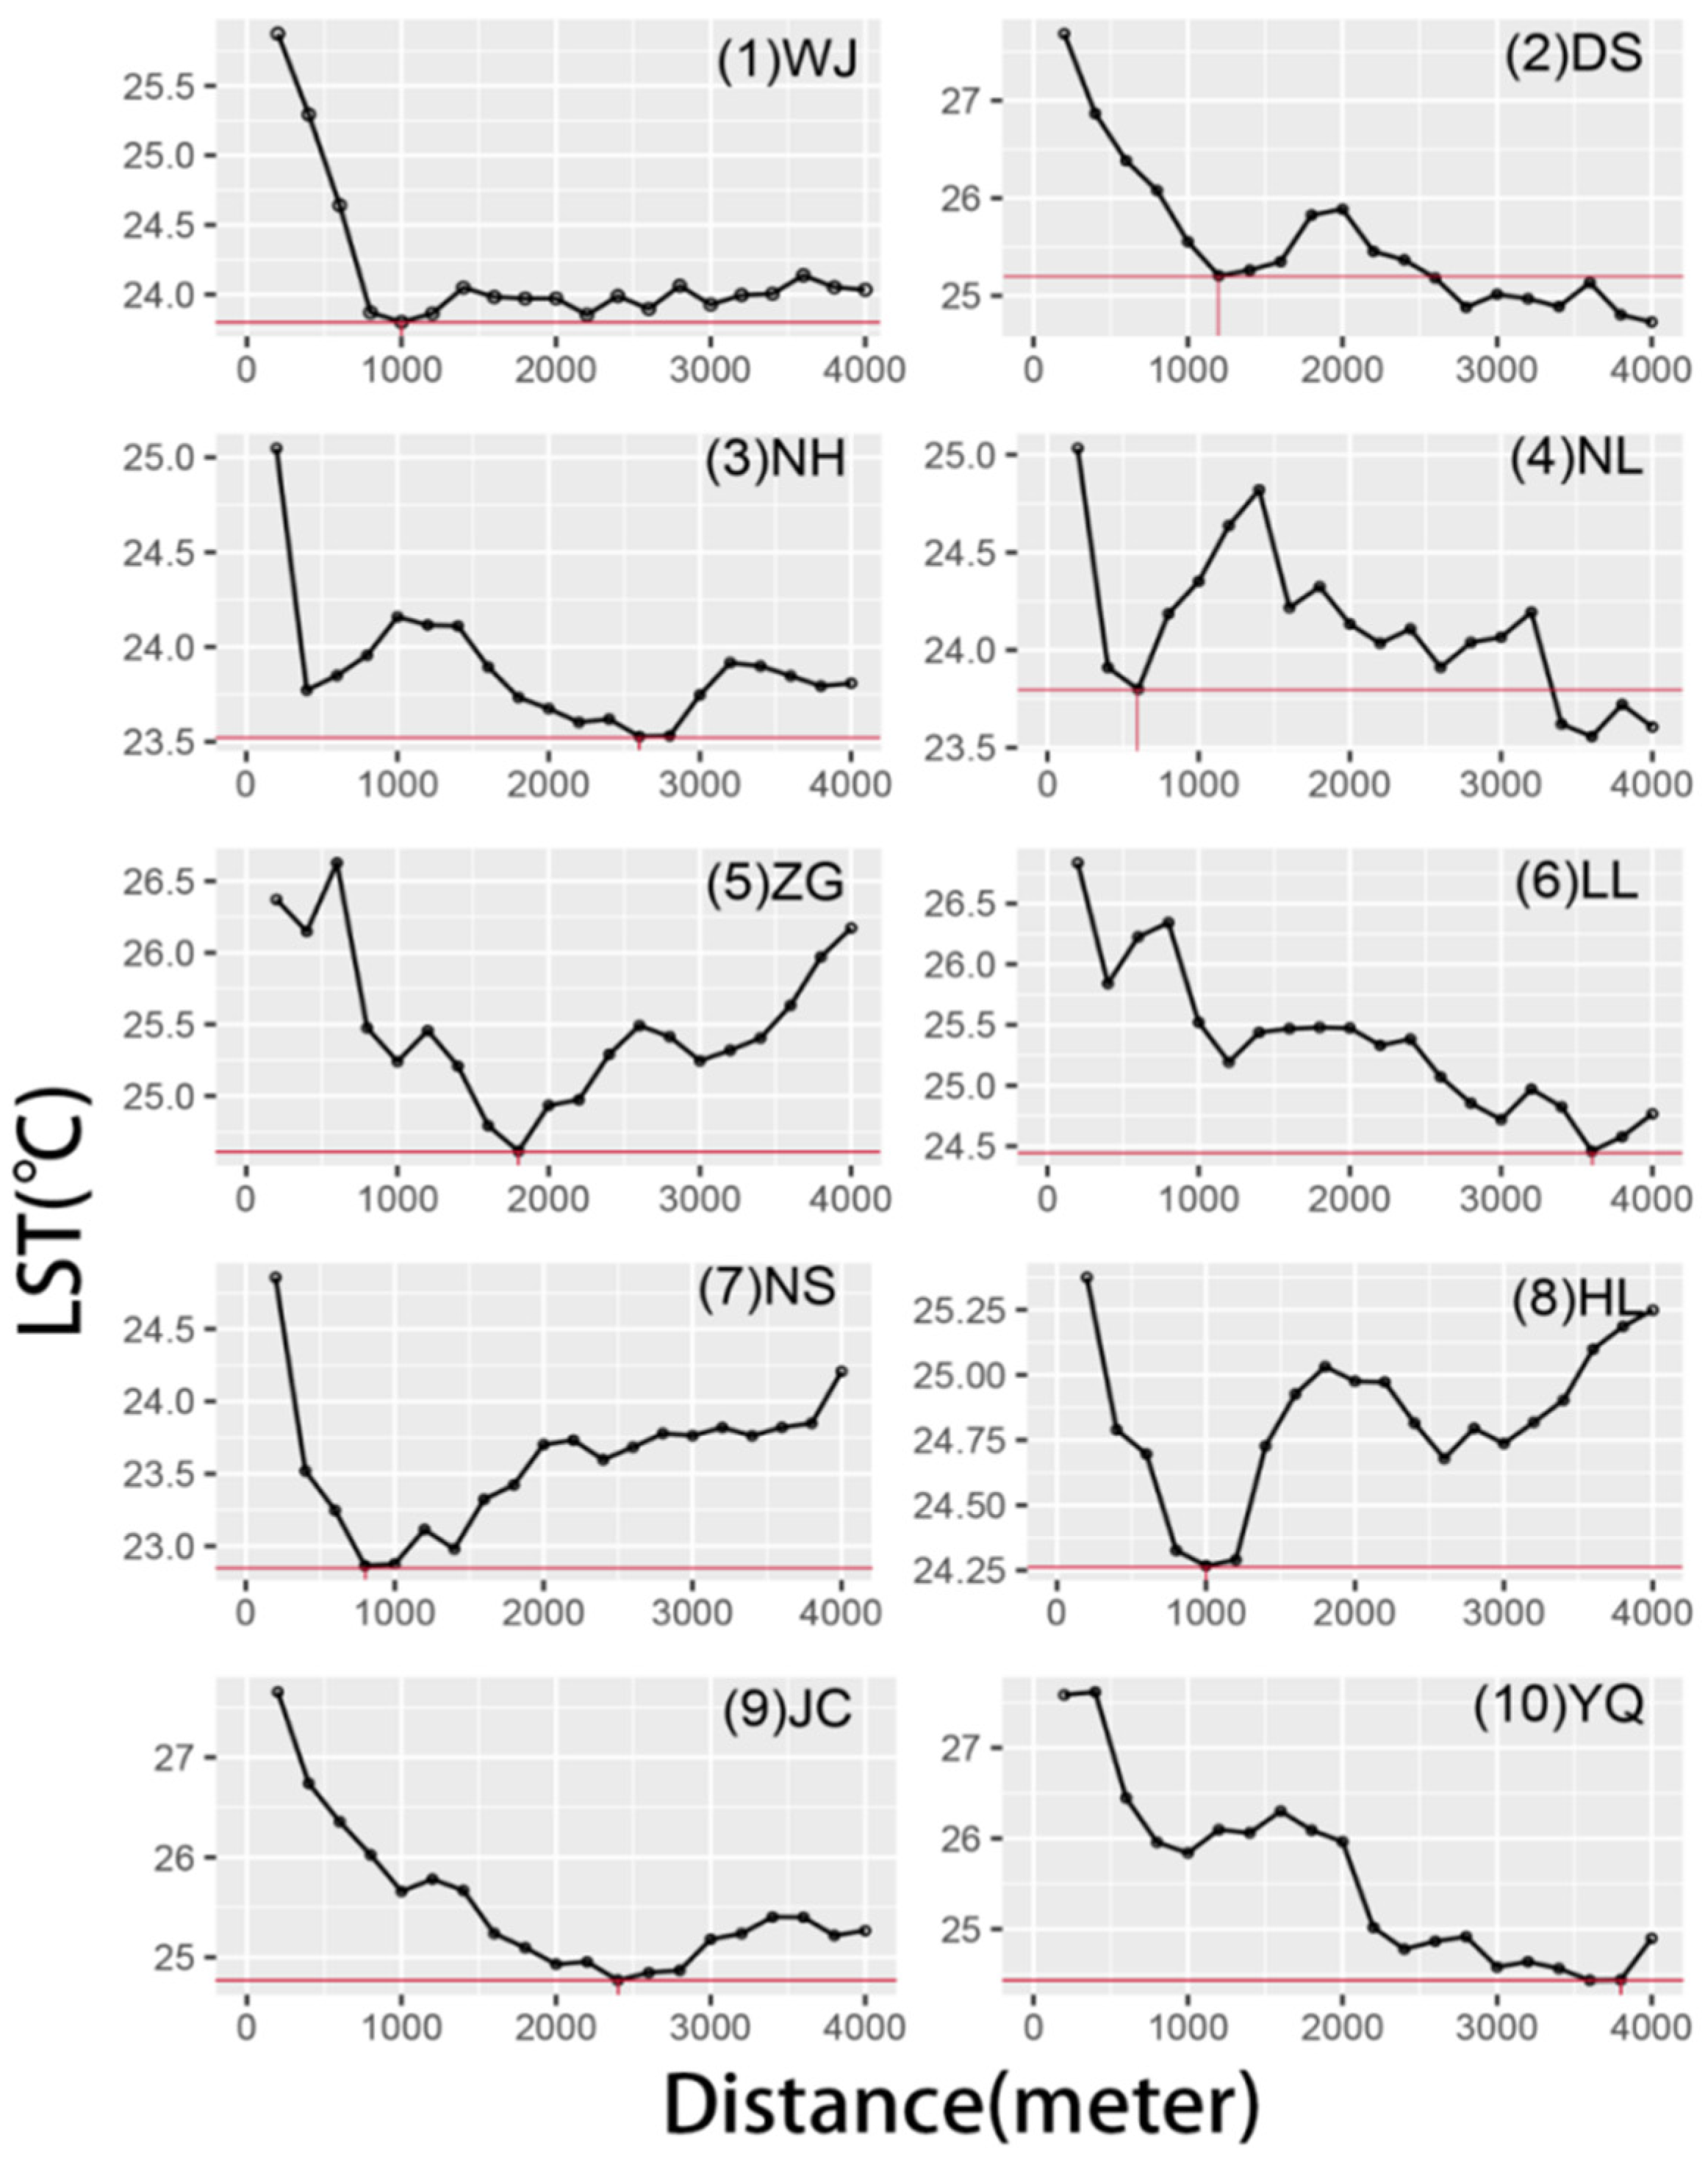
3.2. Industrial Heat Island Effects
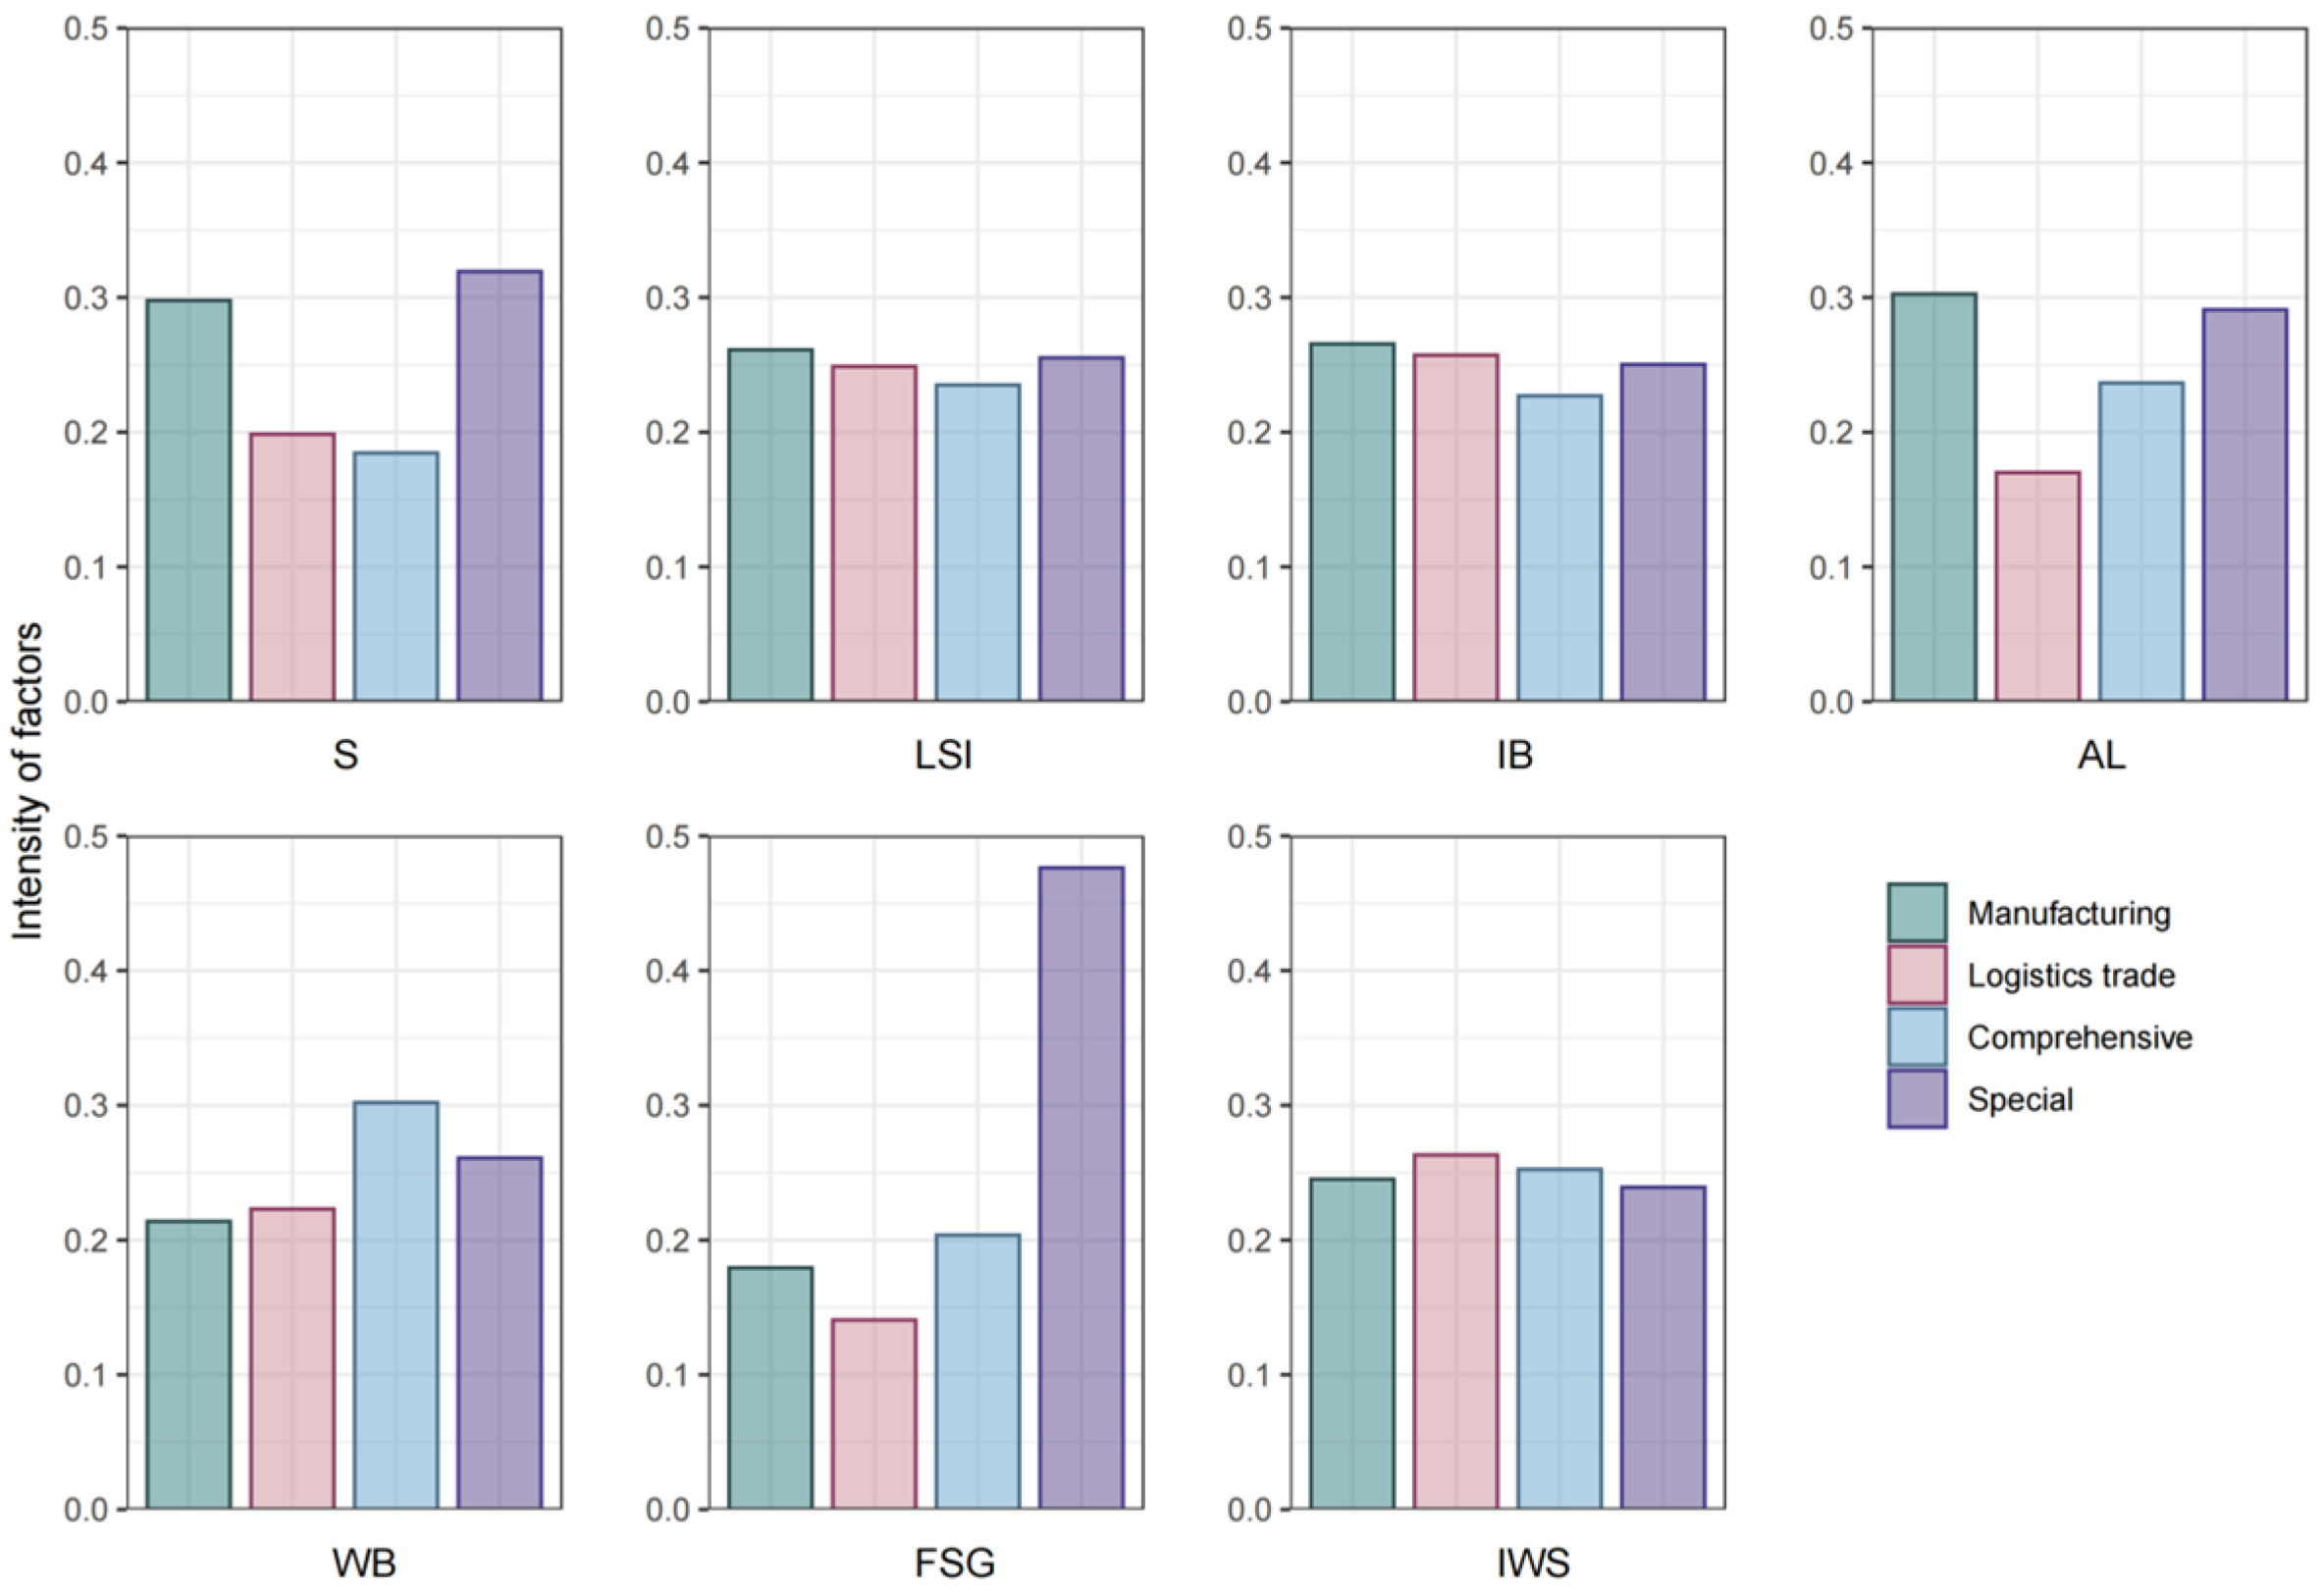
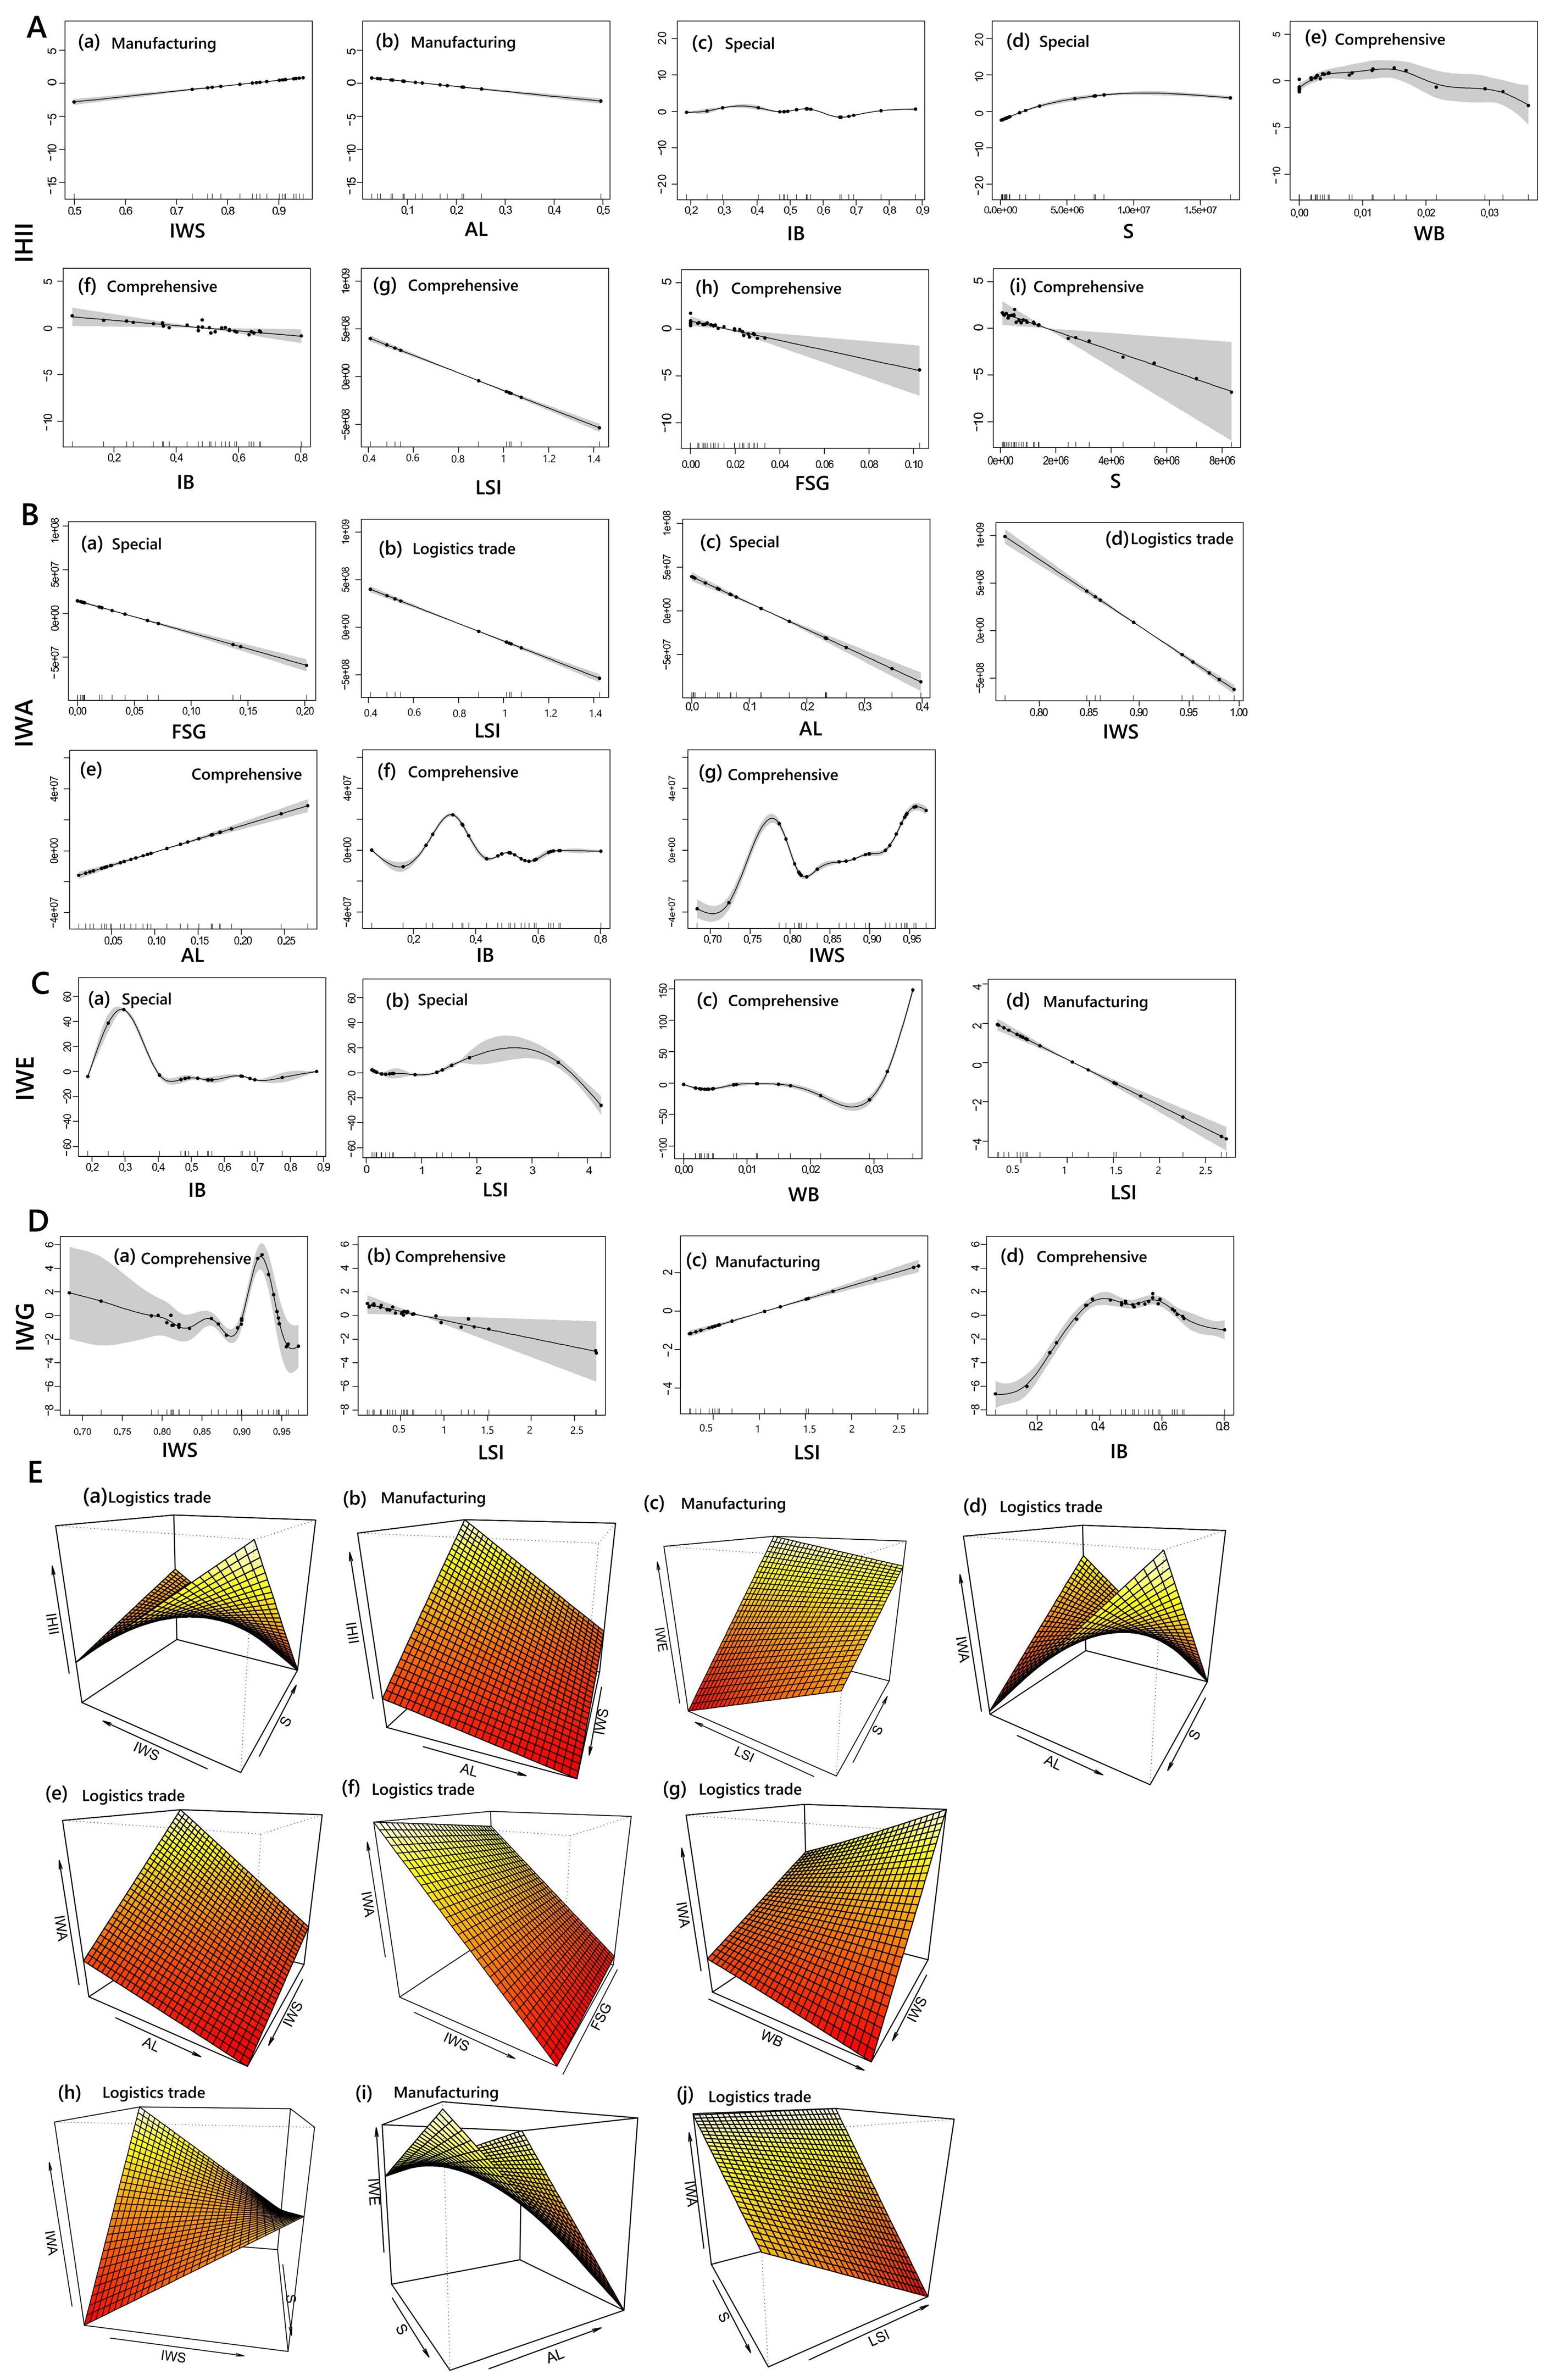
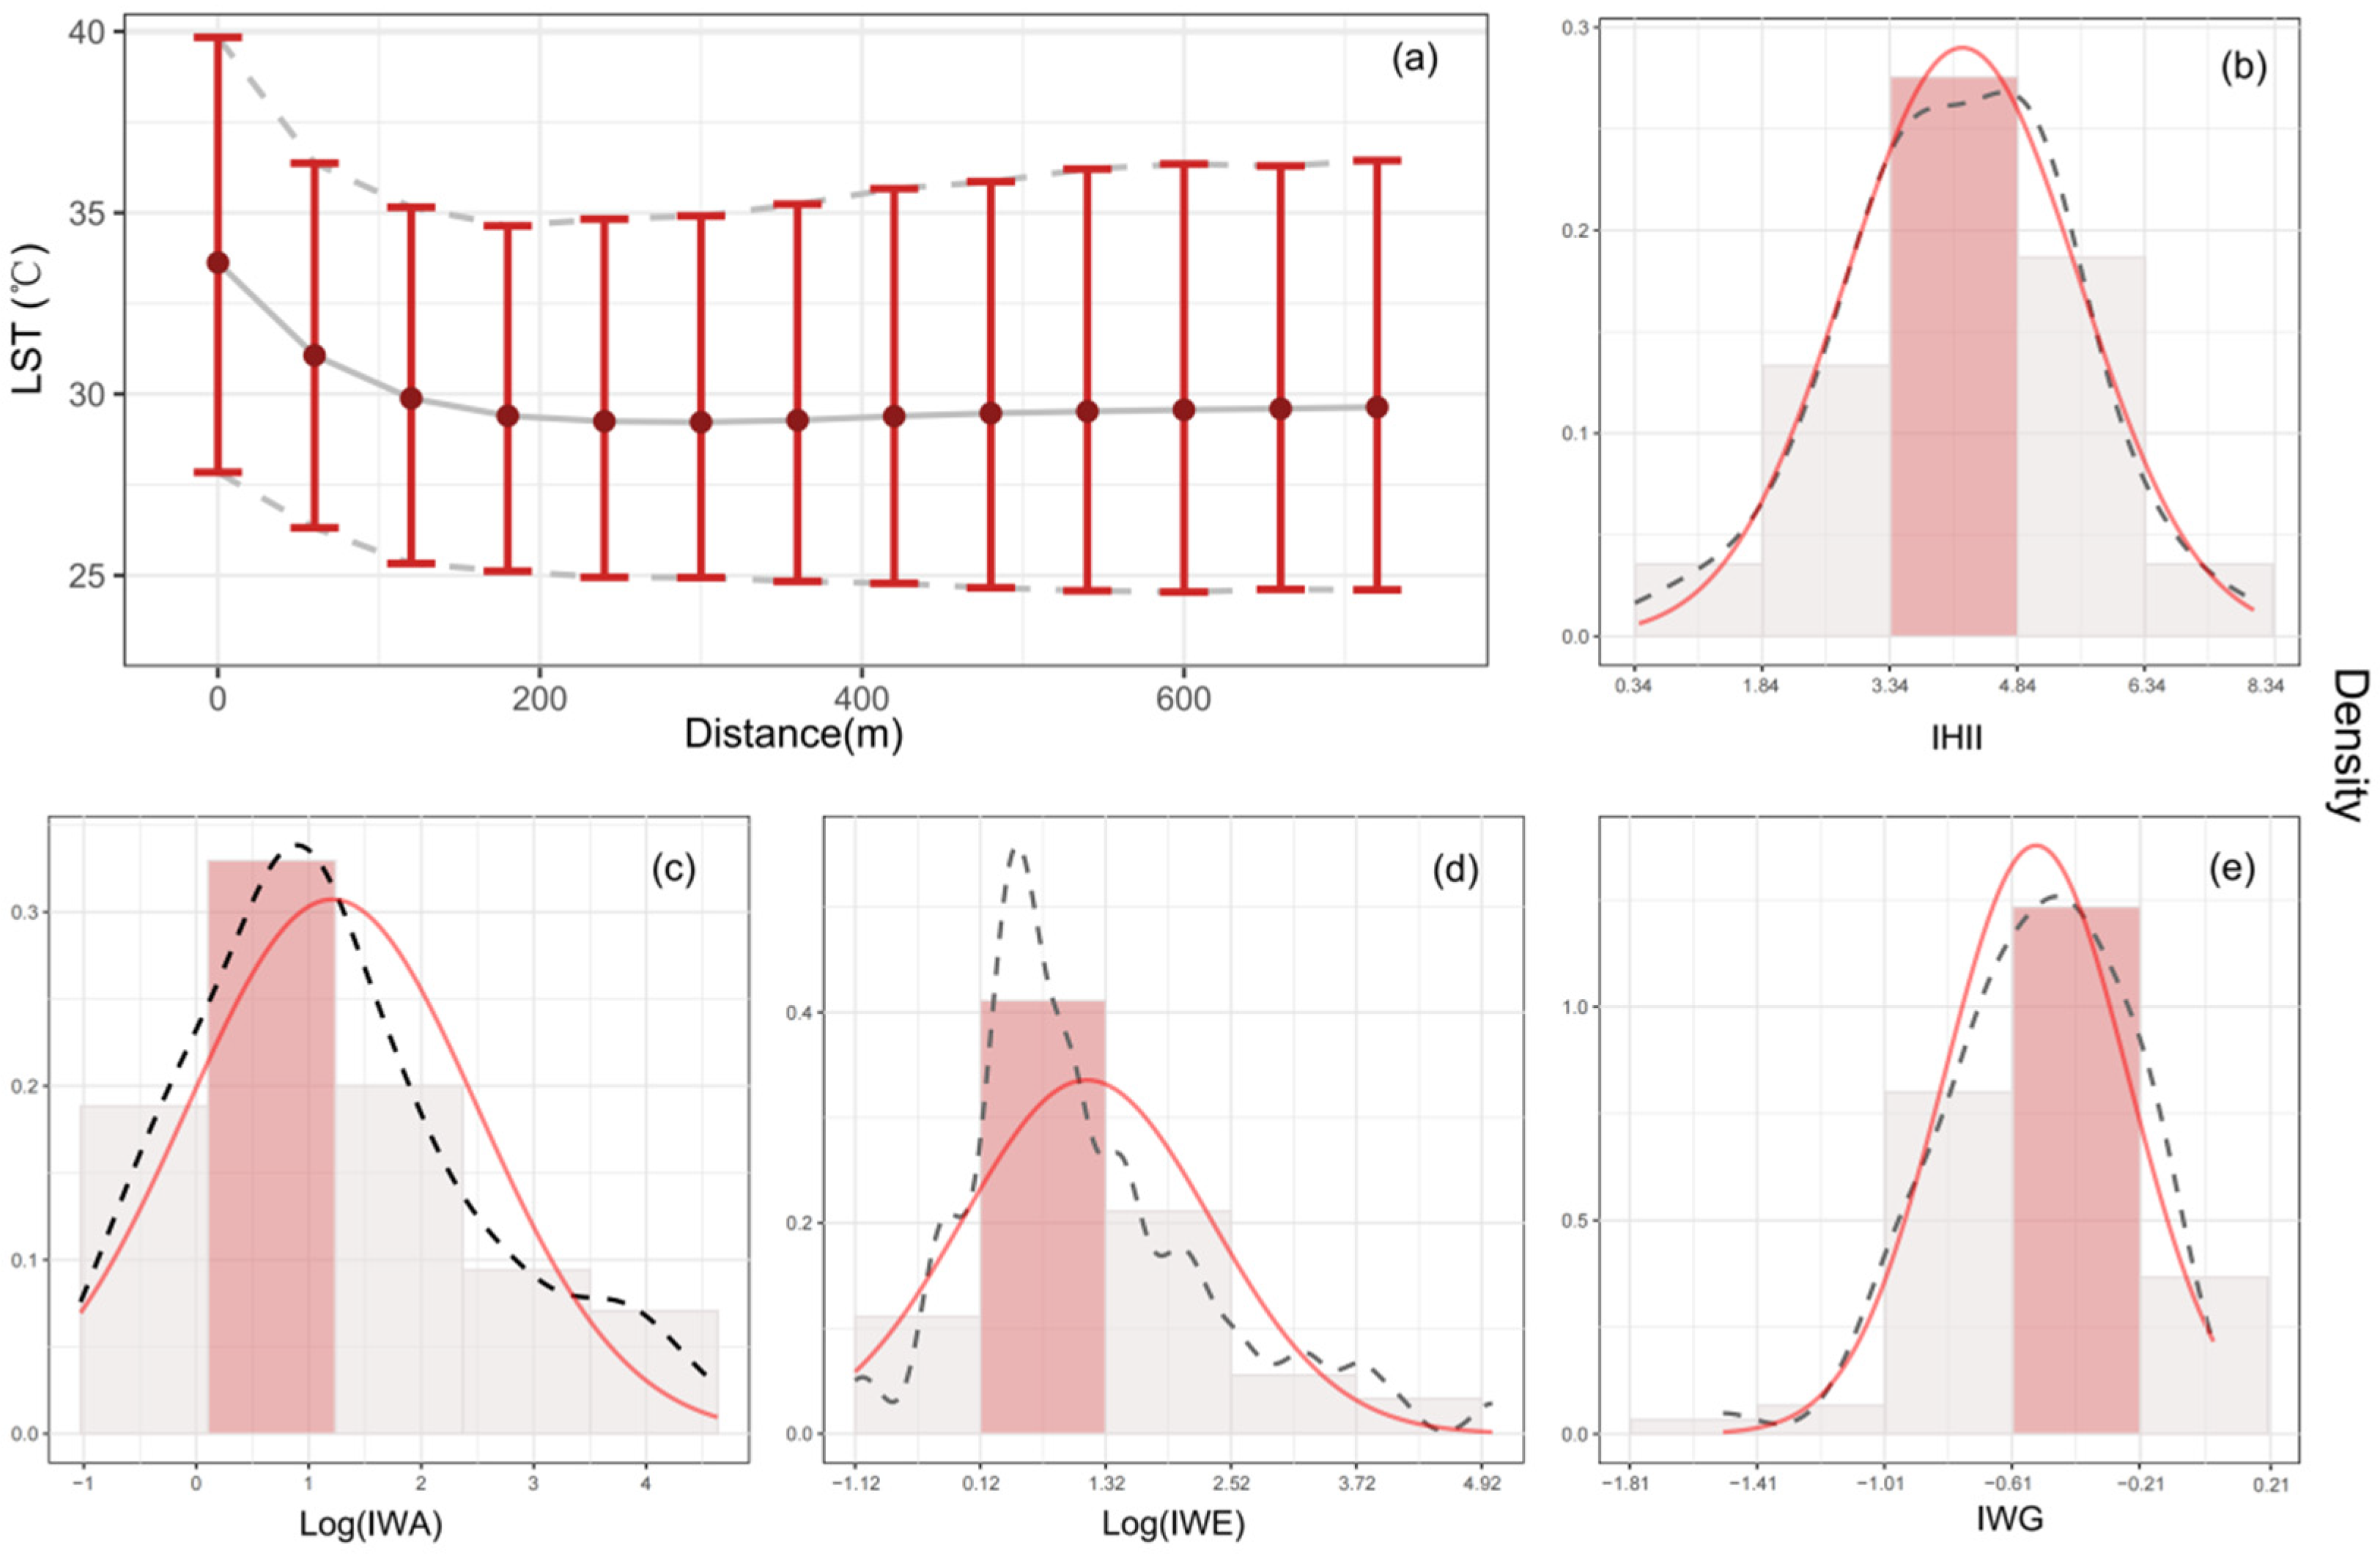
3.3. Drivers of the Industrial Heat Island Effects
4. Discussion
4.1. Dominant Driving Factors of IHIs Vary by Park Type
4.2. Implication for the Urban Management and Planning
4.3. Study Limitations and Ideas for Future Research
4.4. Limitations of Using LST as a Proxy for Surface Heat Intensity
5. Conclusions
Author Contributions
Funding
Institutional Review Board Statement
Informed Consent Statement
Data Availability Statement
Acknowledgments
Conflicts of Interest
Abbreviations
| UHI | Urban Heat Island |
| UHII | Urban Heat Island Intensity |
| IHIE | Industrial Heat Island Effect |
| GFMA | Guangzhou–Foshan Metropolitan Area |
| GAM | Generalized Additive Model |
| LST | Land Surface Temperature |
| IHII | Industrial Heat Island Intensity |
| IWA | Industrial Warming Area |
| IWE | Industrial Warming Efficiency |
| IWG | Industrial Warming Gradient |
| IHI | Industrial Heat Island |
| LSI | Landscape Shape Index |
| IWS | Impervious Water Surface |
| IB | Internal Building Land |
| S | Park Area |
| AL | Arable Land |
| WB | Water Body |
| FSG | Forest, Shrub and Grass Land |
| PRD | Pearl River Delta |
| PRDMR | Pearl River Delta Metropolitan Region |
| USGS | United States Geological Survey |
| CLCD | China Land Cover Dataset |
| LUC | Land Use And Cover |
| CBRA | China Building Roof Area Dataset |
Appendix A

| Park Type | Park Name | Main Business |
|---|---|---|
| Manufacturing | BSC | Hardware (aluminum), electrical appliances, plastic, textile, more comprehensive |
| LT | Plastic-based, electronic, and hardware | |
| JY | Hardware, mechanical machinery factory, hardware innovation center | |
| CJX | Main hardware, secondary plastic | |
| LH | Hardware, electronics | |
| XYKJ | Main hardware, plastic | |
| SC | Main hardware, electrical appliances | |
| HGB | Hardware (aluminum), rubber and plastic | |
| HLF | Hardware (aluminum), logistics | |
| CCGL | Hardware big factory, have food, electrical appliances | |
| JZJXL | Hardware factory, small plastic factory | |
| XB2 | Large hardware | |
| NL | Hardware and plastic appliances | |
| gyy4 | Hardware, electrical appliances, food, more comprehensive | |
| RT | Main hardware, electrical appliances | |
| PNPZ | Hardware mainly, there is a shipyard | |
| MC | Hardware (main steel, with aluminum) | |
| gyy10 | Power grid, a water purification company, you have a little hardware | |
| XJ | Hardware and plastic appliances | |
| Logistics trade | DDGC | Metal logistics city, trading city |
| DAYUAN | Logistics company, advertising company, metal material recycling company | |
| LC | Sell furniture, send logistics | |
| gyy8 | Sell and make ceramic building | |
| HH | Refrigeration equipment big factory, horticulture trading city | |
| XNY | Caohe Industrial zone (main hardware), farmers’ market, automobile trading company | |
| LYJJ | Sell furniture, hardware, hair logistics | |
| JCSY | Fuhua Machinery City, Xinbao electrical appliance factory, logistics city | |
| XX | Plastic factory, logistics city | |
| HHLX | Main car maintenance (logistics), stationery plastic | |
| Special | ANWL | Agricultural and sideline products trading market |
| gyy5 | more integrated | |
| NG | Plastic electromechanical daily necessities | |
| gyy9 | Ceramic building materials | |
| FXG | Tinfoil | |
| HM | Warehouse | |
| GZJY | Guangzhou cigarette factory | |
| ZC | Electrical factory | |
| GZGQ | Auto parts, stand in daylight | |
| HS | Textile, food (with electrical appliances nearby) | |
| gyy7 | Pure hardware factory | |
| gyy3 | Plastic, electronic | |
| JC | Pure hardware is available near the airport | |
| MY | Wood trade (gathering) | |
| DC | Electrical, metal products, printing, integrated type | |
| NH | Hardware-based, plastic | |
| LB | Hardware and plastic electrical appliances, there is a food factory | |
| SX | Hardware, plastic, selling lamps (gathering) | |
| QY | Hardware, electrical appliances, plastic, paint | |
| Comprehensive | DS | Pure hardware factory |
| YB | Pure hardware factory | |
| CH | Electrical appliances + chemical industry, with electroplating plant (small) | |
| WSB | Electrical factory | |
| WLY | Auto parts (small), accessories | |
| gyy6 | Concrete, the brick and tile company | |
| HGWJ | machine tool | |
| MAG | Aluminum factory | |
| DF | Hardware & plastics 1:1 | |
| QC | Automobile general factory maintenance, involving parts assembly and manufacturing | |
| LZS | Hardware (aluminum), it has a toy factory | |
| HG | Main printing and dyeing clothing, with ceramics, power generation | |
| HGA | Rubber, building materials | |
| SCHD | Hardware industrial park | |
| XH | Electronic-mechanical robot | |
| MDX | electrical equipment | |
| CYY | Pure hardware factory | |
| MG | Coating small factory | |
| PTDL | Aluminum factory | |
| SYQ | Appliances, printing, and locks | |
| LL | Main electrical appliances, secondary plastic | |
| LTXL | Hardware, electrical appliances | |
| XHZY | Hardware, electrical appliances | |
| DY | Hardware and furniture manufacturing 1:1 | |
| YUX | Aluminum factory | |
| YX | Pure hardware factory | |
| XY2 | Hardware, there is a steel chemical plant | |
| TC | Precision machinery, with a ceramic foaming factory |
References
- Oke, T.R. City size and the urban heat island. Atmos. Environ. (1967) 1973, 7, 769–779. [Google Scholar] [CrossRef]
- Wu, J. Urban sustainability: An inevitable goal of landscape research. Landsc. Ecol. 2009, 25, 1–4. [Google Scholar] [CrossRef]
- Kaveh, D.; Md, K.; Yan, L. Urban heat island effect: A systematic review of spatio-temporal factors, data, methods, and mitigation measures. Int. J. Appl. Earth Obs. Geoinf. 2018, 67, 30–42. [Google Scholar]
- Phelan, P.E.; Kaloush, K.; Miner, M.; Golden, J.; Phelan, B.; Silva, H.; Taylor, R.A. Urban Heat Island: Mechanisms, Implications, and Possible Remedies. Annu. Rev. Environ. Resour. 2015, 40, 285–307. [Google Scholar] [CrossRef]
- Patz, J.A.; Campbell-Lendrum, D.; Holloway, T.; Foley, J.A. Impact of regional climate change on human health. Nature 2005, 438, 310–317. [Google Scholar] [CrossRef]
- Yang, X.; Leung, L.R.; Zhao, N.; Zhao, C.; Qian, Y.; Hu, K.; Liu, X.; Chen, B. Contribution of urbanization to the increase of extreme heat events in an urban agglomeration in east China. Geophys. Res. Lett. 2017, 44, 6940–6950. [Google Scholar] [CrossRef]
- Nidhi, S.; Saumya, S.; Mall, R.K. Chapter 17—Urban ecology and human health: Implications of urban heat island, air pollution and climate change nexus. In Urban Ecology; Elsevier: Amsterdam, The Netherlands, 2020; pp. 317–334. [Google Scholar]
- Portela, C.I.; Massi, K.G.; Rodrigues, T.; Alcântara, E. Impact of urban and industrial features on land surface temperature: Evidences from satellite thermal indices. Sustain. Cities Soc. 2020, 56, 102100. [Google Scholar] [CrossRef]
- Jenerette, G.D.; Harlan, S.L.; Brazel, A.; Jones, N.; Larsen, L.; Stefanov, W.L. Regional relationships between surface temperature, vegetation, and human settlement in a rapidly urbanizing ecosystem. Landsc. Ecol. 2006, 22, 353–365. [Google Scholar] [CrossRef]
- Gao, Y.; Zhao, J.; Han, L. Exploring the spatial heterogeneity of urban heat island effect and its relationship to block morphology with the geographically weighted regression model. Sustain. Cities Soc. 2022, 76, 103431. [Google Scholar] [CrossRef]
- Liu, X.; Ming, Y.; Liu, Y.; Yue, W.; Han, G. Influences of landform and urban form factors on urban heat island: Comparative case study between Chengdu and Chongqing. Sci. Total Environ. 2022, 820, 153395. [Google Scholar] [CrossRef]
- Manoli, G.; Fatichi, S.; Schläpfer, M.; Yu, K.; Crowther, T.W.; Meili, N.; Burlando, P.; Katul, G.G.; Bou-Zeid, E. Magnitude of urban heat islands largely explained by climate and population. Nature 2019, 573, 55–60. [Google Scholar] [CrossRef]
- Peng, S.; Piao, S.; Ciais, P.; Friedlingstein, P.; Ottle, C.; Bréon, F.-M.; Nan, H.; Zhou, L.; Myneni, R.B. Surface Urban Heat Island Across 419 Global Big Cities. Environ. Sci. Technol. 2011, 46, 696–703. [Google Scholar] [CrossRef] [PubMed]
- Zhou, Y.; Huang, B.; Wang, J.; Chen, B.; Kong, H.; Norford, L. Climate-Conscious Urban Growth Mitigates Urban Warming: Evidence from Shenzhen, China. Environ. Sci. Technol. 2019, 53, 11960–11968. [Google Scholar] [CrossRef]
- Du, H.; Wang, D.; Wang, Y.; Zhao, X.; Qin, F.; Jiang, H.; Cai, Y. Influences of land cover types, meteorological conditions, anthropogenic heat and urban area on surface urban heat island in the Yangtze River Delta Urban Agglomeration. Sci. Total Environ. 2016, 571, 461–470. [Google Scholar] [CrossRef] [PubMed]
- Yu, Z.; Yao, Y.; Yang, G.; Wang, X.; Vejre, H. Spatiotemporal patterns and characteristics of remotely sensed region heat islands during the rapid urbanization (1995–2015) of Southern China. Sci. Total Environ. 2019, 674, 242–254. [Google Scholar] [CrossRef] [PubMed]
- Zhang, M.; Huang, L.; Jiang, W.; Fan, M.; Dai, W.; Han, W.; Xu, Q.; Dong, Y. Urban core greening and industrial decentralization lead to contrasting trends in surface urban heat islands in a metropolitan area in China. J. Environ. Manag. 2025, 374, 124045. [Google Scholar] [CrossRef]
- Dutta, D.; Gupta, S.; Kishtawal, C.M. Linking LULC change with urban heat islands over 25 years: A case study of the urban-industrial city Durgapur, Eastern India. J. Spat. Sci. 2018, 65, 501–518. [Google Scholar] [CrossRef]
- Rao, Y.; Xu, Y.; Zhang, J.; Guo, Y.; Fu, M. Does subclassified industrial land have a characteristic impact on land surface temperatures? Evidence for and implications of coal and steel processing industries in a Chinese mining city. Ecol. Indic. 2018, 89, 22–34. [Google Scholar] [CrossRef]
- Wang, C.; Ren, Z.; Dong, Y.; Zhang, P.; Guo, Y.; Wang, W.; Bao, G. Efficient cooling of cities at global scale using urban green space to mitigate urban heat island effects in different climatic regions. Urban For. Urban Green. 2022, 74, 127635. [Google Scholar] [CrossRef]
- Zhou, W.; Yu, W.; Zhang, Z.; Cao, W.; Wu, T. How can urban green spaces be planned to mitigate urban heat island effect under different climatic backgrounds? A threshold-based perspective. Sci. Total Environ. 2023, 890, 164422. [Google Scholar] [CrossRef]
- Yang, Y.; Cao, C.; Bogoev, I.; Deetman, C.; Dietz, G.; Hang, J.; Howard, L.; Huang, X.; Kendall, N.; Lai, J.; et al. Regulation of humid heat by urban green space across a climate wetness gradient. Nat. Cities 2024, 1, 871–879. [Google Scholar] [CrossRef]
- Chandler, T.; Gregory, S. The Climate of the British Isles; Longman: London, UK, 1965. [Google Scholar]
- Papadopoulos, A.M.; Moussiopoulos, N. Towards a holistic approach for the urban environment and its impact on energy utilisation in buildings: The ATREUS project. J. Environ. Monit. 2004, 6, 841–848. [Google Scholar] [CrossRef] [PubMed]
- Meng, Q.; Hu, D.; Zhang, Y.; Chen, X.; Zhang, L.; Wang, Z. Do industrial parks generate intra-heat island effects in cities? New evidence, quantitative methods, and contributing factors from a spatiotemporal analysis of top steel plants in China. Environ. Pollut. 2022, 292 Pt B, 118383. [Google Scholar] [CrossRef]
- Mohan, M.; Singh, V.K.; Bhati, S.; Lodhi, N.; Sati, A.P.; Sahoo, N.R.; Dash, S.; Mishra, P.C.; Dey, S. Industrial heat island: A case study of Angul-Talcher region in India. Theor. Appl. Climatol. 2020, 141, 229–246. [Google Scholar] [CrossRef]
- Rahman, M.M.; Alam, K.; Velayutham, E. Is industrial pollution detrimental to public health? Evidence from the world’s most industrialised countries. BMC Public Health 2021, 21, 1175. [Google Scholar] [CrossRef] [PubMed]
- Gao, J.; Meng, Q.; Zhang, L.; Hu, D. How does the ambient environment respond to the industrial heat island effects? An innovative and comprehensive methodological paradigm for quantifying the varied cooling effects of different landscapes. GIScience Remote Sens. 2022, 59, 1643–1659. [Google Scholar] [CrossRef]
- Ming, Y.; Liu, Y.; Gu, J.; Wang, J.; Liu, X. Nonlinear effects of urban and industrial forms on surface urban heat island: Evidence from 162 Chinese prefecture-level cities. Sustain. Cities Soc. 2023, 89, 104350. [Google Scholar] [CrossRef]
- Zhao, L.; Lee, X.; Smith, R.B.; Oleson, K. Strong contributions of local background climate to urban heat islands. Nature 2014, 511, 216–219. [Google Scholar] [CrossRef]
- Feng, R.; Wang, F.; Wang, K.; Wang, H.; Li, L. Urban ecological land and natural-anthropogenic environment interactively drive surface urban heat island: An urban agglomeration-level study in China. Environ. Int. 2021, 157, 106857. [Google Scholar] [CrossRef]
- Zhang, J.; Qi, Y.; Song, Y.; Li, Y.; Lin, R.; Su, X.; Zhu, D. The relationship between industrial transfer parks and county economic growth: Evidence from Guangdong Province, China. Habitat Int. 2023, 139, 102894. [Google Scholar] [CrossRef]
- Wang, X.; Liao, J.; Zhang, J.; Shen, C.; Chen, W.; Xia, B.; Wang, T. A Numeric Study of Regional Climate Change Induced by Urban Expansion in the Pearl River Delta, China. J. Appl. Meteorol. Climatol. 2014, 53, 346–362. [Google Scholar] [CrossRef]
- Chen, G.; Zhao, L.; Mochida, A. Urban Heat Island Simulations in Guangzhou, China, Using the Coupled WRF/UCM Model with a Land Use Map Extracted from Remote Sensing Data. Sustainability 2016, 8, 628. [Google Scholar] [CrossRef]
- Peng, S.; Feng, Z.; Liao, H.; Huang, B.; Peng, S.; Zhou, T. Spatial-temporal pattern of, and driving forces for, urban heat island in China. Ecol. Indic. 2019, 96, 127–132. [Google Scholar] [CrossRef]
- Tang, C.F. A study of the urban heat island effect in Guangzhou. IOP Conf. Ser. Earth Environ. Sci. 2022, 1087, 012015. [Google Scholar] [CrossRef]
- Huang, J.; Nitivattananon, V.; Lin, D.; Gong, W. Integrated assessment for Sustainable Development Goals of metropolitan regions: A case study of the Pearl River Delta region, China. Environ. Sustain. Indic. 2023, 20, 100299. [Google Scholar] [CrossRef]
- Hui, E.C.M.; Li, X.; Chen, T.; Lang, W. Deciphering the spatial structure of China’s megacity region: A new bay area—The Guangdong-Hong Kong-Macao Greater Bay Area in the making. Cities 2020, 105, 102168. [Google Scholar] [CrossRef]
- Guangdong Provincial Bureau of Statistics. Guangdong Statistical Yearbook 2022; China Statistics Press: Beijing, China, 2022.
- Huang, Y.; Lang, W.; Chen, T.; Wu, J. Regional Coordinated Development in the Megacity Regions: Spatial Pattern and Driving Forces of the Guangzhou-Foshan Cross-Border Area in China. Land 2023, 12, 753. [Google Scholar] [CrossRef]
- Yang, Y.; Zhang, Z.; Yang, Y.; Wang, Z.; Chen, Y.; He, H. Impact of high PM2.5 nitrate on visibility in a medium size city of Pearl River Delta. Atmos. Pollut. Res. 2022, 13, 101592. [Google Scholar] [CrossRef]
- Miller, D.L.; Alonzo, M.; Meerdink, S.K.; Allen, M.A.; Tague, C.L.; Roberts, D.A.; McFadden, J.P. Seasonal and interannual drought responses of vegetation in a California urbanized area measured using complementary remote sensing indices. ISPRS J. Photogramm. Remote Sens. 2022, 183, 178–195. [Google Scholar] [CrossRef]
- Yang, J.; Huang, X. The 30 m annual land cover dataset and its dynamics in China from 1990 to 2019. Earth Syst. Sci. Data 2021, 13, 3907–3925. [Google Scholar] [CrossRef]
- Liu, Z.; Tang, H.; Feng, L.; Lyu, S. China Building Rooftop Area: The first multi-annual (2016–2021) and high-resolution (2.5 m) building rooftop area dataset in China derived with super-resolution segmentation from Sentinel-2 imagery. Earth Syst. Sci. Data 2023, 15, 3547–3572. [Google Scholar] [CrossRef]
- Xu, Z.; Cai, Z.; Su, S.; Kang, M.; Ge, Y. Unraveling the association between the urban polycentric structure and urban surface thermal environment in urbanizing China. Sustain. Cities Soc. 2022, 76, 103490. [Google Scholar] [CrossRef]
- Yin, C.; Yuan, M.; Lu, Y.; Huang, Y.; Liu, Y. Effects of urban form on the urban heat island effect based on spatial regression model. Sci. Total Environ. 2018, 634, 696–704. [Google Scholar] [CrossRef]
- Yao, X.; Yu, K.; Zeng, X.; Lin, Y.; Ye, B.; Shen, X.; Liu, J. How can urban parks be planned to mitigate urban heat island effect in “Furnace cities” ? An accumulation perspective. J. Clean. Prod. 2022, 330, 129852. [Google Scholar] [CrossRef]
- Peng, J.; Liu, Q.; Xu, Z.; Lyu, D.; Du, Y.; Qiao, R.; Wu, J. How to effectively mitigate urban heat island effect? A perspective of waterbody patch size threshold. Landsc. Urban Plan. 2020, 202, 103873. [Google Scholar] [CrossRef]
- Song, J.; Du, S.; Feng, X.; Guo, L. The relationships between landscape compositions and land surface temperature: Quantifying their resolution sensitivity with spatial regression models. Landsc. Urban Plan. 2014, 123, 145–157. [Google Scholar] [CrossRef]
- Gao, J.; Gong, J.; Li, J. Effects of source and sink landscape pattern on land surface temperature: An urban heat island study in Wuhan City. Prog. Geogr. 2019, 38, 1770–1782. [Google Scholar] [CrossRef]
- Zhang, Y.; Wang, Y.; Ding, N.; Yang, X. Spatial Pattern Impact of Impervious Surface Density on Urban Heat Island Effect: A Case Study in Xuzhou, China. Land 2022, 11, 2135. [Google Scholar] [CrossRef]
- Sun, R.; Chen, L. How can urban water bodies be designed for climate adaptation? Landsc. Urban Plan. 2012, 105, 27–33. [Google Scholar] [CrossRef]
- Rao, P.; Tassinari, P.; Torreggiani, D. Exploring the land-use urban heat island nexus under climate change conditions using machine learning approach: A spatio-temporal analysis of remotely sensed data. Heliyon 2023, 9, e18423. [Google Scholar] [CrossRef]
- Yuan, S.; Ren, Z.; Shan, X.; Deng, Q.; Zhou, Z. Seasonal different effects of land cover on urban heat island in Wuhan’s metropolitan area. Urban Clim. 2023, 49, 101547. [Google Scholar] [CrossRef]
- Liu, J.; Zhang, L.; Zhang, Q.; Zhang, G.; Teng, J. Predicting the surface urban heat island intensity of future urban green space development using a multi-scenario simulation. Sustain. Cities Soc. 2021, 66, 102698. [Google Scholar] [CrossRef]
- Ravindra, K.; Rattan, P.; Mor, S.; Aggarwal, A.N. Generalized additive models: Building evidence of air pollution, climate change and human health. Environ. Int. 2019, 132, 104987. [Google Scholar] [CrossRef] [PubMed]
- Li, Y.; Sun, Y.; Li, J.; Gao, C. Socioeconomic drivers of urban heat island effect: Empirical evidence from major Chinese cities. Sustain. Cities Soc. 2020, 63, 102425. [Google Scholar] [CrossRef]
- Nan, Y.; Zhang, Q.Q.; Zhang, B.H. Influencing Factors of Long-term Variations on Gridded PM(2.5) of Typical Regions in China Based on GAM Model. Huan Jing Ke Xue 2020, 41, 499–509. [Google Scholar]
- Liu, S.; Zhang, J.; Li, J.; Li, Y.; Zhang, J.; Wu, X. Simulating and mitigating extreme urban heat island effects in a factory area based on machine learning. Build. Environ. 2021, 202, 108051. [Google Scholar] [CrossRef]
- Achmad, A.; Fadhly, N.; Deli, A.; Ramli, I. Urban growth and its impact on land surface temperature in an industrial city in Aceh, Indonesia. Lett. Spat. Resour. Sci. 2022, 15, 39–58. [Google Scholar] [CrossRef]
- Berto, R.; Stival, C.A.; Rosato, P. Enhancing the environmental performance of industrial settlements: An economic evaluation of extensive green roof competitiveness. Build. Environ. 2018, 127, 58–68. [Google Scholar] [CrossRef]
- Xia, H.; Chen, Y.; Song, C.; Li, J.; Quan, J.; Zhou, G. Analysis of surface urban heat islands based on local climate zones via spatiotemporally enhanced land surface temperature. Remote Sens. Environ. 2022, 273, 112972. [Google Scholar] [CrossRef]
- Jayasooriya, V.M.; Adams, M.D. From urban heat islands to intra-urban heat islands: Role of urban fabric in redefining microclimates of tomorrow’s compact cities. Energy Build. 2024, 324, 114900. [Google Scholar] [CrossRef]
- Kardinal Jusuf, S.; Wong, N.H.; Hagen, E.; Anggoro, R.; Hong, Y. The influence of land use on the urban heat island in Singapore. Habitat Int. 2007, 31, 232–242. [Google Scholar] [CrossRef]
- van Hove, L.W.A.; Jacobs, C.M.J.; Heusinkveld, B.G.; Elbers, J.A.; van Driel, B.L.; Holtslag, A.A.M. Temporal and spatial variability of urban heat island and thermal comfort within the Rotterdam agglomeration. Build. Environ. 2015, 83, 91–103. [Google Scholar] [CrossRef]
- Ming, Y.; Liu, Y.; Liu, X. Spatial pattern of anthropogenic heat flux in monocentric and polycentric cities: The case of Chengdu and Chongqing. Sustain. Cities Soc. 2022, 78, 103628. [Google Scholar] [CrossRef]
- Rahimi, E.; Barghjelveh, S.; Dong, P. Quantifying how urban landscape heterogeneity affects land surface temperature at multiple scales. J. Ecol. Environ. 2021, 45, 22. [Google Scholar] [CrossRef]
- Shi, Z.; Li, X.; Hu, T.; Yuan, B.; Yin, P.; Jiang, D. Modeling the intensity of surface urban heat island based on the impervious surface area. Urban Clim. 2023, 49, 101529. [Google Scholar] [CrossRef]
- Niu, F.; Yang, X.; Wang, F. Urban Agglomeration Formation and Its Spatiotemporal Expansion Process in China: From the Perspective of Industrial Evolution. Chin. Geogr. Sci. 2020, 30, 532–543. [Google Scholar] [CrossRef]
- Han, S.; Li, W.; Kwan, M.-P.; Miao, C.; Sun, B. Do polycentric structures reduce surface urban heat island intensity? Appl. Geogr. 2022, 146, 102766. [Google Scholar] [CrossRef]
- Seto, K.C.; Golden, J.S.; Alberti, M.; Turner, B.L. Sustainability in an urbanizing planet. Proc. Natl. Acad. Sci. USA 2017, 114, 8935–8938. [Google Scholar] [CrossRef]
- Vogt, J.V. Land Surface Temperature Retrieval from NOAA AVHRR Data. In Advances in the Use of NOAA AVHRR Data for Land Applications; D’Souza, G., Belward, A.S., Malingreau, J.-P., Eds.; Springer: Dordrecht, The Netherlands, 1996; pp. 125–151. [Google Scholar]
- Benali, A.; Carvalho, A.C.; Nunes, J.P.; Carvalhais, N.; Santos, A. Estimating air surface temperature in Portugal using MODIS LST data. Remote Sens. Environ. 2012, 124, 108–121. [Google Scholar] [CrossRef]
- Weng, Q. Thermal infrared remote sensing for urban climate and environmental studies: Methods, applications, and trends. ISPRS J. Photogramm. Remote Sens. 2009, 64, 335–344. [Google Scholar] [CrossRef]
- Tomlinson, C.J.; Chapman, L.; Thornes, J.E.; Baker, C.J. Including the urban heat island in spatial heat health risk assessment strategies: A case study for Birmingham, UK. Int. J. Health Geogr. 2011, 10, 42. [Google Scholar] [CrossRef] [PubMed]


| LST Level | Level Name | Level Range |
|---|---|---|
| L1 | Extremely Low | ∆T ≤ −1.5σ |
| L2 | Low | −1.5σ ≤ ∆T < −0.5σ |
| L3 | Normal | −0.5σ ≤ ∆T ≤ 0.5σ |
| L4 | High | 0.5σ < ∆T ≤ 1.5σ |
| L5 | Extremely High | 1.5σ ≤ ∆T |
Disclaimer/Publisher’s Note: The statements, opinions and data contained in all publications are solely those of the individual author(s) and contributor(s) and not of MDPI and/or the editor(s). MDPI and/or the editor(s) disclaim responsibility for any injury to people or property resulting from any ideas, methods, instructions or products referred to in the content. |
© 2025 by the authors. Licensee MDPI, Basel, Switzerland. This article is an open access article distributed under the terms and conditions of the Creative Commons Attribution (CC BY) license (https://creativecommons.org/licenses/by/4.0/).
Share and Cite
Jiang, W.; Wang, Y.; Zhang, M. Exploring the Industrial Heat Island Effects and Key Influencing Factors in the Guangzhou–Foshan Metropolitan Area. Sustainability 2025, 17, 3363. https://doi.org/10.3390/su17083363
Jiang W, Wang Y, Zhang M. Exploring the Industrial Heat Island Effects and Key Influencing Factors in the Guangzhou–Foshan Metropolitan Area. Sustainability. 2025; 17(8):3363. https://doi.org/10.3390/su17083363
Chicago/Turabian StyleJiang, Wenqi, Yuanyuan Wang, and Mengmeng Zhang. 2025. "Exploring the Industrial Heat Island Effects and Key Influencing Factors in the Guangzhou–Foshan Metropolitan Area" Sustainability 17, no. 8: 3363. https://doi.org/10.3390/su17083363
APA StyleJiang, W., Wang, Y., & Zhang, M. (2025). Exploring the Industrial Heat Island Effects and Key Influencing Factors in the Guangzhou–Foshan Metropolitan Area. Sustainability, 17(8), 3363. https://doi.org/10.3390/su17083363