1. Introduction
Recently, significant attention has been given to a decentralization strategy for water systems to tackle the sustainability challenges due to climate and socioeconomic changes [
1,
2,
3,
4]. As an implementation of the decentralization strategy, the concept of microgrids has emerged as an infrastructure option to address water service challenges in a resilient and sustainable way [
5,
6,
7]. The concept of microgrids has been established and developed in the energy (power) supply sector, which faces service challenges similar to those in water systems [
8]. Microgrids are intentional islands formed at a facility or in an electrical distribution system that contains at least one distributed energy resource and associated loads [
9]. They can generate, store, and distribute electricity based on the operational needs of local communities and supplement the main grid during peak demand [
8]. Microgrids can function in hybrid, islanded, and grid-connected modes [
10]. When microgrids are in grid-connected mode, they are linked to the main power grid and can import or export electricity as needed. In islanded mode, each microgrid generates, stores, and distributes electricity locally using the distributed energy resources, functioning independently of the main grid. Depending on the main grid’s dependability and availability, microgrids can function in both grid-connected and islanded modes when in hybrid mode [
11].
The microgrid approach in the energy sector has become popular as a sustainable solution for dealing with the increasing number of power outages caused by disruptive events, like severe weather conditions. Although microgrids have traditionally been found in places with clear boundaries, such as military installations or colleges, they are now being used in centralized power distribution systems. They have the potential to enhance energy resilience, integrate renewable energy, and reduce energy costs and environmental impact, making them one of many tools for addressing sustainability and resilience issues [
8]. The development of microgrids can lead to economic, environmental and social benefits compared to the conventional power generation system [
12].
Like electricity, water is one of the critical resources for our society, yet its delivery still relies on traditional large-scale centralized systems. These systems collect and treat source water, typically fresh surface water or groundwater, and distribute it to the users through a single, large distribution network [
13]. However, similar to central electrical distribution systems, centralized water distribution systems (WDSs) are experiencing challenges in ensuring sustainable water delivery because of disruptive failure events and severe weather conditions. Examples include widespread pipe bursts due to freezing temperatures [
14], water crises [
15], water supply disruptions due to climate change [
16], and cyberattacks on water systems [
17]. Given the similar vulnerability of water and energy sectors to catastrophic events, the application of the microgrid concept to WDSs can offer a resilience strategy to address the challenges in sustaining water supply service under climate and socioeconomic changes.
Similar to energy microgrids, water microgrids are structured as a network of networks that can operate independently of an existing centralized system and include an information link that provides the necessary monitoring and control to create interactive operation with the centralized system. Individual water microgrids at the local scale can perform all of the features of a centralized water system. Water microgrids supply water from both the existing centralized water sources and diverse/distributed local sources, such as rainwater, storm water, or reclaimed wastewater, which are typically produced by water recycling and reuse as a sustainability option. The local water sources enhance water supply redundancy within water microgrids, serving as supplementary water during peak demand or backup during emergencies. Depending on users’ purpose, water microgrids can treat local water to meet either potable or non-potable quality. Local water tanks storing the treated water should have sufficient capacity to function as a buffer system, balancing quantitative and timing variations between local water production and demand while sustaining continuous water supply during normal and disrupted conditions. Stored water is conveyed through a separate series of pipelines, valves, and pumps. To meet critical water demand during disruptive events, water microgrids also feature an automation architecture. This establishes a communication link with the centralized system for real-time system monitoring (e.g., anomaly detection and localization) and control (increasing local water supply during pump/valve failure or pipe bursts). For instance, real-time monitoring with smart meters and sensors enables water microgrids to rapidly detect pipe bursts/leaks and implement emergency actions, such as valve closure or pump operational change through remote controls.
Adopting all of the above-mentioned characteristics, water microgrids can operate in centralized, decentralized, and hybrid supply system modes. In centralized system operation, water microgrids perform as a central water supply system with an existing centralized water source. The decentralized system can collect, treat, store, and distribute water using locally available water resources and can operate independently of the centralized system. Based on the varying water availability of the centralized and local systems, water microgrids can operate in a hybrid mode, employing the interactive operations of local water systems with the centralized system at various scales.
Compared to energy (electricity) microgrids, the concept and application of microgrids in the water sector has been less explored and investigated, despite the potential sustainability benefits over conventional centralized systems. Integrating a microgrid approach into an existing WDS requires careful study and planning to effectively enhance resilience, sustainability, and efficiency while minimizing capital and operational costs and complex controls.
There have been few studies on the application of microgrids in the water sector. Falco and Webb [
5] suggested challenges to implement water microgrids by conceptually comparing water infrastructure and energy microgrids; however, they did not provide quantitative analyses specific to water microgrids. They reviewed the generation, storage, and distribution of electricity in energy microgrids and investigated parallel benefits for its application in water systems. Their study suggested further exploration of microgrid configurations in water systems to meet sustainability requirements with resiliency. The lack of research and practice regarding water microgrids highlights the need to evaluate the effects of physical water microgrids that demonstrate their resilience and complex operations for sustainable water supply services under disruptions. Cejudo et al. [
6] developed a report on water microgrids, introducing key components, characteristics, scales, and grid-connected and islanded operation modes, and discussing insights into water microgrid management from the perspective of the water–energy–climate nexus. The study presented microgrids as an attractive solution for enhancing resilience and ensuring sustainable water supply during natural disruption and climate-related challenges. It also emphasized that proper planning, design, and maintenance are crucial for their effective implementation and presented design and operation factors for implementing water microgrids, such as maintenance, regulations, utility restoration, curtailment plans, emergency planning, and community engagement. However, while existing studies have presented water microgrids conceptually, they are limited in their understanding of the practical implementation of water microgrids and the quantitative effects of their resilience to disruptions to ensure a sustainable water supply.
The microgrid approach employs water or energy supply from distributed local sources in tandem with an existing centralized WDS. Thus, water microgrids have a similar configuration to decentralized WDSs. The decentralization strategy for water supply, which involves distributed alternative water sources through water reuse or recycling, has gained attention for enhancing water availability, reducing the burden on centralized WDSs, ensuring emergency use, and improving water security [
3,
18,
19]. In this context, there have been extensive studies focusing on decentralized WDSs, while quantitative studies on water microgrids remain limited. However, the previous studies focusing on decentralized systems have primarily considered alternative water supply at the building scale, which can suggest a limited understanding of how the interactions between centralized and decentralized systems (hybrid systems) contribute to sustaining system performance under disruptions.
Leigh and Lee [
2] highlighted that the integration of decentralization technologies in conventional systems offers more efficiency, robustness, and adaptability, and this transition should be tested on a small scale to build political support and public acceptance. Sapkota et al. [
20] developed a framework of hybrid water systems that significantly reduced potable water demand and wastewater flow. Liu et al. [
4] found that hybrid wastewater treatment and reuse showed better performance and resilience under various disruptions, highlighting the need to reassess traditional water systems and hybrid configurations as an alternative approach. In this context, this study investigates the resilience effects of the microgrid concept with operational interactions between centralized and decentralized systems to ensure sustainable water supply during disruptions. A lab-scale WDS was demonstrated to evaluate and compare the resilience effects of centralized, decentralized, and microgrid (hybrid) configuration options under various disruptive scenarios.
The major contributions of this study are (1) serving as a crucial foundation for the quantitative evaluation of water microgrids from a resilience perspective for sustainable water supply; (2) demonstrating a physical lab-scale model of water microgrids and offering empirical insights into system performance under disruptions; and (3) providing discussions and insights on incorporating the microgrid approach into existing WDSs. This study holds significant importance, as it presents a sustainable infrastructure solution to the growing global challenges of water security and infrastructure management, driven by climate and socioeconomic changes, infrastructure aging, and energy and financial constraints. By demonstrating how the microgrid approach can enhance water system resilience to disruptions, it provides a practical approach for regions facing water service challenges related to water scarcity, severe droughts, water infrastructure investment and expansion, and increasing water demand. This aligns with global sustainability efforts, particularly the United Nations’ Sustainable Development Goal 6, which aims to ensure the availability and sustainable management of water and sanitation for all.
2. Materials and Methods
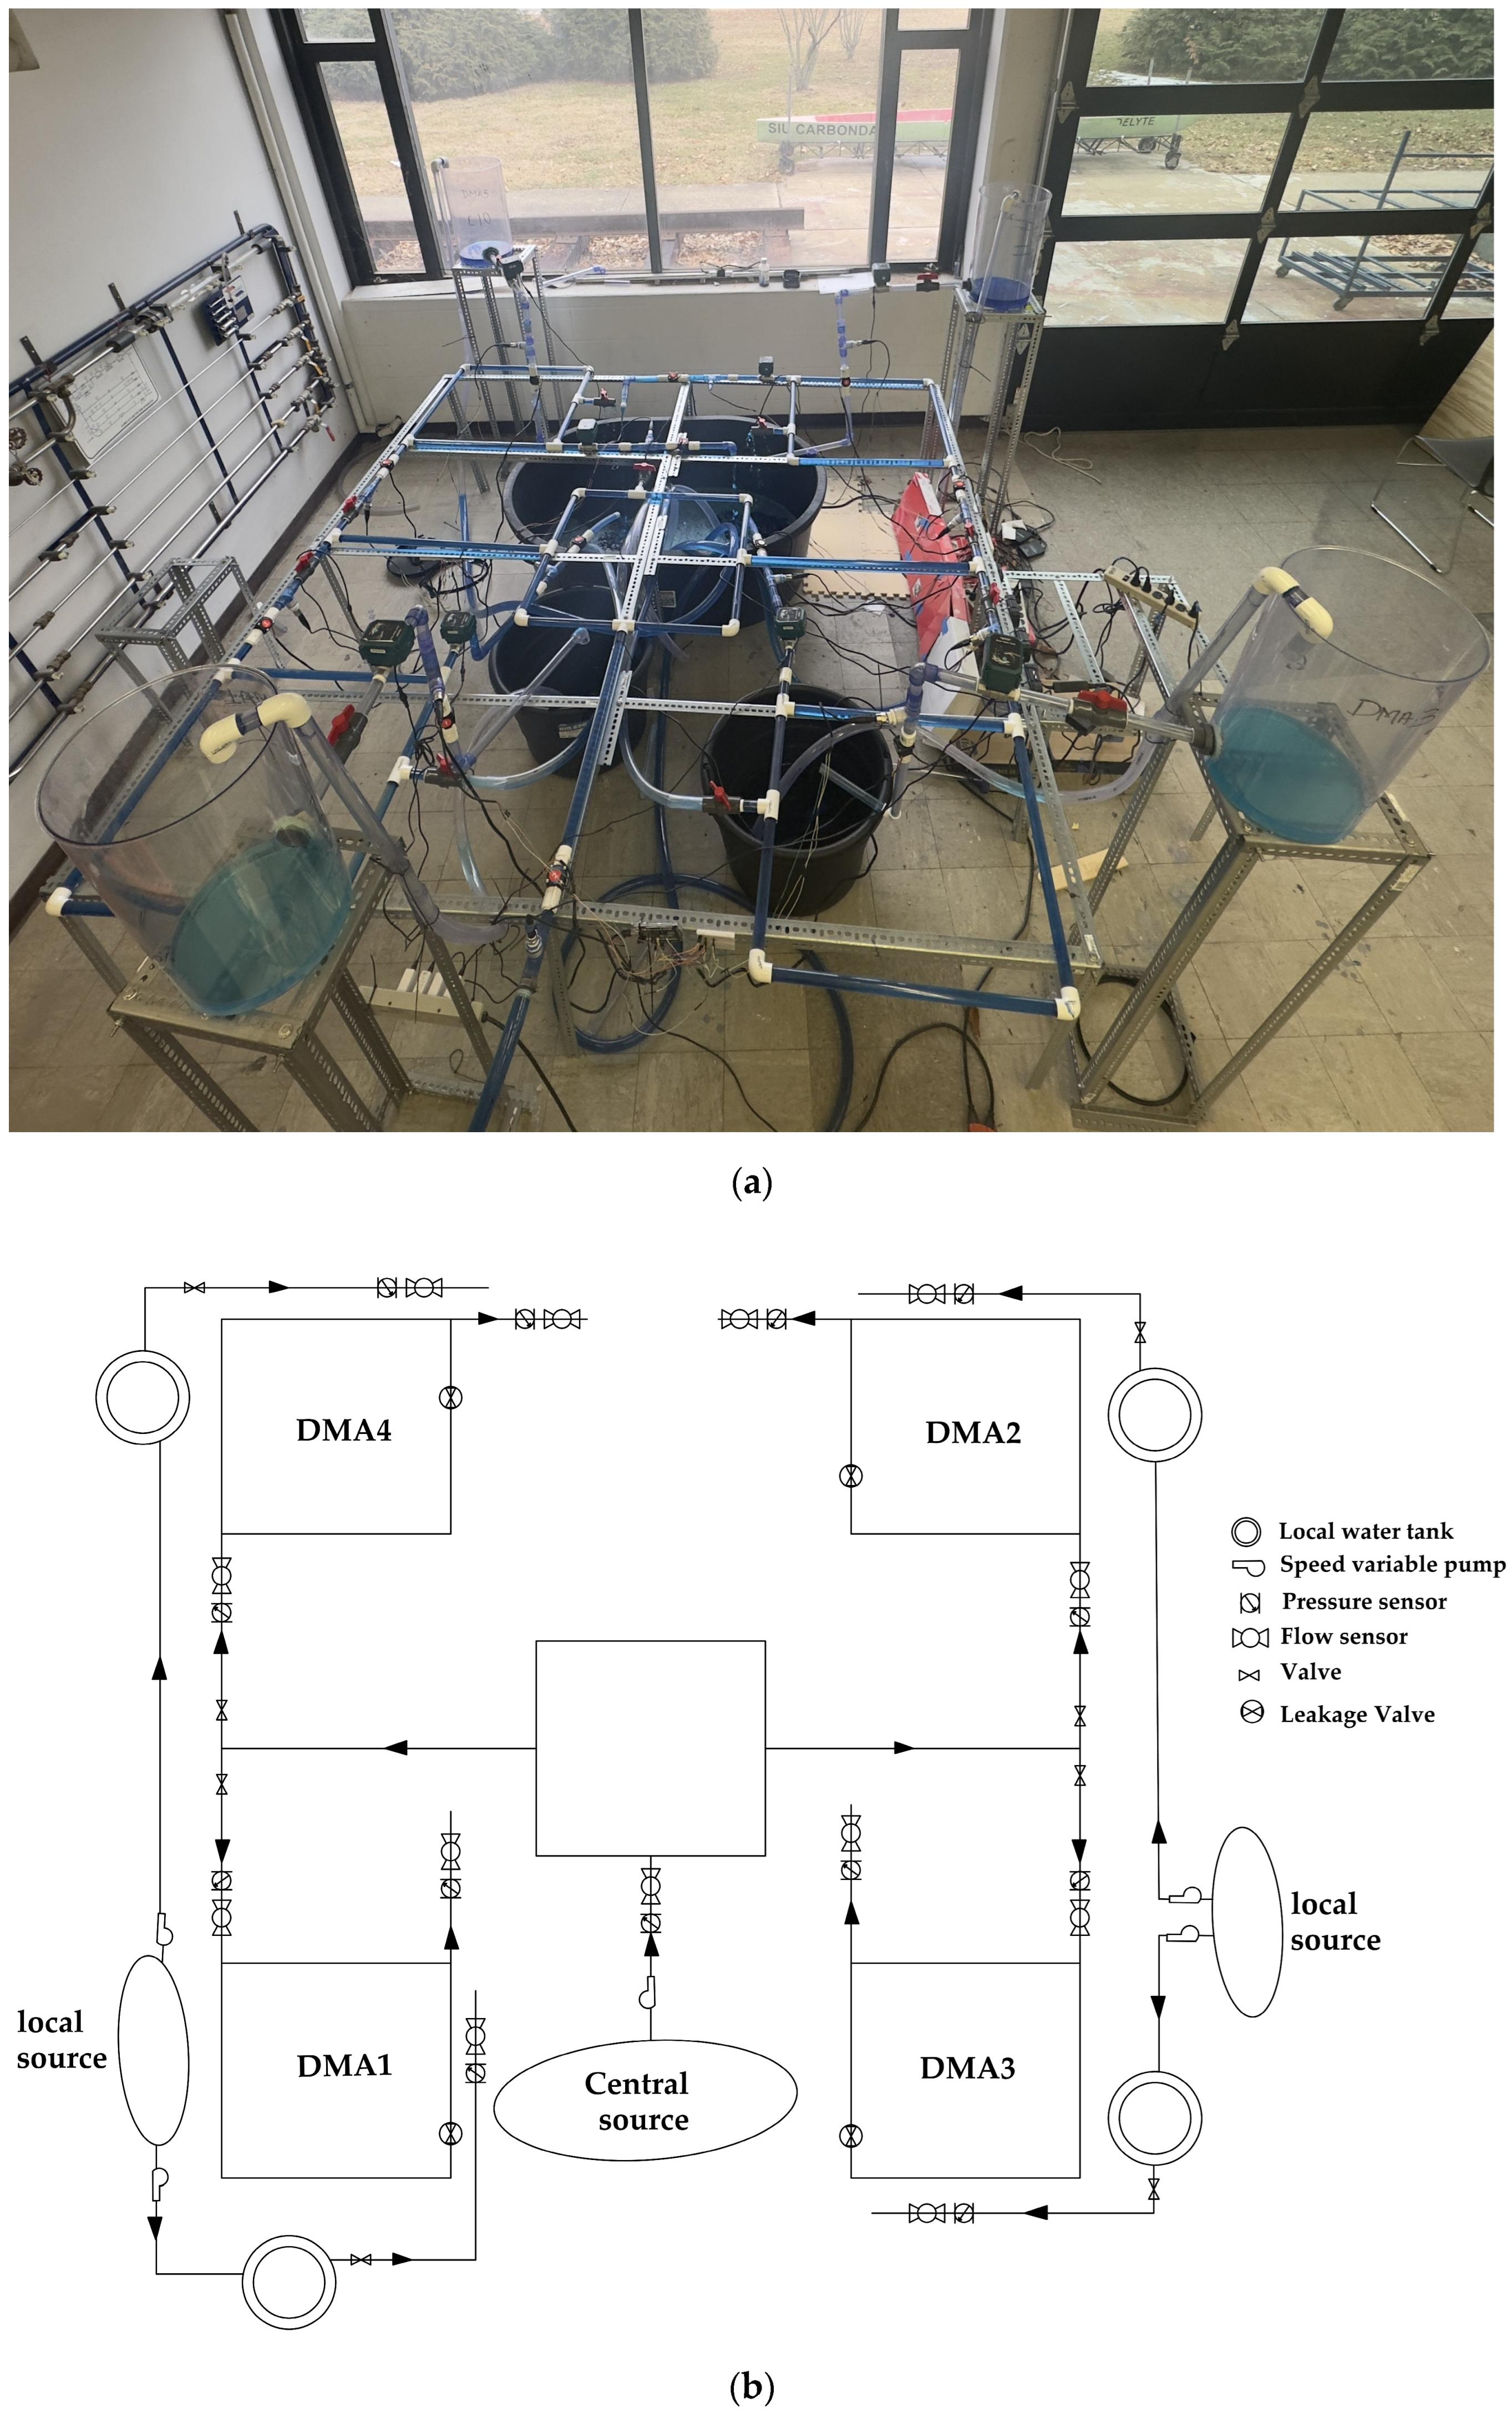
To dynamically demonstrate centralized, decentralized, and microgrid WDSs under various disruption scenarios, this study built a physical lab-scale model of a WDS. The configuration of the lab-scale WDS model was inspired by the C-town WDS [
21]; however, it consisted of four DMAs (district metered areas) with centralized and local water sources, pipes, valves, pumps, and demand nodes (
Figure 1). Sensors were installed into the model to measure water flow and pressure, which were used to quantify the performance (resilience) of the WDS under various disruptions. Below is a summary of the key features of the lab-scale model:
The system consists of four DMAs, each equipped with local water storage and supply components. The centralized system includes 1 centralized tank, 2 pumps in series, 27 pipes, and 13 valves, while the local system has 2 local sources and operates through a gravity-driven supply with 4 water tanks, 8 pipes, and 8 valves.
The physical configuration of the lab-scale model integrating both the centralized and local systems represents a decentralized WDS model In microgrid operation, the system integrates centralized and local elements through information and control rather than additional physical infrastructure. If the overall system’s water supply performance is disrupted, the centralized and local water systems dynamically adjust their operations in water supply amount and timing.
In normal conditions, the centralized system mainly supplies water, while the local system provides partial support. During emergencies or peak demand periods, the local system’s contribution increases or serves as a backup.
The interactive operation between centralized and local water systems allows for trade-offs in their water supply portions and timing, based on varying demand levels and supply disruptions.
Figure 1.
The lab-scale WDS model: (a) top view photo; (b) schematic representation.
Figure 1.
The lab-scale WDS model: (a) top view photo; (b) schematic representation.
2.1. Network Layout
As shown in
Figure 1a, the lab-scale WDS model consisted of the existing centralized (central) system and local system. The centralized system represented four DMAs, and its size was 8 ft long and 8 ft wide, with 36 ft in total pipe length. It comprised a main source tank and distribution section connected by a supply line. The source tank supplied pressurized water to the distribution pipelines. The distribution section consisted of twenty 3/4-inch PVC pipes assembled in a square loop topology. Each DMA had a 2 to 2.5 ft long branch pipeline to simulate demand. The DMAs were configured into square loops. Each DMA was 2 ft long and 2 ft wide. The entire setup was raised to a height of 2.5 ft from the ground.
The local system consisted of two water sources at ground level and four elevated cylindrical water tanks. Therefore, each of the four DMAs received local water partially or as a backup from its respective local water tank, depending on the system operating conditions. PVC pipes (3/4 inch) were fitted in the water tanks to deliver the water to each DMA. Each DMA had a length of 5 ft 2 inches of pipeline, adding up to a total of 20 ft 8 inches of pipeline in the local system. Similar fittings to those in the centralized system were used.
Water was pumped through a 12-inch diameter pipe into the centralized system, which included two pumps, a source tank (140-gallon plastic tank), and a supply pipeline. Two speed variable centrifugal pumps were used to supply water from the tank to the distribution pipelines. The two pumps operated in series, adjusting their pump speeds to control the water flow rate and pressure levels in the central WDS.
Two 21-gallon plastic tanks were used as local water sources in the local system for decentralization. The local water was supplied from these sources to four cylindrical tanks (10-inch diameter and 20 inches high) elevated at a height of 4 ft by the pumps, which had similar features to the ones in the central system. Water from these local tanks was supplied to the respective DMAs by gravity.
2.2. Sensors and Data Acquisition
A total of 18 sensors were deployed in the central system of the lab-scale WDS model, consisting of 9 flow sensors and 9 pressure sensors. The local system had four flow sensors and four pressure sensors, each installed at the local water demand nodes. The sensors were selected based on their easy interface with microcontrollers such as Arduino, working range, and enough precision required for this study. These sensor specifications made them applicable to measuring the flow and pressure levels with the required resolution and precision. The sensors were located at every entry and exit (demand nodes) of the DMAs.
Data from all the flow and pressure sensors were recorded using three Arduino boards, which were connected to the sensors. All the sensory data were recorded at one-second intervals to capture meaningful trends and time efficiency and to reduce noise effects.
2.3. WDS Operation Options
This study examined three operational configurations of the lab-scale WDS: (1) a completely centralized water system (CT-WDS), (2) a decentralized water system without operational interactions between the central and local water systems (DC-WDS), and (3) a water microgrid system with central–local system interactions (MG-WDS). The local water system was assumed to supply potable or non-potable water produced from rainwater harvesting, recycled greywater, or reclaimed wastewater.
The CT-WDS option represents the conventional, existing WDSs that rely on a single central water source. The performance of this option was used as a reference to compare the resilience effects of the decentralized and hybrid water systems in this study. The DC-WDS option incorporates local water systems into the existing central WDS. This option supplies a fixed amount of water at predetermined times, regardless of the overall WDS’s water supply performance. It does not consider operational flexibility in adjusting the amount and timing of water supply from local sources in the case of physical and operational failures in the system. The MG-WDS option has a physical configuration similar to the DC-WDS but allows for the operational flexibility of local water systems to support the central water system depending on the system’s physical (e.g., pipe bursts) and operational (e.g., cyberattacks or peak demand periods) conditions. Such operational interactions can enhance water supply efficiency under normal conditions and minimize water supply losses during disruptions to ensure sustainable water services.
This study considered varying water demand during non-peak and peak hours in demonstrating the lab-scale WDS model. The time variation of the water demand was assumed, as shown in
Figure S1 in the Supplementary Materials.
2.4. Disruption Scenario Configuration
This study introduced four disruptive event scenarios for a WDS: pump shutdown, pump rate manipulation, and pipe leaks/burst with or without the isolation of disrupted DMAs, which represent physical and operational failures, and evaluated the resilience of the CT-WDS, DC-WDS, and MG-WDS options. Such disruptions can arise from various causes; for example, pump shutdown can result from power outages or man-made and natural disasters (e.g., earthquake). Cyber–physical attacks manipulating sensor readings, communication links, or system control can lead to both pump shutdown and pump rate manipulation [
22]. Pipe leaks/bursts can occur due to freezing in extreme cold weather, physical deterioration with aging, or natural disasters [
23]. The specifications of the disruptive event scenarios are presented in
Table 1.
For all disruption scenarios, both the DC-WDS and MG-WDS options supply 70% of the total water demand from the central water system and 30% from the local system under normal operating conditions [
24]. During disrupted conditions, the MG-WDS option increases the local water supply from 30% to 40% to minimize water supply losses, while the DC-WDS option maintains the same supply ratio in the normal operating conditions.
Here, this study also incorporated a more complex interactive operation between the central and local water systems for the relatively longer disruption (8 h) in the pipe leaks/bursts scenario, as shown in
Figure S6. For example, when severe pipe leaks or busts occur in a DMA with delayed isolation or emergency actions, the following operational adjustments can be made:
- (1)
The local water supply in the disrupted DMA increases from 30% to 50% until the local water is exhausted. Other DMAs in normal conditions maintain their original water supply portions between the central and local water systems.
- (2)
Once local water is depleted in the disrupted DMA, the central supply increases from 70% to 80% to minimize the losses of water supply and pressure. To compensate for the increased central water supply to the disrupted DMA, other DMAs reduce their central supply from 70% to 60% while increasing their local supply from 30% to 40%.
2.5. Resilience Evaluation
This study employed a functionality-based measure to evaluate the resilience of the CT-WDS, DC-WDS, and MG-WDS options under the disruptive event scenarios in
Table 1. The functionality-based resilience measure has been widely adopted in evaluating various water systems’ resilience because it can provide a comprehensive evaluation of systems’ withstanding, absorptive, adaptive, and restorative capabilities based on the time variation of system functionality before, during, and after disruptions (
Figure 2) [
22,
25].
Further details for the functionality-based measure can be found in [
25]. The mathematical metric for the functionality-based resilience is represented as follows:
where
is the functionality at time t;
is the start time for disruption;
is the recovered state time; and
is the functionality under normal conditions. The functionality can be considered as a system performance of interest, e.g., the ratio of supplied water to water demand [
26]. Its value is estimated as a normalized value between 0 and 1 (or 100%), calculated as the ratio of the system performance in a disrupted condition to that in a normal condition. The functionality level is 100% under normal conditions, while it decreases below 100% during disruptions and can drop to the lowest possible level of functionality (
). This study defined the functionality as the supplied water demand compared to the water demand in normal conditions.
Meanwhile, evaluating WDS performance using a single resilience measure can suggest limited information for decision making on resilience-based strategies. This is because resilience is a complex concept characterized by its various attributes, e.g., robustness (minimizing system losses), resourcefulness (recovery resource availability), redundancy (alternative resources), rapidity (rapid recovery), failure duration (total time period of disruption), and rate of functionality degradation [
22,
26,
27]. From an engineering perspective, identifying week resilience attributes and implementing strategies addressing the week attributes will contribute to effectively enhancing WDS resilience. In this regard, this study considered robustness (the minimum level of functionality during disruption, RS), the loss rate (the average rate of functionality drop during disruption, LR), and the recovery rate (the average rate of functionality recovery, RR) as the resilience attributes. The metrics for the attributes were adopted from those used in [
26,
28]. The equations for each resilience attribute metrics are summarized in
Figure 2.
4. Conclusions
As a water sustainability strategy, alternative water sources based on water reuse and recycling and their distributed supply based on a “fit-for-purpose” approach have gained attention over the last decade. However, various disruptive events, such as natural and man-made disasters, cyber–physical attacks, and infrastructure aging, pose challenges to sustainable water supply in both the short and long term. In this regard, this study applied the microgrid approach to a WDS as a resilience strategy against such disruptions. A lab-scale physical WDS model was developed to demonstrate centralized (CT-WDS), decentralized (DC-WDS), and microgrid (hybrid, MG-WDS) system operations and was tested through various disruptive scenarios (pump shutdown, pump rate manipulation, and pipe leaks/bursts). The overall results from the evaluation of functionality-based resilience and its attributes (robustness, loss rate, and recovery rate) suggest that the microgrid approach, with decentralized local water sources and operational interactions with the existing centralized system, enhanced resilience more effectively than the conventional CT-WDS and DC-WDS, contributing to sustainable water supply during disruptions. The primary takeaways from this study are as follows:
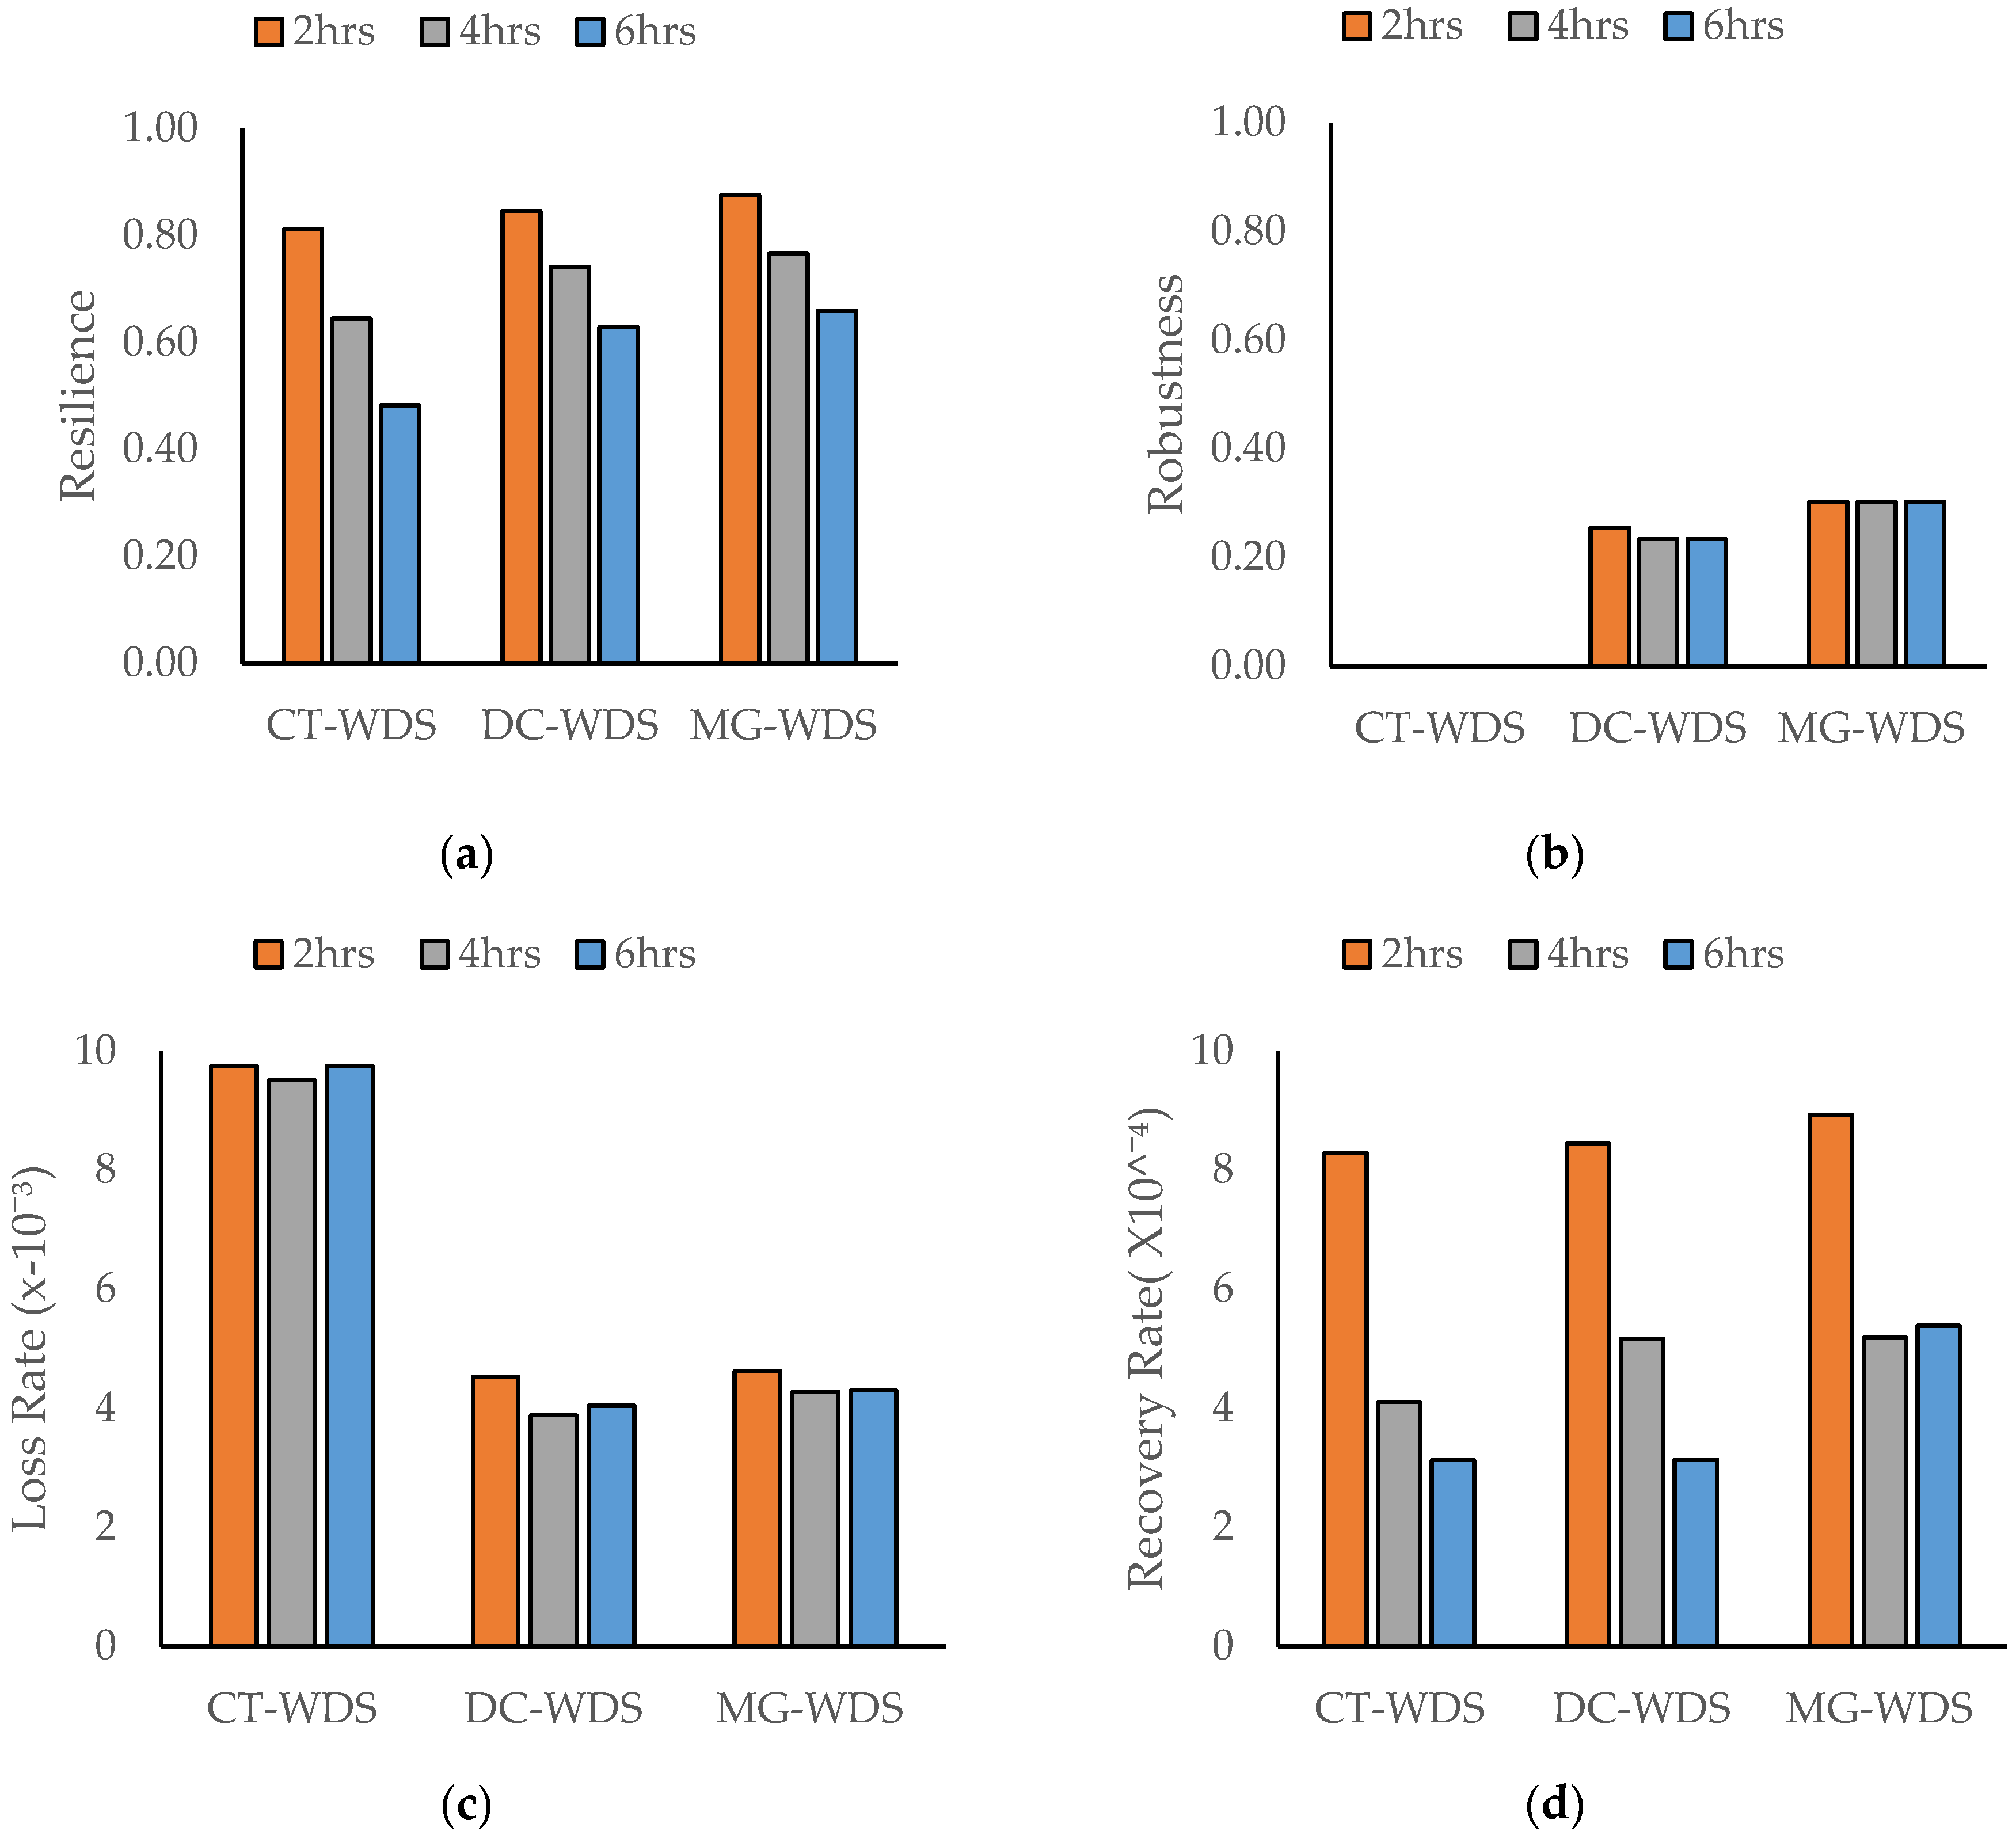
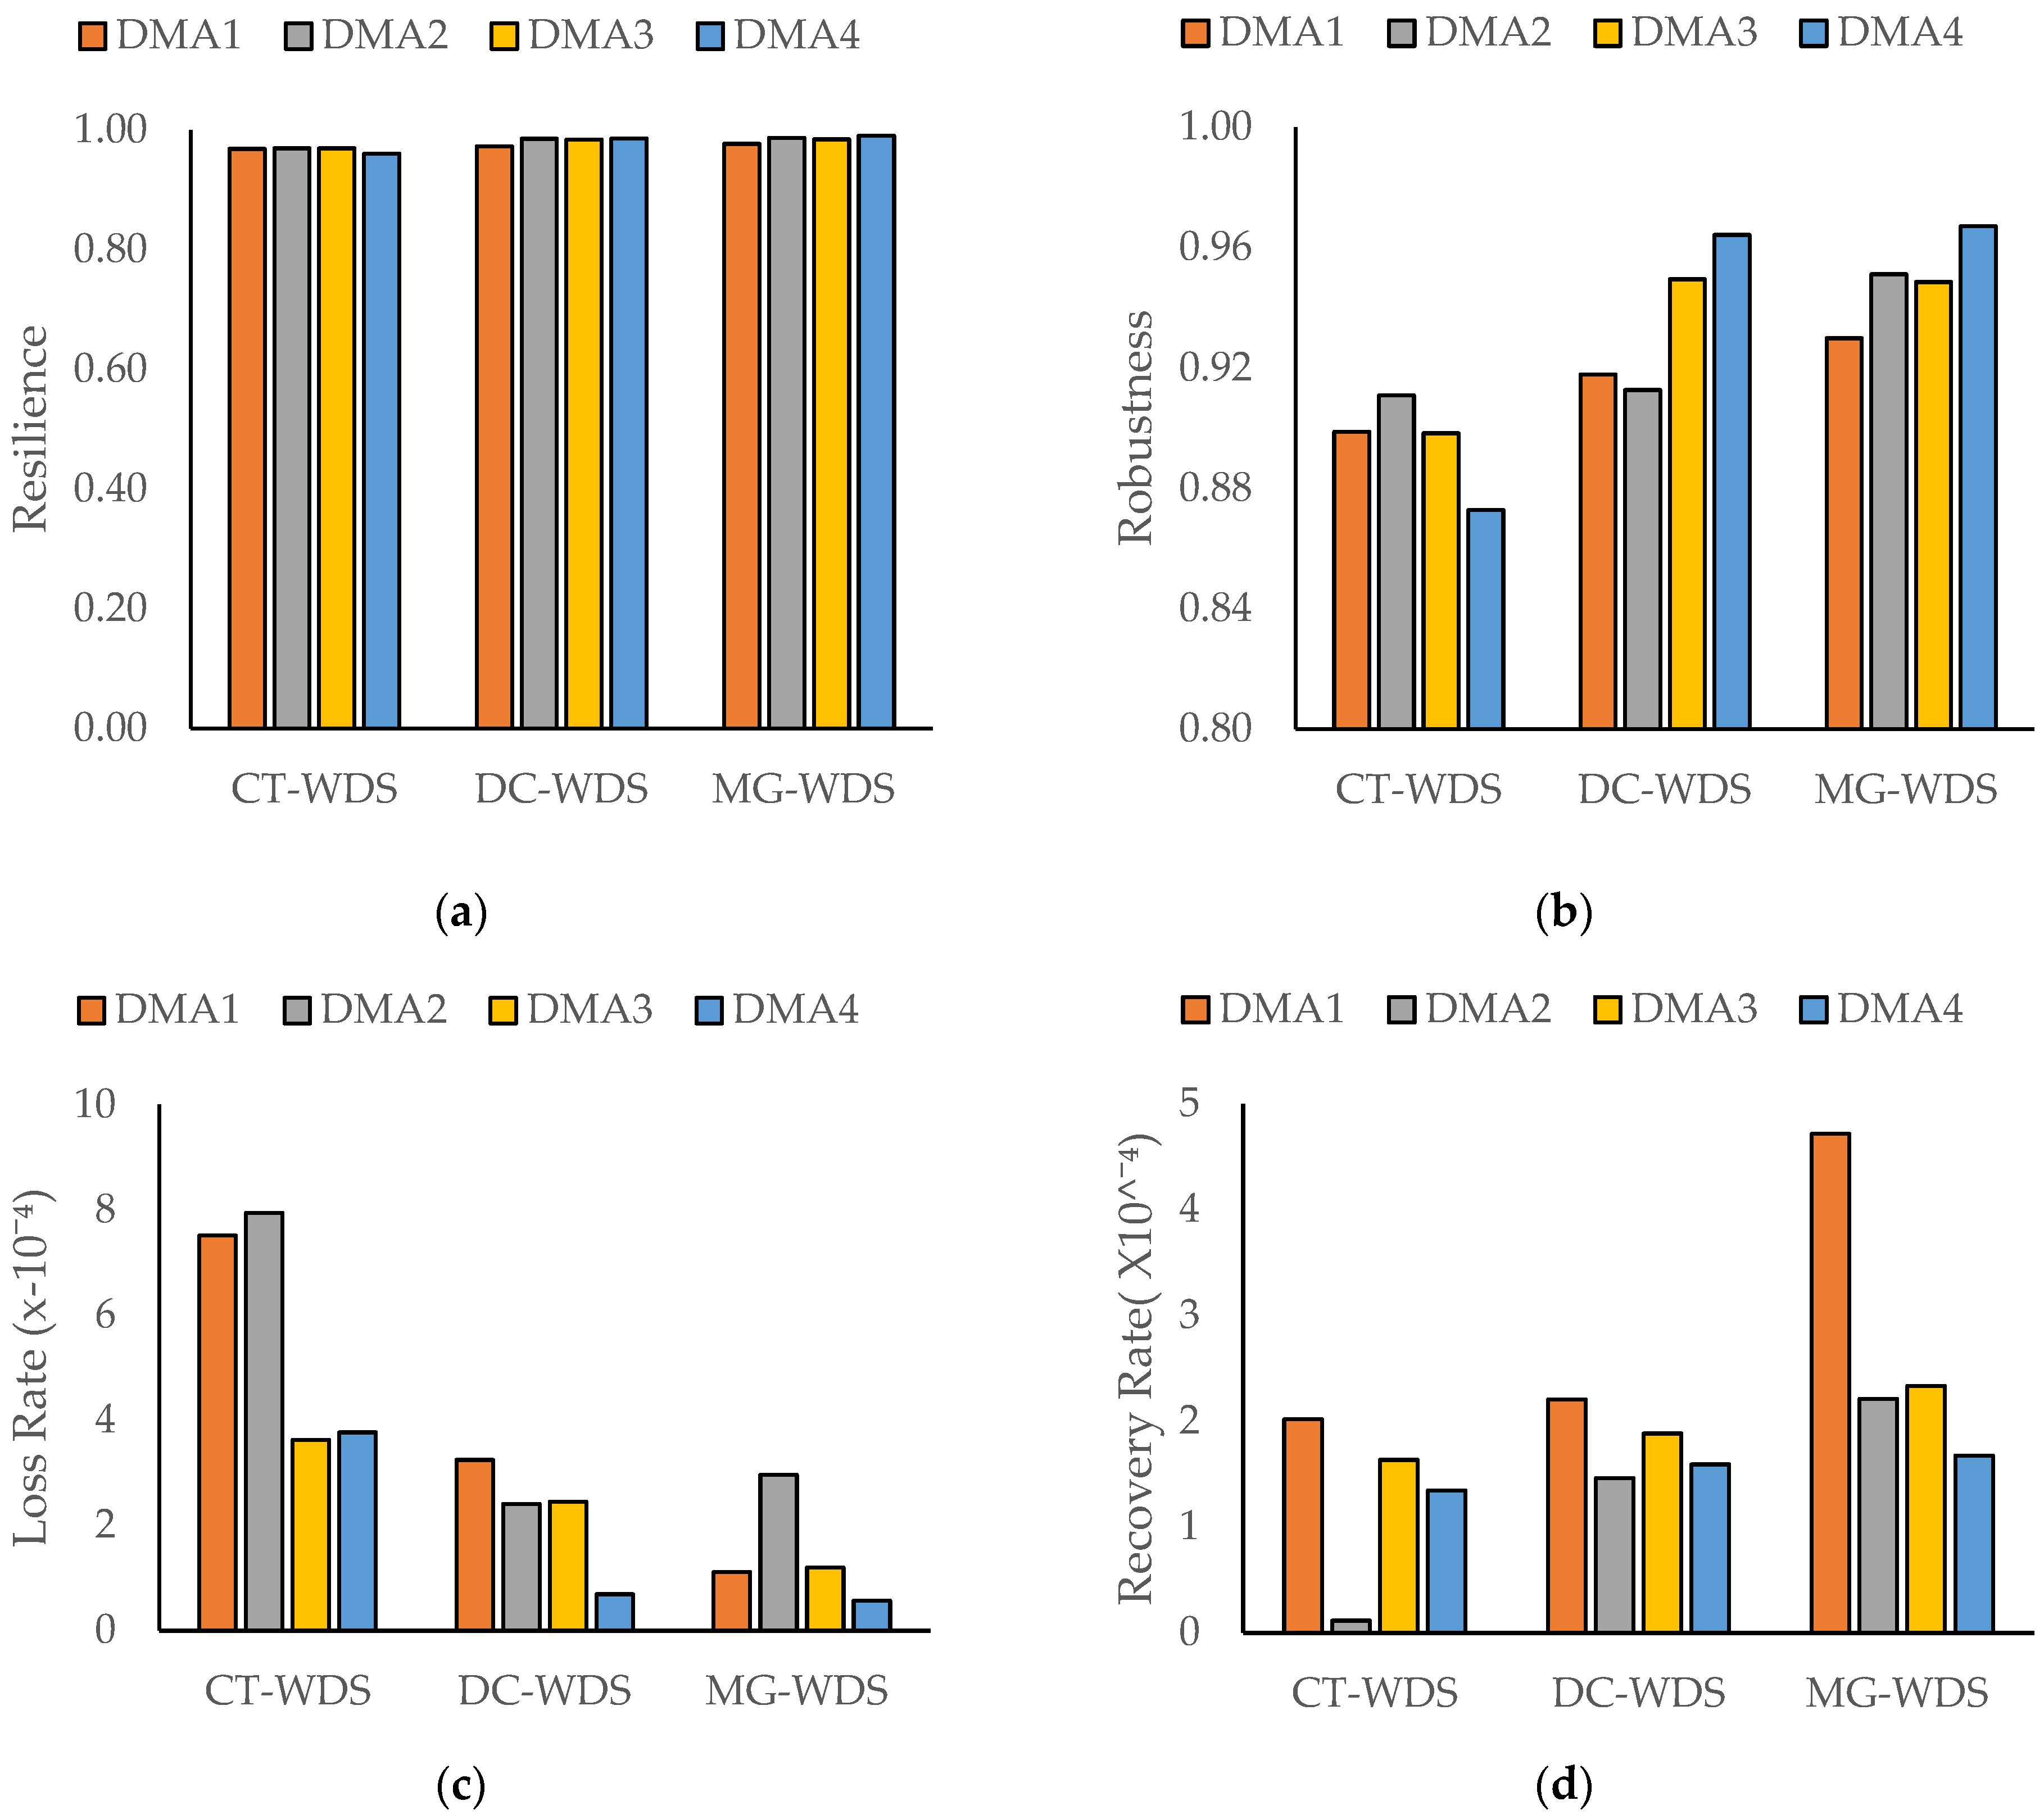
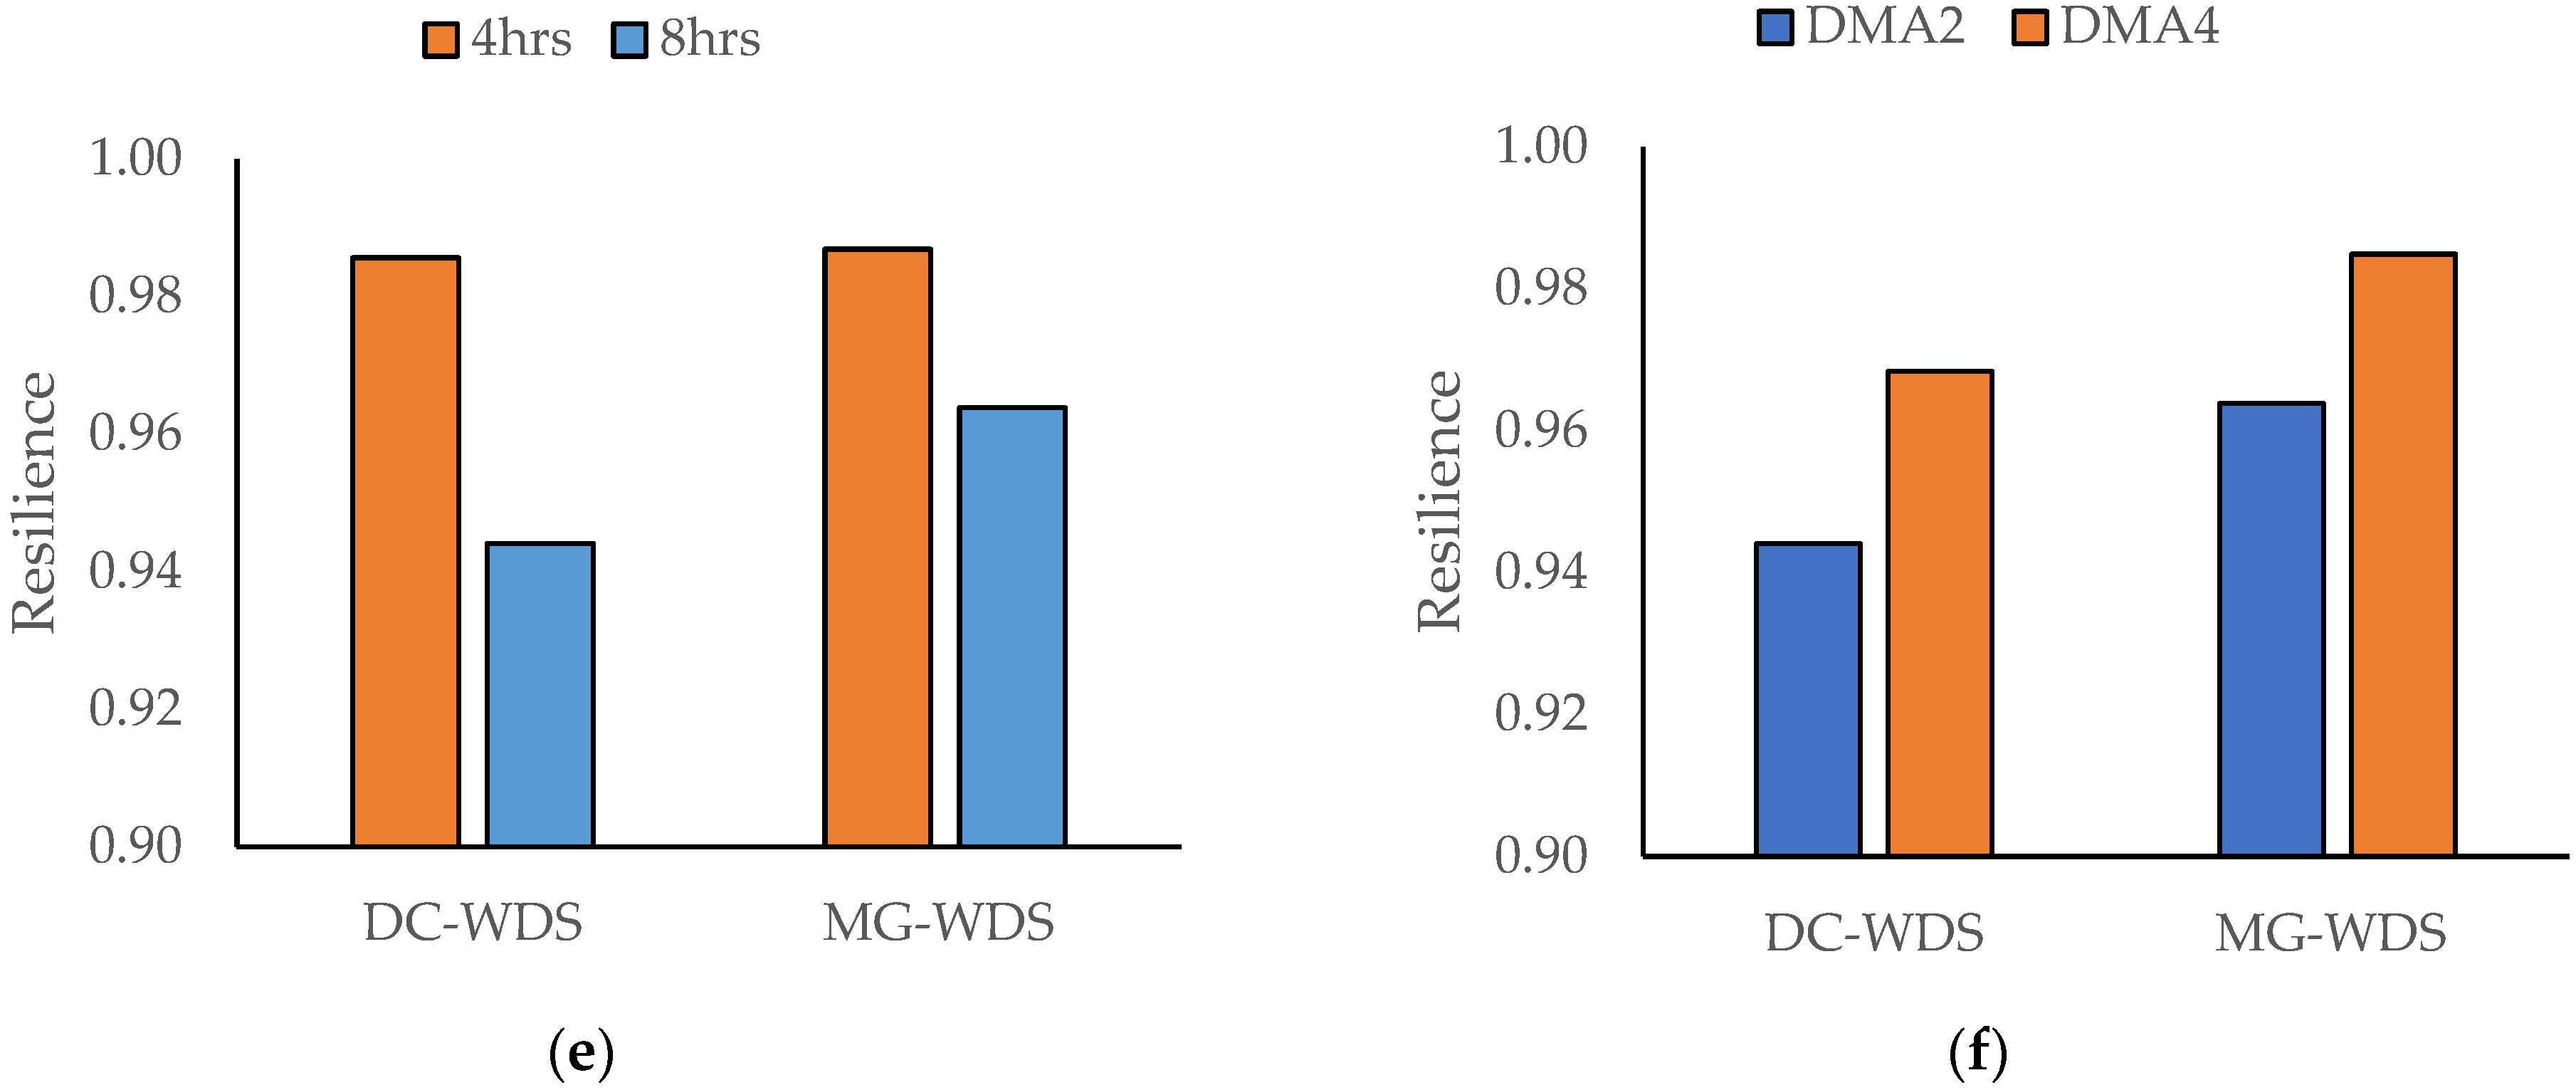
MG-WDS demonstrated higher resilience than CT-WDS and DC-WDS by sustaining partial water supply during pump shutdowns and adjusting the operation of local water supply based on the central system’s conditions. While the resilience levels decreased with longer disruptions, the MG-WDS option produced the lowest rate of resilience decline, which highlights the resilience effect of water microgrids with operational interactions between centralized and local systems.
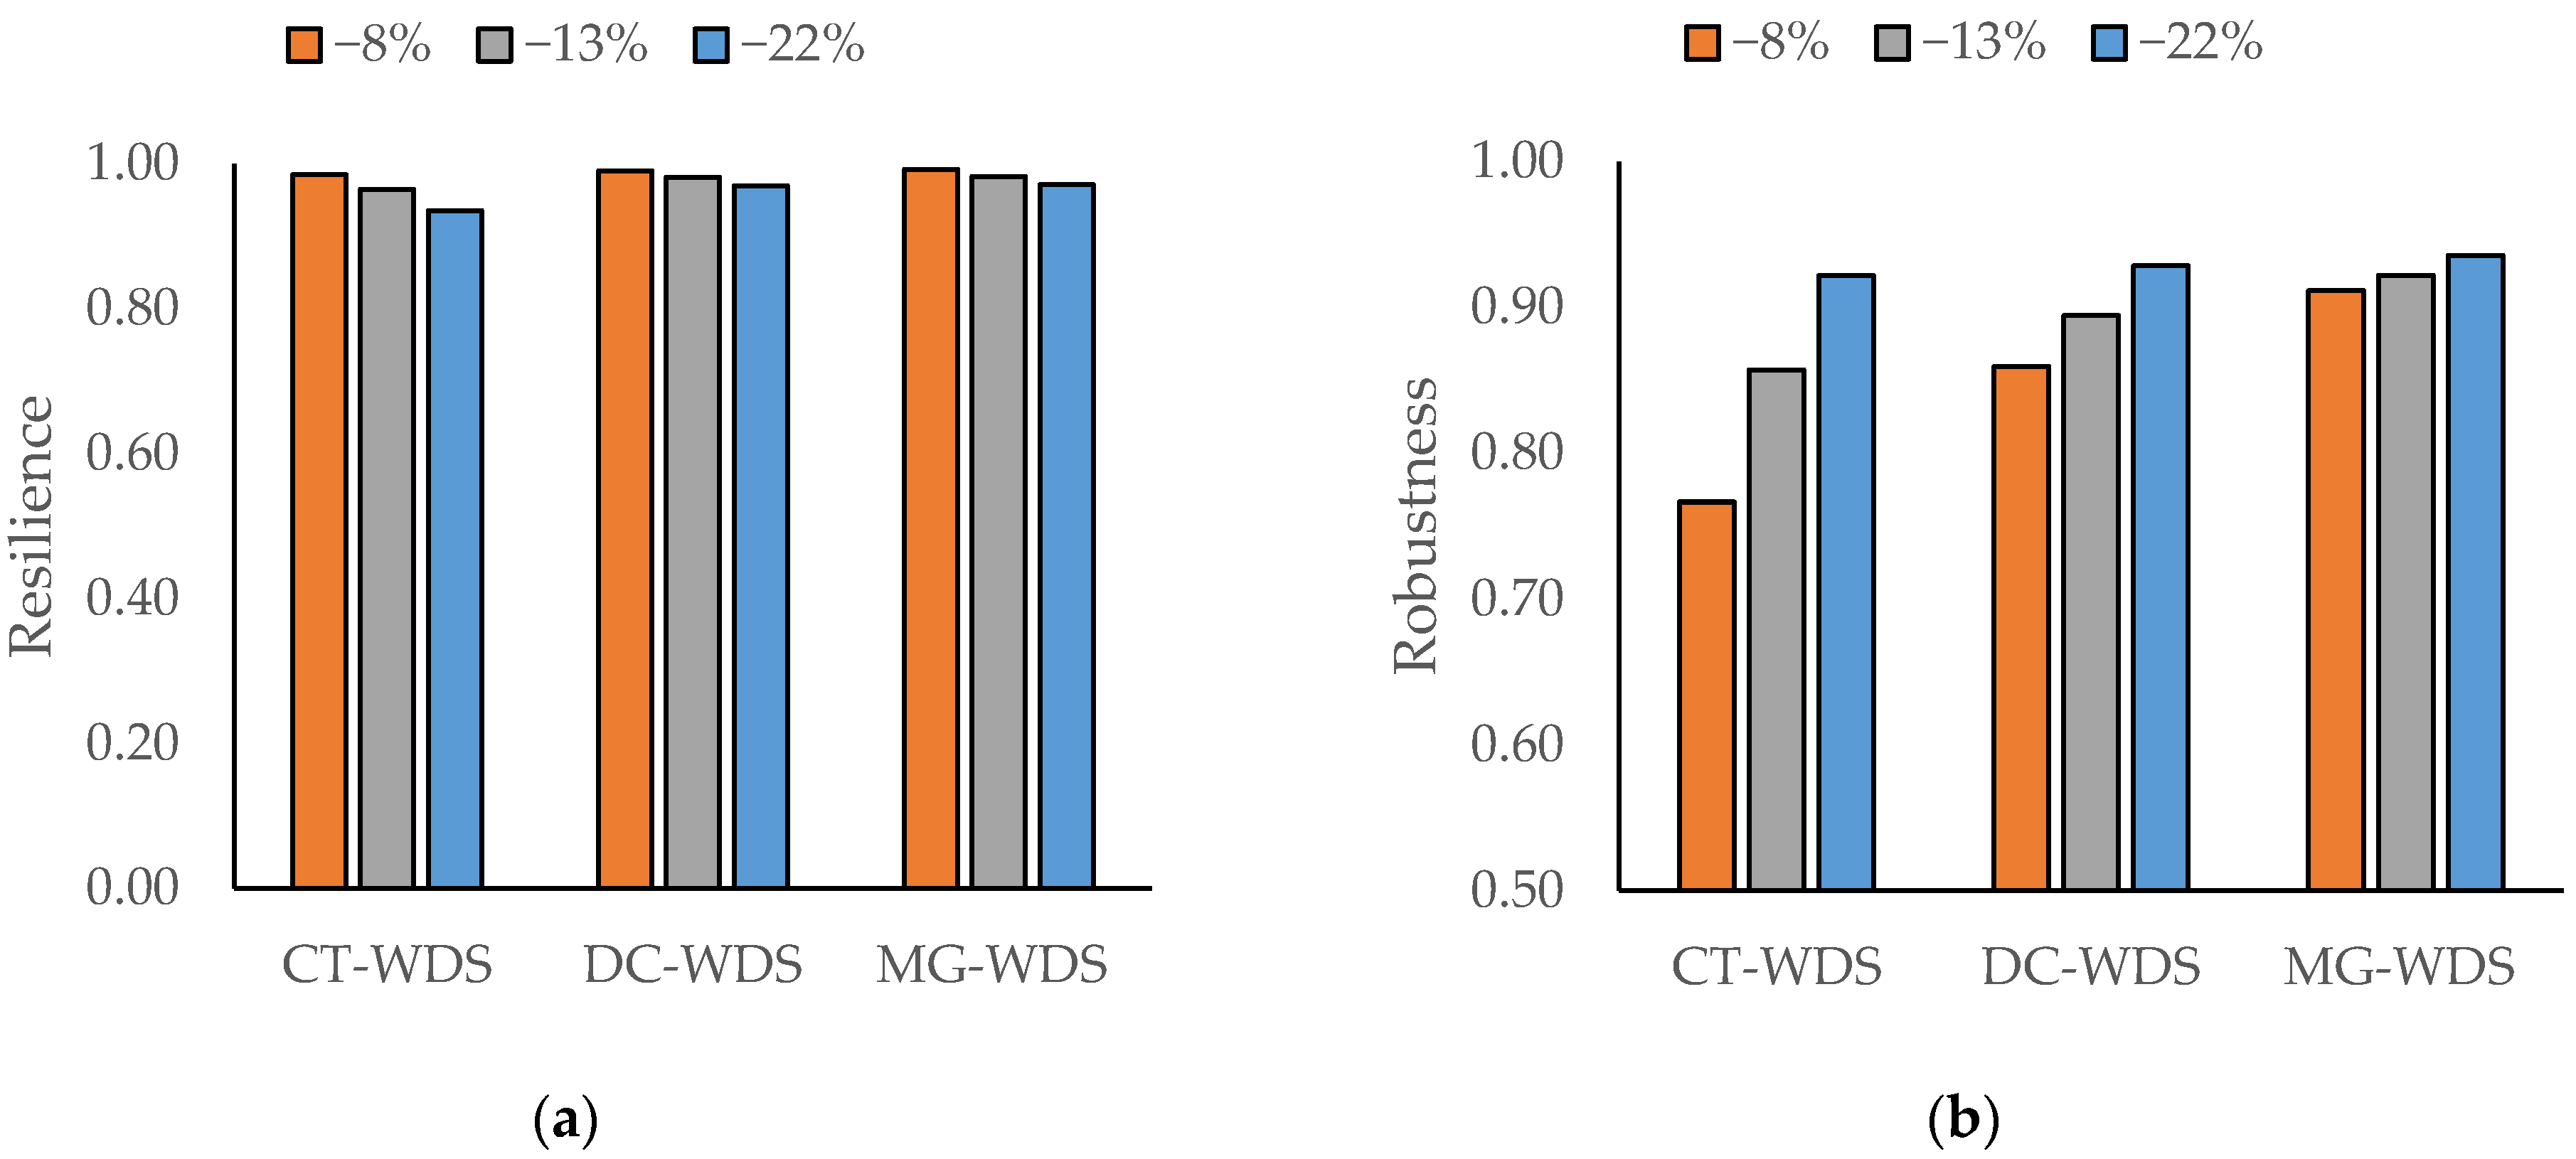
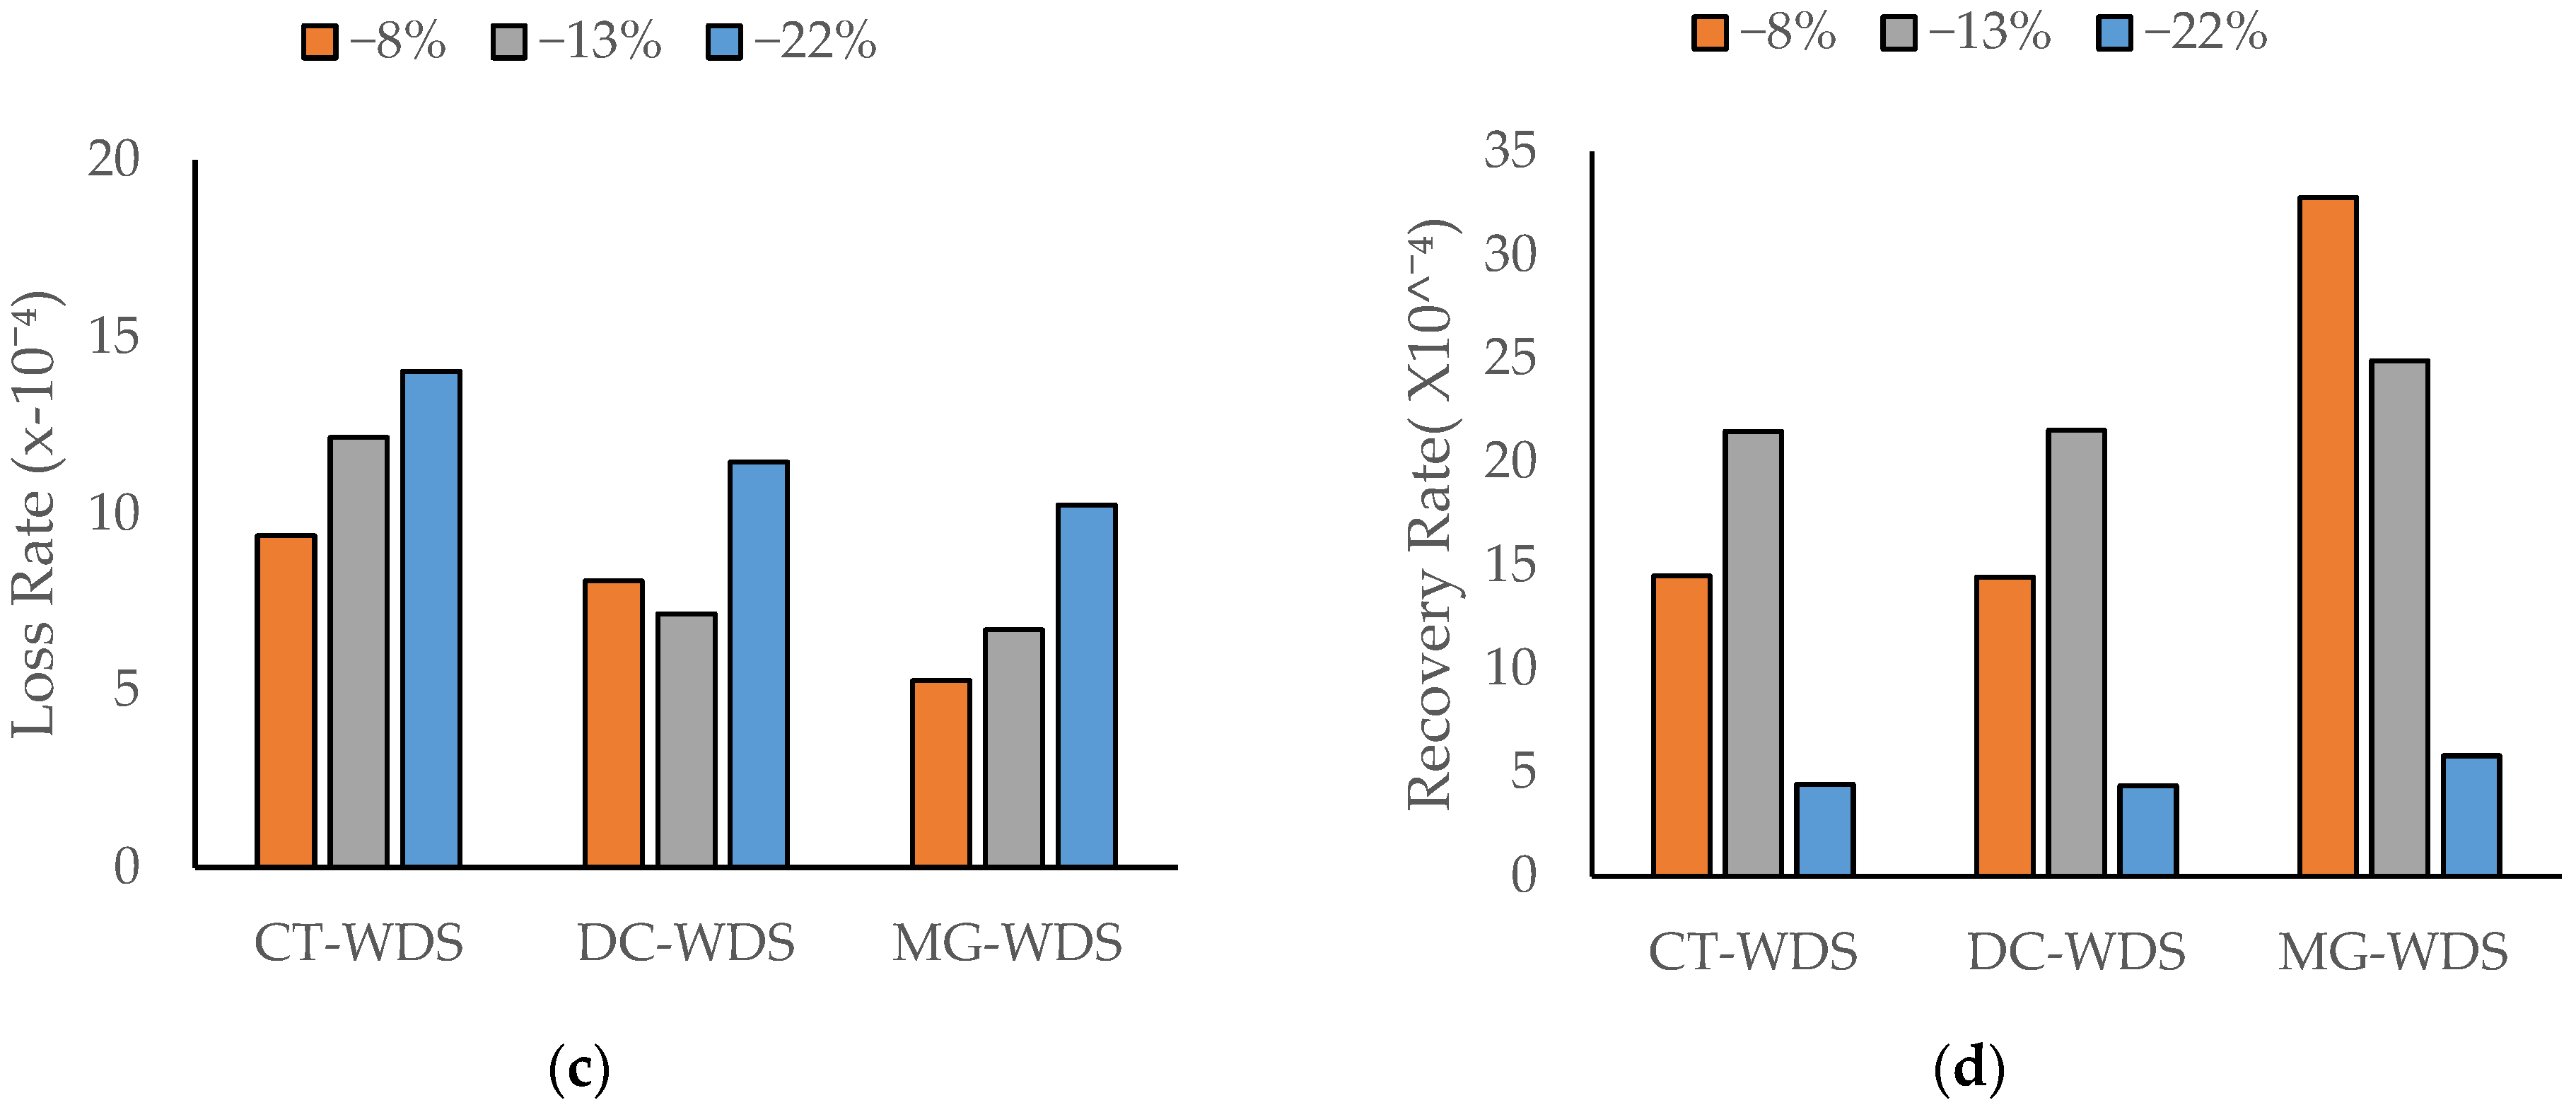
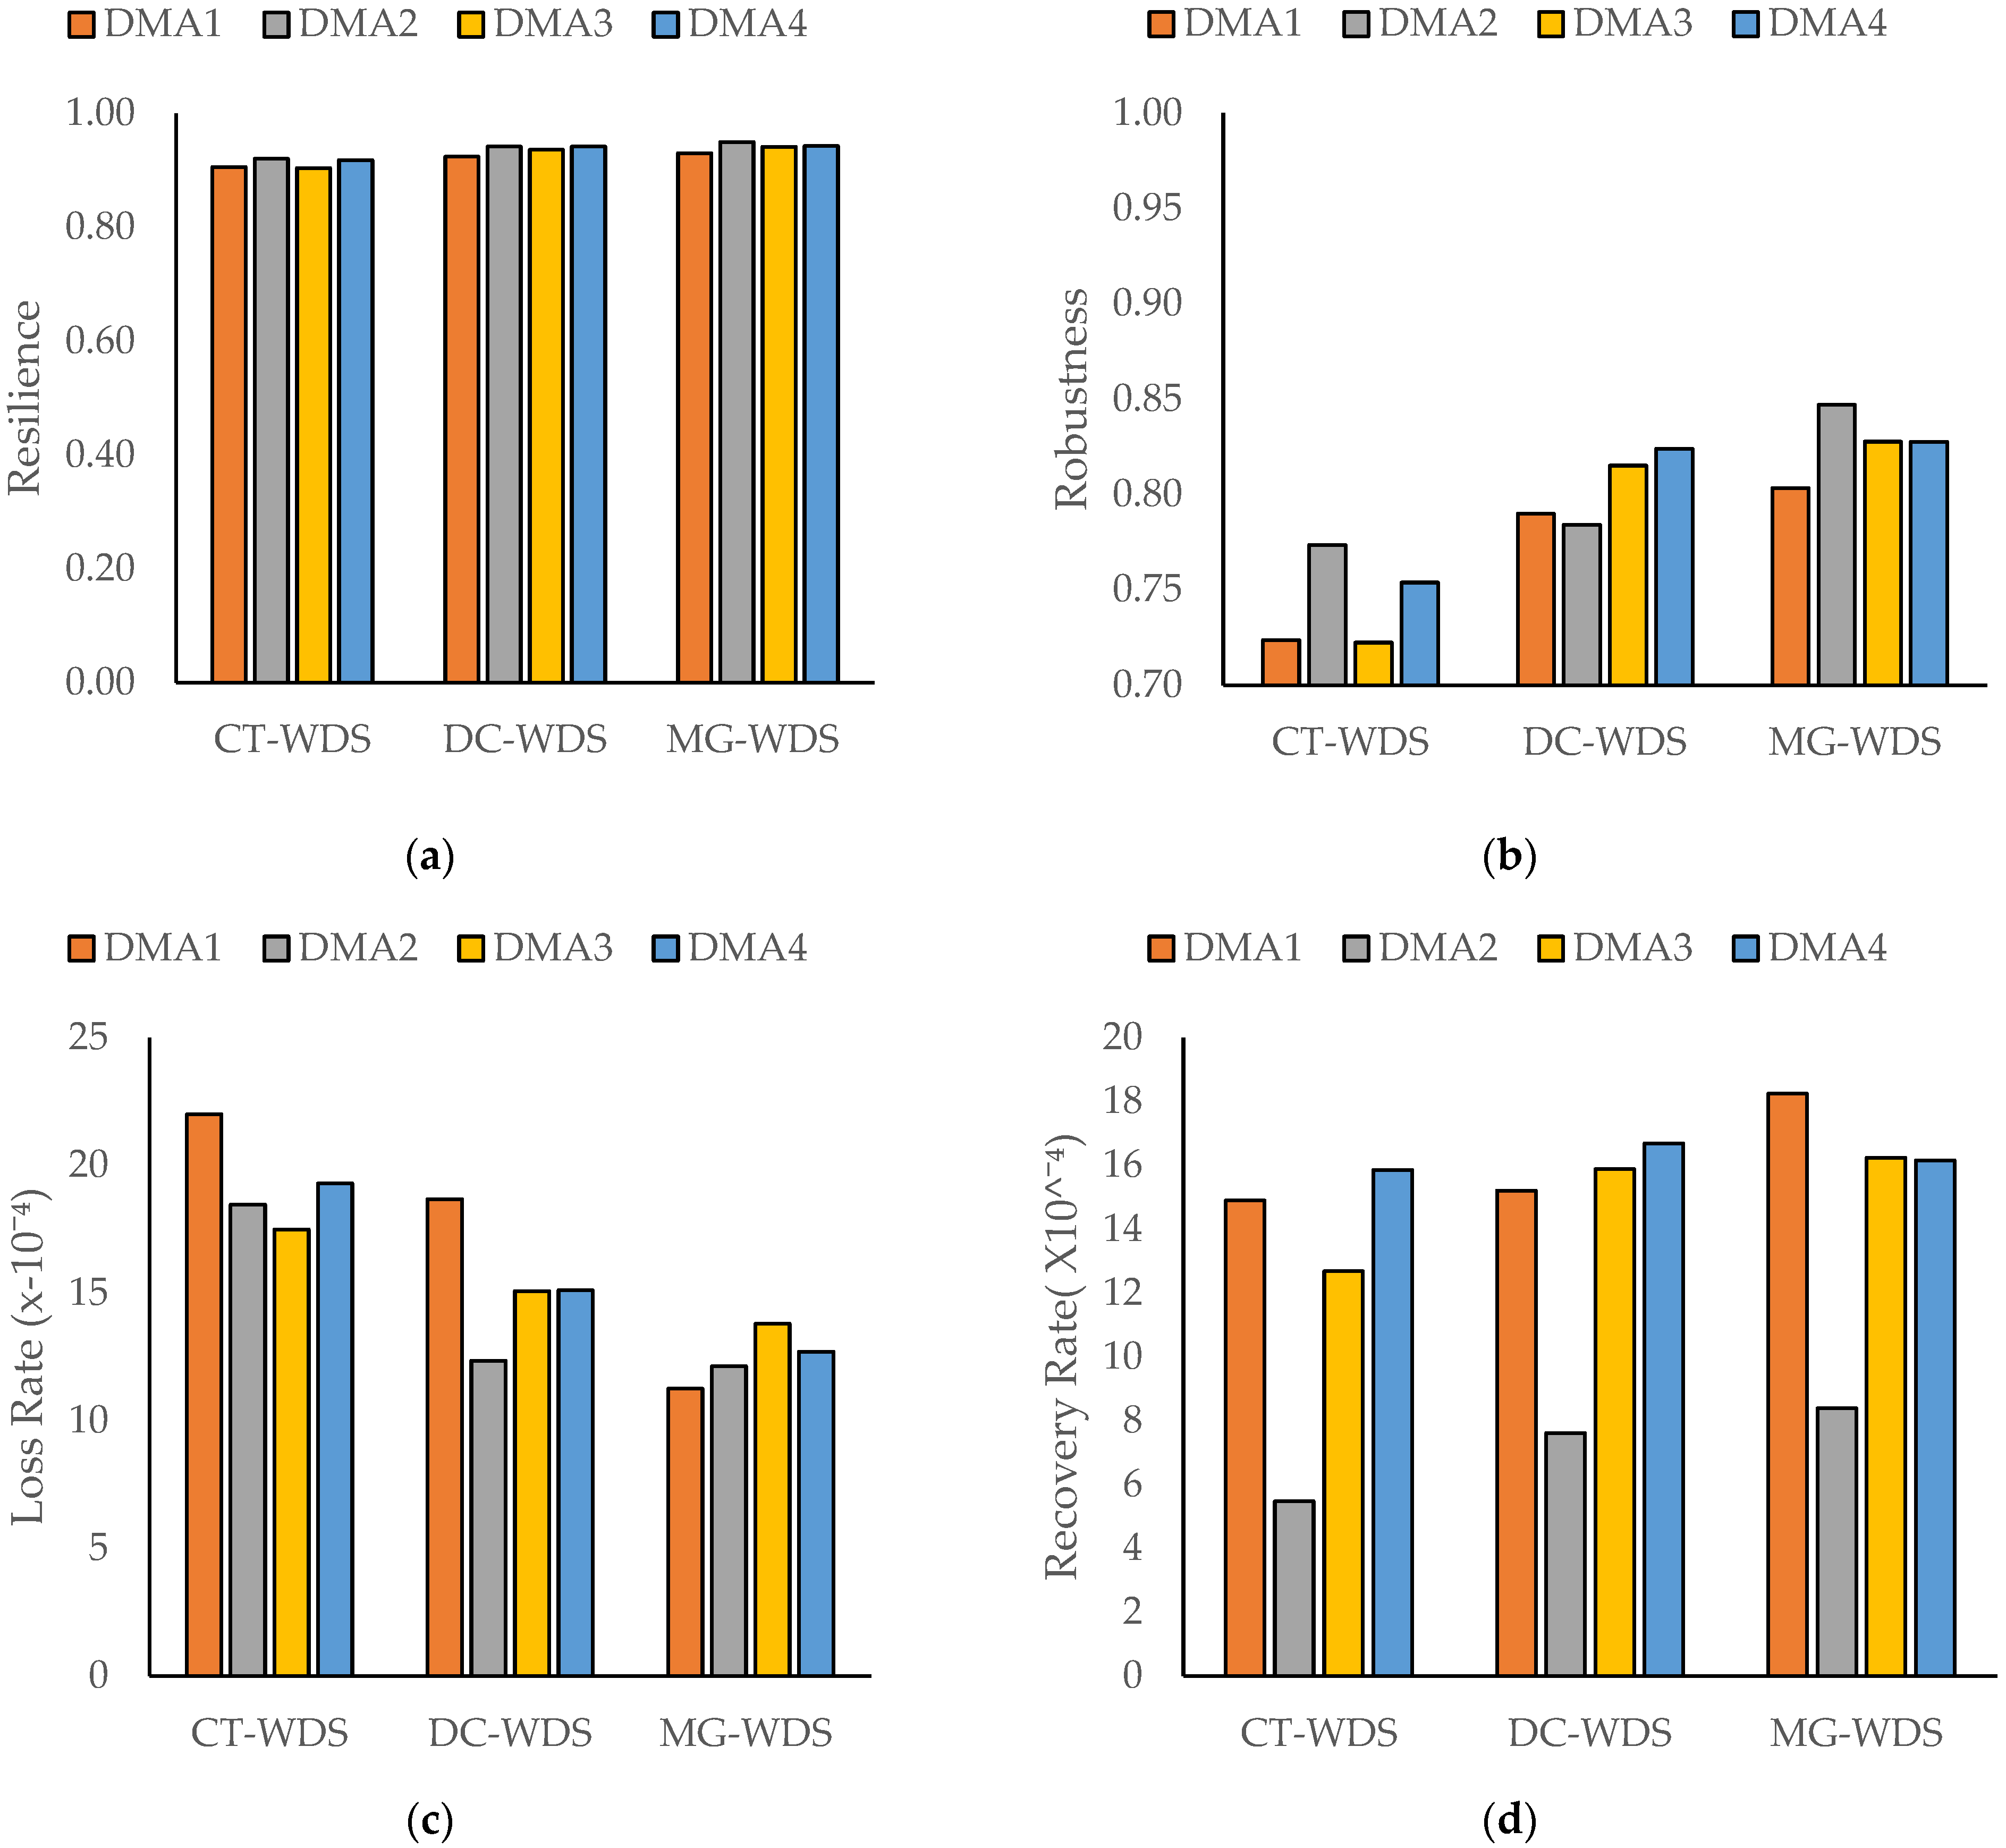
MG-WDS produced the highest resilience to pump rate manipulation (pump rate reduction) by the operational adjustment of local water systems based on system disruptions. CT-WDS remained the most vulnerable due to its lack of redundant water sources. The resilience effect of MG-WDS became more evident with higher pump rate reductions.
Water microgrids showed the highest resilience to pipe leaks/bursts, outperforming CT-WDS and DC-WDS due to increased redundancy from local water sources and adaptive operational adjustments. The active operational adjustment of the local system, considering the availability of local and central water sources and system operation conditions, demonstrated more effectiveness in enhancing resilience than other WDS options and passive operational interactions (simple increase in local water supply when the system is disrupted).
MG-WDS showed higher resilience than CT-WDS and DC-WDS under the pipe leaks/bursts scenarios with the isolation of a disrupted DMA, as it could partially supply water to the isolated area from its local sources and change the local water system’s operations to mitigate water service loss.
In general, resilience-based options focus on minimizing water service loss during disruption and quickly recovering to the original or a better state after the disruption. Based on the findings of this study, the transformation of current WDSs to water microgrids can enhance resilience attributes, ultimately improving overall system resilience and contributing to a sustainable water supply under disruptions.
This study analyzed and discussed the variation of resilience and its attributes across combinations of various WDS operation options and disruption scenarios. However, disruptions can occur from a wider range of causes, with uncertainty regarding their intensities and durations. Therefore, a more comprehensive statistical analysis of the variations in resilience and its attributes across a broader range of disruption events (e.g., hydraulic transient, contaminant intrusion, and cyberattack/failures), intensities, and durations is needed to improve the understanding of the resilience effects of hybrid water systems or water microgrids. In addition, the resilience effects of water microgrids can vary with physical and operational configurations, e.g., water pipe connectivity, WDS size, valve/tank placement, local storage capacity, backup pump/power supply, and the local water supply schedule. Therefore, further investigation with statistical approaches (e.g., significance test and sensitivity analysis) is also needed to test and compare the resilience effects of centralized, decentralized, and microgrid water systems under diverse configurations. Such investigations will offer insights into developing a more practical approach to determine their resilience effects in decision making.
Meanwhile, identifying critical parameters in the design and operation of water microgrids can help effectively enhance WDS resilience. For example, water supply failures during peak demand periods or with low redundancy in water supply routes due to limited pipe connectivity can lead to severe losses in water supply performance. This will make the system more vulnerable, resulting in lower resilience. In addition, the design parameters, such as the local storage size, local water supply schedules, and local water quality, can impose limitations on local water system operations during WDS disruptions, which will also affect system resilience. Therefore, analyzing and evaluating design parameters critical to the resilience levels and variations of water microgrids under various disruption types, intensities, and durations and considering these critical parameters in water microgrid design and operation can contribute to enhancing resilience more effectively. In this regard, understanding critical design parameters (e.g., local water storage capacity and locations, pump/gravity-driven supply, and demand patterns) using a sensitivity analysis with various disruption scenarios and WDS operation options is further needed for optimizing the design, operations, and performance of water microgrids.
While this study provides insights into the resilience effects of water microgrids using a lab-scale model demonstration, it is important to note that the model is a hypothetical representation and was not scaled down from a real WDS using hydraulic similarity. Therefore, translating the findings from this study to full-scale or large-scale WDSs with more complex interactions may pose limitations in understanding the system performance and resilience effects of real-scale water microgrids. Since a full-scale water microgrid system has not yet been implemented, a future study can investigate scaling up the results of the lab-scale model using hydraulic simulation models (e.g., EPANET2 and WaterGEMS). This future study will provide an understanding of how key resilience features observed in the lab-scale model can translate to larger, more complex WDSs.
In addition to the microgrid configuration, rapid detection of system anomalies, identification of disruptive events, and accurate localization of problematic components can further help strengthen resilience through rapid implementation of timely emergency and recovery actions. However, monitoring systems, designed for this purpose using cyber system components (e.g., sensors/meters, communication links, and controllers), can become more vulnerable to cyber–physical attacks. Therefore, further studies that include sensor placement, anomaly detection and early warning, multiple communication networks, and cyber security are needed to develop a smart system or cyber–physical system framework for water microgrids incorporating advanced monitoring and real-time control.
Additionally, implementing water microgrids involves local water production and distribution with additional treatment, storage, pumping, and dual piping systems. This will lead to significant capital and operational costs, increased energy consumption, and potential environmental impacts. Further investigation into the sustainable implementation (development) of water microgrids is needed to balance resilience enhancement with minimizing social, environmental, and economic impacts.
