Article

Research on the Modification of the Coal Pore Structure by Indigenous Microbial Degradation

1
School of Energy Resources, China University of Geosciences, Beijing 100083, China
2
PetroChina Research Institute of Petroleum Exploration & Development, Beijing 100083, China
3
Institute of Energy Resources, Henan Polytechnic University, Jiaozuo 454003, China
4
College of Geosciences and Surveying Engineering, China University of Mining and Technology (Beijing), Beijing 100083, China
*
Authors to whom correspondence should be addressed.
Sustainability 2025, 17(8), 3337; https://doi.org/10.3390/su17083337
Submission received: 26 February 2025 / Revised: 25 March 2025 / Accepted: 31 March 2025 / Published: 9 April 2025

Abstract

:
Microbial-Enhanced Coalbed Methane (MECBM) is a technology that generates new methane gas in coal seams through the action of microorganisms, thereby improving the efficiency of coalbed methane development. In this study, low-temperature CO2 adsorption, low-temperature N2 adsorption, and isothermal adsorption experiments were conducted to systematically characterize the changes in the pore characteristics of low-rank coals in Xinjiang before and after degradation. The results show that microbial action increases the average pore diameter and enhances pore connectivity. Meanwhile, it reduces the fractal dimension of the pore surface and simplifies the complexity of the pore structure. The modification of the pore structure effectively promotes the efficiency of methane desorption and migration, thus improving the exploitation potential of coalbed methane. Microbial degradation avoids the risk of deterioration of reservoir physical properties through biological modification, and reduces carbon emissions and environmental pollution. This study provides an environmentally friendly solution for the low-carbon development of coal resources, and has important scientific significance for promoting the transformation of energy structures and achieving the goal of carbon neutrality.

1. Introduction

Coalbed Methane (CBM) is an unconventional natural gas found in coal seams, serving as a clean and high-quality energy source as well as a chemical feedstock. Due to continuous global energy demand growth and rapid technological advancements, CBM development has become a crucial pathway for achieving clean coal utilization and optimizing energy structures [1,2,3,4]. However, efficient CBM development faces several challenges. The complex coal seam conditions result in low drilling extraction rates and poor economic returns. The relatively low permeability obstructs the gas desorption–diffusion–flow process [5]. In some regions, individual well production is less than 1000 m3 per day, severely limiting the large-scale development of CBM [6,7]. Moreover, during the implementation of traditional hydraulic fracturing technology, the phenomenon of coal powder plugging is extremely likely to occur. This not only exacerbates the deterioration of reservoir permeability but also brings along a series of severe problems, such as the massive consumption of water resources and the potential risk of environmental pollution. Therefore, there is an urgent need for innovative technological breakthroughs within the industry to address the bottleneck issues of traditional technologies [8,9,10].
Microbial-Enhanced Coalbed Methane Production (MECBMP) offers novel solutions to the aforementioned issues and is gradually emerging as an effective approach for augmenting methane production and modifying coal reservoirs [11,12,13,14]. This technology promotes the generation of coalbed methane by introducing exogenous microorganisms or stimulating indigenous microorganisms and making use of the degradation of the coal matrix by microorganisms. Meanwhile, it improves the reservoir properties and enhances the recovery rate of coalbed methane [15]. As an emerging technology in the domain of CBM development, MECBMP has demonstrated unique advantages in addressing traditional development challenges and has garnered increasing attention. Existing studies have shown that microbial degradation can significantly modify the pore structure of coal reservoirs through biochemical processes. For example, extracellular enzymes (such as cellulase and lignin peroxidase) secreted by exogenous microbial communities (such as Bacillus) can degrade aliphatic and various aromatic compounds in the coal matrix [16,17,18]. This leads to the merging of micropores into mesopores, with an increase in the average pore width (APW) of 30–50%, and simultaneously reduces the pore fractal dimension, thereby enhancing pore connectivity and accelerating the methane desorption rate [19,20,21]. The MECBM engineering practices in the Powder River Basin in the United States and the Sydney Basin in Australia have demonstrated that this technology can effectively increase the productivity per well and the recovery rate [22,23].
Most of the existing studies focus on the modification of medium- and high-rank coals by exogenous bacteria, paying insufficient attention to the adaptability to low-rank coal reservoirs and the potential of indigenous microorganisms. The development of low-rank coal faces numerous challenges. The geological conditions are complex, and the coal seam structure is unstable. Low-rank coal reservoirs are often accompanied by high-mineralization formation water, which easily inhibits the activity of exogenous bacteria. In addition, the pore structure of low-rank coals is relatively underdeveloped, with low permeability, which seriously affects the desorption and migration efficiency of coalbed methane. Therefore, the research on coalbed methane development technologies for low-rank coals is particularly important [24,25]. In response to the above challenges, this study innovatively focuses on the in-situ indigenous methanogenic flora in low-rank coals in Xinjiang. The Xinjiang region in China is mainly composed of medium- and low-rank coals. The coal reservoirs have special geological conditions of high vitrinite content (>65%) and high-mineralization formation water (total dissolved solids TDS > 10 g/L) [26,27,28]. The indigenous microorganisms have long adapted to this environment, and their metabolic pathways are highly compatible with the aliphatic components of the coal matrix. They can preferentially degrade the organic matter in micropores through synergistic metabolism and optimize pore connectivity. Compared with exogenous bacteria that rely on artificial regulation, indigenous bacteria can maintain their activity without external intervention and avoid the ecological risks associated with the introduction of exogenous bacteria [29,30,31].
In this study, we carried out anaerobic degradation experiments using in situ methanogenic bacterial colonies in Xinjiang low-rank coal. Moreover, by integrating low-temperature N2 adsorption, low-temperature CO2 adsorption, and isothermal adsorption analyses, we systematically characterized the modification effects of microbial action on the coal’s pore structure (including specific surface area, pore volume, and average pore diameter), methane adsorption characteristics, and permeability. The research results can provide theoretical support for the application of microbial-enhanced production technology in low-rank coal reservoirs. Moreover, by reducing the reliance on chemical additives and carbon emissions, it offers crucial technical support for the low-carbon development of coal resources and the realization of carbon neutrality goals.

2. Materials and Methods

2.1. Experimental Samples

2.1.1. Coal Sample Preparation

This experiment selected lignite samples from the Lower Jurassic Badaowan Formation in the Fukang Sag (FK) of the Junggar Basin and the Naomaohu Sag (NMH) of the Santanghu Basin in Xinjiang as research objects. The vitrinite maximum reflectance (Ro) of the Fukang Sag coal sample (FK) is 0.8%, which formed in a lacustrine-swamp depositional environment during the Early-Jurassic period (approximately 180 million years ago) under static water-reducing conditions. The organic matter mainly originated from terrestrial higher plants [32]. Influenced by the humid paleoclimate, this area had a high peat accumulation rate, with vitrinite content reaching 83% (Table 1). The Naomaohu Sag coal sample (NMH) from the Santanghu Basin has a vitrinite maximum reflectance (Ro) of 0.35%, formed in a Jurassic peat swamp environment with humic-type organic matter, and vitrinite accounts for 85.3% (Table 1).
According to GB/T 30732-2014 “Methods for Proximate Analysis of Coal” and GB/T 31391-2015 “Determination of Maceral in Coal”, proximate analysis and maceral determination were carried out on the coal samples, with detailed results presented in Table 1.
The experimental sample pretreatment process was as follows: The raw coal samples were ground and divided into two groups. One group was sieved to obtain 80–100 mesh coal powder for low-temperature N2 adsorption and low-temperature CO2 adsorption experiments; the other group was sieved to obtain 60–80 mesh coal powder for isothermal adsorption measurements. The raw samples were labeled as FK (pretest) and NMH (pretest). The biodegradation samples were washed three times with deionized water at room temperature and dried at 90 °C for 12 h, labeled as FK (posttest) and NMH (posttest).

2.1.2. Experimental Procedure of Microbial Degradation

The experimental strains were derived from in situ methanogenic flora in the mine water of coal beds of the Badawan Formation in the FK Depression and the NMH Depression in the Santang Lake Basin in Xinjiang. A step-by-step culture and domestication method was adopted to domesticate the flora with coal rock as the substrate, and the domestication cycle was 20 days to screen out the methanogenic functional flora that could efficiently degrade coal organic matter. Medium composition (unit: g/L): K2HPO4 0.4, MgCl2 0.1, KH2PO4 0.2, yeast extract 1.0, tryptone 0.1, NH4Cl 1.0, cysteine salt 0.5, Na2S 0.2, NaHCO3 2, sodium acetate 0.5, sodium formate 0.5, FeSO4·7H2O 0.1, CoCl2·6H2O 0.1, and NiCl2·6H2O 0.02 [19,20,21].
Before the experiment, to eliminate the interference of the original microorganisms in the coal samples on the experimental results, the coal samples were irradiated with ultraviolet light for 60 min to inactivate the endogenous bacteria, and the culture medium and equipment were autoclaved at 121 °C for 120 min to ensure the aseptic conditions of the experiment. In a nitrogen-filled anaerobic glove box (O2 < 0.1%), the acclimated bacterial liquid and coal powder were mixed at a mass ratio of 1:10. Double parallel samples and blank controls (bacterial liquid only) were set up to exclude the interference of other factors. The entire incubation process was carried out at a constant temperature of 40 °C for 21 days. The termination criterion was no gas production for 48 consecutive hours to ensure the full progress of the degradation process. During the incubation period, the proportion of CH4 and CO2 was quantitatively analyzed by gas chromatography every 3 days, and the gas production was synchronously recorded. After the experiment, the samples were washed with deionized water to remove surface-residual microorganisms and metabolites. Subsequently, the coal samples were dried at 90 °C for 12 h to ensure the dryness and stability of the coal samples. Finally, the treated coal samples were sealed and stored for subsequent pore structure characterization.

2.2. Experimental Method

2.2.1. Low-Temperature CO2 Adsorption Experiment

The low-temperature CO2 adsorption experiments were carried out using the American Micromeritics Autosorb iQ2 automated gas adsorption instrument, in accordance with the standards of GB/T 19587-2017 and GB/T 21650.2-2011. Given that the CO2 molecule is small and has a high diffusion rate, it exhibits a relatively higher saturation pressure at the saturation temperature, enabling the measurement of the microporous distribution characteristics within the pore size range of <2 nm. The DFT-specific surface area was calculated based on density functional theory (DFT). Moreover, the corresponding specific surface area parameters were computed by integrating the Dubinin–Radushkevich (DR) and Dubinin–Astakhov (DA) models [33,34]. It should be noted that the DFT method relies on the assumption of pore geometry, which may lead to deviations in the calculation of micropore distribution when the pore structure is complex [35]. The DA model, based on the adsorption potential theory, may underestimate the impact of pore heterogeneity on the adsorption behavior [33]. The alterations in the micropores due to microbial modification were systematically analyzed by comparing the changes in adsorption characteristics before and after the microbial action.

2.2.2. Low-Temperature N2 Adsorption Experiment

The low-temperature liquid nitrogen adsorption experiments were conducted using the same apparatus. In this experiment, the pore size distribution of the coal samples was measured within the range of 1.7–300 nm, and pore structure parameters such as specific surface area (SSA), pore volume (PV), and average pore width (APW) were determined. For data processing, the Brunauer–Emmett–Teller (BET) multipoint theoretical model was employed to calculate the SSA [36], and the Barrett–Joyner–Halenda (BJH) model was utilized to calculate the PV and APW [37,38]. However, the BJH method, based on the capillary condensation theory, may underestimate the pore diameters of micropores. This is because it assumes that the pores are ideally cylindrical and ignores the influence of pore connectivity [39]. Furthermore, the adsorption data before and after the microbial action were analyzed fractally by applying the FHH model, aiming to reveal the mechanism of pore structure modification by microbial degradation.

2.2.3. Isothermal Adsorption Test

According to the standard of GB/T 35210.2-2020, an isothermal adsorption test was conducted on the coal samples before and after microbial degradation using the German RUBOTHERM Isosorp-Hpll Static high-pressure isothermal adsorption instrument. During the experiment, the maximum pressure was set at 30 MPa, and 10 pressure gradient points were established at a constant temperature of 30 °C to ensure the attainment of adsorption equilibrium. By comparing the adsorption isotherms of the coal samples before and after microbial treatment, the impact on the reservoir’s adsorption performance was quantitatively characterized.

2.2.4. Pore Fractal Characterization

Based on the FHH (Fractal Helmholtz–Henry) fractal theory model, the mathematical relationship between adsorption and relative pressure was established:
ln   V = Kln ln   p 0 p + C D = K + 3
P0 is the saturated vapor pressure (MPa), P is the equilibrium pressure (MPa), V is the adsorption volume (equivalent pore volume, m3), D is the fractal dimension, and K and C are constants. When the fractal dimension is small, the pore space development is simple, the pore diameter and pore volume distribution is concentrated, the non-homogeneity is weak, and the pore connectivity is good; when the fractal dimension is large, the pore development is complex and variable, the pore diameter and pore volume distribution are dispersed, the non-homogeneity is strong, and the pore connectivity is poor. The fractal dimension D is generally between 2 and 3, and when close to 2, it indicates that the pore surface is smooth and the pore connectivity is good; when close to 3, the pore surface is rough, the non-homogeneity is strong, and the pore connectivity is very poor; when the fractal dimension is greater than 3 or less than 2, it generally indicates that the fractal characteristics are poor within this aperture range, and it may even not possess the fractal law [40,41,42].

3. Results and Discussion

3.1. Pore Changes Based on Low-Temperature CO2 Adsorption Experiments

In this article, the International Committee for Coal and Organic Petrology (ICCP) classification was chosen for the pore size, which is classified as microporous (less than 2 nm), mesoporous (2–50 nm), and macroporous (greater than 50 nm). Studies have shown that CO2 adsorption has unique advantages in characterizing micropores, while N2 adsorption is more suitable for the analysis of mesopores and macropores. The two complement each other in the study of pore structure [43,44].
Low-temperature CO2 adsorption experiments, in combination with the DFT model, were able to quantitatively disclose the differential modification of the microporous (<2 nm) systems by microorganisms [45]. Figure 1 and Figure 2 illustrate the distribution curves of volume, specific surface area, and pore size of the coal rock, which are computed based on the DFT density functional theory. As the pore size of the four samples increases, the change trend of the stage pore volume manifests an ‘M’-shaped configuration, with two distinguishable peaks. The main peak ranges between 0.5 and 0.6 nm, and the secondary peak ranges between 0.8 and 0.9 nm. The main peak of FK coal rock is smaller than that of NMH coal rock. For pores of identical size, the pore volume and specific surface area of FK coal rock generally demonstrated a decreasing trend subsequent to biodegradation, while those of NMH coal rock did not change substantially and presented a slightly increasing trend.
Table 2 shows the total pore volume and total specific surface area of each sample calculated according to the DFT and D-A equations. The DFT method calculates the potential energy distribution of adsorbed molecules in pores of varying sizes, thereby providing a more accurate representation of coal pore heterogeneity. In contrast, the D-A equation relies on assumptions of uniform pore geometry and a single adsorption potential, making the results of the DFT adsorption equation more aligned with real-world scenarios [46,47]. The total pore volume calculated by the DFT equation ranges from 1.43 to 2.41 cm3/100 g, and the total pore-specific surface area ranges from 99.50 to 125.27 m2/g. The NMH sample, on the other hand, exhibits an increase in the micropore-specific surface area from 74.54 m2/g to 80.10 m2/g (an increase of 7.5%), and a rise in the micropore volume from 2.36 cm3/100 g to 2.41 cm3/100 g with little change, and new peaks were generated in the 0.4–0.6 nm interval, indicating the generation of secondary micropores. The microporous specific surface area of the FK sample decreased from 64.09 m2/g to 42.07 m2/g (a 34.3% decrease), and the microporous volume decreased from 2.09 cm3/100 g to 1.43 cm3/100 g, suggesting that microbial degradation reduced the number of micropores and had a significant impact on the micropores.

3.2. Pore Changes Based on the Low-Temperature N2 Adsorption Experiment

The low-temperature N2 adsorption experiment (LTNA) is a key method for characterizing the mesoporous–macroporous (1.7–300 nm) structure of coal rock. In this study, the pore volume (PV) was calculated by the BJH model, and the specific surface area (SSA) was calculated by the BET model. Combining with the average pore width (APW), the modification effect of microbial degradation on the pore structure of low-rank coals in Xinjiang was systematically analyzed.
According to the pore classification principle of IUPAC, the curve formed between the adsorption amount and the relative pressure is called the isotherm, and there are currently six types [48]. Analysis of the sample isotherms reveals that an obvious hysteresis loop is formed between the adsorption curve and the desorption curve of the raw NMH coal sample, which belongs to the typical Type I curve. The raw FK coal sample has a relatively small adsorption hysteresis loop and belongs to the Type II curve. When the relative pressure is 0–0.5, the adsorption line and the desorption line coincide. When the relative pressure is 0.5–1.0, the hysteresis loop is generated. The hysteresis loop is small and has no inflection point, belonging to open and breathable pores. The pore types are mostly cylindrical pores with both ends open and parallel-plate pores with four sides open.
The variation characteristics of the adsorption curves of the two groups of samples before biodegradation are similar. When the relative pressure (P/P0) is between 0 and 0.4, the adsorption curve changes slowly, with a slightly upward-convex shape, indicating the existence of a certain number of micropores, and the width of the hysteresis loop is very small. When the relative pressure is between 0.4 and 0.8, the adsorption curve gradually rises, and the adsorption amount continuously increases, generating an obvious hysteresis loop, reflecting the change in pore size from small to large. When the relative pressure is between 0.8 and 1, the adsorption curve rises sharply, with obvious concave-downward features, and the width of the hysteresis loop becomes larger, indicating the transition of pore size from micropores to mesopores and then to macropores (Figure 3). The hysteresis loops of the two groups of samples after biodegradation both shift to the high-pressure region, indicating an increase in the proportion of mesopores and macropores. The slope of the desorption curve of the FK coal sample after biodegradation increases, indicating that the desorption branch becomes steeper, which means that the pore-size distribution tends to be more concentrated, and the heterogeneity weakens. The pore-size and pore-volume distributions are concentrated, the heterogeneity is weak, and the pore connectivity is improved.
For the FK coal sample, after biodegradation, its BJH pore volume (PV) significantly increased from 0.14 cm3/100 g to 0.33 cm3/100 g, with an increase rate of 135.7%. The BET-specific surface area (SSA) also increased from 0.44 m2/g to 0.71 m2/g, with an increase rate of 61.4% (Table 3). As the pore size increased from 2 nm to 100 nm, the PV (dV/dlog(D)) and SSA (dA/dlog(D)) of the coal sample after biodegradation showed an obvious upward trend (Figure 4 and Figure 5). The main reduction in PV and SSA occurred in the diameter range of 0–2 nm, which was mainly attributed to the decrease in micropore volume and specific surface area. These results indicate that during the biodegradation process, the original pores were interconnected and expanded, leading to an increase in the proportion of mesopores and macropores and a decrease in the proportion of micropores, thus resulting in an increase in the total pore volume and surface area. However, for the NMH coal sample, after biodegradation, it showed a different change trend. Its PV increased from 0.48 cm3/100 g to 0.57 cm3/100 g, with an increase rate of 18.8%, but the SSA decreased from 1.10 m2/g to 0.92 m2/g, with a decrease rate of 16.4% (Table 3). This contradictory phenomenon is due to the fact that microorganisms preferentially degrade the pores with small diameters in the organic matter, causing some micropores to merge into larger pores (the APW increased from 9.94 nm to 14.43 nm), thus increasing the PV but reducing the SSA. Microorganisms target and degrade the organic components in the coal matrix by secreting specific extracellular enzymes, causing the methoxy groups and hydroxyl groups attached to the coal rings, as well as the volatile substances in the coal structure, to detach. Subsequently, the free methoxy groups are converted into methane. Taking cellulase as an example, it mainly acts on the cellulose derivatives and aliphatic side chains in coal, causing the organic matter on the inner walls of the pores to dissolve, thereby increasing the average width of the pores [49,50].

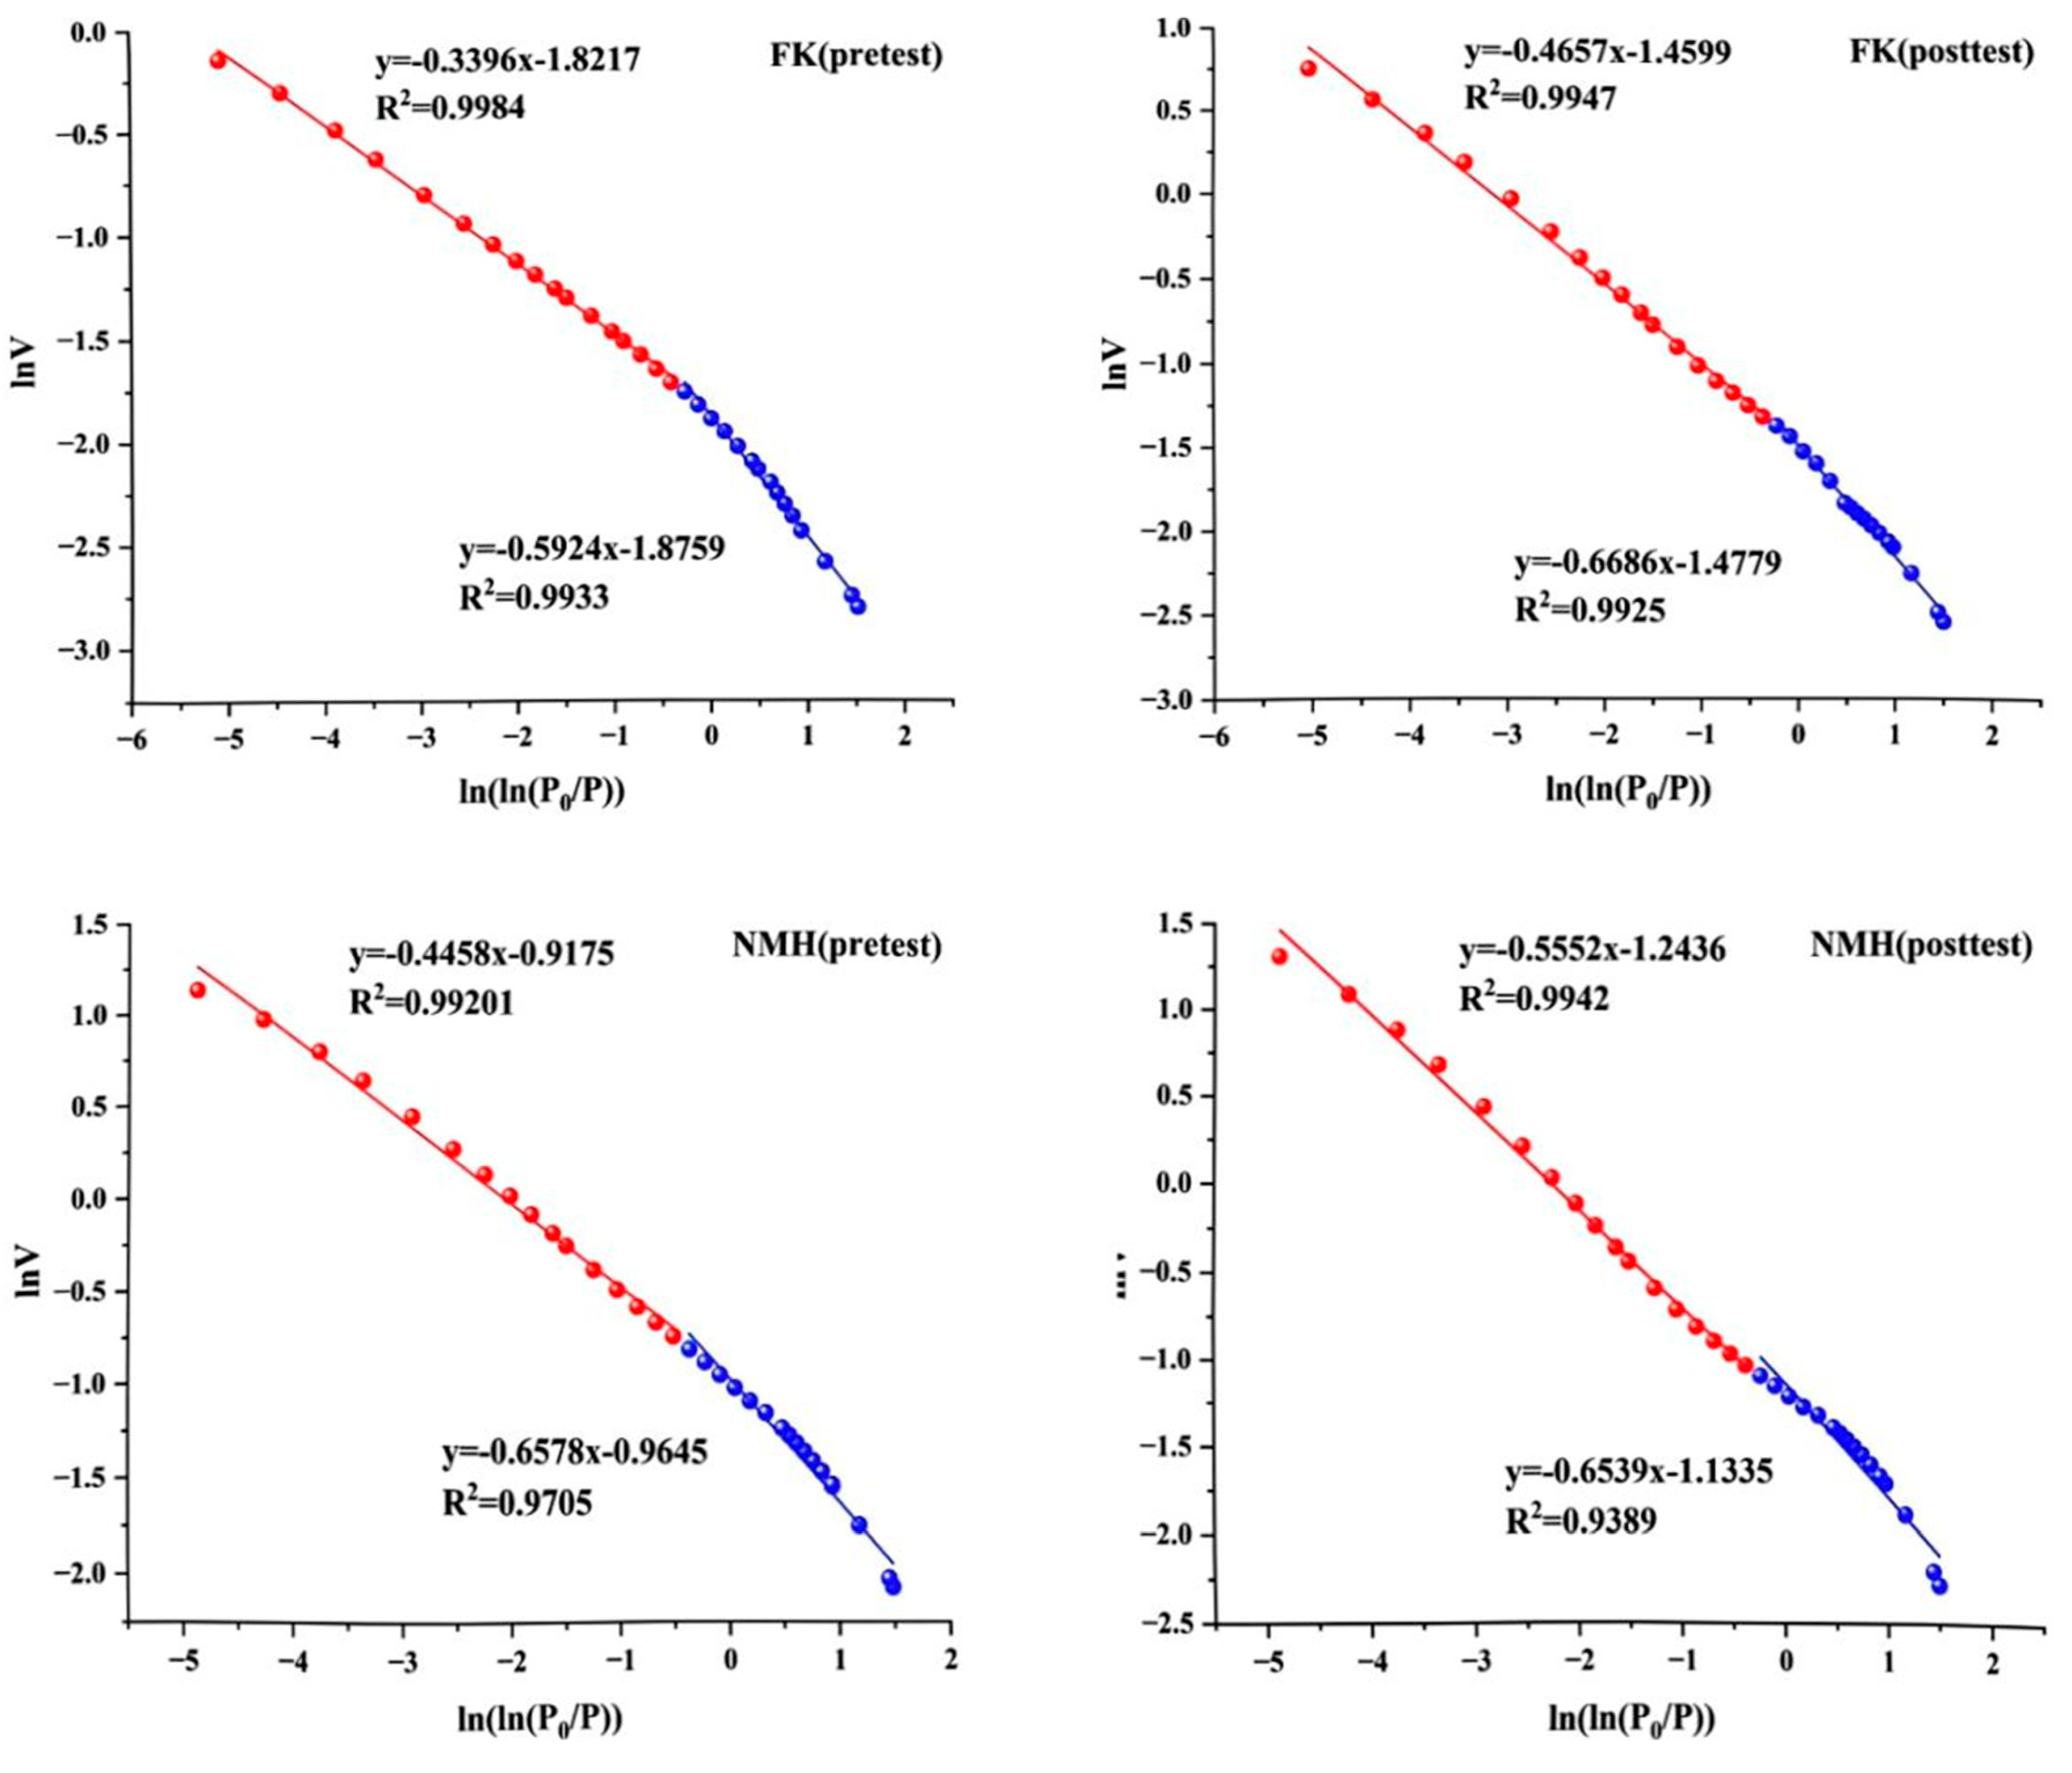
3.3. Pore Changes Based on Fractal Dimension

The fractal characteristics can reflect the pore characteristics of coal and characterize the complexity of the coal surface [51]. When the fractal dimension D is between 2 and 3, smaller D values indicate a simpler and more uniform pore structure with better connectivity, while larger D values imply a more complex and scattered pore morphology with stronger heterogeneity; fractal characteristics become insignificant outside this range. For the results of the N2 adsorption test, logarithmic analysis and piece-wise linear fitting were carried out to determine the adsorption volume and relative pressure. All samples exhibited well-fitted fractal characteristics, with R2 values higher than 0.93, indicating a high correlation and good fractal properties, which verified the reliability of the fractal model (Table 4).
In the analysis of fractal characteristics, different relative pressure regions can reflect the different pore characteristics of coal samples and characterize the complexity of the coal surface [52]. The low-relative-pressure region (P/P0 < 0.5) mainly reflects the surface roughness of micropores (D1). For the FK coal sample, D1 decreased from 2.4076 to 2.3314, indicating a reduction in the surface roughness of micropores (Figure 6). This may be related to the preferential degradation of aliphatic components, which leads to the smoothing of pores. However, for the NMH coal sample, D1 slightly increased from 2.3422 to 2.3461, and the change was not significant, indicating that the pore surface modification was mainly dominated by geometric expansion. In the high-relative-pressure region (P/P0 > 0.5), it mainly characterizes the heterogeneity of mesopore and macropore structures (D2). D2 of both groups of coal samples decreased. For the FK coal sample, it decreased from 2.6604 to 2.5343, and for the NMH coal sample, it decreased from 2.5542 to 2.4448. This indicates that the pore connectivity improved, reflecting the enhanced connectivity of mesopores and macropores, and the pore distribution tends to be more concentrated, which is consistent with the increasing trend of APW. Microbial degradation reduces the fractal dimension through two ways: pore coalescence and surface smoothing. Pore coalescence reduces the number of isolated pores, decreases the dispersion of the pore-size distribution, makes the pore surface smooth, and improves the pore connectivity.

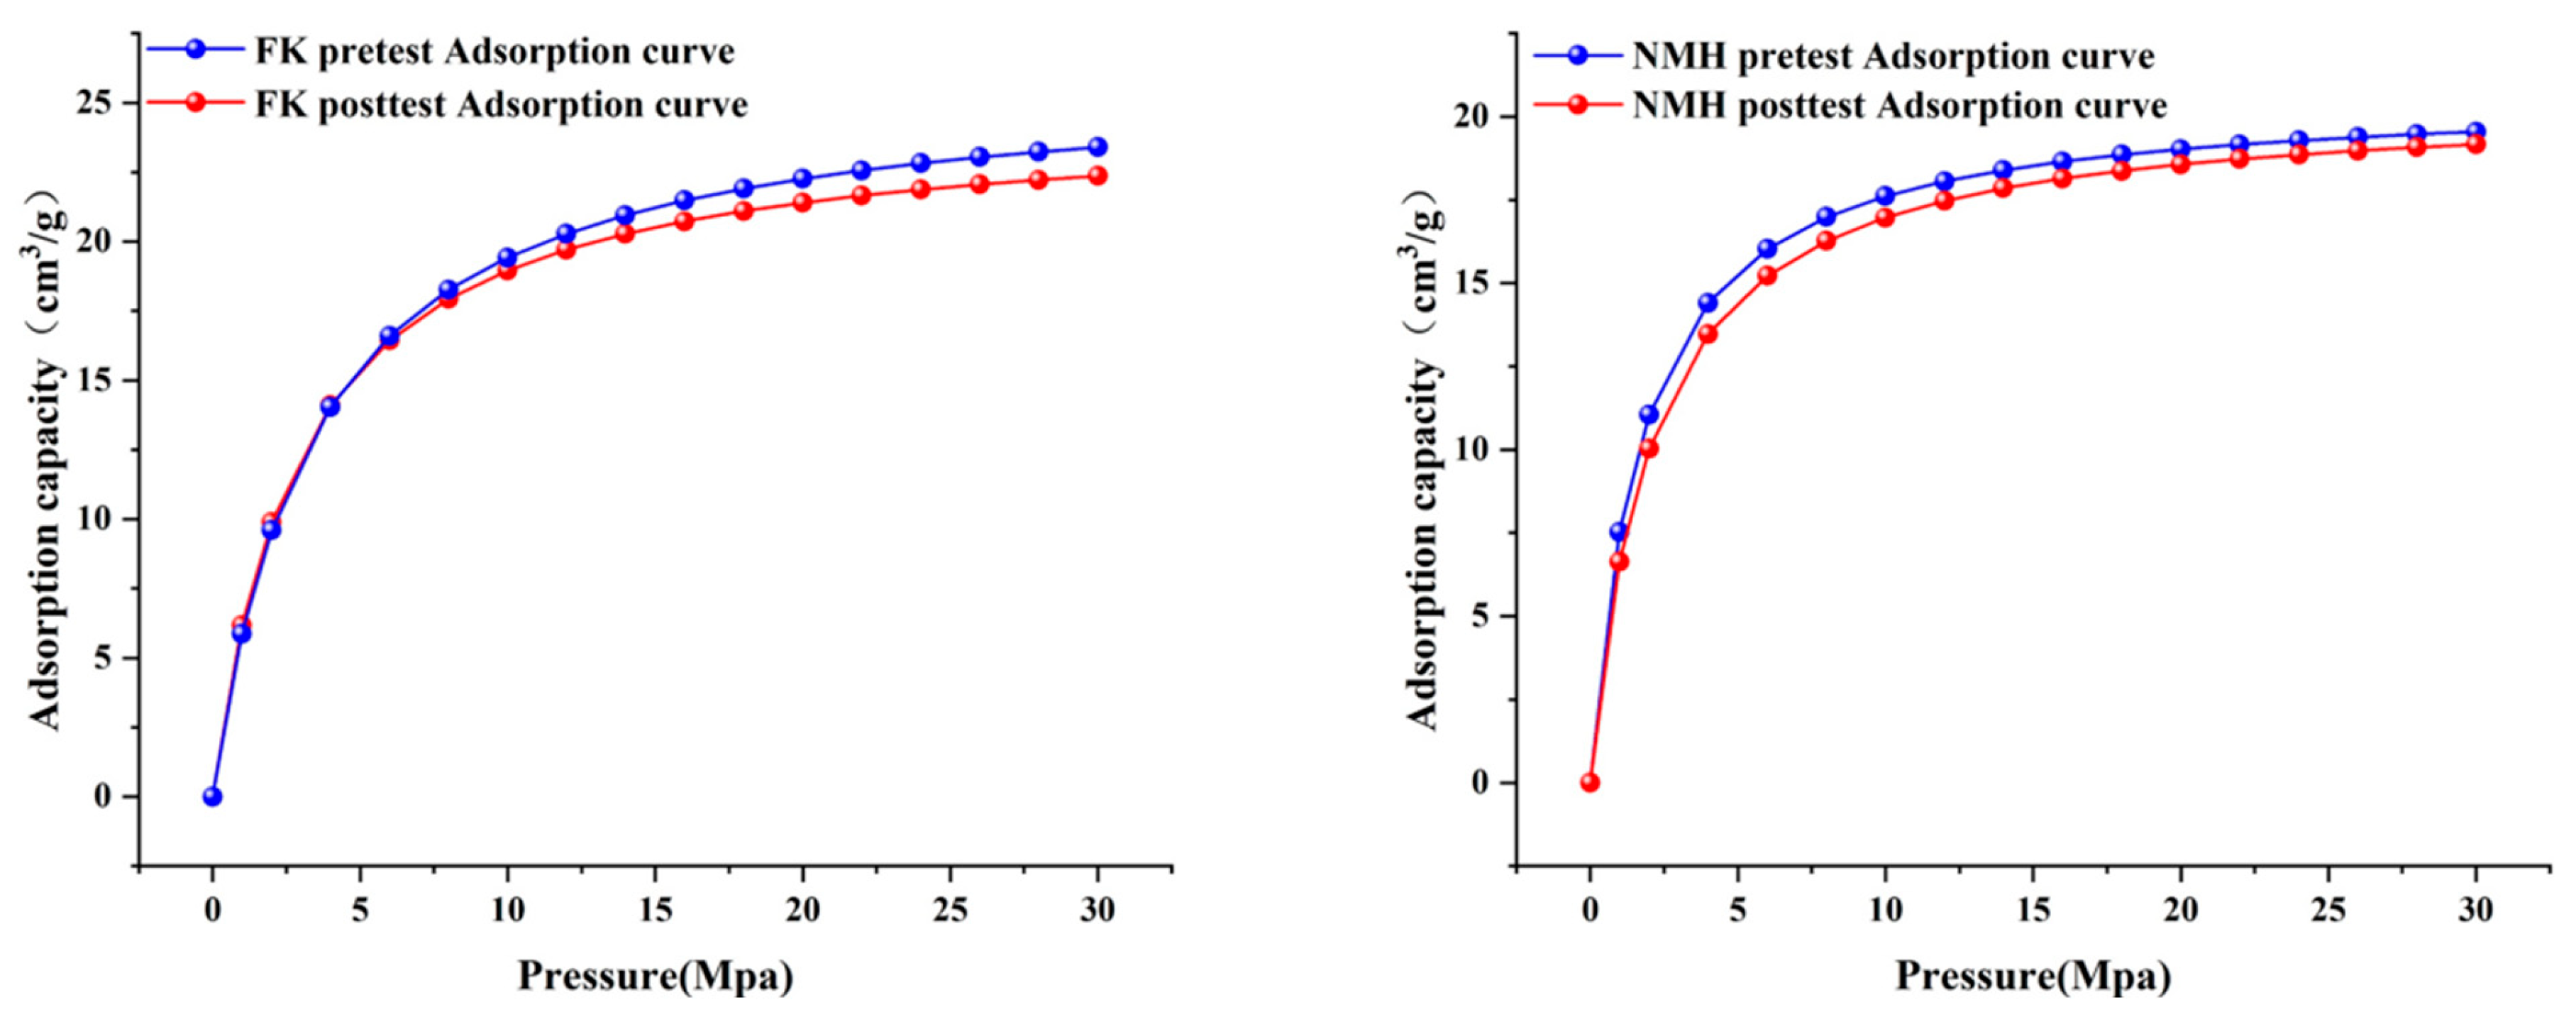
3.4. Changes in the Adsorption Characteristics of Coal Rock Based on the Isothermal Adsorption Experiment

The isothermal adsorption experiment reveals, from a macroscopic perspective, the influence of microbial degradation on the methane adsorption capacity of coal rocks [53]. Currently, the Langmuir isothermal adsorption model is predominantly applied to describe the adsorption characteristics of coal rock reservoirs [54]. The fitting results of the Langmuir equation indicate that the methane adsorption capacity of the FK coal sample is stronger than that of the NMH coal sample. After microbial degradation, the maximum adsorption capacities of both groups of low-rank coal samples have decreased, yet the extent of the decrease is relatively small (Figure 7). The adsorption capacity of FK dropped from 26.074 cm3/g to 24.755 cm3/g, registering a 5.06% decline. This is primarily ascribed to the loss of adsorption sites resulting from the decrease in the micropore-specific surface area (SSA), which in turn led to the attenuation of its methane adsorption capacity. The mesopore volume grew from 0.08 cm3/100 g to 0.20 cm3/100 g, and the macropore volume increased from 0.05 cm3/100 g to 0.13 cm3/100 g as well. Despite a remarkable increase in the total pore volume, the newly formed mesopores and macropores exhibited weak adsorption capabilities and made a relatively limited direct contribution to the adsorption quantity, failing to offset the impact of the reduction in micropores. Conversely, the change in the adsorption capacity of NMH was even more negligible, decreasing from 20.68 cm3/g to 20.50 cm3/g, with a meager 0.85% decrease. The change in the methane adsorption capacity was minimal. The micropore volume increased slightly by 2.1% (from 2.36 cm3/100 g to 2.41 cm3/100 g), and simultaneously, secondary micropores were generated, maintaining the number of adsorption sites to some extent. The mesopore volume increased from 0.32 cm3/100 g to 0.41 cm3/100 g, and the macropore volume rose from 0.06 cm3/100 g to 0.07 cm3/100 g (Table 5). This indicates that the pore structure modification of NMH mainly aims at expanding the seepage channels rather than significantly diminishing the adsorption potential [55]. Meanwhile, the change in Langmuir pressure reflects the adjustment of adsorption affinity, and the methane desorption efficiency of NMH is higher than that of FK. The PL value of the FK coal sample decreased from 3.423 MPa to 2.964 MPa, indicating an enhancement of the adsorption affinity. On the contrary, the PL value of the NMH coal sample increased from 1.736 MPa to 2.082 MPa, suggesting that the energy distribution of the adsorption sites tends to be uniform. In addition, the slight fluctuation of the adsorbed phase density (ρad) indicates that the packing pattern of methane molecules has not undergone a fundamental change, but the improvement of pore connectivity can accelerate the desorption rate. The above changes demonstrate that microbial degradation promotes the methane desorption of coal samples, which is related to the optimization of the pore structure. During the degradation process, the microscopic pore structure of coal is adjusted, making it easier for methane molecules to desorb and be released. Overall, microbial action reduces the methane adsorption capacity of coal. At the same time, it enhances desorption efficiency, which contributes to improving the occurrence and production of coalbed methane (CBM).

3.5. Characterizing the Changes in the Pore Structure of Coal Rock by Combining Multiple Experimental Methods

The pore structure of the reservoir plays a pivotal role in determining its physical properties [56]. Coalbed methane (methane) predominantly exists in the microscopic structure of the reservoir through physical adsorption. A comprehensive and systematic characterization of the pore structure of coal rock is one of the crucial aspects in studying the adsorption behavior of methane within coal reservoirs [57]. In this paper, by integrating low-temperature CO2 adsorption, low-temperature N2 adsorption, isothermal adsorption experiments, and fractal dimension analysis, the synergistic modification effect of microbial degradation on the pore structure of low-rank coal in Xinjiang has been systematically elucidated. Upon the action of microorganisms, the pore size of the coal rock underwent remarkable changes. Given that FK is more significantly influenced by the degree of coalification, the number of pores of all sizes in FK is notably lower than that in NMH. For the NMH coal sample, there was a slight increase of 2.1% in the volume of micropores, accompanied by the formation of a small number of secondary micropores. In the case of the FK coal sample, microorganisms preferentially degraded the aliphatic components within the micropores (<2 nm), leading to a reduction of 31.6% in the volume and 34.3% in the specific surface area of the micropores. Simultaneously, the volume of mesopores (2–50 nm) surged by 150%, which indicates that microbial degradation exerted a substantial impact on both micropores and mesopores (Table 6). This impact was manifested as a decrease in the number of micropores and a corresponding increase in the number of mesopores. This phenomenon can be attributed to the fact that during the process of microorganisms degrading the coal surface, some pores were induced to interconnect, causing the original micropores to expand and subsequently transform into mesopores. As a result, the pores merged to form highly efficient seepage channels. Although the volume of macropores (>50 nm) in the coal samples increased substantially (FK: 0.05 → 0.13 cm3/100 g; NMH: 0.12 → 0.16 cm3/100 g), the increment in their specific surface area was relatively limited (FK: 0.03 → 0.07 m2/g; NMH: 0.06 → 0.07 m2/g). This observation suggests that microorganisms smooth the geometric shape of the pores by removing the surface protrusions.
The fractal dimension analysis further validates the pore homogenization mechanism: the decrease in the fractal dimensions D1 and D2 in the low-relative-pressure region (P/P0 < 0.5) and the high-relative-pressure region (P/P0 > 0.5) indicates a reduction in isolated pores, a concentration of the pore size distribution, a smoother coal surface, and a lower complexity of the pore system. The isothermal adsorption experiment reveals that the microbial action reduces the maximum methane adsorption capacity (FK: −5.06%; NMH: −0.85%), suggesting that the adsorption capacity of coal for methane decreases after biodegradation. Microbial degradation enhances desorption efficiency by optimizing the pore connectivity and reduces the ability of the coal surface to adsorb methane. This provides multi-scale theoretical support for microbial-enhanced recovery technologies in low-rank coal reservoirs.

4. Conclusions

The results of low-temperature CO2 adsorption, low-temperature N2 adsorption, isothermal adsorption experiments, and fractal dimension analysis indicate that the degradation of coal reservoirs by indigenous microorganisms is an effective method to increase the methane production per well of coalbed methane and to modify the pore structure of coal reservoirs.
  • Microbial action can significantly optimize the pore structure of low-rank coal reservoirs. After degradation, the volume and specific surface area of mesopores and macropores increase significantly, the proportion of micropores decreases, the average pore size increases, and efficient gas migration channels are formed.
  • Microbial action reduces the fractal dimension of coal pores. The pore heterogeneity weakens and the surface roughness decreases, making the pore distribution tend to be concentrated, reducing the proportion of isolated pores and enhancing the connectivity of the micro–mesopore system. The simplification of the pore structure by microbial technology promotes the adsorption and migration of coalbed methane.
  • Microbial degradation reduces adsorption sites, decreases the maximum methane adsorption capacity, optimizes the Langmuir pressure to enhance desorption efficiency, strengthens the development potential of low-rank coal reservoirs, and contributes to their green and sustainable development.

Author Contributions

Methodology, Investigation, Data curation, Writing—Original Draft Preparation, Formal analysis, Q.B.; Conceptualization, Methodology, Validation, Funding acquisition, B.Z.; Supervision, Resources provision, X.M.; Supervision, Methodology, S.Z.; Data curation, Formal analysis, Resource support, J.F.; Methodology, Validation, Y.F.; Supervision, Writing—Review & Editing: X.T. All authors have read and agreed to the published version of the manuscript.

Funding

This research was funded by the Key R&D Program Project of Xinjiang Uygur Autonomous Region (grant No. 2024B03002), National Major S&T Project for New Oil & Gas E&D (grant No. 2024ZD14060) and the National Science Foundation of China (Grants No. 42372164). The authors would like to thank these funds for their financial support.

Institutional Review Board Statement

Not applicable.

Informed Consent Statement

Not applicable.

Data Availability Statement

The experimental data can be provided upon request to the corresponding author.

Conflicts of Interest

Authors Bin Zhang and Xingzhi Ma were employed by the company PetroChina Research Institute of Petroleum Exploration & Development. The remaining authors declare that the research was conducted in the absence of any commercial or financial relationships that could be construed as a potential conflict of interest.

References

  1. Park, S.Y.; Liang, Y. Biogenic methane production from coal: A review on recent research and development on microbially enhanced coalbed methane (MECBM). Fuel 2016, 166, 258–267. [Google Scholar]
  2. Busch, A.; Gensterblum, Y. CBM and CO2-ECBM related sorption processes in coal: A review. Int. J. Coal Geol. 2011, 87, 49–71. [Google Scholar]
  3. Li, G.; Zhang, S.; He, H.; He, X.; Zhao, Z.; Niu, X.; Xiong, X.; Zhao, Q.; Guo, X.; Hou, Y.; et al. Coal-rock gas: Concept, connotation and classification criteria. Pet. Explor. Dev. 2024, 51, 897–911. [Google Scholar]
  4. Li, G.; Jia, C.; Zhao, Q.; Zhou, T.; Gao, J. Coal-rock gas accumulation mechanism and the whole petroleum system of coal measures. Pet. Explor. Dev. 2025, 52, 29–43. [Google Scholar] [CrossRef]
  5. Palmer, I. Permeability changes in coal: Analytical modeling. Int. J. Coal Geol. 2009, 77, 119–126. [Google Scholar]
  6. Wang, H.; Cheng, Y.; Wang, W.; Xu, R. Research on comprehensive CBM extraction technology and its applications in China’s coal mines. J. Nat. Gas. Sci. Eng. 2014, 20, 200–207. [Google Scholar]
  7. Clarkson, C.R.; Bustin, R.M.; Seidle, J.P. Production-data analysis of single-phase (gas) coalbed-methane wells. SPE Reserv. Eval. Eng. 2007, 10, 312–331. [Google Scholar]
  8. Liu, X.; Sun, Y.; Guo, T.; Rabiei, M.; Qu, Z.; Hou, J. Numerical simulations of hydraulic fracturing in methane hydrate reservoirs based on the coupled thermo-hydrologic-mechanical-damage (THMD) model. Energy 2022, 238, 122054. [Google Scholar]
  9. Duplyakov, V.M.; Morozov, A.D.; Popkov, D.O.; Shel, E.V.; Vainshtein, A.L.; Burnaev, E.V.; Osiptsov, A.A.; Paderin, G.V. Data-driven model for hydraulic fracturing design optimization. Part II: Inverse problem. J. Petrol. Sci. Eng. 2022, 208, 109303. [Google Scholar]
  10. Liu, Y.; Tang, D.; Xu, H.; Zhao, T.; Hou, W. Effect of interlayer mechanical properties on initiation and propagation of hydraulic fracturing in laminated coal reservoirs. J. Petrol. Sci. Eng. 2022, 208, 109381. [Google Scholar]
  11. Ritter, D.; Vinson, D.; Barnhart, E.; Akob, D.M.; Fields, M.W.; Cunningham, A.B.; Orem, W.; McIntosh, J.C. Enhanced microbial coalbed methane generation: A review of research, commercial activity, and remaining challenges. Int. J. Coal Geol. 2015, 146, 28–41. [Google Scholar] [CrossRef]
  12. Wang, Y.; Bao, Y.; Hu, Y. Recent progress in improving the yield of microbially enhanced coalbed methane production. Energy Rep. 2023, 9, 2810–2819. [Google Scholar] [CrossRef]
  13. Fakoussa, R.Á.; Hofrichter, M. Biotechnology and microbiology of coal degradation. Appl. Microbiol. Biot. 1999, 52, 25–40. [Google Scholar] [CrossRef]
  14. Welte, C.U. A microbial route from coal to gas. Science 2016, 354, 184. [Google Scholar] [CrossRef]
  15. Zhang, R.; Liu, S.; Bahadur, J.; Elsworth, D.; Wang, Y.; Hu, G.; Liang, Y. Changes in pore structure of coal caused by coal-to-gas bioconversion. Sci. Rep. 2017, 7, 3840. [Google Scholar] [CrossRef]
  16. Kei, A.; Atsushi, K.; Gakuzo, T. Surfactin a crystalline peptidelipid surfactant produced by bacillus subtilis isolation, characterization and its inhibition of fibrin clot formation. Biochem. Biophys. Res. Commun. 1968, 31, 488–496. [Google Scholar]
  17. Mara, K.; Decorosi, F.; Viti, C.; Giovannetti, L.; Papaleo, M.C.; Maida, I.; Perrin, E.; Fondi, M.; Vaneechoutte, M.; Nemec, A. Molecular and phenotypic characterization of Acinetobacter strains able to degrade diesel fuel. Res. Microbiol. 2012, 163, 161–172. [Google Scholar] [CrossRef]
  18. Harms, C.; Schleicher, A.; Collins, M.D.; Andreesen, J.R. Tissierella creatinophila sp. nov., a Gram-positive, anaerobic, non-spore-forming, creatinine-fermenting organism. Int. J. Syst. Evol. Microbiol. 1998, 48, 983–993. [Google Scholar] [CrossRef]
  19. Bao, Y.; Li, Z.; Meng, J.; Chen, X.; Liu, X. Reformation of coal reservoirs by microorganisms and its significance in CBM exploitation. Fuel 2024, 360, 130642. [Google Scholar] [CrossRef]
  20. Xia, D.; Gu, P.; Chen, Z.; Chen, L.; Wei, G.; Wang, Z.; Cheng, S.; Zhang, Y. Control mechanism of microbial degradation on the physical properties of a coal reservoir. Processes 2023, 11, 1347. [Google Scholar] [CrossRef]
  21. Guo, G.; Luo, Y.; Ma, J.; Xia, D.; Ji, C.; Su, X. Analysis of mechanism and permeability enhancing effect via microbial treatment on different-rank coals. J. China Coal Soc. 2014, 39, 1886–1891. [Google Scholar]
  22. Faiz, M.; Stalker, L.; Sherwood, N.; Saghafi, A.; Wold, M.; Barclay, S.; Choudhury, J.; Barker, W.; Wang, I. Bio-enhancement of coal bed methane resources in the southern Sydney Basin. Appea J. 2003, 43, 595–610. [Google Scholar]
  23. Faiz, M.; Hendry, P. Significance of microbial activity in Australian coal bed methane reservoirs—A review. B Can. Petrol. Geol. 2006, 54, 261–272. [Google Scholar] [CrossRef]
  24. Xin, F.; Xu, H.; Tang, D.; Yang, J.; Chen, Y.; Cao, L.; Qu, H. Pore structure evolution of low-rank coal in China. Int. J. Coal Geol. 2019, 205, 126–139. [Google Scholar]
  25. Tao, S.; Chen, S.; Tang, D.; Zhao, X.; Xu, H.; Li, S. Material composition, pore structure and adsorption capacity of low-rank coals around the first coalification jump: A case of eastern Junggar Basin, China. Fuel 2018, 211, 804–815. [Google Scholar] [CrossRef]
  26. Fu, H.; Yan, D.; Su, X.; Wang, J.; Li, Q.; Li, X.; Zhao, W.; Zhang, L.; Wang, X.; Li, Y. Biodegradation of early thermogenic gas and generation of secondary microbial gas in the Tieliekedong region of the northern Tarim Basin, NW China. Int. J. Coal Geol. 2022, 261, 104075. [Google Scholar]
  27. Li, G.; Zhang, B.; Wu, K.; Wu, S.; Wang, X.; Zhang, J.; Qi, X.; Zhang, N.; Xing, H.; Xian, C.; et al. Low organic matter abundance and highly efficient hydrocarbon generation of saline source rock in the Qaidam Basin, NW China. Pet. Explor. Dev. 2023, 50, 1030–1044. [Google Scholar]
  28. Sun, S.; Zhang, B.; Wang, X.; Xiao, W.; Tian, H.; Hou, G.; Zhang, S. High-resolution geochemistry in the Lucaogou Formation, Junggar Basin: Climate fluctuation and organic matter enrichment. Mar. Petrol. Geol. 2024, 162, 106734. [Google Scholar]
  29. Li, Y.; Chen, J.; Tang, S.; Xi, Z. Microbial Communities Affected by Hydraulic Fracturing and Environmental Factors within an In Situ Coal Reservoir. Microorganisms 2023, 11, 1657. [Google Scholar] [CrossRef]
  30. Su, X.; Zhao, W.; Xia, D. The diversity of hydrogen-producing bacteria and methanogens within an in situ coal seam. Biotechnol. Biofuels 2018, 11, 245. [Google Scholar]
  31. Li, D.; Hendry, P.; Faiz, M. A survey of the microbial populations in some Australian coalbed methane reservoirs. Int. J. Coal Geol. 2008, 76, 14–24. [Google Scholar] [CrossRef]
  32. Wang, Z.; Pan, J.; Hou, Q.; Yu, B.; Li, M.; Niu, Q. Anisotropic characteristics of low-rank coal fractures in the Fukang mining area, China. Fuel 2018, 211, 182–193. [Google Scholar] [CrossRef]
  33. Gil, A.; Grange, P. Application of the Dubinin-Radushkevich and Dubinin-Astakhov equations in the characterization of microporous solids. Colloids Surf. A Physicochem. Eng. Asp. 1996, 113, 39–50. [Google Scholar] [CrossRef]
  34. Burke, K. Perspective on density functional theory. J. Chem. Phys. 2012, 136, 150901. [Google Scholar] [CrossRef]
  35. Villarroel-Rocha, J.; Barrera, D.; Sapag, K. Introducing a self-consistent test and the corresponding modification in the Barrett, Joyner and Halenda method for pore-size determination. Microporous Mesoporous Mater. 2014, 200, 68–78. [Google Scholar] [CrossRef]
  36. Brunauer, S.; Emmett, P.H.; Teller, E. Adsorption of gases in multimolecular layers. J. Am. Chem. Soc. 1938, 60, 309–319. [Google Scholar] [CrossRef]
  37. Yi, M.; Cheng, Y.; Wang, Z.; Wang, C.; Hu, B.; He, X. Effect of particle size and adsorption equilibrium time on pore structure characterization in low pressure N2 adsorption of coal: An experimental study. Adv. Powder Technol. 2020, 31, 4275–4281. [Google Scholar] [CrossRef]
  38. Barrett, E.P.; Joyner, L.G.; Halenda, P.P. The determination of pore volume and area distributions in porous substances. I. Computations from nitrogen isotherms. J. Am. Chem. Soc. 1951, 73, 373–380. [Google Scholar] [CrossRef]
  39. Wang, C.; Ferko, B.T.; Shen, K.; Winey, K.I.; Vohs, J.M.; Gorte, R.J. Determination of film thicknesses of metal oxides prepared by atomic layer deposition on SBA-15. Microporous Mesoporous Mater. 2024, 366, 112945. [Google Scholar] [CrossRef]
  40. Tang, X.; Zhang, J.; Wang, X.; Yu, B.; Ding, W.; Xiong, J.; Yang, Y.; Wang, L.; Yang, C. Shale characteristics in the southeastern Ordos Basin, China: Implications for hydrocarbon accumulation conditions and the potential of continental shales. Int. J. Coal Geol. 2014, 128, 32–46. [Google Scholar] [CrossRef]
  41. Zhang, S.; Tang, S.; Tang, D.; Huang, W.; Pan, Z. Determining fractal dimensions of coal pores by FHH model: Problems and effects. J. Nat. Gas. Sci. Eng. 2014, 21, 929–939. [Google Scholar]
  42. Zhang, C.; Jia, S.; Ren, Z.; Bai, Q.; Wang, L.; Han, P. Strength evolution characteristics of coal with different pore structures and mineral inclusions based on CT scanning reconstruction. Nat. Resour. Res. 2024, 33, 2725–2742. [Google Scholar]
  43. Zhang, X.; Cheng, J.; Zhang, L.; Zhou, T.; Kang, T.; Li, L. Pore Fractal Characteristics of Suancigou Long-Flame Coal after Electrochemical Treatment: An Experimental Study through the Implementation of N2 Adsorption and Mercury Intrusion Prosimetry Techniques. ACS Omega 2021, 6, 27358–27367. [Google Scholar] [CrossRef] [PubMed]
  44. Hong, L.; Wang, W.; Gao, D.; Liu, W. Critical pore size for micropore filling in coal samples with different rank coals. PLoS ONE 2022, 17, e264225. [Google Scholar]
  45. Orio, M.; Pantazis, D.A.; Neese, F. Density functional theory. Photosynth. Res. 2009, 102, 443–453. [Google Scholar]
  46. Lastoskie, C.; Gubbins, K.E.; Quirke, N. Pore size distribution analysis of microporous carbons: A density functional theory approach. J. Phys. Chem. 1993, 97, 4786–4796. [Google Scholar]
  47. Ravikovitch, P.I.; Neimark, A.V. Density functional theory of adsorption in spherical cavities and pore size characterization of templated nanoporous silicas with cubic and three-dimensional hexagonal structures. Langmuir 2002, 18, 1550–1560. [Google Scholar]
  48. Rahman, M.M.; Muttakin, M.; Pal, A.; Shafiullah, A.Z.; Saha, B.B. A statistical approach to determine optimal models for IUPAC-classified adsorption isotherms. Energies 2019, 12, 4565. [Google Scholar] [CrossRef]
  49. He, J.; Huang, C.; Lai, C.; Huang, C.; Li, M.; Pu, Y.; Ragauskas, A.J.; Yong, Q. The effect of lignin degradation products on the generation of pseudo-lignin during dilute acid pretreatment. Ind. Crop Prod. 2020, 146, 112205. [Google Scholar] [CrossRef]
  50. Sáez-Jiménez, V.; Baratto, M.C.; Pogni, R.; Rencoret, J.; Gutiérrez, A.; Santos, J.I.; Martínez, A.T.; Ruiz-Dueñas, F.J. Demonstration of lignin-to-peroxidase direct electron transfer: A transient-state kinetics, directed mutagenesis, EPR, and NMR study. J. Biol. Chem. 2015, 290, 23201–23213. [Google Scholar]
  51. Avnir, D.; Jaroniec, M. An isotherm equation for adsorption on fractal surfaces of heterogeneous porous materials. Langmuir 1989, 5, 1431–1433. [Google Scholar]
  52. Hou, S.; Wang, X.; Wang, X.; Yuan, Y.; Pan, S.; Wang, X. Pore structure characterization of low volatile bituminous coals with different particle size and tectonic deformation using low pressure gas adsorption. Int. J. Coal Geol. 2017, 183, 1–13. [Google Scholar]
  53. Altowilib, A.; AlSaihati, A.; Alhamood, H.; Alafnan, S.; Alarifi, S. Reserves estimation for coalbed methane reservoirs: A review. Sustainability 2020, 12, 10621. [Google Scholar] [CrossRef]
  54. Alafnan, S.; Awotunde, A.; Glatz, G.; Adjei, S.; Alrumaih, I.; Gowida, A. Langmuir adsorption isotherm in unconventional resources: Applicability and limitations. J. Petrol. Sci. Eng. 2021, 207, 109172. [Google Scholar]
  55. Zhang, Z.; Qin, Y.; Wang, G.X.; Fu, X. Numerical description of coalbed methane desorption stages based on isothermal adsorption experiment. Sci. China Earth Sci. 2013, 56, 1029–1036. [Google Scholar]
  56. Moore, T.A. Coalbed methane: A review. Int. J. Coal Geol. 2012, 101, 36–81. [Google Scholar]
  57. Xu, S.; Hu, E.; Li, X.; Xu, Y. Quantitative analysis of pore structure and its impact on methane adsorption capacity of coal. Nat. Resour. Res. 2021, 30, 605–620. [Google Scholar]
Figure 1. The Relationship Curves between the Volume of Coal Rock and Pore Size Derived from the Low-Temperature CO2 Adsorption Experiment (the prefixes “pretest” and “posttest” denote “pre-biodegradation” and “post-biodegradation”, respectively).
Sustainability 17 03337 g001
Figure 2. The Relationship Curves between the Specific Surface Area of Coal Rock and Pore Size Derived from the Low-Temperature CO2 Adsorption Experiment (the prefixes “pretest” and “posttest” denote “pre-biodegradation” and “post-biodegradation”, respectively).
Sustainability 17 03337 g002
Figure 3. Adsorption and Desorption Curves of Coal Based on LTNA Experimental Data (the prefixes “pretest” and “posttest” denote “pre-biodegradation” and “post-biodegradation”, respectively).
Sustainability 17 03337 g003
Figure 4. The Relationship Curves between the Specific Surface Area of Coal and Pore Size Based on LTNA Experimental Data (the prefixes “pretest” and “posttest” denote “pre-biodegradation” and “post-biodegradation”, respectively).
Sustainability 17 03337 g004
Figure 5. The Relationship Curves between the Volume of Coal and Pore Size Based on LTNA Experimental Data (the prefixes “pretest” and “posttest” denote “pre-biodegradation” and “post-biodegradation”, respectively).
Sustainability 17 03337 g005
Figure 6. The Relationship between InV and In (In(P0/P)) based on LTNA Experimental Data (the prefixes “pretest” and “posttest” denote “pre-biodegradation” and “post-biodegradation”, respectively).
Sustainability 17 03337 g006
Figure 7. Characteristics of the Isothermal Curves of Coal Rock before and after Degradation Based on the Isothermal Adsorption Experiment (the prefixes “pretest” and “posttest” denote “pre-biodegradation” and “post-biodegradation”, respectively).
Sustainability 17 03337 g007
Table 1. Total Composition Analysis of Coal and Maximum Vitrinite Reflectance.
SchemeMad (%)Aad (%)Vad (%)Vitrinite (%) Inertinite (%)Exinite (%)R° max (%)
FK1.252.7715.07831250.8
NMH9.1410.4950.5385.314.30.80.35
Table 2. Statistical Table of Pore Volume and Specific Surface Area of Coal Rock Derived from the Low-Temperature CO2 Adsorption Experiment.
Sample IDDFT
PV
(cm3/100 g)
D-A
PV
(cm3/100 g)
DFT
SSA
(m²/g)
DFT
SSA
(m²/g) (0.37~1.1 nm)
D-A
SSA
(m²/g)
FK (pretest)2.09 3.77111.9264.0999.29
FK (posttest)1.433.5699.5042.0791.16
NMH (pretest)2.36 3.67115.2774.5498.17
NMH (posttest)2.413.99125.2780.10106.66
Note: The prefix “pretest” denotes “pre-biodegradation” while the prefix “posttest” signifies “post-biodegradation”.
Table 3. BJH PV, BET SSA, and APW Data of Coal Rock Based on LTNA Experiment.
Sample IDBJH PV (cm³/100 g)BET SSA (m²/g)APW (nm)
FK (pretest)0.140.449.77
FK (posttest)0.330.7114.69
NMH (pretest)0.481.109.94
NMH (posttest)0.570.9214.43
Note: The prefix “pretest” denotes “pre-biodegradation” while the prefix “posttest” signifies “post-biodegradation”.
Table 4. Fractal Dimensions of Adsorption Pores Calculated Based on the Low-Temperature N2 Adsorption Experiment.
Sample IDP/P0 < 0.5P/P0 > 0.5
A1D1R2A2D2R2
FK (pretest)−0.59242.40760.9933−0.33962.66040.9984
FK (posttest)−0.66862.33140.9925−0.46572.53430.9947
NMH (pretest)−0.65782.34220.9705−0.44582.55420.9920
NMH (posttest)−0.65392.34610.9389−0.55522.44480.9942
Note: The prefix “pretest” denotes “pre-biodegradation” while the prefix “posttest” signifies “post-biodegradation”.
Table 5. Adsorption Parameters of Coal Samples before and after Microbial Degradation.
Sample IDLangmuir Maximum Adsorption Capacity
VL (cm3/g)
Rate of ChangeLangmuir Pressure
PL (MPa)
Adsorbed Phase Density
ρad (g/cm3)
FK (pretest)26.074−5.06%3.4230.41
FK (posttest)24.7552.9640.411
NMH (pretest)20.675−0.85%1.7360.383
NMH (posttest)20.52.0820.37
Note: The prefix “pretest” denotes “pre-biodegradation” while the prefix “posttest” signifies “post-biodegradation”.
Table 6. Statistical Table of the Volumes and Specific Surface Areas of Micropores, Mesopores, and Macropores in Coal Rock.
Sample IDMicropore
PV
(cm³/100 g)
Micropore
SSA
(m²/g)
Mesopore
PV
(cm³/100 g)
Mesopore
SSA
(m²/g)
Macropore
PV
(cm³/100 g)
Macropore
SSA
(m²/g)
FK (pretest)2.09 64.090.080.470.050.03
FK (posttest)1.4342.070.200.840.130.07
NMH (pretest)2.36 74.540.321.880.120.06
NMH (posttest)2.4180.100.411.520.160.07
Note: The prefix “pretest” denotes “pre-biodegradation” while the prefix “posttest” signifies “post-biodegradation”.
Disclaimer/Publisher’s Note: The statements, opinions and data contained in all publications are solely those of the individual author(s) and contributor(s) and not of MDPI and/or the editor(s). MDPI and/or the editor(s) disclaim responsibility for any injury to people or property resulting from any ideas, methods, instructions or products referred to in the content.

