Abstract
Reducing global greenhouse gas emissions and implementing sustainable environmental policies require the identification of the economic, political, ecological, and social factors that affect emission levels. To this end, this study examines, for the first time, the impact of wealth inequality, economic growth, and renewable energy consumption on CO2 emissions in 17 countries with the highest wealth inequality over the 1995–2021 period. This study employs a novel and robust approach, the method of moments quantile regression, to analyze the relationships among these variables. Findings support the environmental Kuznets curve hypothesis by displaying that economic growth initially increases CO2 emissions but has a dampening effect after a turning point. Moreover, renewable energy consumption reduces CO2 emissions, where certain as increasing wealth inequality contributes to higher CO2 emissions. These results underscore the need for policymakers to adopt more egalitarian socioeconomic models, accelerate the transition to clean energy, and maintain robust environmental policies to achieve sustainable development goals.
1. Introduction
Countries vary in greenhouse gas emissions and their vulnerability to the consequences of the global climate crisis [1,2]. Moreover, to meet the needs of a growing population and address environmental concerns in the current global economic system, there needs to be a balance between increased production and higher energy consumption. Rising carbon emissions from the energy sector have primarily caused an increase in the global average temperature [3]. Furthermore, increases in energy production, conversion, and consumption, along with the damage to and collapse of ecosystems at each stage, have hindered progress toward achieving the sustainable development goals (SDGs). More importantly, the gap between those responsible for global emissions and others widens daily [1]. Thus, researchers are analyzing this gap using an increasing number of diverse variables and approaches.
Dividing tasks and responsibilities in addressing global climate change remains challenging. The “polluter pays principle”—a market-based system that has been relevant for the past 50 years and is crucial for environmental sustainability—is closely linked to this issue [4]. This principle assumes that people, institutions, and organizations produce emissions at both macro- and microscale levels to varying degrees. Moreover, based on factors such as language, religion, race, and income, various parties generate varying levels of ecological damage, which is referred to as “environmental inequality”. Disproportionate greenhouse gas emissions can also be explained by “climate inequality.” To be more specific, research has shown that high-net-worth individuals in high-income nations such as the United States (US) have a carbon footprint considerably larger than that of average resident [5]. Variations in household energy use can explain differences in carbon emissions at a micro level, underscoring the importance of reducing income and wealth inequality to address climate change [6].
The United Nations (UN) developed the SDGs to promote sustainable development by addressing poverty and hunger. The Intergovernmental Panel on Climate Change [2,7] also highlights climate change mitigation and adaptation activities that also aim to end poverty, provide access to clean energy, and achieve sustainable development goals for future generations. However, a major obstacle to achieving these goals is the high CO2 emissions produced by a small number of developed countries with significant shares of global income. Therefore, this issue needs to be addressed in the context of climate inequality, and the socioeconomic characteristics of the countries that cause more emissions need to be further interrogated in research.
This study investigates how wealth inequality affects CO2 emissions in the most unequal nations, shedding light on the intricate connection between wealth injustice and climate change. Given the need to develop fair and practical responses to climate change, it is essential to understand how wealth inequality affects CO2 emissions in countries with the greatest wealth inequality. Furthermore, a thorough study of the connection between wealth inequality and climate change—which has largely been overlooked—improves the likelihood that emission reduction plans will succeed and informs the creation of more sustainable international policies. Numerous scientific reports, including those by the UN Environment Programme [8] and the IPCC [2,7], provide strong evidence that carbon emissions are rising globally. This evidence clearly shows that, under current practices, global actors will struggle to fulfill their commitments under the Paris Agreement, a major international effort to address the global climate change crisis. Therefore, identifying key factors such as wealth inequality and other economic, political, and environmental aspects that affect emissions is crucial to implementing adaptation strategies and reducing global emissions. By comprehending these impacts and incorporating them into policymaking, it becomes possible to formulate effective strategies to address climate change and promote sustainable development.
The primary rationale for selecting 17 countries with the highest wealth inequality in the world is that they contribute a significant percentage of global greenhouse gas emissions and exhibit wealth inequality levels above the global average. So including the first 17 countries above the world average (0.404) provided more reliable and generalizable results, as significant differences began to emerge between groups with high wealth inequality. Thus, this approach also allowed us to examine how carbon emissions varied in relation to income inequality. The countries with the highest greenhouse gas emissions worldwide are China, the US, India, the 27-nation European Union (EU), Russia, and Brazil. These nations collectively account for 49.8% of the world’s population and 63.2% of its gross domestic product (GDP) [9,10]. China and the US alone are responsible for 41% of global greenhouse gas emissions [11]. However, the US, China, Russia, and Brazil rank among the most unequal countries in terms of income and wealth. Therefore, the sample was selected from among the countries with the highest levels of wealth inequality.
This study contributes to the literature in four distinct ways. First, it applies the Environmental Kuznets Curve (EKC) hypothesis to explore how wealth inequality affects CO2 emissions in the 17 countries with the highest wealth inequality from 1995 to 2021. Second, although numerous studies have examined how income inequality affects CO2 emissions, e.g., [12,13,14,15,16], insufficient attention has been paid to the impact of wealth inequality—a cumulative concept with more extensive and long-lasting effects—on CO2 emissions. Third, the study employs the Method of Moments Quantile Regression (MMQR), one of the most robust and contemporary testing approaches. Its strong resistance to issues such as asymmetry, heterogeneity, outliers, and non-normal distributions distinguishes it from typical analytical approaches. Fourth, most of the literature examines the relationships among economic growth, inequality, and CO2 emissions in developed economies (e.g., the US), developing economies (e.g., China, Vietnam, Indonesia, South Korea, South Africa, and Türkiye), or regional integrations (e.g., the EU and the African Union). However, this study differs by examining the relationship between wealth inequality and climate change in countries with extreme economic polarization and by focusing on nations with the highest wealth inequality. Thus, this research makes a unique contribution because the previous literature has not employed a comparable group of countries such as this.
The subsequent sections are organized as follows: Section 2 introduces the theoretical and conceptual framework, Section 3 conducts a literature review, Section 4 describes the methodology, Section 5 presents the empirical findings and discussions, and Section 6 offers the conclusion and policy implications.
2. Theoretical and Conceptual Framework
Global climate change is mainly a human-caused crisis. Inappropriate land use, unsustainable energy usage, regional and lifestyle variations in production and consumption patterns, and rising levels of greenhouse gases in the atmosphere have all increased dramatically as a result of human activities [2,7]. Climate change has increasingly affected social life, particularly in developing countries, resulting in slower development rates, increased vulnerability, declining food quality, and ongoing challenges related to migration and health [17]. These show that international cooperation and coordination are necessary to address climate change and reduce carbon emissions [18]. Thus, in December 2015, 196 party nations signed the Paris Agreement. The agreement sets binding principles to limit the rise in global average temperatures to 1.5 °C above preindustrial levels and to keep the increase well below 2 °C [19]. In addition, alongside adverse impacts such as melting glaciers and rising sea levels, research by the World Meteorological Organization [20] alluded to the fact that 2023 will be the hottest year on record.
Climate change risks and vulnerabilities are unevenly distributed worldwide [21]. The literature typically employs the term “direct inequality discourse” to refer to economic inequality or income distribution. However, recent studies on environmental justice have incorporated wealth inequality alongside income inequality. The Credit Suisse Research Institute [22] defines wealth inequality as the sum of the assets remaining after subtracting debts from financial and real estate assets. Although production, investment, natural resources, education, and family are among the main sources of wealth, the two main causes of wealth in terms of economic impact are income and inheritance. Therefore, income inequality is recognized as one of the most important causes of wealth inequality. Nevertheless, stating that income inequality causes wealth inequality does not mean unquestionable acceptance. Based on their welfare levels, different social groups affect the environment to varying degrees and exert different influences on climate change, regardless of geographic location [23]. The acknowledgment, involvement, and capacities of different people and societal groups, as well as the spatial distribution of environmental “goods” and “bads”, constitute some of the aspects of environmental injustice [24]. This political and economic discourse incorporates a theoretical dimension concerning climatic injustice or inequality, in addition to referring to an ecological concept and social movement [25]. In addition to procedural, distributional, and intergenerational injustice practices, climate (in)justice encompasses factors such as the parties’ lack of acknowledgment and engagement in climate governance processes [26]. In this regard, Hubacek et al. [27], Chancel [28], Sager [29], and Apeti et al. [23] similarly highlighted that CO2 emissions are higher in high-welfare societies than in low-welfare ones. Therefore, a wealth-based inequality mechanism is just as important in determining CO2 emissions as geographic or industry inequalities.
The EKC hypothesis is used in the literature to model the nonlinear association between economic activity and environmental degradation. It is a variation of the model concerning the relationship between income inequality and per capita income [30] that Kuznets [31] proposed and Grossman and Krueger [32,33] developed to describe the relationship between per capita income and environmental degradation. The EKC hypothesis posits that the inverted Uhaped pattern indicates a connection between environmental deterioration and economic growth or per capita income. In the early stages of economic development, the use of unclean and primitive technologies in production leads to environmental degradation along with the use of resources during the production process. In the later stages, the use of renewable energy sources based on technological progress, rising awareness about environmental issues, and economic growth undo the damage [34]. Accordingly, this study analyzes the impact of wealth inequality on CO2 emissions while also investigating the relationship between economic growth and CO2 emissions. In this regard, the further increase in wealth inequality on a global scale provides important clues about how to deal with the global climate change crisis.
3. Literature Review
The literature review section presents the research topic in three categories. The first category evaluates studies examining the link between economic growth and CO2 emissions. The second category evaluates studies examining the relationship between renewable energy consumption and CO2 emissions. The third category evaluates studies on the role of wealth inequality in CO2 emissions.
3.1. The Nexus of Economic Growth and CO2 Emissions
Studies examining the relationship between economic growth and CO2 emissions focus on key concepts such as renewable energy, ecological footprint, political uncertainties, and coordination, as Figure 1 illustrates. Among country sample groups, China and the US, which contribute a large share of global emissions, as well as developing countries, feature prominently. Zhang and Cheng [35] empirically demonstrated that carbon emissions and energy consumption did not drive economic growth in China during the period of 1960–2007. Their results clearly showed that the Chinese government’s shift toward reducing carbon emissions and increasing renewable energy sources would not hamper economic growth. However, Wang et al. [36] argued that reducing carbon emissions will slow down China’s economic growth in the long run. These contradictory findings emphasize the need to integrate different variables into analytical models in this field.
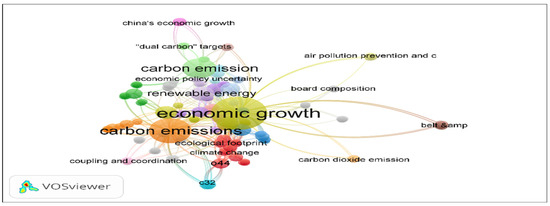
Figure 1.
Keyword map of WOS academic studies focusing on the relationship between economic growth and carbon emissions (this figure was created by the author based on a search for “economic growth” in the title and “carbon emission” in the keywords within the Web of Science database on 29 December 2024).
Researchers have also questioned the indirect relationship between economic growth and energy consumption levels. In this regard, Soytas et al. [37] analyzed the relationship among economic growth, energy consumption, and carbon emissions annual data in the US for the period 1960–2004. Their findings showed that economic growth does not affect total emissions but does have a positive impact on energy consumption. Moreover, carbon-neutral and green energy policies in middle- and low-income countries may hinder economic growth. Ozturk and Acaravcı [38] also discussed these expectations in their study of Türkiye (1968–2005), arguing that a shift toward climate protection and renewable energy policies may slow economic growth. Khan et al. [39], who investigated the impact of economic growth on carbon emissions in developing countries, found that in Pakistan (1965–2015), economic growth and energy consumption increased national carbon emissions in both the short and long run.
Among recent studies examining the relationship between economic growth and carbon emissions, Hou et al. [40], in their empirical analysis of 43 large economies (1995–2019), concluded that a decrease in income inequality reduces economic growth’s negative impact on carbon emissions. Furthermore, Alakbarov et al. [41] examined the relationship between economic growth and environmental degradation in a sample of G20 countries using the EKC hypothesis. They found an inverted U-shaped relationship between economic growth and environmental degradation when energy consumption was excluded from the model. They also alluded to the fact that when energy consumption was included, the downward trend in environmental degradation predicted by the hypothesis was not statistically significant. Ultimately, the study demonstrated that economic growth causes environmental degradation in developed countries.
3.2. The Nexus of Renewable Energy Consumption and CO2 Emissions
Researchers have limited their study of the impact of economic growth and wealth inequality on carbon emissions to the energy consumption factor. Many international reports in the field of environmental policy and economics agree that energy consumption plays a major role in reducing greenhouse gas emissions on a global scale. For instance, sector-centered analyses of global carbon emissions highlight the energy sector in particular. The IPCC [2] report stated that, according to 2019 data, approximately 79% of total greenhouse gas emissions originate from the energy, industry, transportation, and buildings sectors. The report also explained that energy efficiency initiatives for achieving economic growth and reducing carbon emissions cannot keep up with total sector-based emissions [7].
Energy consumption remains one of the most frequently considered factors in studies linking economic growth and carbon emissions (Figure 2). In this context, Ahmad et al. [42] examined the relationship between carbon emissions, energy consumption, and economic growth in India from 1971 to 2014. The results highlighted the importance of energy efficiency and local initiatives because energy consumption at the aggregate and individual levels increases carbon emissions. Mirza and Kanwal [43] investigated the relationship between economic growth, energy consumption, and CO2 emissions in Pakistan. The empirical findings revealed a bidirectional causal relationship. Thus, increasing the proportion of renewable energy in Pakistan’s energy portfolio is expected to deliver significant benefits in both economic development and carbon emission reduction. Yao et al. [44] empirically examined the relationships between economic growth, carbon emissions, and renewable energy consumption in 17 developed and developing countries during the 1990–2014 period. The findings indicated that renewable energy consumption significantly reduces carbon emissions.
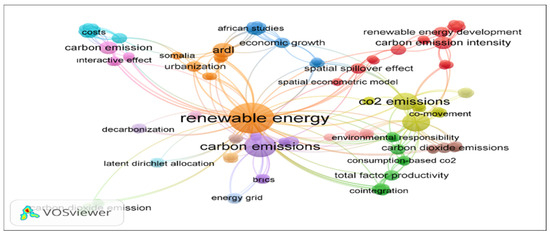
Figure 2.
Keyword map of WOS academic studies focusing on the relationship between renewable energy, economic growth, and environmental quality indicators (this figure was created by the author using a search for “renewable energy”, “economic growth”, and “carbon emission” in the title within the Web of Science database on 26 December 2024).
The causal relationship between energy production and consumption levels and carbon emissions varies by energy type. For example, Long et al. [45], using annual data from 1952 to 2012 for China, demonstrated that coal consumption increases both economic growth and carbon emissions and that a causal relationship exists between GDP, CO2 emissions, and energy consumption. Wen et al. [46] found that economic growth and fossil fuel consumption negatively affected carbon emissions in South African countries during the 1985–2018 period. Wang et al. [36] analyzed the relationship between different energy sources, economic growth, and carbon emissions in 24 countries with nuclear energy between 2001 and 2020. The results indicated that coal consumption does not affect economic growth but increases carbon emissions; oil consumption increases both economic growth and carbon emissions; and natural gas consumption increases economic growth but does not significantly affect carbon emissions. Similarly, Chen et al. [47] demonstrated that high oil consumption and economic growth increased CO2 emissions in Bangladesh from 1972 to 2020, whereas technological innovation initiatives reduced CO2 emissions.
Ali et al. [48], analyzing annual data for the 1975–2020 period in Asian countries, found that an employed labor force and capital formation boost long-term economic growth and that nonrenewable energy use increases long-term CO2 emissions, whereas renewable energy use significantly reduces them. Liu et al. [49], using annual data from 1995 to 2020 for China, also found no significant causal relationship between urbanization and carbon emissions in the short and long run. However, they found that energy use and economic growth increase CO2 emissions, which supports the idea that energy consumption and economic growth reduce environmental quality. Similarly, Bekun et al. [50] investigated the relationship between capital, labor, CO2 emissions, energy use, and economic growth in South Africa from 1960 to 2016. The results confirmed an inverted U-shaped relationship between energy consumption and economic growth. In a similar study, Akram et al. [51] analyzed the impact of energy efficiency and renewable energy use on CO2 emissions in a sample from Mexico, Indonesia, Nigeria, and Türkiye (MINT) for the 1990–2014 period. The results revealed that energy efficiency and renewable energy use reduce CO2 emissions in MINT countries, although the relationship between these variables is asymmetric.
3.3. The Nexus of Wealth Inequality and CO2 Emission
In most developed countries, a small minority controls a large share of the wealth. However, relatively few studies have examined the causes and consequences of this wealth inequality. Although studies on wealth inequality have increased recently, conceptual and methodological dilemmas persist [52]. Zucman [53] also empirically found that wealth inequality increased in the US after the 1980s, with the share of the top 1% rising from 25 to 30% in 1980 to 40% in 2016. Similarly, Vasconcelos et al. [54] linked climate change to conflicting policies between rich and poor countries. The study emphasized significant differences in interaction and cooperation between the rich and the poor, indicating that the former exert a greater influence on global climate change. Thus, although wealth inequality does not directly affect climate change, it may indirectly affect the carbon footprint.
Figure 3 illustrates that the relationships between wealth inequality and environmental values encompass issues such as climate change, taxation, poverty, education, housing, and disasters. The IPCC also stated unsustainable energy use, land use changes, and inequality in production and consumption patterns among regions, countries, and individuals drove global greenhouse gas emissions from 2010 to 2019 [2]. Knight et al. [55] examined the relationship between climate change and economic inequality using data from 26 high-income countries between 2000 and 2010. Their findings indicated that inequality significantly increases per capita carbon emissions. Similarly, Yang et al. [56] examined the relationship between housing wealth and direct and indirect carbon emissions in China between 2009 and 2020. The study also revealed that the relationship between carbon emissions and income inequality varies locally and nationally. Howell and Elliott [57] investigated the relationship between wealth inequality and local natural disasters and damage in the US from 1999 to 2013. The results indicated that wealth inequality—measured by factors such as race, education, and home ownership—is associated with both the extent of local damage and the amount of aid received. Finally, Apeti et al. [23] conducted a regression analysis of carbon emissions and income inequality between 1990 and 2020 across 200 countries. Contrary to expectations, the findings show that the rich account for only 20% of carbon emissions. However, the study emphasized that countries like China and India, which have largely completed their industrialization, are more responsible for global carbon emissions.
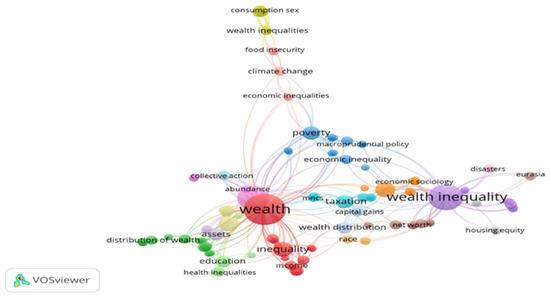
Figure 3.
Keyword map of WOS academic studies focusing on the relationship between wealth inequality and environmental quality indicators (this figure was created by the author using a search for “wealth inequality” in the title “carbon emission” among the keywords within the Web of Science database on 28 December 2024).
At the local scale, there is a negative relationship between wealth inequality and environmental quality indicators, in particular, CO2 emissions. Boadi and Kuitunen [58] analyzed the impact of environmental problems on the health of urban households in Ghana’s Accra Metropolitan Area. Their results revealed that environmental pollution—such as garbage, wastewater, and infrastructure deficiencies—is most prevalent in poor neighborhoods. Similarly, Qin et al. [59] found a direct relationship between wealth inequality and carbon emissions at the city scale in China, using data from 2014, 2016, and 2018. The study emphasized that policies aimed at reducing wealth inequality can play a key role in combating climate change. Andersson [60] explored the relationship between income and wealth inequality and the ecological footprint in France, the Netherlands, the US, and the UK using annual data from 1962 to 2021. The findings supported the significant relationship between income inequality and the carbon footprint, but also showed that the environmental impacts of economic inequality remain limited.
4. Methodology
4.1. Model and Variable Specifications
This study mainly aimed to analyze the effects of economic growth, renewable energy consumption, and wealth inequality on CO2 emissions. It explored the relationships among these variables for countries with wealth inequality above the world average (0.404), using 2022 data from the World Inequality Database. The sample included South Africa, Chile, Brazil, Lebanon, Sao Tome and Principe, Mexico, Russia, Mozambique, Namibia, Zambia, Guinea-Bissau, Botswana, Angola, the United Arab Emirates, Malawi, Congo, and Benin (Table A1). The wealth share of the top one percent (INEQtop1%) was used as a key indicator of wealth inequality, reflecting the distribution of wealth in society. These data were collected from the World Inequality Database (https://wid.world/).
Climate change was represented by CO2 emission data sourced from the Global Carbon Atlas database (https://globalcarbonatlas.org/). Economic growth was measured by GDP per capita and renewable energy consumption by the share of renewable energy in total final energy consumption; both were obtained from the World Development Indicators database (https://databank.worldbank.org/source/world-development-indicators). Prior to analysis, all variables were log-transformed to ensure the integrity of the results and mitigate potential issues related to multicollinearity and heteroskedasticity. Following Zhang and Cheng [35], Knight et al. [55], Howell and Elliott [57], Yao et al. [44], and Khan et al. [39], the model of the study was constructed as in Equation (1):
where i represents the number of countries (i = 1, …, 17) and t signifies the time dimension (t = 1995, …, 2021). and denote the constant term and the error term, respectively. , , , and show the coefficients measuring the effects of the explanatory variables on the dependent variable. captures the linear relationship between GRW and CO2 emissions, captures the nonlinear relationship between GRW and CO2 emissions, assesses the impact of REC on CO2 emissions, and evaluates the impact of INEQ on CO2 emissions. Table 1 shows the definitions of variables.

Table 1.
Definition of variables.
Before estimating the parameters, this study reviewed the descriptive statistics (Table 2). The findings indicated that GRW had the highest maximum and mean value, whereas CO2 had the lowest minimum value. Moreover, CO2 and REC exhibited high volatility compared to other variables. This implied that these two variables deviate more from their mean values than the other series and thus had larger fluctuations. Meanwhile, INEQ was the least volatile variable. An analysis of skewness revealed that GRW had right-tailed skewness, whereas CO2, REC, and INEQ had left-tailed skewness. Furthermore, CO2 and GRW had the lightest tails because of their relatively low kurtosis values, whereas REC and INEQ had kurtosis values greater than 3, indicating heavy-tailed distributions. The Jarque–Bera and Chen–Shapiro tests confirmed that all variables were non-normally distributed, suggesting that estimation methods robust to non-normality may increase the accuracy of the results.
Table 2.
Descriptive statistics.
4.2. Estimation Techniques
Local economies transcend national borders, showing interdependence in economic, environmental, political, and financial spheres. Controlling for cross-sectional dependence (CSD) is crucial in panel data analysis. Neglecting CSD may lead to erroneous statistical estimations in the following stages because of the preference for incorrect methods. Therefore, in the first stage, this study tested for the presence of CSD using recent methods such as CD by Pesaran [61,62], CDw by Juodis and Reese [63], CDw+ by Fan et al. [64], and CD* by Xie and Pesaran [65].
After controlling for CSD, the stationarity properties of the variables were examined using two unit root tests: the Herwartz and Siedenburg (HS) [66] and Demetrescu and Hanck (DH) [67] tests. The HS test is effective against CSD and slope heterogeneity (SH), while the DH test is robust to heteroskedasticity.
Next, the study investigates the existence of a long-run cointegration relationship using an error-correction-based cointegration test (ECM), which addresses issues of CSD, SH, and endogeneity. Westerlund [68] introduced this test, which provides four statistics: group mean statistics (Gt and Ga) and panel statistics (Pt and Pa). The group mean statistics tested the null hypothesis against the alternative hypothesis that at least one group was cointegrated, while panel statistics test the null hypothesis against the alternative hypothesis that the entire panel is cointegrated.
Finally, the study employed MMQR, a novel and robust approach, to estimate the relationship among the variables. Proposed by Machado and Silva [69], this approach is favored because it handles asymmetry and unobserved endogeneity, resists outliers, allows estimation of conditional quantiles at different levels, and accounts for unobserved heterogeneity. It also produces reliable and robust results in the presence of nonlinear relationships and violations of normal distribution assumptions. In contrast, standard estimators like OLS, which focus on the conditional mean, have significant limitations. To confirm the MMQR results, we employed simultaneous quantile regression (SQR), a fixed effects model with Driscoll and Kraay standard errors (FE–DKSE), and fully modified ordinary least squares (FMOLS) methods to confirm the reliability of the MMQR results. FMOLS is known to yield trustworthy results by addressing serial correlation and endogeneity [70]. It also provides consistent parameter estimates even in small samples. FE–DKSE provides a reliable alternative for panel data analysis by addressing CSD, heteroscedasticity, and autocorrelation [71].
A comprehensive description of the MMQR equation is provided as follows:
Based on Equation (1), represents the quantile distribution (Yit) of the CO2 emissions (CO2), which serve as the dependent variables. is a vector of the explanatory variables, including economic growth (GRW), the square of GDP per capita (GRWSQ), renewable energy consumption (REC), and wealth inequality (INEQ). Figure 4 displays the flowchart of the estimation techniques.
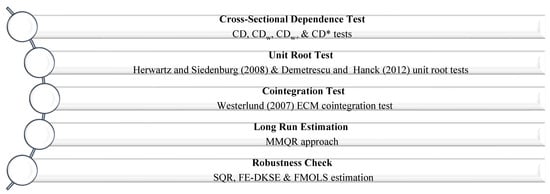
Figure 4.
Flowchart of the estimation techniques.
5. Empirical Findings and Discussion
5.1. Empirical Findings
CSD can distort parameter estimates and lead to biased results. To ensure robust estimations, this study addressed CSD. Table 3 presents the CSD test results, which revealed significant CSD across countries. This implied that in countries with high wealth inequality, a shock in one country affects the other countries.
Table 3.
Cross-sectional dependence (CSD) results.
Because first-generation unit root tests cannot address the CSD problem, second-generation tests are required for panel data analysis. Accordingly, this study employed HS and DH unit root tests to evaluate stationarity. Table 4 shows unit root results. The unit root results indicated that the null hypothesis of a unit root at levels was not rejected by any variable; however, all variables became stationary in their first differences. These results proved that all variables were integrated variables of the first order.
Table 4.
Unit root test results.
Following the unit root tests, this study assessed whether the variables included in the model were cointegrated using Westerlund’s [68] error-correction-based panel cointegration test, which accounts for CSD. Table 5 displays the cointegration results. The cointegration results demonstrated rejecting the null hypothesis of no cointegration and revealing the presence of cointegration.
Table 5.
Cointegration test results.
After establishing cointegration, the study proceeded with coefficient estimation using the MMQR approach to assess the relationship among GRW, GRWSQ, REC, INEQ, and CO2. Table 6 reports the MMQR results. GRW had a positive and significant effect on CO2 across all quantiles, whereas GRWSQ was negative and significant. This confirmed the EKC hypothesis, which posited an inverted U-shaped relationship between GRW and CO2. These results aligned with those of Ozturk and Acaravcı [38], Wang et al. [72], Khan et al. [39], and Alakbarov et al. [41], though they contradicted Zhang and Cheng [35]. The findings suggested that countries with high wealth inequality could address climate change and environmental challenges at advanced stages of economic development.
Table 6.
Method of moments quantile regression (MMQR) results.
The MMQR results revealed that REC significantly reduced CO2 emissions across all quantiles. This finding aligned with those of Long et al. [45], Mirza and Kanwal [43], Yao et al. [44], Wen et al. [46], and Chen et al. [47], which also showed that increases in REC reduce CO2 emissions. Comparing our literature review with these empirical findings confirmed the widely accepted conclusion that renewable energy consumption reduces CO2 emissions. Based on these findings, we argued that in countries with the highest wealth inequality, investments in REC effectively improve environmental quality and combat climate change by reducing CO2 emissions. REC, recognized as one of the most critical alternatives for reducing fossil-based emissions, also supports energy efficiency and supply security.
The MMQR results indicated that INEQ significantly increases CO2 emissions in the lower quantiles (Q0.10, Q0.25, and Q0.50) but not in the higher quantiles (Q0.75 and Q0.90). Thus, an increase in wealth inequality raises CO2 emissions. The findings of the study concurred with those of Boadi and Kuitunen [58], Vasconcelos et al. [54], Knight et al. [55], and Howell and Elliott [57], but partially diverged from those of Andersson [60] and Apeti et al. [23]. The literature revealed a complex relationship between wealth inequality and CO2 emissions; however, many studies supported the idea that wealth inequality adversely affects environmental quality by increasing CO2 emissions and exacerbating climate change. This finding suggested that unequal wealth distribution significantly hinders efforts to achieve the SDGs. Therefore, policymakers should prioritize reducing wealth inequality, especially in countries with the highest inequality, to promote social justice, environmental sustainability, and effective climate change mitigation.
We checked the MMQR findings using three different estimation approaches—SQR, FE–DKSE, and FMOLS. Table 7 presents the robustness check results. In all three specifications, GRW increased CO2 emissions while GRWSQ decreased them. These results show that economic growth improves environmental sustainability beyond a certain threshold level, supporting the EKC hypothesis. An increase in REC helped to reduce CO2 emissions in three estimation specifications. Meanwhile, INEQ increased emissions in all specifications.
Table 7.
Robustness check results.
The similar significance, coefficients, and signs across all estimators confirmed that our results were robust and reliable. Figure 5 illustrates the schematic presentation of the empirical results.
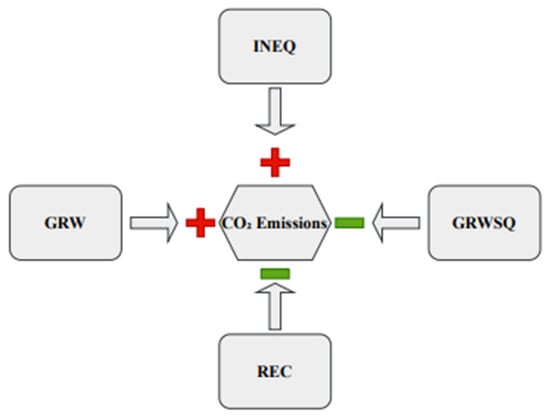
Figure 5.
Schematic presentation of the empirical results.
5.2. Discussion
The coefficient estimation results show that economic growth increases CO2 emissions up to a certain point and then reduces them. This pattern supports the EKC hypothesis and aligns with the existing literature. Maslow’s hierarchy of needs reminds us that people first require nutrition and shelter, which necessitates economic growth. Consequently, both developed and developing countries engage in relentless competition for economic growth, with enterprises prioritizing profit maximization and cost minimization. Among the sectors, the added value of the industrial sector is significantly higher than that of the agricultural sector. Since the Industrial Revolution, businesses have relied heavily on fossil fuels to power growth. Although policymakers now promote renewable energy as part of the green economy transition, the desired level has not been reached. The Energy Institute [73] reported that fossil fuels still account for 81.5% of global energy consumption and CO2 emissions reached a record high in 2023. The intensive use of fossil fuels is the most important factor explaining the impact of economic growth on CO2 emissions.
In the later stages of economic growth, several factors can explain the reduction in CO2 emissions. The most important of these factors relates to the difference between growth and development. Democracy is an expensive commodity for poor societies [74]. Therefore, human development remains low during the early stages of economic development. As economies develop and individuals’ disposable incomes increase, elements besides income begin to gain meaning and value for human life. Among these values, sustainability has recently gained importance in socioeconomic terms. In democratic societies where human rights are protected and the rule of law is ensured, environmental sensitivity becomes more prominent. For this reason, many civil society organizations do not consider economic growth alone sufficient; they demand environmentally sensitive economic growth for sustainable growth and development. Additionally, digitalization, the shift from the industrial to the services sector, and the increased use of renewable energy in many developed countries contribute to reducing CO2 emissions in the later stages of economic growth.
In line with the literature, this study reveals that renewable energy consumption reduces CO2 emissions because renewable energy sources are substitutes for fossil fuels and remain environmentally friendly from production to consumption. However, the transition to renewable energy production has not occurred at the expected rate. Lobbying and cost are likely the most important reasons for this situation. According to the International Energy Agency [75], the countries that own or operate fossil reserves are primarily developed ones. This situation reveals inequalities in global energy markets and underscores the strategic role and control that developed countries maintain over energy resources. Consequently, the green economy transformation in developed countries will play a decisive role in reducing global CO2 emissions. Establishing renewable energy production facilities requires significant technological and capital investments. Technology and capital are the two main factors that determine the development gap between countries. In their absence, developing countries find it very difficult to invest in renewable energy and compete with developed countries. In this context, Ahmad et al. [42] emphasized that local investments should increase in India to expand renewable energy use, whereas Mirza and Kanwal [43] stressed that the Pakistani government should encourage more renewable energy investments in its energy portfolio.
The literature remains unclear about the impact of wealth inequality on CO2 emissions. A few studies reported that wealth inequality does not increase CO2 emissions [23]. However, these claims require further empirical support. Most research finds that wealth inequality increases CO2 emissions [55,57]. One reason is conspicuous consumption, especially among the wealthy [76]. Another factor that explains the increasing effect of wealth inequality on CO2 emissions is political power and influence, especially of the wealthy segment of society. When the high-wealth minority dominates decision-making processes, the state struggles to enforce laws and sustainable policies effectively. Thus, wealth inequality increases CO2 emissions through both economic and political-institutional channels.
6. Conclusions and Policy Implications
This study investigated the effects of economic growth, renewable energy consumption, and wealth inequality on CO2 emissions from 1995 to 2021 in 17 countries with the highest wealth inequality. The results showed that economic growth increases CO2 emissions up to a certain point, after which it mitigates emissions. This finding, consistent with many empirical studies, supported the EKC hypothesis. The results also indicated that renewable energy consumption mitigates CO2 emissions, while wealth inequality increases them.
These results are explained by three main factors: first, intense competition for economic growth and rising inequality between developed and developing countries drive higher CO2 emissions. Second, countries with lower levels of economic development require foreign capital investments to create jobs. They are forced to accept environmentally insensitive investments to spur growth and employment, which increases environmental damage and undermines efforts to combat climate change. Third, powerful lobbies and capital owners weaken states’ ability to enforce environmental regulations and sustainable policies.
To increase environmental sensitivity during economic growth, social awareness must remain high. International nongovernmental organizations play a crucial role in supporting the SDGs and raising public awareness. Strong implementation of environmentally sensitive policies is achievable only in democratic societies that uphold the rule of law and respect human rights. Liberal education and the free press should support this process. South Africa, Chile, Brazil, Mexico, and Russia, which are included in the sample group of the study, are countries with significant potential in terms of solar, wind, and hydroelectric energy resources. Increasing renewable energy investments in these countries in order to reduce fossil fuel dependency may yield significant results in reducing CO2 emissions and combating climate change. To make renewable energy a strong alternative to fossil fuels, R&D investments must increase and environmentally sensitive investments must receive support from financial and fiscal policies. In this context, green financing instruments such as green loans, green bonds, green insurance, and green sukuk can foster sustainable development by facilitating environmentally friendly investments. Moreover, advanced foreign technology should be utilized when needed. In addition, for sustainable agricultural production, it is recommended to use techniques that increase the carbon storage capacity of the soil through organic farming and agroecological methods in countries such as Brazil and Angola.
To reduce the negative impact of wealth inequality on climate change and environmental quality, policies that improve income distribution should be prioritized. These include increasing income taxes, abolishing tax amnesty, raising excise taxes on property, improving workers’ rights and wages, taxing financial returns, and supporting small and medium-sized enterprises. Such policies promote social justice and support environmental sustainability and the fight against climate change.
Like all scientific studies, this research has some limitations. First, the analysis period (1995–2021) was determined by data availability for the selected countries. Second, 17 countries with the highest wealth inequality were analyzed as the only criterion in the country sample. However, making an evaluation based on country groups selected according to different criteria, such as economic growth or geopolitical location, might make the policy implications more acceptable and comprehensive. Third, we estimated the relationships among GRW, GRWSQ, INEQ, and CO2 emissions using only nonparametric and linear estimation methods. Future research should examine the effects of wealth inequality on the ecological footprint and load capacity factors using wavelet-based analysis across country groups such as N11 (Next Eleven), G7 (Group of Seven), ASEAN (Association of Southeast Asian Nations), BRICS (Brazil, Russia, India, China, and South Africa), and MINT (Mexico, Indonesia, Nigeria, and Türkiye).
Author Contributions
Conceptualization, T.H., O.S., K.Y. and M.Y.; methodology, T.H.; software, T.H.; validation, T.H., O.S., K.Y. and M.Y.; formal analysis, T.H.; investigation, T.H., O.S., K.Y. and M.Y.; resources, T.H., O.S., K.Y. and M.Y.; data curation, T.H.; writing—original draft preparation, T.H., O.S., K.Y. and M.Y.; writing—review and editing, T.H., O.S., K.Y. and M.Y.; visualization, T.H., O.S., K.Y. and M.Y.; supervision, T.H., O.S., K.Y. and M.Y. All authors have read and agreed to the published version of the manuscript.
Funding
This research received no external funding.
Institutional Review Board Statement
Not applicable.
Informed Consent Statement
Not applicable.
Data Availability Statement
The data presented in this study are available on request from the corresponding author.
Conflicts of Interest
The authors declare no conflict of interest.
Appendix A
Table A1.
List of countries with the highest wealth inequality.
Table A1.
List of countries with the highest wealth inequality.
| No. | Countries | Score | No. | Countries | Score | No. | Countries | Score |
|---|---|---|---|---|---|---|---|---|
| 1 | South Africa | 0.545 | 7 | Russian Federation | 0.476 | 13 | Angola | 0.447 |
| 2 | Chile | 0.498 | 8 | Mozambique | 0.4746 | 14 | United Arab Emirates | 0.435 |
| 3 | Brazil | 0.486 | 9 | Namibia | 0.4741 | 15 | Malawi | 0.432 |
| 4 | Lebanon | 0.482 | 10 | Zambia | 0.468 | 16 | Congo | 0.425 |
| 5 | Sao Tome and Principe | 0.4788 | 11 | Guinea-Bissau | 0.460 | 17 | Benin | 0.409 |
| 6 | Mexico | 0.4787 | 12 | Botswana | 0.455 | 18 | World | 0.404 |
Table A2.
List of acronyms and descriptions.
Table A2.
List of acronyms and descriptions.
| Acronyms | Description |
|---|---|
| CSD | Cross-Sectional Dependence |
| DH | Demetrescu and Hanck |
| EKC | Environmental Kuznets Curve |
| EU | European Union |
| FE–DKSE | Fixed Effects with Driscoll and Kraay Standard Errors |
| FMOLS | Fully Modified Ordinary Least Squares |
| GCA | Global Carbon Atlas |
| GRW | Economic Growth |
| GRWSQ | Square of GDP Per Capita |
| HS | Herwartz and Siedenburg |
| INEQ | Wealth Inequality |
| INEQtop1% | Wealth Share of the Top One Percent |
| IPCC | Intergovernmental Panel on Climate Change |
| MMQR | Method of Moments Quantile Regression |
| REC | Renewable Energy Consumption |
| SDGs | Sustainable Development Goals |
| SQR | Simultaneous Quantile Regression |
| UN | United Nations |
| UNEP | United Nations Environment Programme |
| UNFCCC | United Nations Framework Convention on Climate Change |
| WDI | World Development Indicators |
| WID | World Inequality Database |
| WMO | World Meteorological Organization |
| WOS | Web of Science |
References
- Chancel, L.; Bothe, P.; Voituriez, T. Climate Inequality Report 2023; World Inequality Lab: Paris, France, 2023. [Google Scholar]
- Calvin, K.; Dasgupta, D.; Krinner, G.; Mukherji, A.; Thorne, P.W.; Trisos, C.; Romero, J.; Aldunce, P.; Barrett, K.; Blanco, G.; et al. IPCC, 2023a: Climate Change 2023: Synthesis Report. Contribution of Working Groups I, II and III to the Sixth Assessment Report of the Intergovernmental Panel on Climate Change; Core Writing Team, Lee, H., Romero, J., Eds.; IPCC: Geneva, Switzerland, 2023. [Google Scholar]
- Sahoo, M.; Sahoo, J. Effects of Renewable and Non-renewable Energy Consumption on CO2 Emissions in India: Empirical Evidence from Disaggregated Data Analysis. J. Public Aff. 2022, 22, e2307. [Google Scholar] [CrossRef]
- Dhar, P.; Gupta, P. Prevention, Precaution, and Polluter Pays Principles. In The Oxford Handbook of Environmental and Natural Resources Law in India; Oxford University Press: Oxford, UK, 2024; pp. 217–234. [Google Scholar]
- Barros, B.; Wilk, R. The Outsized Carbon Footprints of the Super-Rich. Sustain. Sci. Prac. Policy 2021, 17, 316–322. [Google Scholar] [CrossRef]
- Adua, L. Super Polluters and Carbon Emissions: Spotlighting How Higher-Income and Wealthier Households Disproportionately Despoil Our Atmospheric Commons. Energy Policy 2022, 162, 112768. [Google Scholar] [CrossRef]
- Calvin, K.; Dasgupta, D.; Krinner, G.; Mukherji, A.; Thorne, P.W.; Trisos, C.; Romero, J.; Aldunce, P.; Barret, K.; Blanco, G.; et al. IPCC, 2023b: Climate Change 2023: Synthesis Report, Summary for Policymakers. Contribution of Working Groups I, II and III to the Sixth Assessment Report of the Intergovernmental Panel on Climate Change; Core Writing Team, Lee, H., Romero, J., Eds.; IPCC: Geneva, Switzerland, 2023. [Google Scholar]
- UN Environment. Global Environment Outlook—GEO-6: Healthy Planet, Healthy People; UN Environment, Ed.; Cambridge University Press: Cambridge, UK, 2019; ISBN 9781108627146. [Google Scholar]
- European Commission: IEA, J.R.C.; Crippa, M.; Guizzardi, D.; Pagani, F.; Banja, M.; Muntean, M.; Schaaf, E.; Monforti-Ferrario, F.; Becker, W.E.; Quadrelli, R.; et al. GHG Emissions of All World Countries. Publ. Off. Eur. Union Luxemb. 2024, 10, 953322. [Google Scholar]
- World Bank World Development Indicators. 2024. Available online: https://databank.worldbank.org/source/world-development-indicators (accessed on 2 February 2025).
- United Nations Environment Programme. Emissions Gap Report 2023: Broken Record—Temperatures Hit New Highs, yet World Fails to Cut Emissions (Again); United Nations Environment Programme: Nairobi, Kenya, 2023; ISBN 9789280740981. [Google Scholar]
- Boyce, J.K. Inequality as a Cause of Environmental Degradation. Ecol. Econ. 1994, 11, 169–178. [Google Scholar] [CrossRef]
- Grunewald, N.; Klasen, S.; Martinez-Zarzoso, I.; Muris, C. Income Inequality and Carbon Emissions. SSRN Electron. J. 2012, 92, 1–7. [Google Scholar] [CrossRef]
- Heerink, N.; Mulatu, A.; Bulte, E. Income Inequality and the Environment: Aggregation Bias in Environmental Kuznets Curves. Ecol. Econ. 2001, 38, 359–367. [Google Scholar] [CrossRef]
- Jorgenson, A.; Schor, J.; Huang, X. Income Inequality and Carbon Emissions in the United States: A State-Level Analysis, 1997–2012. Ecol. Econ. 2017, 134, 40–48. [Google Scholar] [CrossRef]
- Ravallion, M.; Heil, M.; Jalan, J. Carbon Emissions and Income Inequality. Oxf. Econ. Pap. 2000, 52, 651–669. [Google Scholar] [CrossRef]
- IPCC IPCC Fifth Assessment Report Synthesis Report. 16th Annual Symposium of the French Renewable Energy Association. Available online: https://ser-evenements.com/IMG/pdf/1.1_-_rajendra_kumar_pachauri_-_giec_-_18_slides_sur_20_.pdf (accessed on 26 January 2025).
- Raihan, A.; Hasan, M.d.A.; Voumik, L.C.; Pattak, D.C.; Akter, S.; Ridwan, M. Sustainability in Vietnam: Examining Economic Growth, Energy, Innovation, Agriculture, and Forests’ Impact on CO2 Emissions. World Dev. Sustain. 2024, 4, 100164. [Google Scholar] [CrossRef]
- United Nations Framework Convention on Climate Change Paris Agreement on Climate Change. Available online: https://unfccc.int/sites/default/files/english_paris_agreement.pdf (accessed on 26 January 2025).
- World Meteorological Organization State of the Global Climate. 2023. Available online: https://wmo.int/publication-series/state-of-global-climate-2023 (accessed on 16 January 2025).
- Parsons, E.S.; Jowell, A.; Veidis, E.; Barry, M.; Israni, S.T. Climate Change and Inequality. Pediatr. Res. 2024, 1–8. [Google Scholar] [CrossRef] [PubMed]
- Shorrocks, A.; Davies, J.; Lluberas, R. Global Wealth Databook; Credit Suisse Research Institute: Zurich, Switzerland, 2022. [Google Scholar]
- Apeti, A.E.; Bambe, B.W.W.; Edoh, E.D.; Ly, A. Wealth Inequality and Carbon Inequality. Ecol. Econ. 2025, 227, 108406. [Google Scholar] [CrossRef]
- Reed, M.G.; George, C. Where in the World Is Environmental Justice? Prog. Hum. Geogr. 2011, 35, 835–842. [Google Scholar] [CrossRef]
- Schlosberg, D.; Collins, L.B. From Environmental to Climate Justice: Climate Change and the Discourse of Environmental Justice. WIREs Clim. Change 2014, 5, 359–374. [Google Scholar] [CrossRef]
- Newell, P.; Srivastava, S.; Naess, L.O.; Torres Contreras, G.A.; Price, R. Toward Transformative Climate Justice: An Emerging Research Agenda. WIREs Clim. Change 2021, 12, e733. [Google Scholar] [CrossRef]
- Hubacek, K.; Baiocchi, G.; Feng, K.; Muñoz Castillo, R.; Sun, L.; Xue, J. Global Carbon Inequality. Energy Ecol. Envrion. 2017, 2, 361–369. [Google Scholar] [CrossRef]
- Chancel, L. Global Carbon Inequality over 1990–2019. Nat. Sustain. 2022, 5, 931–938. [Google Scholar] [CrossRef]
- Sager, L. Highly Unequal Carbon Footprints. Nat. Sustain. 2022, 5, 912–913. [Google Scholar] [CrossRef]
- Baajike, F.B.; Oteng-Abayie, E.F.; Dramani, J.B.; Amanor, K. Effects of Trade Liberalization on the Global Decoupling and Decomposition of CO2 Emissions from Economic Growth. Heliyon 2024, 10, e23470. [Google Scholar] [CrossRef]
- Kuznets, S. Economic Growth and Income Inequality. Am. Econ. Rev. 1955, 45, 1–28. [Google Scholar]
- Grossman, G.; Krueger, A. Environmental Impacts of a North American Free Trade Agreement; MIT Press: Cambridge, MA, USA, 1991. [Google Scholar]
- Grossman, G.M.; Krueger, A.B. Economic Growth and the Environment. Q. J. Econ. 1995, 110, 353–377. [Google Scholar] [CrossRef]
- Copeland, B.R.; Taylor, M.S. North-South Trade and the Environment. Q. J. Econ. 1994, 109, 755–787. [Google Scholar] [CrossRef]
- Zhang, X.-P.; Cheng, X.-M. Energy Consumption, Carbon Emissions, and Economic Growth in China. Ecol. Econ. 2009, 68, 2706–2712. [Google Scholar] [CrossRef]
- Wang, Q.; Guo, J.; Li, R.; Jiang, X. Exploring the Role of Nuclear Energy in the Energy Transition: A Comparative Perspective of the Effects of Coal, Oil, Natural Gas, Renewable Energy, and Nuclear Power on Economic Growth and Carbon Emissions. Env. Res. 2023, 221, 115290. [Google Scholar] [CrossRef]
- Soytas, U.; Sari, R.; Ewing, B.T. Energy Consumption, Income, and Carbon Emissions in the United States. Ecol. Econ. 2007, 62, 482–489. [Google Scholar] [CrossRef]
- Ozturk, I.; Acaravci, A. CO2 Emissions, Energy Consumption and Economic Growth in Turkey. Renew. Sustain. Energy Rev. 2010, 14, 3220–3225. [Google Scholar] [CrossRef]
- Khan, M.K.; Khan, M.I.; Rehan, M. The Relationship between Energy Consumption, Economic Growth and Carbon Dioxide Emissions in Pakistan. Financ. Innov. 2020, 6, 1. [Google Scholar] [CrossRef]
- Hou, A.; Liu, A.; Chai, L. Does Reducing Income Inequality Promote the Decoupling of Economic Growth from Carbon Footprint? World Dev. 2024, 173, 106423. [Google Scholar] [CrossRef]
- Alakbarov, N.; Gündüz, M.; Şaşmaz, M.Ü. Exploring the Link between Economic Growth, Energy Consumption, and Environmental Pollution in G20. In Natural Resources Forum; Blackwell Publishing Ltd.: Oxford, UK, 2024. [Google Scholar] [CrossRef]
- Ahmad, A.; Zhao, Y.; Shahbaz, M.; Bano, S.; Zhang, Z.; Wang, S.; Liu, Y. Carbon Emissions, Energy Consumption and Economic Growth: An Aggregate and Disaggregate Analysis of the Indian Economy. Energy Policy 2016, 96, 131–143. [Google Scholar] [CrossRef]
- Mirza, F.M.; Kanwal, A. Energy Consumption, Carbon Emissions and Economic Growth in Pakistan: Dynamic Causality Analysis. Renew. Sustain. Energy Rev. 2017, 72, 1233–1240. [Google Scholar] [CrossRef]
- Yao, S.; Zhang, S.; Zhang, X. Renewable Energy, Carbon Emission and Economic Growth: A Revised Environmental Kuznets Curve Perspective. J. Clean Prod. 2019, 235, 1338–1352. [Google Scholar] [CrossRef]
- Long, X.; Naminse, E.Y.; Du, J.; Zhuang, J. Nonrenewable Energy, Renewable Energy, Carbon Dioxide Emissions and Economic Growth in China from 1952 to 2012. Renew. Sustain. Energy Rev. 2015, 52, 680–688. [Google Scholar] [CrossRef]
- Wen, J.; Mughal, N.; Zhao, J.; Shabbir, M.S.; Niedbała, G.; Jain, V.; Anwar, A. Does Globalization Matter for Environmental Degradation? Nexus among Energy Consumption, Economic Growth, and Carbon Dioxide Emission. Energy Policy 2021, 153, 112230. [Google Scholar] [CrossRef]
- Chen, X.; Rahaman, M.A.; Murshed, M.; Mahmood, H.; Hossain, M.A. Causality Analysis of the Impacts of Petroleum Use, Economic Growth, and Technological Innovation on Carbon Emissions in Bangladesh. Energy 2023, 267, 126565. [Google Scholar] [CrossRef]
- Ali, A.; Radulescu, M.; Balsalobre-Lorente, D. A Dynamic Relationship between Renewable Energy Consumption, Nonrenewable Energy Consumption, Economic Growth, and Carbon Dioxide Emissions: Evidence from Asian Emerging Economies. Energy Environ. 2023, 34, 3529–3552. [Google Scholar] [CrossRef]
- Liu, H.; Wong, W.-K.; The Cong, P.; Nassani, A.A.; Haffar, M.; Abu-Rumman, A. Linkage among Urbanization, Energy Consumption, Economic Growth and Carbon Emissions. Panel Data Analysis for China Using ARDL Model. Fuel 2023, 332, 126122. [Google Scholar] [CrossRef]
- Bekun, F.V.; Emir, F.; Sarkodie, S.A. Another Look at the Relationship between Energy Consumption, Carbon Dioxide Emissions, and Economic Growth in South Africa. Sci. Total Environ. 2019, 655, 759–765. [Google Scholar] [CrossRef]
- Akram, R.; Umar, M.; Xiaoli, G.; Chen, F. Dynamic Linkages between Energy Efficiency, Renewable Energy along with Economic Growth and Carbon Emission. A Case of MINT Countries an Asymmetric Analysis. Energy Rep. 2022, 8, 2119–2130. [Google Scholar] [CrossRef]
- Killewald, A.; Pfeffer, F.T.; Schachner, J.N. Wealth Inequality and Accumulation. Annu. Rev. Sociol 2017, 43, 379–404. [Google Scholar] [CrossRef]
- Zucman, G. Global Wealth Inequality. Annu. Rev. Econ. 2019, 11, 109–138. [Google Scholar] [CrossRef]
- Vasconcelos, V.V.; Santos, F.C.; Pacheco, J.M.; Levin, S.A. Climate Policies under Wealth Inequality. Proc. Natl. Acad. Sci. USA 2014, 111, 2212–2216. [Google Scholar] [CrossRef]
- Knight, K.W.; Schor, J.B.; Jorgenson, A.K. Wealth Inequality and Carbon Emissions in High-Income Countries. Soc. Curr. 2017, 4, 403–412. [Google Scholar] [CrossRef]
- Yang, Z.; Wu, S.; Cheung, H.Y. From Income and Housing Wealth Inequalities to Emissions Inequality: Carbon Emissions of Households in China. J. Hous. Built Environ. 2017, 32, 231–252. [Google Scholar] [CrossRef]
- Howell, J.; Elliott, J.R. Damages Done: The Longitudinal Impacts of Natural Hazards on Wealth Inequality in the United States. Soc. Probl. 2019, 66, 448–467. [Google Scholar] [CrossRef]
- Boadi, K.O.; Kuitunen, M. Environment, Wealth, Inequality and the Burden of Disease in the Accra Metropolitan Area, Ghana. Int. J. Envrion. Health Res. 2005, 15, 193–206. [Google Scholar] [CrossRef] [PubMed]
- Qin, X.; Wu, H.; Zhang, X.; Wang, W. The Widening Wealth Inequality as a Contributor to Increasing Household Carbon Emissions. Front. Earth Sci. 2022, 10, 872806. [Google Scholar] [CrossRef]
- Andersson, F.N.G. Economic Inequality and the Ecological Footprint: Time-Varying Estimates for Four Developed Economies, 1962–2021. Ecol. Econ. 2024, 220, 108185. [Google Scholar] [CrossRef]
- Pesaran, M.H. Testing Weak Cross-Sectional Dependence in Large Panels. Econ. Rev. 2015, 34, 1089–1117. [Google Scholar] [CrossRef]
- Pesaran, M.H. General Diagnostic Tests for Cross-Sectional Dependence in Panels. Empir. Econ. 2021, 60, 13–50. [Google Scholar] [CrossRef]
- Juodis, A.; Reese, S. The Incidental Parameters Problem in Testing for Remaining Cross-Section Correlation. J. Bus. Econ. Stat. 2022, 40, 1191–1203. [Google Scholar] [CrossRef]
- Fan, J.; Liao, Y.; Yao, J. Power Enhancement in High-Dimensional Cross-Sectional Tests. Econometrica 2015, 83, 1497–1541. [Google Scholar] [CrossRef]
- Xie, Y.; Pesaran, M.H. A Bias-Corrected Cd Test for Error Cross-Sectional Dependence in Panel Data Models with Latent Factors. SSRN Electron. J. 2022. [Google Scholar] [CrossRef]
- Herwartz, H.; Siedenburg, F. Homogenous Panel Unit Root Tests under Cross Sectional Dependence: Finite Sample Modifications and the Wild Bootstrap. Comput. Stat. Data Anal. 2008, 53, 137–150. [Google Scholar] [CrossRef]
- Demetrescu, M.; Hanck, C. A Simple Nonstationary-Volatility Robust Panel Unit Root Test. Econ. Lett. 2012, 117, 10–13. [Google Scholar] [CrossRef]
- Westerlund, J. Testing for Error Correction in Panel Data*. Oxf. Bull Econ. Stat. 2007, 69, 709–748. [Google Scholar] [CrossRef]
- Machado, J.A.F.; Santos Silva, J.M.C. Quantiles via Moments. J. Econ. 2019, 213, 145–173. [Google Scholar] [CrossRef]
- Pedroni, P. Fully Modified OLS for Heterogeneous Cointegrated Panels. In Nonstationary Panels, Panel Cointegration, and Dynamic Panels; Baltagi, B.H., Fomby, T.B., Carter Hill, R., Eds.; Advances in Econometrics; Emerald Group Publishing Limited: Leeds, UK, 2001; Volume 15, pp. 93–130. ISBN 978-1-84950-065-4. [Google Scholar]
- Driscoll, J.C.; Kraay, A.C. Consistent Covariance Matrix Estimation with Spatially Dependent Panel Data. Rev. Econ. Stat. 1998, 80, 549–560. [Google Scholar] [CrossRef]
- Wang, S.S.; Zhou, D.Q.; Zhou, P.; Wang, Q.W. CO2 Emissions, Energy Consumption and Economic Growth in China: A Panel Data Analysis. Energy Policy 2011, 39, 4870–4875. [Google Scholar] [CrossRef]
- Energy Institute Statistical Review of World Energy 73rd Edition. Available online: https://www.energyinst.org/statistical-review#regional-overview (accessed on 26 January 2025).
- Lipset, S.M. Some Social Requisites of Democracy: Economic Development and Political Legitimacy. Am. Political. Sci. Rev. 1959, 53, 69–105. [Google Scholar] [CrossRef]
- International Energy Agency Data and Statistics. Available online: https://www.iea.org/data-and-statistics (accessed on 11 December 2024).
- Aye, G.C. Wealth Inequality and CO2 Emissions in Emerging Economies: The Case of BRICS; UNU-WIDER: Helsinki, UK, 2020; Volume 2020, ISBN 9789292569181. [Google Scholar]
Disclaimer/Publisher’s Note: The statements, opinions and data contained in all publications are solely those of the individual author(s) and contributor(s) and not of MDPI and/or the editor(s). MDPI and/or the editor(s) disclaim responsibility for any injury to people or property resulting from any ideas, methods, instructions or products referred to in the content. |
© 2025 by the authors. Licensee MDPI, Basel, Switzerland. This article is an open access article distributed under the terms and conditions of the Creative Commons Attribution (CC BY) license (https://creativecommons.org/licenses/by/4.0/).