
Setting Sail for a Sustainable Growth in Small/Medium Ports


Abstract
1. Introduction
2. Literature Review
2.1. Sustainable Indicators
2.1.1. Environmental Sustainability/Indicators
2.1.2. Economic Sustainability/Indicators
2.1.3. Social Sustainability/Indicators
2.2. Key Sustainability Indicators for Port Evaluation
2.2.1. Green Infrastructure (GI)
2.2.2. Environmental Monitoring and Management (EMM)
2.2.3. Management of Energy (ME)
2.2.4. Technology (TE)
2.2.5. Approaches for Waste Management and Recycling (WM&R)
2.2.6. Training of Employees in Environmentally Responsible Practices (EET)
2.2.7. Security of Employment and Social Protection (SE&SP)
2.2.8. Competitiveness (CMS)

| Main Indicators | Sub-Indicators | Gode | Description | Authors |
|---|---|---|---|---|
| GI | a. Green infrastructure design | GI 1 | Climate and the environment are less negatively impacted by its design, construction, or operation, and positive effects may also result from these factors. | [54,55] |
| b. Energy-saving strategies | GI 2 | |||
| c. Eco-friendly parking space at the port | GI 3 | |||
| d. Solar energy storage capacity facilities | GI 4 | |||
| e. Functional and aesthetic infrastructure planning | GI 5 | |||
| EMM | a. Environmental and energy management certification | EMM 1 | Policymakers, international organizations, and the general public can be informed on environmental trends and conditions and promote policy development with environmental monitoring. | [56,57] |
| b. Mitigating the emission of greenhouse gases | EMM 2 | |||
| c. Recommendations for the framework for a clean development project | EMM 3 | |||
| d. Recommendations for the framework for a clean development project | EMM 4 | |||
| e. Implementation of policies and regulations for green areas | EMM 5 | |||
| ME | a. Energy control equipment system for lighting, heating, etc. | ME 1 | Energy management is the proactive, planned, and systematic coordination of energy production, delivery, and consumption to satisfy demand while considering both environmental and financial objectives. | [58,59] |
| b. Energy management plan | ME 2 | |||
| c. Replace old-fashioned equipment with greener technology | ME 3 | |||
| d. Use of RES | ME 4 | |||
| e. Monitoring system of energy consumption | ME 5 | |||
| TE | a. Cyber security measures | ΤΕ 1 | Technology is revolutionizing the port world, altering how goods are handled and enhancing overall efficiency and security. Technological advancements in recent years have reshaped the port industry, significantly improving operations, logistics, and safety measures. | [60,61] |
| b. Green technology | ΤΕ 2 | |||
| c. Automated systems | ΤΕ 3 | |||
| d. Real-time systems | ΤΕ 4 | |||
| e. Smart technology | ΤΕ 5 | |||
| WM&R | a. Use of online tools for monitoring waste | WM&R 1 | Waste management aims to promote waste treatment alternatives that are appropriate for the waste, particularly favoring reuse and recycling. | [62,63] |
| b. Increase awareness of waste management among stakeholders | WM&R 2 | |||
| c. Financial incentives for stakeholders | WM&R 3 | |||
| d. Penalty paid due to illegal dumping of waste | WM&R 4 | |||
| e. Waste prevention plan | WM&R 5 | |||
| EET | a. Education seminars for energy conservation | EET 1 | Green training and development equip staff with practices that ensure adequate resource utilization, reduce waste, promote energy conservation, and mitigate the causes of environmental degradation. | [64,65] |
| b. Cooperation with other ports for lessons learned | EET 2 | |||
| c. Collaboration with the appropriate organization | EET 3 | |||
| d. Participation in projects to increase sustainability | EET 4 | |||
| e. Incentives (financial and social, professional) for their involvement in educational programs | EET 5 | |||
| SE&SP | a. Security plan | SE&SP 1 | This sector at ports aims to equip governments, enterprises, employees, and other stakeholders with the resources they need to reduce the threat posed by illicit activities. | [66,67] |
| b. Safety plan | SE&SP 2 | |||
| c. Adopt measures and create appropriate infrastructure for the safety of ships from external factors (e.g., weather conditions, etc.) | SE&SP 3 | |||
| d. Staff training on security and safety issues | SE&SP 4 | |||
| e. Cooperation with other bodies for the exchange of information on security issues | SE&SP 5 | |||
| CMS | a. Economy | CMS 1 | Competitiveness refers to a port’s ability to attract customers by providing superior goods, services, and other amenities. | [68,69] |
| b. Employment | CMS 2 | |||
| c. Tourism | CMS 3 | |||
| d. Research and development | CMS 4 | |||
| e. Technology | CMS 5 |
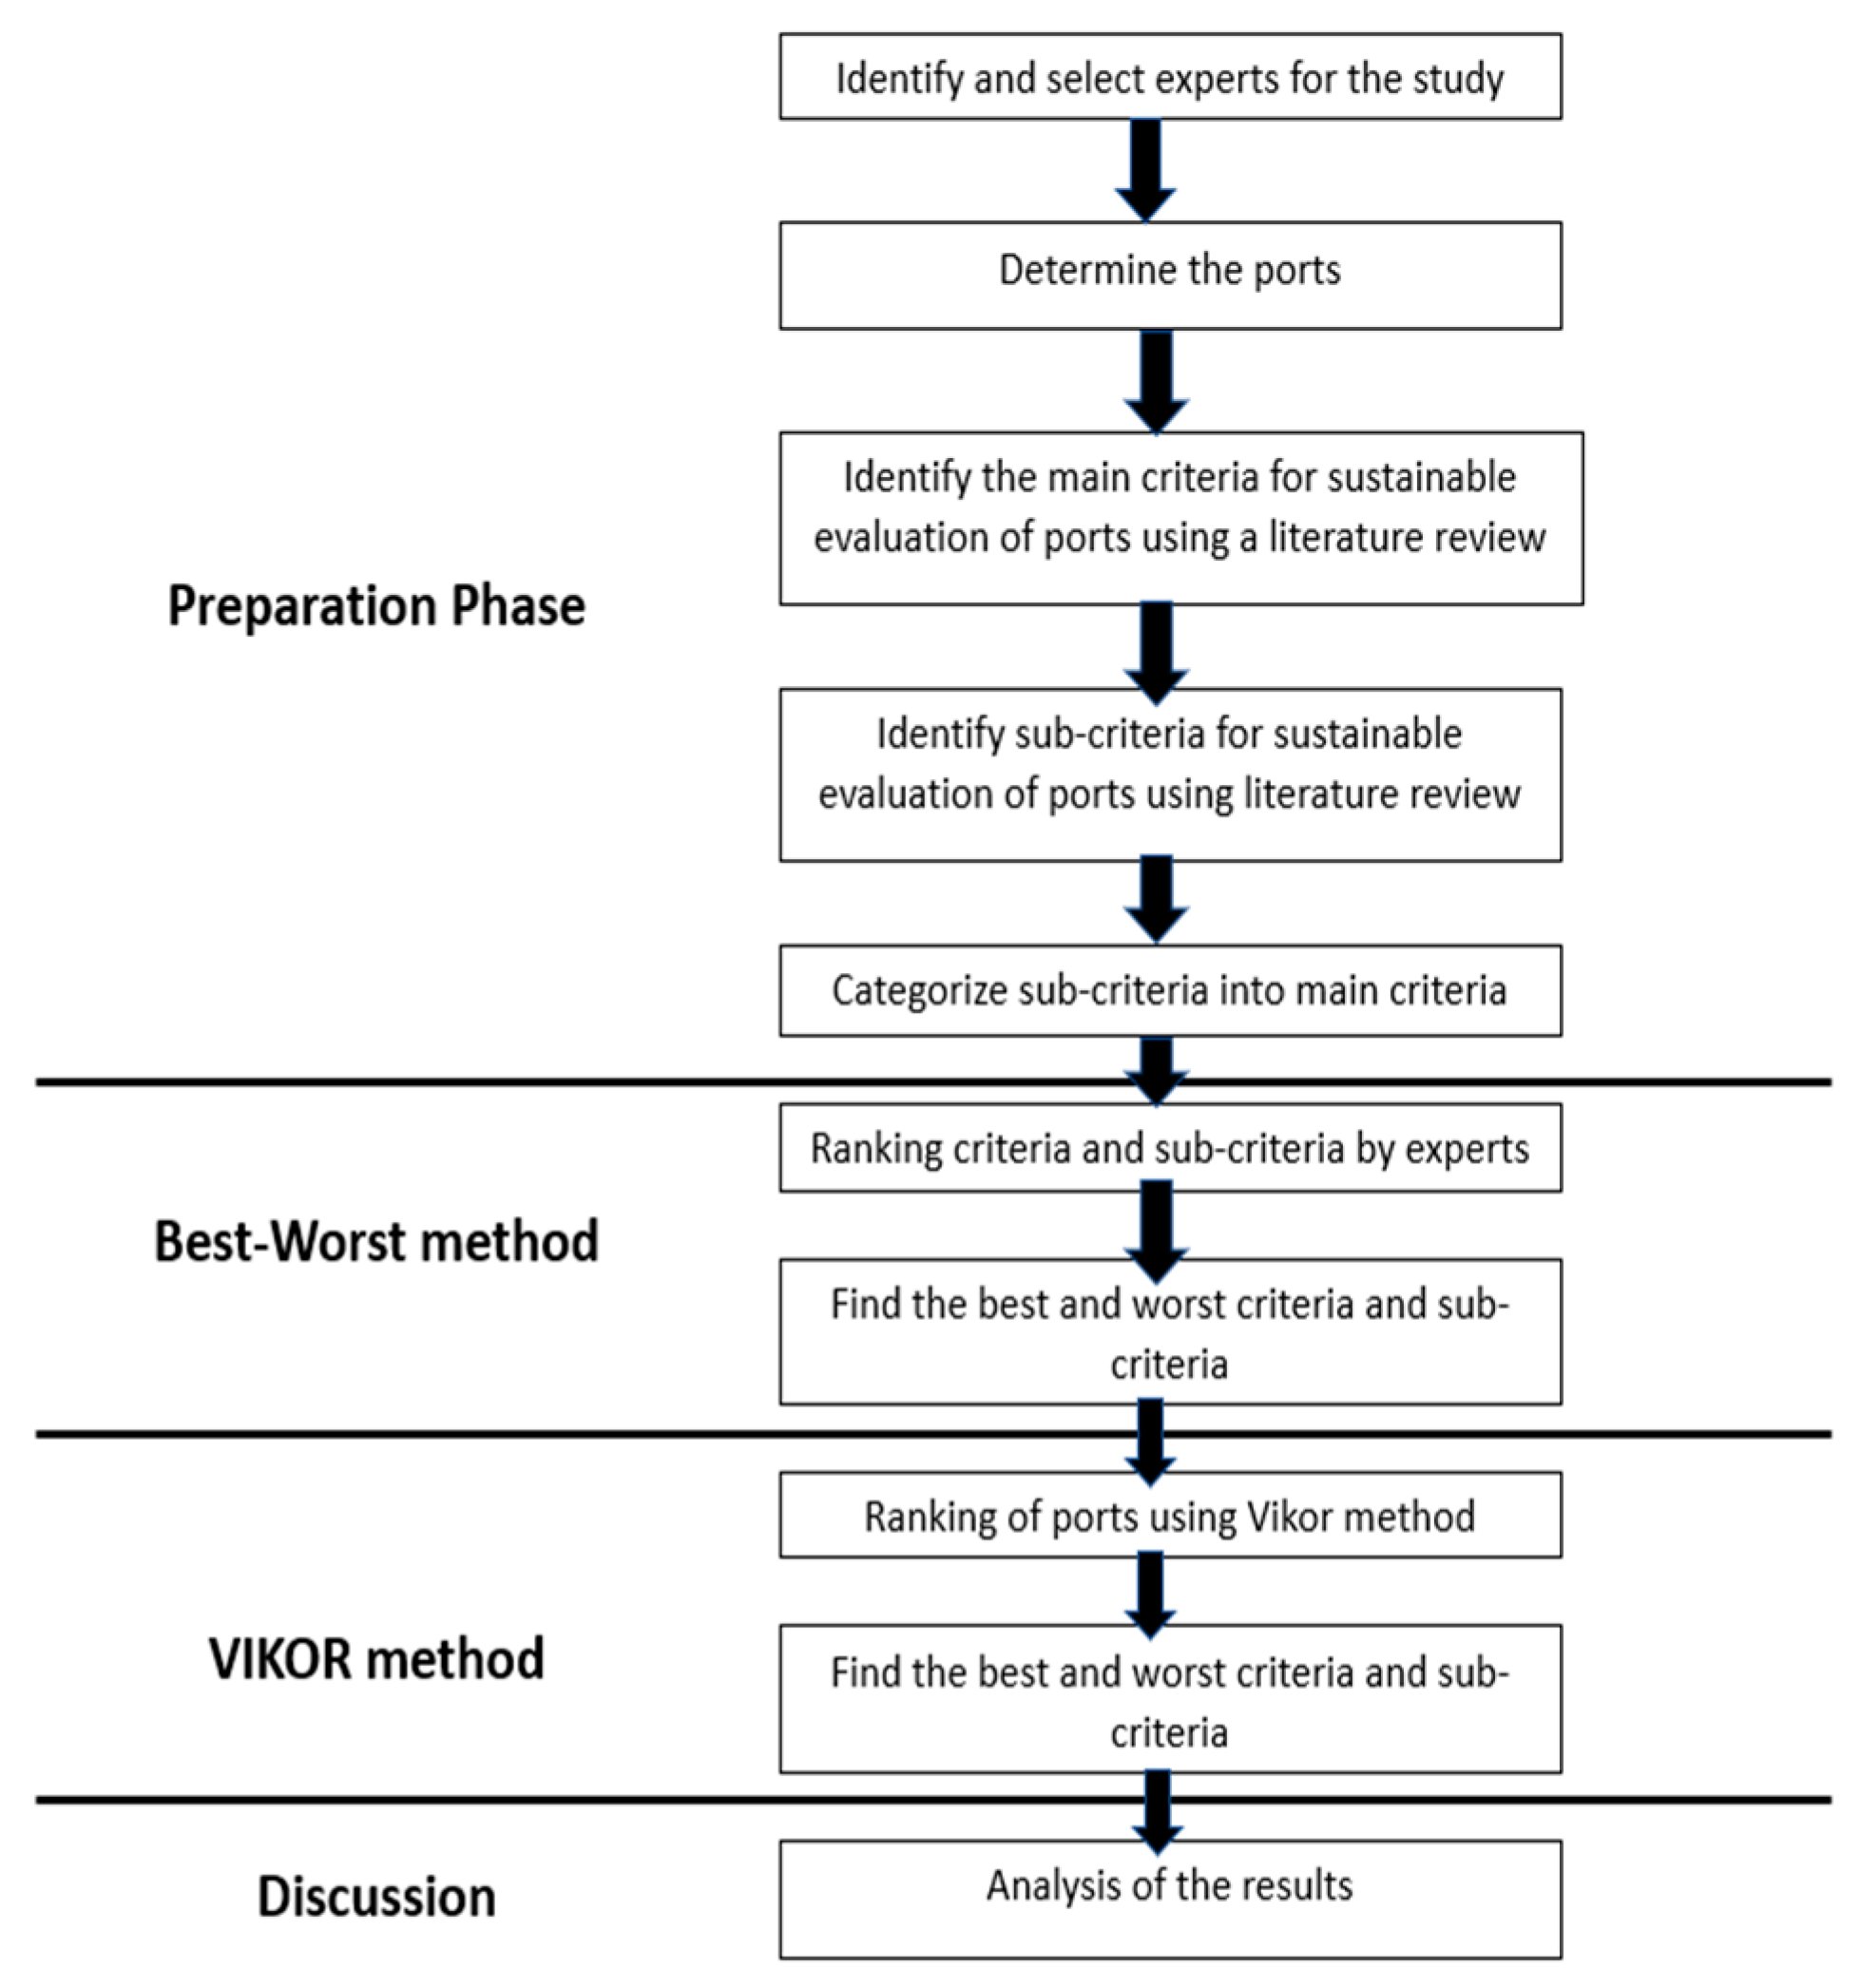
3. Methodology
3.1. Case Studies/Identification of Ports—Experts
- Primarily support local and regional trade rather than functioning as global mega-hubs like Piraeus or Valencia;
- Cater to passenger ferries, fishing activities, and limited cargo operations, which are typical of island ports;
- Hold strategic or tourism significance;
- Boast a notable historical heritage.
3.1.1. Port of Souda, Chania (CHA)
3.1.2. Port of Heraklion (HΕR)
3.1.3. Port of Rethymnon (RET)
3.1.4. Port of Sitia (SIT)
3.2. Survey Analysis
3.3. BWM and VIKOR Methods
3.3.1. Best Worst Method (BWM)
3.3.2. VIKOR Analysis
4. Results
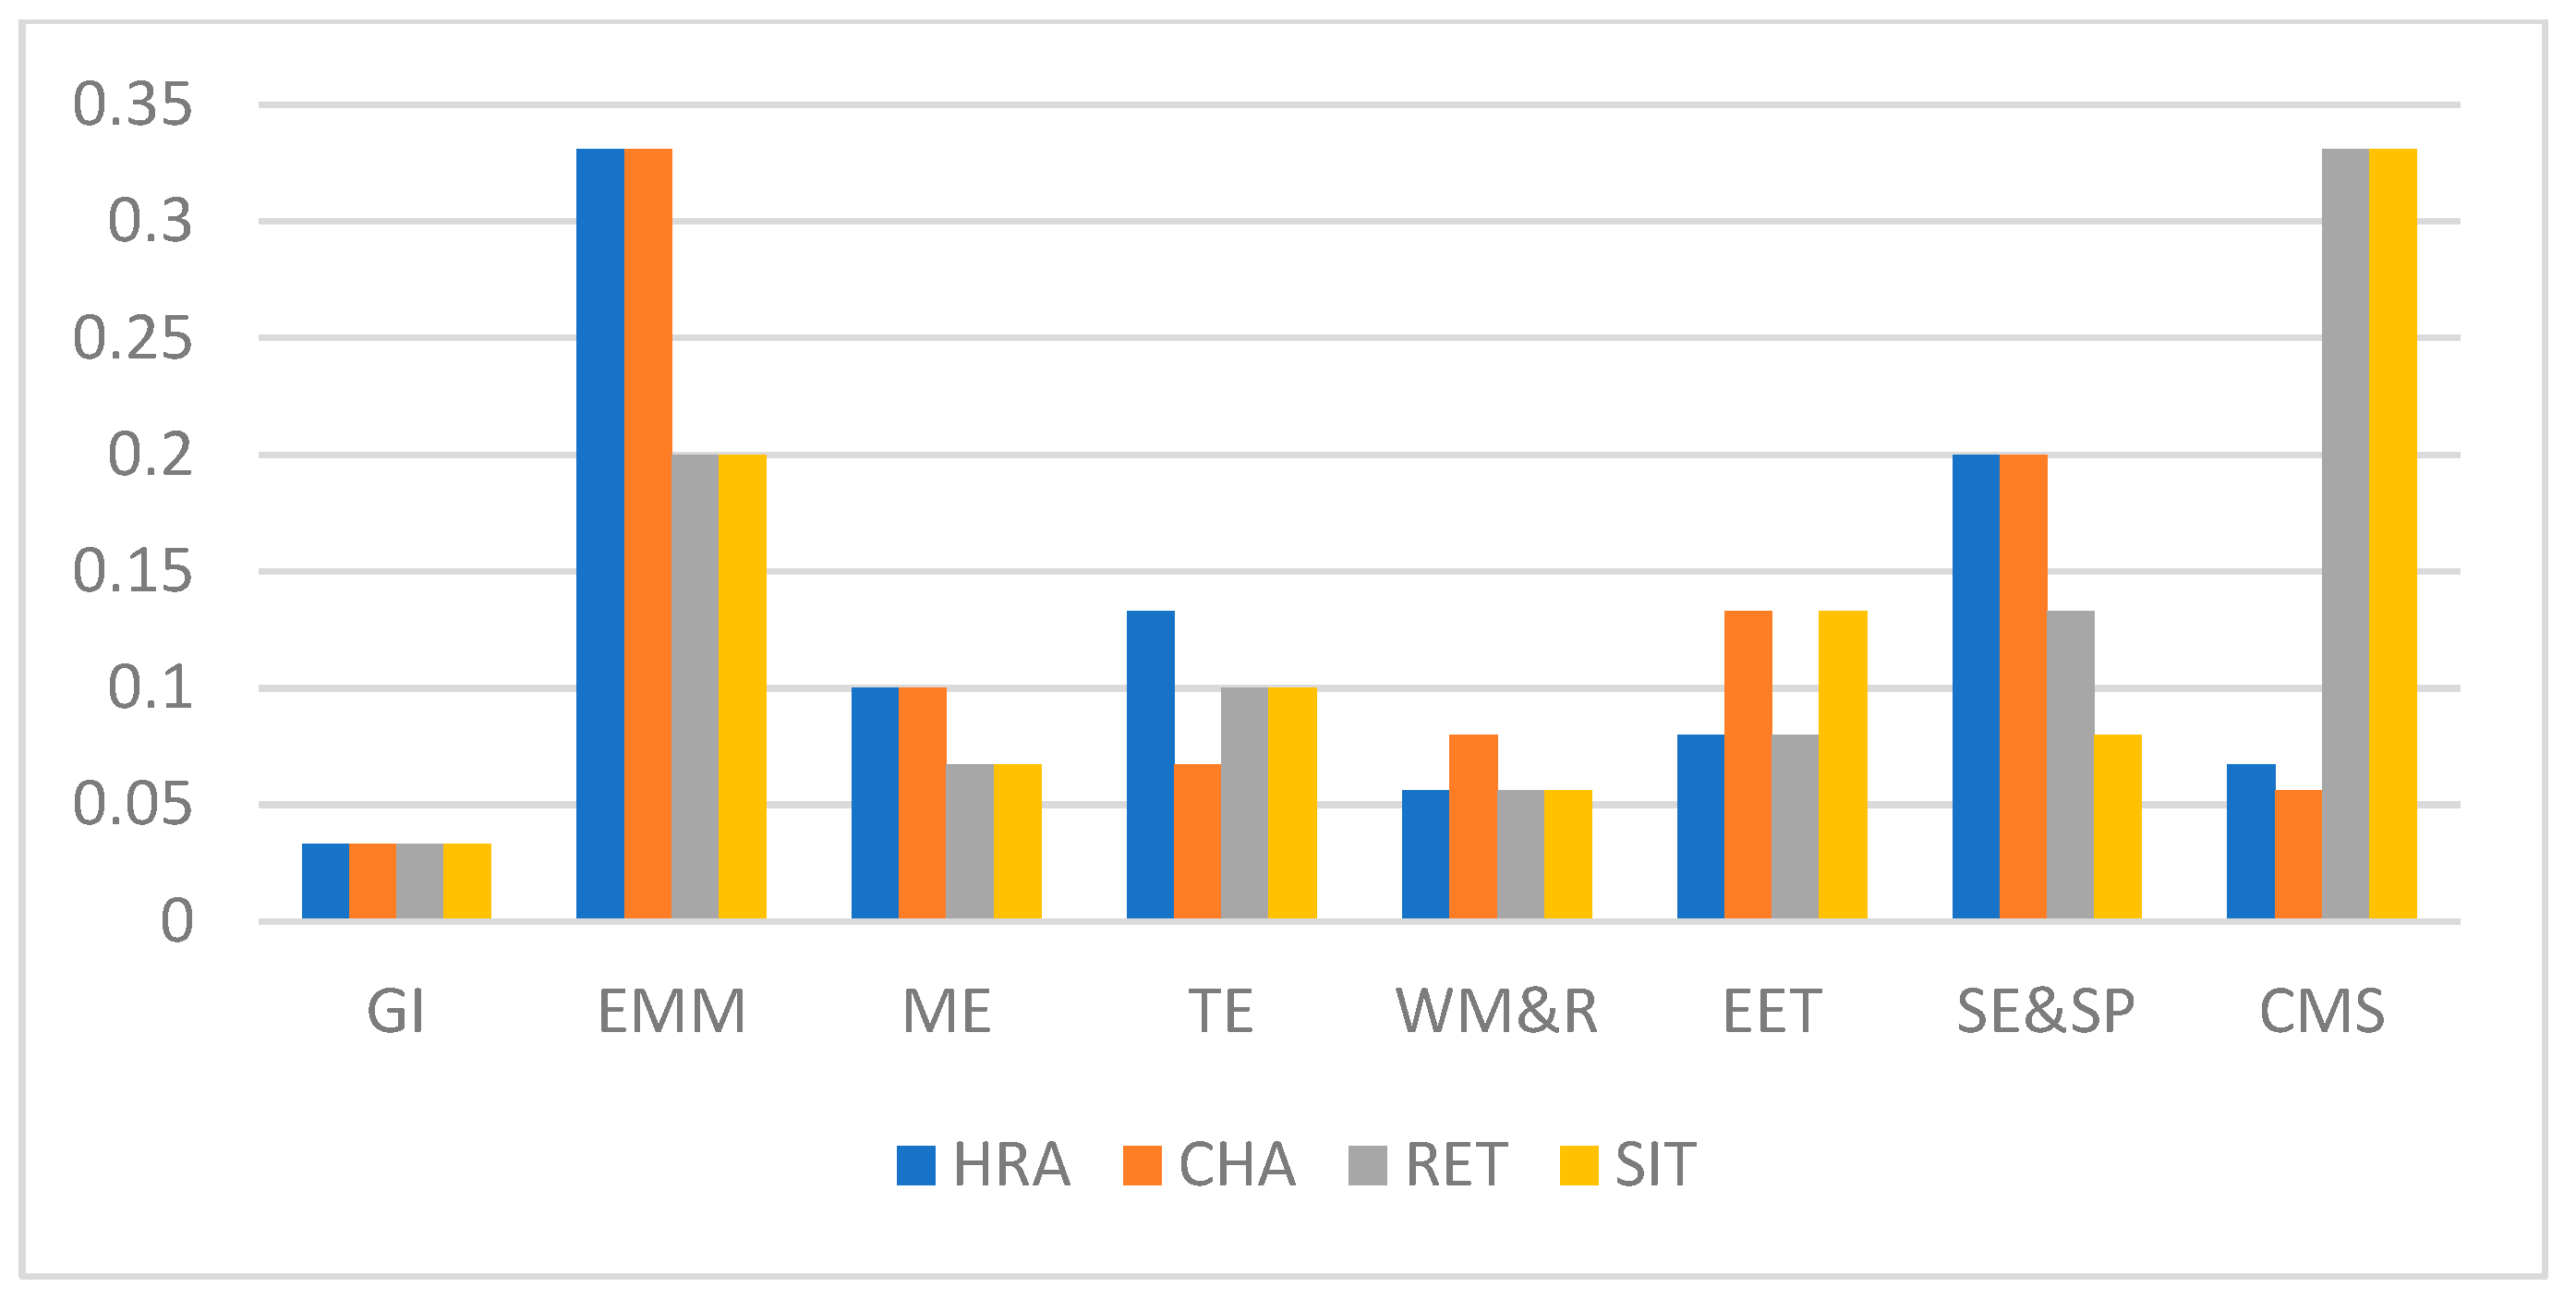
4.1. Best Worst Method
4.2. Ports Assessed Using the VIKOR Method
5. Discussion
6. Conclusions
Author Contributions
Funding
Institutional Review Board Statement
Informed Consent Statement
Data Availability Statement
Acknowledgments
Conflicts of Interest
Abbreviations
| BWM | Best Worst Method |
| CE | Circular Economy |
| CHA | Port of Souda, Chania |
| CMS | Competitiveness |
| EET | Training of employees in environmentally responsible practices |
| EMM | Environmental Monitoring and Management |
| GI | Green Infrastructure |
| HΕR | Port of Heraklion |
| ME | Management of energy |
| RET | Port of Rethymnon |
| SDGs | Sustainable Development Goals |
| SE&SP | Security of Employment and Social Protection |
| SIT | Port of Sitia |
| SMSPs | Small- and medium-sized ports |
| TE | Technology |
| VIKOR | VlseKriterijumska Optimizacija I Kompromisno Resenje |
| UN | United Nations |
| WM&R | Waste Management and Recycling |
Appendix A
| Main Indicators | Weights of Main Indicators | Sub Indicators | Weights of Sub-Indicators | Global Weights | Ranking |
|---|---|---|---|---|---|
| GI | 0.033 | GI 1 | 0.12 | 0.004 | 40 |
| GI 2 | 0.288 | 0.01 | 30 | ||
| GI 3 | 0.128 | 0.004 | 39 | ||
| GI 4 | 0.176 | 0.005 | 36 | ||
| GI 5 | 0.288 | 0.01 | 29 | ||
| EMM | 0.331 | EMM 1 | 0.08 | 0.026 | 14 |
| EMM 2 | 0.158 | 0.052 | 4 | ||
| EMM 3 | 0.136 | 0.045 | 6 | ||
| EMM 4 | 0.41 | 0.136 | 1 | ||
| EMM 5 | 0.216 | 0.072 | 3 | ||
| ME | 0.1 | ME 1 | 0.188 | 0.019 | 17 |
| ME 2 | 0.41 | 0.041 | 7 | ||
| ME 3 | 0.18 | 0.018 | 19 | ||
| ME 4 | 0.11 | 0.011 | 27 | ||
| ME 5 | 0.112 | 0.011 | 26 | ||
| TE | 0.067 | TE 1 | 0.128 | 0.009 | 32 |
| TE 2 | 0.208 | 0.014 | 23 | ||
| TE 3 | 0.174 | 0.012 | 25 | ||
| TE 4 | 0.08 | 0.005 | 38 | ||
| TE 5 | 0.41 | 0.027 | 12 | ||
| WM&R | 0.08 | WM&R 1 | 0.096 | 0.008 | 34 |
| WM&R 2 | 0.186 | 0.015 | 22 | ||
| WM&R 3 | 0.18 | 0.014 | 24 | ||
| WM&R 4 | 0.128 | 0.01 | 31 | ||
| WM&R 5 | 0.41 | 0.033 | 11 | ||
| EET | 0.133 | EET 1 | 0.338 | 0.045 | 5 |
| EET 2 | 0.16 | 0.021 | 15 | ||
| EET 3 | 0.12 | 0.016 | 21 | ||
| EET 4 | 0.08 | 0.011 | 28 | ||
| EET 5 | 0.302 | 0.04 | 8 | ||
| SE&SP | 0.2 | SE&SP 1 | 0.188 | 0.037 | 9 |
| SE&SP 2 | 0.136 | 0.027 | 13 | ||
| SE&SP 3 | 0.088 | 0.018 | 18 | ||
| SE&SP 4 | 0.41 | 0.082 | 2 | ||
| SE&SP 5 | 0.178 | 0.036 | 10 | ||
| CMS | 0.056 | CMS 1 | 0.338 | 0.019 | 16 |
| CMS 2 | 0.12 | 0.007 | 35 | ||
| CMS 3 | 0.302 | 0.017 | 20 | ||
| CMS 4 | 0.096 | 0.005 | 37 | ||
| CMS 5 | 0.144 | 0.008 | 33 |
| Main Indicators | Weights of Main Indicators | Sub Indicators | Weights of Sub-Indicators | Global Weights | Ranking |
|---|---|---|---|---|---|
| GI | 0.033 | GI 1 | 0.324 | 0.011 | 25 |
| GI 2 | 0.252 | 0.008 | 33 | ||
| GI 3 | 0.096 | 0.003 | 40 | ||
| GI 4 | 0.136 | 0.005 | 38 | ||
| GI 5 | 0.192 | 0.006 | 34 | ||
| EMM | 0.2 | EMM 1 | 0.23 | 0.046 | 6 |
| EMM 2 | 0.12 | 0.024 | 15 | ||
| EMM 3 | 0.112 | 0.022 | 18 | ||
| EMM 4 | 0.41 | 0.082 | 2 | ||
| EMM 5 | 0.128 | 0.026 | 13 | ||
| ME | 0.067 | ME 1 | 0.166 | 0.011 | 26 |
| ME 2 | 0.338 | 0.023 | 16 | ||
| ME 3 | 0.138 | 0.009 | 32 | ||
| ME 4 | 0.08 | 0.005 | 39 | ||
| ME 5 | 0.28 | 0.019 | 21 | ||
| TE | 0.1 | ANC 1 | 0.112 | 0.011 | 27 |
| ANC 2 | 0.252 | 0.025 | 14 | ||
| ANC 3 | 0.266 | 0.027 | 12 | ||
| ANC 4 | 0.096 | 0.01 | 29 | ||
| ANC 5 | 0.274 | 0.027 | 11 | ||
| WM&R | 0.056 | WM&R 1 | 0.112 | 0.006 | 35 |
| WM&R 2 | 0.15 | 0.009 | 31 | ||
| WM&R 3 | 0.252 | 0.014 | 23 | ||
| WM&R 4 | 0.112 | 0.006 | 36 | ||
| WM&R 5 | 0.374 | 0.021 | 19 | ||
| EET | 0.08 | EET 1 | 0.08 | 0.006 | 37 |
| EET 2 | 0.12 | 0.01 | 28 | ||
| EET 3 | 0.174 | 0.014 | 24 | ||
| EET 4 | 0.266 | 0.021 | 20 | ||
| EET 5 | 0.36 | 0.029 | 10 | ||
| SE&SP | 0.133 | SE&SP 1 | 0.374 | 0.05 | 5 |
| SE&SP 2 | 0.174 | 0.023 | 17 | ||
| SE&SP 3 | 0.142 | 0.019 | 22 | ||
| SE&SP 4 | 0.23 | 0.031 | 9 | ||
| SE&SP 5 | 0.08 | 0.01 | 30 | ||
| CMS | 0.331 | CMS 1 | 0.41 | 0.136 | 1 |
| CMS 2 | 0.216 | 0.071 | 3 | ||
| CMS 3 | 0.104 | 0.034 | 8 | ||
| CMS 4 | 0.112 | 0.037 | 7 | ||
| CMS 5 | 0.158 | 0.053 | 4 |
| Main Indicators | Weights of Main Indicators | Sub Indicators | Weights of Sub Indicators | Global Weights | Ranking |
|---|---|---|---|---|---|
| GI | 0.033 | GI 1 | 0.288 | 0.009 | 33 |
| GI 2 | 0.338 | 0.011 | 25 | ||
| GI 3 | 0.08 | 0.003 | 40 | ||
| GI 4 | 0.12 | 0.004 | 39 | ||
| GI 5 | 0.174 | 0.006 | 26 | ||
| EMM | 0.2 | EMM 1 | 0.238 | 0.048 | 6 |
| EMM 2 | 0.142 | 0.028 | 12 | ||
| EMM 3 | 0.08 | 0.016 | 21 | ||
| EMM 4 | 0.374 | 0.075 | 3 | ||
| EMM 5 | 0.166 | 0.033 | 8 | ||
| ME | 0.067 | ME 1 | 0.18 | 0.012 | 23 |
| ME 2 | 0.41 | 0.027 | 13 | ||
| ME 3 | 0.172 | 0.012 | 24 | ||
| ME 4 | 0.08 | 0.005 | 38 | ||
| ME 5 | 0.158 | 0.011 | 27 | ||
| TE | 0.1 | TE 1 | 0.104 | 0.011 | 30 |
| TE 2 | 0.252 | 0.025 | 15 | ||
| TE 3 | 0.294 | 0.029 | 10 | ||
| TE 4 | 0.112 | 0.011 | 29 | ||
| TE 5 | 0.238 | 0.024 | 17 | ||
| WM&R | 0.056 | WM&R 1 | 0.088 | 0.005 | 37 |
| WM&R 2 | 0.142 | 0.008 | 35 | ||
| WM&R 3 | 0.202 | 0.011 | 26 | ||
| WM&R 4 | 0.158 | 0.023 | 34 | ||
| WM&R 5 | 0.41 | 0.056 | 18 | ||
| EET | 0.133 | EET 1 | 0.374 | 0.05 | 5 |
| EET 2 | 0.238 | 0.031 | 9 | ||
| EET 3 | 0.12 | 0.016 | 20 | ||
| EET 4 | 0.08 | 0.011 | 31 | ||
| EET 5 | 0.188 | 0.025 | 16 | ||
| SE&SP | 0.08 | SE&SP 1 | 0.18 | 0.015 | 22 |
| SE&SP 2 | 0.128 | 0.01 | 32 | ||
| SE&SP 3 | 0.228 | 0.018 | 19 | ||
| SE&SP 4 | 0.324 | 0.026 | 14 | ||
| SE&SP 5 | 0.14 | 0.011 | 28 | ||
| CMS | 0.331 | CMS 1 | 0.374 | 0.124 | 1 |
| CMS 2 | 0.088 | 0.029 | 11 | ||
| CMS 3 | 0.128 | 0.042 | 7 | ||
| CMS 4 | 0.23 | 0.076 | 2 | ||
| CMS 5 | 0.18 | 0.06 | 4 |
References
- Balcombe, P.; Brierley, J.; Lewis, C.; Skatvedt, L.; Speirs, J.; Hawkes, A.; Staffell, I. How to Decarbonise International Shipping: Options for Fuels, Technologies and Policies. Energy Convers. Manag. 2019, 182, 72–88. [Google Scholar] [CrossRef]
- Yang, Y.; Liu, W. Resilience Analysis of Maritime Silk Road Shipping Network Structure under Disruption Simulation. J. Mar. Sci. Eng. 2022, 10, 617. [Google Scholar] [CrossRef]
- Li, J.; Zhao, H.; Xu, B. Optimization of Container Shipping Network Reconfiguration under RCEP. J. Mar. Sci. Eng. 2022, 10, 873. [Google Scholar] [CrossRef]
- Nisiforou, O.; Shakou, L.M.; Magou, A.; Charalambides, A.G. A Roadmap towards the Decarbonization of Shipping: A Participatory Approach in Cyprus. Sustainability 2022, 14, 2185. [Google Scholar] [CrossRef]
- Kishore, L.; Pai, Y.P.; Shanbhag, P. Reliability and Validity Assessment of Instrument to Measure Sustainability Practices at Shipping Ports in India. Discov. Sustain. 2024, 5, 236. [Google Scholar] [CrossRef]
- Xue, Y.; Lai, K.H. Responsible Shipping for Sustainable Development: Adoption and Performance Value. Transp. Policy 2023, 130, 89–99. [Google Scholar] [CrossRef]
- López-Bermúdez, B.; Freire-Seoane, M.J.; Lesta-Casal, E. Core and Comprehensive Ports: The New Challenge for the Development of the Spanish Port System. Transp. Res. Interdiscip. Perspect. 2020, 8, 100243. [Google Scholar] [CrossRef]
- Xia, M.; Chen, J.; Zhang, P.; Peng, P.; Claramunt, C. Spatial Structure and Vulnerability of Container Shipping Networks: A Case Study in the Beibu Gulf Sea Area. J. Mar. Sci. Eng. 2024, 12, 1307. [Google Scholar] [CrossRef]
- Chen, J.; Chang, S.; Zhang, P.; Chen, Q.; Peng, P.; Claramunt, C. A Critical Examination for Widespread Usage of Shipping Big Data Analytics in China. J. Mar. Sci. Eng. 2022, 10, 2009. [Google Scholar] [CrossRef]
- Brunila, O.P.; Kunnaala-Hyrkki, V.; Inkinen, T. Sustainable Small Ports: Performance Assessment Tool for Management, Responsibility, Impact, and Self-Monitoring. J. Shipp. Trade 2023, 8, 14. [Google Scholar] [CrossRef]
- Yuan, X.; He, X. Enhancement Strategy for Port Resilience: Shipping Route Optimization Methods Based on Network Characteristics of Ports. J. Mar. Sci. Eng. 2025, 13, 325. [Google Scholar] [CrossRef]
- León-Mateos, F.; Sartal, A.; López-Manuel, L.; Quintás, M.A. Adapting Our Sea Ports to the Challenges of Climate Change: Development and Validation of a Port Resilience Index. Mar. Policy 2021, 130, 104573. [Google Scholar] [CrossRef]
- Oloruntobi, O.; Mokhtar, K.; Gohari, A.; Asif, S.; Chuah, L.F. Sustainable Transition towards Greener and Cleaner Seaborne Shipping Industry: Challenges and Opportunities. Clean Eng. Technol. 2023, 13. [Google Scholar] [CrossRef]
- Kong, Y.; Liu, J. Sustainable Port Cities with Coupling Coordination and Environmental Efficiency. Ocean. Coast. Manag. 2021, 205, 105534. [Google Scholar] [CrossRef]
- Schipper, C.A.; Vreugdenhil, H.; de Jong, M.P.C. A Sustainability Assessment of Ports and Port-City Plans: Comparing Ambitions with Achievements. Transp. Res. Part D Transp. Environ. 2017, 57, 84–111. [Google Scholar] [CrossRef]
- El-Refaei, A.; Idris, A.O. Towards a Port Demand Management (PDM) System: An Analytic Hierarchy Process (AHP)-Based Approach. Case Stud. Transp. Policy 2025, 19, 101361. [Google Scholar] [CrossRef]
- Yang, S.; Pan, Y.; Zeng, S. Decision Making Framework Based Fermatean Fuzzy Integrated Weighted Distance and TOPSIS for Green Low-Carbon Port Evaluation. Eng. Appl. Artif. Intell. 2022, 114, 105048. [Google Scholar] [CrossRef]
- Oh, H.; Lee, S.W.; Seo, Y.J. The Evaluation of Seaport Sustainability: The Case of South Korea. Ocean. Coast. Manag. 2018, 161, 50–56. [Google Scholar] [CrossRef]
- Lim, S.; Pettit, S.; Abouarghoub, W.; Beresford, A. Port Sustainability and Performance: A Systematic Literature Review. Transp. Res. Part D Transp. Environ. 2019, 72, 47–64. [Google Scholar] [CrossRef]
- Roos, E.C.; Kliemann Neto, F.J. Tools for Evaluating Environmental Performance at Brazilian Public Ports: Analysis and Proposal. Mar. Pollut. Bull. 2017, 115, 211–216. [Google Scholar] [CrossRef]
- Tovar, B.; Hernández, R.; Rodríguez-Déniz, H. Container Port Competitiveness and Connectivity: The Canary Islands Main Ports Case. Transp. Policy 2015, 38, 40–51. [Google Scholar] [CrossRef]
- Liu, Q.; Yang, Y.; Ng, A.K.Y.; Jiang, C. An Analysis on the Resilience of the European Port Network. Transp. Res. Part A Policy Pract. 2023, 175, 103778. [Google Scholar] [CrossRef]
- Puig, M.; Wooldridge, C.; Darbra, R.M. Identification and Selection of Environmental Performance Indicators for Sustainable Port Development. Mar. Pollut. Bull. 2014, 81, 124–130. [Google Scholar] [CrossRef] [PubMed]
- Puig, M.; Raptis, S.; Wooldridge, C.; Darbra, R.M. Performance Trends of Environmental Management in European Ports. Mar. Pollut. Bull. 2020, 160, 111686. [Google Scholar] [CrossRef]
- Faut, L.; Soyeur, F.; Haezendonck, E.; Dooms, M.; de Langen, P.W. Ensuring Circular Strategy Implementation: The Development of Circular Economy Indicators for Ports. Marit. Transp. Res. 2023, 4, 100087. [Google Scholar] [CrossRef]
- Haezendonck, E.; Van Den Berghe, K. Patterns of Circular Transition: What Is the Circular Economy Maturity of Belgian Ports? Sustainability 2020, 12, 9269. [Google Scholar] [CrossRef]
- Balić, K.; Žgaljić, D.; Ukić Boljat, H.; Slišković, M. The Port System in Addressing Sustainability Issues—A Systematic Review of Research. J. Mar. Sci. Eng. 2022, 10, 1048. [Google Scholar] [CrossRef]
- Shen, J.; Ren, X.; Feng, Z.; Nie, J. The Impact of Public Environmental Concerns on Port Sustainability: Evidence from 44 Port Cities in China. Front. Mar. Sci. 2024, 11. [Google Scholar] [CrossRef]
- Argyriou, I.; Tsoutsos, T. Sustainable Solutions for Small/Medium Ports a Guide to Efficient and Effective Planning. J. Mar. Sci. Eng. 2023, 11, 1763. [Google Scholar] [CrossRef]
- Gerlitz, L.; Meyer, C. Small and Medium-sized Ports in the Ten-t Network and Nexus of Europe’s Twin Transition: The Way towards Sustainable and Digital Port Service Ecosystems. Sustainability 2021, 13, 4386. [Google Scholar] [CrossRef]
- Muangpan, T.; Suthiwartnarueput, K. Key Performance Indicators of Sustainable Port: Case Study of the Eastern Economic Corridor in Thailand. Cogent Bus. Manag. 2019, 6, 1603275. [Google Scholar] [CrossRef]
- Caliskan, A. Seaports Participation in Enhancing the Sustainable Development Goals. J. Clean. Prod. 2022, 379, 134715. [Google Scholar] [CrossRef]
- Fonseca, L.; Carvalho, F. The Reporting of SDGs by Quality, Environmental, and Occupational Health and Safety-Certified Organizations. Sustainability 2019, 11, 5797. [Google Scholar] [CrossRef]
- Recuero Virto, L. A Preliminary Assessment of the Indicators for Sustainable Development Goal (SDG) 14 “Conserve and Sustainably Use the Oceans, Seas and Marine Resources for Sustainable Development”. Mar. Policy 2018, 98, 47–57. [Google Scholar] [CrossRef]
- Zuccotto, M.; Castellini, A.; La Torre, D.; Mola, L.; Farinelli, A. Reinforcement Learning Applications in Environmental Sustainability: A Review. Artif. Intell. Rev. 2024, 57, 88. [Google Scholar] [CrossRef]
- Curtin, R.; McCullough, N. The Socioeconomic Impact of the Seafood Sector at Ireland’s Main Ports. Mar. Policy 2023, 152, 105627. [Google Scholar] [CrossRef]
- Moeremans, B.; Dooms, M. Social License to Operate: Factors Determining Social Acceptance among Local Port Community Stakeholders. Marit. Econ. Logist. 2024, 27, 183–210. [Google Scholar] [CrossRef]
- Henríquez, R.; Martínez de Osés, F.X.; Martínez Marín, J.E. Technological Drivers of Seaports’ Business Model Innovation: An Exploratory Case Study on the Port of Barcelona. Res. Transp. Bus. Manag. 2022, 43, 100803. [Google Scholar] [CrossRef]
- Alamoush, A.S.; Ballini, F.; Ölçer, A.I. Revisiting Port Sustainability as a Foundation for the Implementation of the United Nations Sustainable Development Goals (UN SDGs). J. Shipp. Trade 2021, 6, 1–40. [Google Scholar] [CrossRef]
- Twrdy, E.; Zanne, M. Improvement of the Sustainability of Ports Logistics by the Development of Innovative Green Infrastructure Solutions. Transp. Res. Procedia 2020, 45, 539–546. [Google Scholar] [CrossRef]
- Brunila, O.P.; Kunnaala-Hyrkki, V.; Inkinen, T. Hindrances in Port Digitalization? Identifying Problems in Adoption and Implementation. Eur. Transp. Res. Rev. 2021, 13, 62. [Google Scholar] [CrossRef]
- Cammin, P.; Yu, J.; Heilig, L.; Voß, S. Monitoring of Air Emissions in Maritime Ports. Transp. Res. Part D Transp. Environ. 2020, 87, 102479. [Google Scholar] [CrossRef]
- Nwagu, C.N.; Ujah, C.O.; Kallon, D.V.V.; Aigbodion, V.S. Integrating Solar and Wind Energy into the Electricity Grid for Improved Power Accessibility. Unconv. Resour. 2025, 5, 100129. [Google Scholar] [CrossRef]
- Buonomano, A.; Del Papa, G.; Giuzio, G.F.; Palombo, A.; Russo, G. Future Pathways for Decarbonization and Energy Efficiency of Ports: Modelling and Optimization as Sustainable Energy Hubs. J. Clean. Prod. 2023, 420, 138389. [Google Scholar] [CrossRef]
- Argyriou, I.; Daras, T.; Tsoutsos, T. Challenging a Sustainable Port. A Case Study of Souda Port, Chania, Crete. Case Stud. Transp. Policy 2022, 10, 2125–2137. [Google Scholar] [CrossRef]
- Alzate, P.; Isaza, G.A.; Toro, E.M.; Jaramillo-Garzón, J.A.; Hernandez, S.; Jurado, I.; Hernandez, D. Operational Efficiency and Sustainability in Smart Ports: A Comprehensive Review. Mar. Syst. Ocean. Technol. 2024, 19, 120–131. [Google Scholar] [CrossRef]
- Min, H. Developing a Smart Port Architecture and Essential Elements in the Era of Industry 4.0. Marit. Econ. Logist. 2022, 24, 189–207. [Google Scholar] [CrossRef]
- Yang, Y.C.; Hsieh, Y.H. The Critical Success Factors of Smart Port Digitalization Development in the Post-COVID-19 Era. Case Stud. Transp. Policy 2024, 17, 101231. [Google Scholar] [CrossRef]
- Olaniyi, E.O.; Solarte-Vasquez, M.C.; Inkinen, T. Smart Regulations in Maritime Governance: Efficacy, Gaps, and Stakeholder Perspectives. Mar. Pollut. Bull. 2024, 202, 116341. [Google Scholar] [CrossRef]
- Satta, G.; Vitellaro, F.; Njikatoufon, A.G.; Risitano, M. Green Strategies in Ports: A Stakeholder Management Perspective. Marit. Econ. Logist. 2024, 27, 96–122. [Google Scholar] [CrossRef]
- Nebot, N.; Rosa-Jiménez, C.; Pié Ninot, R.; Perea-Medina, B. Challenges for the Future of Ports. What Can Be Learnt from the Spanish Mediterranean Ports? Ocean. Coast. Manag. 2017, 137, 165–174. [Google Scholar] [CrossRef]
- Joseph, A.; Dalaklis, D. The International Convention for the Safety of Life at Sea: Highlighting Interrelations of Measures towards Effective Risk Mitigation. J. Int. Marit. Saf. Environ. Aff. Shipp. 2021, 5, 1–11. [Google Scholar] [CrossRef]
- Baştuğ, S.; Haralambides, H.; Esmer, S.; Eminoğlu, E. Port Competitiveness: Do Container Terminal Operators and Liner Shipping Companies See Eye to Eye? Mar. Policy 2022, 135, 104866. [Google Scholar] [CrossRef]
- Wei, Y. The Development of Green Building Technology. In IOP Conference Series: Earth and Environmental Science, Proceedings of the 3rd International Conference on Clean Energy and Electrical Systems (CEES 2021), Virtual, 2–4 April 2021; IOP Publishing Ltd: Bristol, UK, 2021; Volume 812. [Google Scholar]
- Pasaribu, D. Building Sustainability Through Port Integration: A Case Study PT Pelabuhan Indonesia. In IOP Conference Series: Earth and Environmental Science, Institute of Physics, Proceedings of the 2nd International Conference on Natural Resources and Sustainable Development (2nd ICNRSD 2022), Medan, Indonesia, 29 October 2022; IOP Publishing Ltd: Bristol, UK, 2023; Volume 1188. [Google Scholar]
- Samsudin, M.S.; Azid, A.; Razik, M.A.; Zaudi, M.A.; Shaharudin, S.M. Source of Apportionment of Air Quality Parameters at Federal Port of Malaysia with Emphasis on Ship Emission. In IOP Conference Series: Earth and Environmental Science, Proceedings of the Sriwijaya International Conference on Earth Science and Environmental Issue, Palembang, Indonesia, 21 October 2020; IOP Publishing Ltd: Bristol, UK, 2021; Volume 810. [Google Scholar]
- Ghennaï, A.; Madani, S.; Hein, C. Evaluating the Sustainability of Scenarios for Port City Development with Boussole21 Method. Environ. Syst. Decis. 2023, 43, 87–106. [Google Scholar] [CrossRef]
- Bjerkan, K.Y.; Seter, H. Reviewing Tools and Technologies for Sustainable Ports: Does Research Enable Decision Making in Ports? Transp. Res. Part D Transp. Environ. 2019, 72, 243–260. [Google Scholar] [CrossRef]
- Sifakis, N.; Tsoutsos, T. Nearly Zero Energy Ports: A Necessity or a Green Upgrade? In IOP Conference Series: Earth and Environmental Science, Institute of Physics, Proceedings of the Sustainability in the Built Environment for Climate Change Mitigation: SBE19 Thessaloniki, Thessaloniki, Greece, 23–25 October 2019; IOP Publishing Ltd: Bristol, UK, 2020; Volume 410. [Google Scholar]
- Belmoukari, B.; Audy, J.F.; Forget, P. Smart Port: A Systematic Literature Review. Eur. Transp. Res. Rev. 2023, 15, 4. [Google Scholar] [CrossRef]
- Ding, Y.; Zhang, Z.; Chen, K.; Ding, H.; Voss, S.; Heilig, L.; Chen, Y.; Chen, X. Real-Time Monitoring and Optimal Resource Allocation for Automated Container Terminals: A Digital Twin Application at the Yangshan Port. J. Adv. Transp. 2023, 2023, 6909801. [Google Scholar] [CrossRef]
- Martínez-López, A.; Ruiz-García, A.; Pérez, I. Social Cost Benefit Analysis of Port Handling Plans for Annex IV Waste of MARPOL: A Case Study in Las Palmas Port. Sustainability 2020, 12, 2382. [Google Scholar] [CrossRef]
- Clayton, C.A.; Walker, T.R.; Bezerra, J.C.; Adam, I. Policy Responses to Reduce Single-Use Plastic Marine Pollution in the Caribbean. Mar. Pollut. Bull. 2021, 162, 111833. [Google Scholar] [CrossRef]
- Amrutha, V.N.; Geetha, S.N. Linking Organizational Green Training and Voluntary Workplace Green Behavior: Mediating Role of Green Supporting Climate and Employees’ Green Satisfaction. J. Clean. Prod. 2021, 290, 125876. [Google Scholar] [CrossRef]
- Luo, M.; Chen, F.; Zhang, J. Relationships among Port Competition, Cooperation and Competitiveness: A Literature Review. Transp. Policy 2022, 118, 1–9. [Google Scholar] [CrossRef]
- Sas, M.; Reniers, G.L.L.; Hardyns, W.; Ponnet, K. The Impact of Training Sessions on Security Awareness: Measuring the Security Knowledge, Attitude and Behaviour of Employees. Chem. Eng. Trans. 2019, 77, 895–900. [Google Scholar] [CrossRef]
- Aneziris, O.; Koromila, I.; Nivolianitou, Z. A Systematic Literature Review on LNG Safety at Ports. Saf. Sci. 2020, 124, 104595. [Google Scholar] [CrossRef]
- Bottasso, A.; Conti, M.; Ferrari, C.; Merk, O.; Tei, A. The Impact of Port Throughput on Local Employment: Evidence from a Panel of European Regions. Transp. Policy 2013, 27, 32–38. [Google Scholar] [CrossRef]
- Gómez-Vega, M.; J Picazo-Tadeo, A. Ranking World Tourist Destinations with a Composite Indicator of Competitiveness: To Weigh or Not to Weigh? Tour. Manag. 2019, 72, 281–291. [Google Scholar] [CrossRef]
- Chatzinikolaou, E.; Arvanitidis, C. Status, Values and Present Threats in Heraklion Harbour (Crete, Greece). Reg. Stud. Mar. Sci. 2016, 8, 252–258. [Google Scholar] [CrossRef]
- Rezaei, J. Best-Worst Multi-Criteria Decision-Making Method: Some Properties and a Linear Model. Omega 2016, 64, 126–130. [Google Scholar] [CrossRef]
- Liang, X.; Chen, T.; Ye, M.; Lin, H.; Li, Z. A Hybrid Fuzzy BWM-VIKOR MCDM to Evaluate the Service Level of Bike-Sharing Companies: A Case Study from Chengdu, China. J. Clean. Prod. 2021, 298, 126759. [Google Scholar] [CrossRef]
- Hezer, S.; Gelmez, E.; Özceylan, E. Comparative Analysis of TOPSIS, VIKOR and COPRAS Methods for the COVID-19 Regional Safety Assessment. J. Infect. Public Health 2021, 14, 775–786. [Google Scholar] [CrossRef]
- Sugimura, Y.; Okada, T.; Kuwae, T.; Mito, Y.; Naito, R.; Nakagawa, Y. New Possibilities for Climate Change Countermeasures in Ports: Organic Carbon Containment and Creation of Blue Carbon Ecosystems through Beneficial Utilization of Dredged Soil. Mar. Policy 2022, 141, 105072. [Google Scholar] [CrossRef]
- Zhao, Z.; Tang, L. The Impact of COVID-19 on Maritime Pilots: Evidence and Lessons. Mar. Policy 2023, 153, 105664. [Google Scholar] [CrossRef] [PubMed]
- Ashrafi, M.; Walker, T.R.; Magnan, G.M.; Adams, M.; Acciaro, M. A Review of Corporate Sustainability Drivers in Maritime Ports: A Multi-Stakeholder Perspective. Marit. Policy Manag. 2020, 47, 1027–1044. [Google Scholar] [CrossRef]
- Barberi, S.; Sambito, M.; Neduzha, L.; Severino, A. Pollutant Emissions in Ports: A Comprehensive Review. Infrastructures 2021, 6, 114. [Google Scholar] [CrossRef]
- Hossain, T.; Adams, M.; Walker, T.R. Role of Sustainability in Global Seaports. Ocean. Coast. Manag. 2021, 202, 105435. [Google Scholar] [CrossRef]
| Shortcomings of Existing Research | Contribution of this Study |
|---|---|
| Limited focus on small- and medium-sized ports (SMSPs) Most studies focus on large ports, often neglecting SMSPs and their specific challenges | This study examines simplified methods to bridge the gap by focusing exclusively on SMSPs, offering tailored sustainability indicators that address the unique operational and resource constraints of smaller ports. |
| Lack of regional analysis Existing studies do not adequately consider regional differences in sustainability priorities, such as geographic, economic, and regulatory variations. | This study addresses regional differences by analyzing SMSPs in the Mediterranean, testing them in Crete, highlighting how environmental conservation and local economic development shape sustainability practices. |
| Inconsistent applicability of sustainability indicators Many studies propose indicators without considering their applicability to SMSPs, which may operate under different constraints. | According to the authors, this study develops regionally adaptive indicators tailored to the specific socio-economic and environmental conditions of SMSPs, ensuring relevance and practical applicability. |
| Use of complex methodologies not suited for SMSPs Some studies employ complex MCDM methods such as AHP and TOPSIS, which may not be ideal for smaller ports with limited resources. | This study employs simplified yet effective decision-making tools (BWM and VIKOR) to evaluate sustainability indicators, which are more suitable for SMSPs’ limited resources and capabilities. |
| Limited integration of social and economic dimensions Previous studies often emphasize environmental indicators, overlooking the social and economic aspects of sustainability. | This study integrates social and economic indicators, such as employment security and competitiveness, reflecting the critical importance of these dimensions in SMSPs. |
| VIKOR Technique Scale | |
|---|---|
| Significant Scale | Grade |
| Extremely significant | 1 |
| Very strong significant | 2 |
| Strongly significant | 3 |
| Significant | 4 |
| Low significant | 5 |
| Main Indicators | Selected as the Best Sub-Indicator by Experts | Chosen as the Worst Sub-Indicator by Experts | Main Indicators | Selected as the Best Sub-Indicator by Experts | Chosen as the Worst Sub-Indicator by Experts |
|---|---|---|---|---|---|
| GI | WM&R | ||||
| GI 1 | 1 | WM&R 1 | 3 | ||
| GI 2 | 3 | WM&R 2 | 1 | ||
| GI 3 | 1 | WM&R 3 | |||
| GI 4 | WM&R 4 | 1 | |||
| GI 5 | 5 | WM&R 5 | 5 | ||
| EMM | EET | ||||
| EMM1 | 2 | EET 1 | 3 | ||
| EMM2 | EET 2 | ||||
| EMM3 | 3 | EET 3 | |||
| EMM4 | EET 4 | 5 | |||
| EMM5 | 5 | EET 5 | 2 | ||
| ME | SE&SP | ||||
| ME 1 | SE&SP 1 | ||||
| ME 2 | 5 | SE&SP 2 | |||
| ME 3 | SE&SP 3 | ||||
| ME 4 | SE&SP 4 | 5 | |||
| ME 5 | 5 | SE&SP 5 | 5 | ||
| TE | CMS | ||||
| TE 1 | 2 | CMS 1 | 2 | ||
| TE 2 | CMS 2 | 1 | |||
| TE 3 | CMS 3 | 2 | |||
| TE 4 | 3 | CMS 4 | 3 | ||
| TE 5 | 5 | CMS 5 | 2 |
| Main Indicators | Weights of Main Indicators | Sub Indicators | Weights of Sub-Indicators | Global Weights | Ranking |
|---|---|---|---|---|---|
| GI | 0.033 | GI 1 | 0.356 | 0.004 | 39 |
| GI 2 | 0.189 | 0.007 | 33 | ||
| GI 3 | 0.081 | 0.003 | 40 | ||
| GI 4 | 0.158 | 0.005 | 38 | ||
| GI 5 | 0.217 | 0.014 | 25 | ||
| EMM | 0.331 | EMM 1 | 0.172 | 0.037 | 9 |
| EMM 2 | 0.133 | 0.05 | 5 | ||
| EMM 3 | 0.16 | 0.032 | 10 | ||
| EMM 4 | 0.38 | 0.136 | 1 | ||
| EMM 5 | 0.165 | 0.076 | 3 | ||
| ME | 0.1 | ME 1 | 0.134 | 0.019 | 19 |
| ME 2 | 0.416 | 0.041 | 6 | ||
| ME 3 | 0.188 | 0.017 | 20 | ||
| ME 4 | 0.158 | 0.015 | 23 | ||
| ME 5 | 0.106 | 0.008 | 32 | ||
| TE | 0.133 | TE 1 | 0.168 | 0.014 | 24 |
| TE 2 | 0.275 | 0.025 | 13 | ||
| TE 3 | 0.174 | 0.027 | 12 | ||
| TE 4 | 0.098 | 0.013 | 27 | ||
| TE 5 | 0.284 | 0.054 | 4 | ||
| WM&R | 0.056 | WM&R 1 | 0.203 | 0.006 | 37 |
| WM&R 2 | 0.208 | 0.008 | 31 | ||
| WM&R 3 | 0.126 | 0.011 | 28 | ||
| WM&R 4 | 0.114 | 0.008 | 30 | ||
| WM&R 5 | 0.347 | 0.023 | 15 | ||
| EET | 0.08 | EET 1 | 0.185 | 0.027 | 11 |
| EET 2 | 0.201 | 0.014 | 26 | ||
| EET 3 | 0.131 | 0.01 | 29 | ||
| EET 4 | 0.241 | 0.006 | 36 | ||
| EET 5 | 0.242 | 0.023 | 16 | ||
| SE&SP | 0.2 | SE&SP 1 | 0.344 | 0.038 | 8 |
| SE&SP 2 | 0.256 | 0.024 | 14 | ||
| SE&SP 3 | 0.209 | 0.016 | 21 | ||
| SE&SP 4 | 0.118 | 0.082 | 2 | ||
| SE&SP 5 | 0.072 | 0.04 | 7 | ||
| CMS | 0.067 | CMS 1 | 0.328 | 0.019 | 18 |
| CMS 2 | 0.165 | 0.015 | 22 | ||
| CMS 3 | 0.108 | 0.02 | 17 | ||
| CMS 4 | 0.269 | 0.06 | 35 | ||
| CMS 5 | 0.131 | 0.007 | 34 |
| HRA | CHA | RET | SIT | fb* | fb− | |
|---|---|---|---|---|---|---|
| GI 1 | 0.004 | 0.004 | 0.009 | 0.011 | 0.004 | 0.004 |
| GI 2 | 0.007 | 0.01 | 0.011 | 0.008 | 0.011 | 0.007 |
| GI 3 | 0.003 | 0.004 | 0.003 | 0.003 | 0.004 | 0.003 |
| GI 4 | 0.005 | 0.005 | 0.004 | 0.005 | 0.005 | 0.004 |
| GI 5 | 0.014 | 0.01 | 0.006 | 0.006 | 0.014 | 0.006 |
| EMM 1 | 0.037 | 0.026 | 0.048 | 0.046 | 0.048 | 0.026 |
| EMM 2 | 0.05 | 0.052 | 0.028 | 0.024 | 0.052 | 0.024 |
| EMM 3 | 0.032 | 0.045 | 0.016 | 0.022 | 0.045 | 0.016 |
| EMM 4 | 0.136 | 0.136 | 0.075 | 0.082 | 0.136 | 0.075 |
| EMM 5 | 0.076 | 0.072 | 0.033 | 0.026 | 0.076 | 0.026 |
| ME 1 | 0.019 | 0.019 | 0.012 | 0.011 | 0.019 | 0.011 |
| ME 2 | 0.041 | 0.041 | 0.027 | 0.023 | 0.041 | 0.023 |
| ME 3 | 0.017 | 0.018 | 0.012 | 0.009 | 0.018 | 0.009 |
| ME 4 | 0.015 | 0.011 | 0.005 | 0.005 | 0.015 | 0.005 |
| ME 5 | 0.008 | 0.011 | 0.011 | 0.019 | 0.019 | 0.008 |
| TE 1 | 0.014 | 0.009 | 0.011 | 0.011 | 0.014 | 0.009 |
| TE 2 | 0.025 | 0.014 | 0.025 | 0.025 | 0.025 | 0.014 |
| TE 3 | 0.027 | 0.012 | 0.029 | 0.027 | 0.029 | 0.012 |
| TE 4 | 0.013 | 0.005 | 0.011 | 0.01 | 0.013 | 0.005 |
| TE 5 | 0.054 | 0.027 | 0.024 | 0.027 | 0.054 | 0.024 |
| WM&R1 | 0.006 | 0.008 | 0.005 | 0.06 | 0.008 | 0.005 |
| WM&R2 | 0.008 | 0.015 | 0.008 | 0.09 | 0.015 | 0.008 |
| WM&R3 | 0.011 | 0.014 | 0.011 | 0.014 | 0.014 | 0.011 |
| WM&R4 | 0.008 | 0.01 | 0.009 | 0.06 | 0.01 | 0.006 |
| WM&R5 | 0.023 | 0.033 | 0.023 | 0.021 | 0.033 | 0.021 |
| SE&SP 1 | 0.027 | 0.045 | 0.05 | 0.06 | 0.05 | 0.006 |
| SE&SP 2 | 0.014 | 0.021 | 0.031 | 0.01 | 0.031 | 0.01 |
| SE&SP 3 | 0.01 | 0.016 | 0.016 | 0.014 | 0.016 | 0.01 |
| SE&SP 4 | 0.006 | 0.011 | 0.011 | 0.021 | 0.021 | 0.006 |
| SE&SP 5 | 0.023 | 0.04 | 0.029 | 0.029 | 0.04 | 0.023 |
| EET 1 | 0.038 | 0.037 | 0.015 | 0.05 | 0.05 | 0.015 |
| EET 2 | 0.024 | 0.027 | 0.01 | 0.023 | 0.027 | 0.01 |
| EET 3 | 0.016 | 0.018 | 0.018 | 0.019 | 0.019 | 0.016 |
| EET 4 | 0.082 | 0.082 | 0.026 | 0.031 | 0.082 | 0.026 |
| EET 5 | 0.04 | 0.036 | 0.011 | 0.01 | 0.04 | 0.01 |
| CMS 1 | 0.019 | 0.019 | 0.124 | 0.136 | 0.136 | 0.019 |
| CMS 2 | 0.015 | 0.007 | 0.029 | 0.071 | 0.071 | 0.007 |
| CMS 3 | 0.02 | 0.017 | 0.042 | 0.034 | 0.042 | 0.017 |
| CMS 4 | 0.006 | 0.005 | 0.076 | 0.037 | 0.076 | 0.005 |
| CMS 5 | 0.007 | 0.008 | 0.06 | 0.053 | 0.06 | 0.007 |
| S | Rank | R | Rank | Q | Rank | |
|---|---|---|---|---|---|---|
| HRA | 0.27 | 2 | 0.023 | 1 | 0.03 | 2 |
| CHA | 0.222 | 1 | 0.026 | 2 | 0.122 | 1 |
| RET | 0.405 | 3 | 0.072 | 3 | 0.938 | 3 |
| SIT | 0.418 | 4 | 0.075 | 4 | 1 | 4 |
| S− = 0.222 | R− = 0.023 | |||||
| S* = 0.418 | R* = 0.075 |
Disclaimer/Publisher’s Note: The statements, opinions and data contained in all publications are solely those of the individual author(s) and contributor(s) and not of MDPI and/or the editor(s). MDPI and/or the editor(s) disclaim responsibility for any injury to people or property resulting from any ideas, methods, instructions or products referred to in the content. |
© 2025 by the authors. Licensee MDPI, Basel, Switzerland. This article is an open access article distributed under the terms and conditions of the Creative Commons Attribution (CC BY) license (https://creativecommons.org/licenses/by/4.0/).
Share and Cite
Argyriou, I.; Nisiforou, O.; Tsoutsos, T. Setting Sail for a Sustainable Growth in Small/Medium Ports. Sustainability 2025, 17, 3330. https://doi.org/10.3390/su17083330
Argyriou I, Nisiforou O, Tsoutsos T. Setting Sail for a Sustainable Growth in Small/Medium Ports. Sustainability. 2025; 17(8):3330. https://doi.org/10.3390/su17083330
Chicago/Turabian StyleArgyriou, Ioannis, Olympia Nisiforou, and Theocharis Tsoutsos. 2025. "Setting Sail for a Sustainable Growth in Small/Medium Ports" Sustainability 17, no. 8: 3330. https://doi.org/10.3390/su17083330
APA StyleArgyriou, I., Nisiforou, O., & Tsoutsos, T. (2025). Setting Sail for a Sustainable Growth in Small/Medium Ports. Sustainability, 17(8), 3330. https://doi.org/10.3390/su17083330