Article

A Study on the Impact of Corporate Digital Transformation on Environmental, Social, and Governance (ESG) Performance: Mechanism Analysis Based on Resource Allocation Efficiency and Technological Gap

Faculty of Business and Technology, University of Cyberjaya, Persiaran Bestari, Cyber 11, Cyberjaya 63000, Darul Ehsan, Malaysia
*
Author to whom correspondence should be addressed.
Sustainability 2025, 17(8), 3308; https://doi.org/10.3390/su17083308
Submission received: 19 February 2025 / Revised: 28 March 2025 / Accepted: 31 March 2025 / Published: 8 April 2025

Abstract

:
For a country like China, which places equal emphasis on economic development and environmental governance, the exploration of the potential of digital transformation to enhance corporate Environmental, Social, and Governance (ESG) performance is of paramount importance in achieving the carbon peak target by 2030. Accordingly, this paper employs a two-way fixed-effects model to analyze the impact of digital transformation on corporate ESG performance, based on annual data from Chinese listed companies from 2014 to 2023. On this basis, we established a theoretical framework and implemented a dual fixed-effects model. The findings argue that digital transformation materially enhances corporate ESG performance, primarily by enhancing resource allocation efficiency and narrowing the technological gap. The research results are confirmed to be valid through rigorous robustness testing and endogeneity analysis, with evident effects observed in large-scale, technology-intensive, asset-intensive, central–eastern regions, and high-tech enterprises. This research offers both theoretical foundations and practical insights for companies pursuing ESG performance enhancement through digital transformation while also providing a valuable point of reference for policymakers working toward green transformation and the carbon peaking target.

1. Introduction

The potential of the digital economy, first recognized in the 1990s, has steadily evolved into a crucial economic model [1]. In August 2024, the China Academy of Information and Communication Technology (CAICT) published the “China Digital Economy Development Research Report (2024)”; the scope of Chinese digital economy reached CNY 53.9 trillion in 2023, constituting 42.8% of GDP and establishing itself as a central driver of China’s economic progress. However, the considerable energy consumption, pollution, and digital information security concerns accompanying this rapid economic expansion have imposed constraints on growth [2,3] and triggered public crises, including public health emergencies. As a result, the Chinese government has officially put forward the objectives of reaching the carbon emission peak by 2030 and achieving carbon neutrality by 2060. These significant targets have effectively augmented the responsibilities that Chinese enterprises need to shoulder.
With growing emphasis on sustainable development, the ESG concept first introduced by the United Nations in 2004 has gained prominence, although some perspectives question the rationality of the ESG concept, arguing that it diverges from the original intention of enterprises and fails to create value for both enterprises and investors [4,5]. Furthermore, the high level of attention to ESG has, to a certain extent, exacerbated the “greenwashing” behavior of enterprises [6,7,8]. However, given the positive impact of ESG on climate risk [9], stock returns [10] and investment returns [11], and financial performance [12], and in the absence of mandated legal disclosures for non-financial reporting in China, ESG reporting has emerged as a pivotal mechanism for evaluating the extent to which a company discharges its social responsibilities [12]. Despite this, enterprises still face multiple practical obstacles in the process of promoting ESG, such as the difficulty in quantifying the long-term returns of sustainable development investments [13], specific industry barriers [14], and the disconnect between strategy and execution [15]. Thus, delving into the means of promoting the ESG performance of enterprises still holds crucial importance for China in the pursuit of its ”2030” goal, for instance, Hyundai Motor leveraging its sound business philosophy and environmentally conscious products and prioritizing feedback from investors and other stakeholders, along with its ESG management practices. This has enabled the company to achieve global sales of 268,785 electric vehicles in 2023, a 28% year-over-year increase in an increasingly competitive automotive market. Consequently, for companies aiming at sustainable development, it has become an essential requirement to efficiently meet the various needs of stakeholders in the process of digital transformation implementation.
Digital transformation, which is also referred to as Industry 4.0 [16,17,18], has been shown to facilitate the restructuring of existing procedures and business frameworks within companies, thereby enhancing their ESG performance. In digital transformation, businesses can optimize resource utilization, effectively facilitate the transition of traditional industries to low-energy and low-pollution operational models [19], and strengthen their financial performance in accordance with green development principles [20]. However, traditional businesses may experience a short-term decline in performance due to technological adaptation barriers [21]. In addition, the increased reliance on digital infrastructure raises concerns about data security and privacy [22,23], making cybersecurity risks a key issue for businesses to address.
The relationship between corporate digital transformation and their ESG has attracted extensive academic attention; nevertheless, several research gaps remain. First, considering the above-mentioned importance of ESG development to Chinese society, digital transformation, as noted by Firk et al. [24], may introduce risks by altering the existing operational models. These risks could potentially cause a decline in a company’s ESG performance, and the nature of this relationship calls for further verification. Second, further exploration is needed to clarify the underlying mechanisms through which digital transformation influences ESG performance. Existing research has analyzed potential pathways through the perspectives of environmental regulations [25], corporate risk-taking [26], and market performance [27]. However, shifts in traditional business models or the misalignment of personnel structures can undermine transformation efforts. In fact, certain companies may pursue digital transformation due to pressure from external stakeholders [28], prioritizing low-investment, high-return strategies. Developing transformation strategies aligned with a company’s specific context is, therefore, of significant research value. Third, as the extant literature on digitalization and sustainable development primarily focuses on large entities, such as listed companies and manufacturing firms [29,30,31], the exploration of firm heterogeneity still requires more in-depth research.
This study employs a two-way fixed-effects model to rigorously examine the relationship between digital transformation and corporate ESG performance, utilizing data from Chinese listed companies from 2014 to 2023. It makes three key contributions. First, it provides empirical evidence that digital transformation enhances ESG performance, underscoring its critical role in promoting corporate sustainability. Second, we propose that resource allocation efficiency and technological gaps constitute the “black box” of the mechanism linking between digital transformation and ESG—an unexplored pathway in the existing literature. By unveiling this underlying mechanism, our study enriches the theoretical framework in this field and introduces new variables and relationships for future research. Third, we identify the heterogeneous effects of digital transformation on ESG performance across firm sizes, industries, regions, and technological levels, emphasizing the necessity of context-specific strategies. Overall, this study provides important insights for both theory and practice, with valuable implications for corporate decision-making and sustainable development policy formulation in the context of digital transformation.
The remainder of the present study is structured as follows: Section 2: Mechanism Analysis and Hypotheses; Section 3: Data Sources and Model Construction; Section 4: Empirical Results; and Section 5: Summary, Discussion, Recommendations, and Limitations.

2. Theoretical Background and Hypotheses

2.1. Digital Transformation and ESG Performance

The rapid growth of the digital economy is a crucial factor in the global reallocation of resources, the restructuring of economies, and the shifting status quo of competition [32]. The forces driving corporate digitalization can be analyzed from three perspectives. First, the widespread adoption of digital technologies. Integrating these technologies can optimize or transform conventional business operations, increase efficiency through improvements in innovation and decision-making [33,34], and finally strengthen companies’ financial outcomes [35]. Second, shifts in the competitive market environment. Digital components are reflected by their ease of distribution and low cost. Optimizing the usage of data resources can enhance a company’s market competitiveness. As Erevelles et al. [36] have shown, big data enable companies to precisely target customers for marketing, develop more specialized products, and mitigate information asymmetry both within and outside the organization. In addition, successful digital transformation can also build corporate reputations and strengthen investor trust [37]. Third, evolving consumer behavior. The rise of various digital platforms and social media, coupled with growing market transparency and online engagement, continues to reshape traditional business approaches. Companies can create novel business models utilizing digital tools at the stages of distribution, communication, and market assessment [38]. Companies unable to adapt to the market with new technologies will finally be supplanted by those who effectively leverage the power of digital technologies.
In 2019, the Business Roundtable saw CEOs of major global corporations commit to integrating stakeholder value into their strategic growth plans [39]. This shift highlights the increasing focus on sustainability and corporate social responsibility, necessitating a reassessment of corporate strategic priorities. Against this backdrop, digital transformation is not merely the application of technology but serves as a key driver of systematic and strategic change within companies [40,41]. It enables companies to address ESG challenges holistically, deeply integrate sustainability principles into their development strategies, and enhance their strategic positioning amid an evolving corporate landscape. First, digital transformation provides companies with resource advantages, aligning with the Resource-Based View (RBV), which posits that a firm’s ability to achieve competitive advantage depends on the development and deployment of unique resources [42]. Digital infrastructure fosters technological advancements in areas such as green innovation and pollution control, thereby enhancing environmental sustainability. For instance, Yang et al. [43] demonstrated that digital technologies can contribute to energy conservation and emissions reductions through three avenues: technological innovation, industrial frameworks, and energy infrastructures; Tao et al. [44] empirically studied the promoting effect of digital transformation on enterprises’ environmental innovation; Lin and Zhang [45] explored the remarkably positive connection that exists between digital transformation and corporate environmental responsibility.
Second, from the perspective of Stakeholder Theory (ST), digital transformation can considerably enhance the transparency and decision-making effectiveness of corporate governance. Rooted in business ethics and organizational management, ST emphasizes that firms should generate value for a diverse range of stakeholders rather than solely pursuing their own interests. [46,47]. In this context, the implementation of technologies such as blockchain has increased the traceability and transparency of information, allowing shareholders, creditors, and regulatory bodies to more readily access accurate company data, thereby lessening information asymmetry and managerial self-serving behavior [48]. On the one hand, this enhanced transparency incentivizes companies to proactively address their social responsibilities, cultivating a stronger brand image [49]. On the other hand, the growth of enterprises is often restricted by vacancies in key positions [50] or a lack of talent with critical skills [51]. As essential internal stakeholders, employees’ competencies and stability play a critical role in the long-term development of a company. Firms with advanced digital governance can harness big data analytics to identify talent and leverage collaborative platforms to engage with them seamlessly [52], thereby addressing challenges encountered in advancing ESG initiatives. According to the aforementioned analysis, this paper puts forth the hypothesis:
H1. 
Digital transformation can effectively enhance ESG performance.

2.2. Resource Allocation Efficiency Between Digital Transformation and ESG

The role of corporate digital transformation in optimizing corporate resource allocation has derived significant academic interest. Research indicates that a twofold gain in digital transformation-related terminology correlates with an approximately 9.5% correction in capital input bias and a 7.3% correction in labor input bias [53]. This optimized resource allocation enhances the accuracy of internal management and decision-making in well-functioning organizations [54], cultivates value creation, and significantly improves business ESG. To be more precise, digital transformation remarkably enhances the outcome of ESG mainly via two key channels: optimizing internal corporate structure and strengthening collaborative risk management.
By leveraging digital technology and agile frameworks to facilitate adaptable organizational design, digital transformation enables companies to respond rapidly to environmental opportunities and challenges through data-driven operations, swift adaptation, and immediate deployment [55]. This continuous optimization of internal corporate structure increases resource utilization and minimizes waste, thereby benefiting environmental performance. The use of digital tools strengthens a company’s internal resilience, facilitates data sharing and business process integration, and effectively reduces the consumption of energy [56]. Simultaneously, digital technologies also advance streamlined organizational management, minimize redundancies in information transfer, decrease organizational inertia, improve decision-making efficiency [57], and offer support for strong corporate governance. Take manufacturing enterprises as an example. Through a digital management system, enterprises can monitor the usage of raw materials in real time, accurately calculate the material requirements during the production process, and avoid overpurchasing and waste.
Digital technologies significantly improve how firms perceive and manage risk, enabling more effective responses through cooperative resource allocation optimization [58]. For instance, firms can leverage digital platforms to consolidate environmental and social data, predict potential climate-related and social risks, and proactively change resource distribution to address these risks [59]. From a governance perspective, digital transformation has facilitated information dissemination both in and beyond organizational boundaries, allowing management to more rapidly identify risk origins and prevent potential losses in a timely fashion. Therefore, firms’ risk tolerance is strengthened, and decision-makers gain greater capacity to optimize resource allocation, efficiently deploy resources, and direct resources towards ESG projects represented by major uncertainty. Based on accurate resource data, the management can precisely arrange raw material procurement, production equipment scheduling, and staff shift arrangements, thus avoiding production delays or inventory backlogs caused by inaccurate resource forecasts.
With the above analysis and combined with the research of scholars that the efficiency of resource allocation significantly promotes firms’ green performance [20,60,61], this paper puts forth the hypothesis:
H2. 
Corporate digital transformation has a positive impact on ESG performance by optimizing resource allocation efficiency.

2.3. Technology Gap Between Digital Transformation and ESG

A firm’s technological capacity comprises not only its present technological state and accumulated experience but also crucial aspects of its identity, strategic direction, and potential for achievement [62]. The connection between technology and ESG has been confirmed by the existing literature [63,64,65,66]. Tesla, leveraging its advanced digital technology and vast vehicle data collection system, processes massive amounts of driving data and user driving habit data at a relatively low cost. This not only meets consumers’ demands for intelligent travel (S) but also reduces vehicle carbon emissions to a certain extent by optimizing energy use (E). Meanwhile, it demonstrates Tesla’s innovative governance capabilities in the field of smart vehicles (G). According to the diffusion of innovation theory [67], leading firms (innovators) are the first to adopt digital technologies and drive technological progress in the industry. Other firms (adopters) gradually adopt these technologies under the influence of demonstration effects and market competition. In this process, there are significant differences in the speed and adaptability of technology adoption among firms. Technological gaps represent the differences in technological advancement between firms and the industry average. Considering the swift progress of digital technologies, this gap has become a critical factor for firms undertaking digital transformation. In addition, Kretschmer and Khashabi [68] hypothesized that smaller firms should prioritize technological advancements in specific key processes and activities, propelling these advancements more rapidly than their larger rivals. Contrary to the recommendations of the literature that advocated for utilizing patents [49,69,70] or R&D [71,72,73] as an indicator of a firm’s technological capabilities, firms can enhance or create novel technological assets by cultivating advantageous technological discrepancies in the sector or by lessening unfavorable discrepancies. Accordingly, this augments production and management effectiveness while freeing resources for ESG investments, thus contributing to sustainable growth.
First, propelled by the digital economy, digital technology has fundamentally changed conventional innovation paradigms [74]. Leveraging a digital base, firms can manage greater volumes of data at reduced expenses, and a broader pool of individuals has the capacity to become innovators [75]. Rippa and Secundo [76] offered further evidence that a digital-enabled business model offers three fundamental pillars for technological progress in firms: digital components, platforms, and infrastructure. A firm’s technological advancement and efficient resource distribution also positively influence labor productivity [77]. In practice, the technological sophistication of firms varies considerably. By reducing the technological gap, firms can establish key elements for differentiated strategies that cultivate competitive advantages in innovative endeavors.
Second, digital collaboration platforms facilitate the sharing and collaborative development of resources. Implementing long-term, high-risk sustainable development strategies necessitates significant financial and technological support, which can create financial burdens for companies. Prior research demonstrates that embracing digital transformation significantly enhances economic benefits [78]. Access to knowledge, information, and experience, facilitated by digital platforms, significantly reduces transaction and management costs, thus encouraging companies to modernize their technologies. Moreover, digital platforms strengthen the integration of corporate supply chains, reducing communication expenses [79]. By alleviating these financial pressures, companies acquire greater financial latitude to enhance their core technologies, thereby establishing a positive feedback loop.
Third, knowledge-based business frameworks recognize the crucial role of knowledge as a foundation for competitive advantage. Progress in digital technologies enables management and employees to acquire and generate knowledge from both internal and external organizational sources, effectively bridging internal technological gaps [80]. Through effective knowledge management and the cultivation of absorptive capacity, organizations can convert creative potential into sustainable innovation, rapidly deploying new technologies, engaging with stakeholders, and allocating resources to achieve impactful outcomes.
According to the aforementioned analysis, this paper puts forth the hypothesis:
H3. 
Corporate digital transformation has a positive impact on ESG performance through increasing the positive technology gap or reducing the negative technology gap.
The conceptual framework of the main research process has been proposed, demonstrated as presented in Figure 1.

3. Research Method

3.1. Data Sources and Samples

A-share listed companies’ data were sourced from 2014 to 2023 with relevant research data drawn from the China Stock Market and Accounting Research Database (CSMAR) database and the annual reports of the sampled companies. The selection of listed companies was driven by their standardized disclosure requirements, which guarantee data availability, reliability, and comparability. Sample construction involved the following steps: (1) the exclusion of ST (which are under special treatment due to abnormal financial conditions) and *ST (which have incurred consecutive losses for two years and face delisting risk), as well as financial and insurance firms, to ensure data consistency and avoid industry-specific biases; (2) the exclusion of companies listed below one year to ensure data reliability and comparability; (3) the exclusion of companies with incomplete financial data to maintain dataset integrity; (4) the application of a 1% winsorization procedure to all continuous variables to mitigate the influence of extreme values. This resulted in a final sample of 27,909 observations.

3.2. Variable Selection and Definition

3.2.1. Explained Variable

Premised on the research of Feng et al. [81], the corporate annual ESG score is calculated by taking the arithmetic mean of the quarterly scores in the current year. These quarterly scores are derived using the Huazheng ESG Rating Index. Developed by Shanghai Huazheng Index Information Service Co., Ltd., this comprehensive index is designed to assess corporate performance across environmental, social responsibility, and corporate governance factors. The index is constructed from publicly available data, including corporate social responsibility reports, sustainable development reports, information from regulatory agency websites, and news media reports. This system specifically accounts for the current developmental stage of the Chinese capital market. Huazheng ESG ratings are assigned on a nine-point scale ranging from C to AAA, with numerical values from 1 (representing C) to 9 (representing AAA). Higher scores indicate better ESG performance.

3.2.2. Explanatory Variables

This study’s key explanatory variable is the degree of digital transformation (Dig). Adapting the methodology of Zhen et al. [82], it is computed by ascertaining the ratio of digital transformation-related keywords in the “Management Discussion and Analysis” part of the annual report and then multiplying this ratio by 100. This proportion is derived by dividing the total number of digitalization keywords by the total word count of this section. These keywords, 135 in total, are divided into three primary dimensions and eleven secondary dimensions, as shown in Figure 2. This variable is intended to reflect the digital practices described by companies in their annual reports and their level of integration into management and operations, allowing for analysis of their influence on business performance and compensation structure.

3.2.3. Mechanism Variables

Resource allocation efficiency:
Referring to the work of Richardson [83], the measurement of corporate resource allocation measures investment inefficiency and represents the difference between actual and predicted investment levels as the residual ε. A positive ε (ε > 0) signifies overinvestment, while a negative ε (ε < 0) indicates underinvestment, with the absolute value of ε representing the extent of underinvestment. The lower the absolute value of this index, the more efficient resource allocation, with maximum efficiency when the index equals 0. The model is formulated as follows, where α 0 represents the intercept term, and α 1 to α 7 denote the regression coefficients associated with the respective independent variables:
I n v i , t = α 0 + α 1 I n v i , t 1 + α 2 L e v i , t 1 + α 3 G r o w t h i , t 1 + α 4 S i z e i , t 1 + α 5 C a s h i , t 1 + α 6 R i , t 1 + α 7 A g e i , t 1 + Y e a r + I n d u s t r y + ε i , t
The definitions of each variable are demonstrated in Table 1.
Technological Gaps:
This paper referenced Aghion et al. [84] and employs labor productivity as the key index for assessing technological levels. To measure this, the labor productivity of each listed company was measured by dividing its total sales revenue by its total number of employees, thus reflecting the company’s labor output efficiency per worker. Moreover, to obtain a comprehensive understanding of a company’s technological standing in its industry, the overall industry labor productivity represented a benchmark against which each firm’s labor productivity was compared. This comparison involved calculating the ratio of a company’s labor productivity to the industry’s labor productivity. A ratio greater than 1 indicates that the company’s technological level surpasses the industry average, signifying a positive technological advantage, whereas the value of the ratio which is lower than 1 indicates that the technological level of the company drops below the average level of the industry, signifying a negative technological advantage. This methodological approach effectively mitigates distortions arising from industry heterogeneity and more accurately identifies the relative technological strengths and weaknesses of each company. Consequently, a solid econometric framework is set up to evaluate the impacts of technological levels on related economic activities. Moreover, to guarantee the robustness of the indicator and its consistency with the real-world industry situation, the overall labor productivity of the industry was calculated by using a weighted average of data from all the listed companies within that particular industry.

3.2.4. Control Variables

The selection of control variables is primarily intended to minimize the effect of external factors that may impact the level of digitalization and corporate ESG ranking. This study controlled several variables, including the company size, debt-to-asset ratio, revenue growth rate, net profit margin of total assets, shareholding ratio of the largest shareholder, number of directors, proportion of independent directors, balance of power within the company, company’s classification as a state-owned entity, and fixed effects for both industry and year. Detailed definitions for each variable are offered in Table 2. The incorporation of these control variables serves to heighten the accuracy as well as the reliability of the estimated results of the model. As a direct consequence, it furnishes far more reliable groundwork for expounding upon the relationship that exists between the principal explanatory variables and the dependent variables.

3.3. Model Design

3.3.1. Benchmark Regression Model

The benchmark regression model mainly studies the direct effect of digital transformation on ESG and is expressed as follows to verify H1:
E S G i , t = β 0 + β 1 Dig i , t + β 2 X i , t + η i + ϕ t + ε i , t
where i denotes a company, and t expresses the time. E S G i , t indicates the dependent variable of interest in this paper, the coefficient β 0 represents the intercept term, and X i , t refers to the control variable. The coefficients β 1 and β 2 stand for the total effect of digital transformation and control variables on ESG scores. η i and ϕ t represent industry fixed effects and year fixed effects, respectively, and ε i , t depicts the random error term.

3.3.2. Mechanism Model

To verify H2 and H3, this paper constructs the following equations by referring to the two-step mediation method [85] in which the results of Equation (1) are incorporated into Equation (3) for further analysis.
Efficiency i , t = γ 0 + γ 1 Dig i , t + γ 2 X i , t + η i + ϕ t + ε i , t
TechGap i , t = δ 0 + δ 1 Dig i , t + δ 2 X i , t + η i + ϕ t + ε i , t
The subscripts are the same as Equation (2). According to theoretical hypotheses, resource allocation efficiency (Efficiency) and technology gap (TechGap) are considered as mechanism variables. The coefficient γ1 represents the effect of digital transformation on resource allocation efficiency, while the coefficient δ1 denotes the effect of digital transformation on technology gaps.

4. Empirical Result Analysis

4.1. Descriptive Statistics

Table 3 presents the results of the descriptive statistical analysis conducted for the core variables. Regarding the corporate ESG score, its average value was 4.117, with a standard deviation of 0.956. The scores were distributed within the range from 1 to 6.75. The wide range of values clearly demonstrates that there are significant variations in the ESG performance of the sample enterprises. For the Dig levels, the mean was 0.061, and the standard deviation was 0.101. Values spanned from a minimum of 0 to a maximum of 0.5577. This indicates that the proportion of digitally related content disclosed in company annual reports was generally low, while certain companies exhibited notably high levels of digital transformation performance. Resource allocation efficiency had a mean of 0.039 and a standard deviation of 0.051, reflecting an overall inefficiency in resource allocation among the firms. Furthermore, the variable TechGap presented an average value of 1.001, with a standard deviation of 0.778 and with values varying from 0.114 to a maximum of 4.8975. This wide distribution highlights the significant difference in the relative technological standing among the companies.

4.2. Correlation Analysis

The results of the correlation analysis in Table 4 demonstrate that the correlation coefficient between Dig and ESG was 0.076, significant at the 1% level. This positive correlation offers supporting evidence for the following regression analysis. The correlation coefficient between resource allocation efficiency and the explained variable was −0.094, with a negative at level of 5%. As resource allocation efficiency is measured as a reverse index, this negative correlation indicates that lower resource allocation efficiency (i.e., less efficient resource allocation) corresponds with weaker ESG performance. Finally, the relatively small magnitudes of the correlation coefficients among the variables indicate a lack of significant multicollinearity issues, thereby supporting the planned robustness analysis of the model.

4.3. Benchmark Regression

The results of the benchmark regression are shown in 
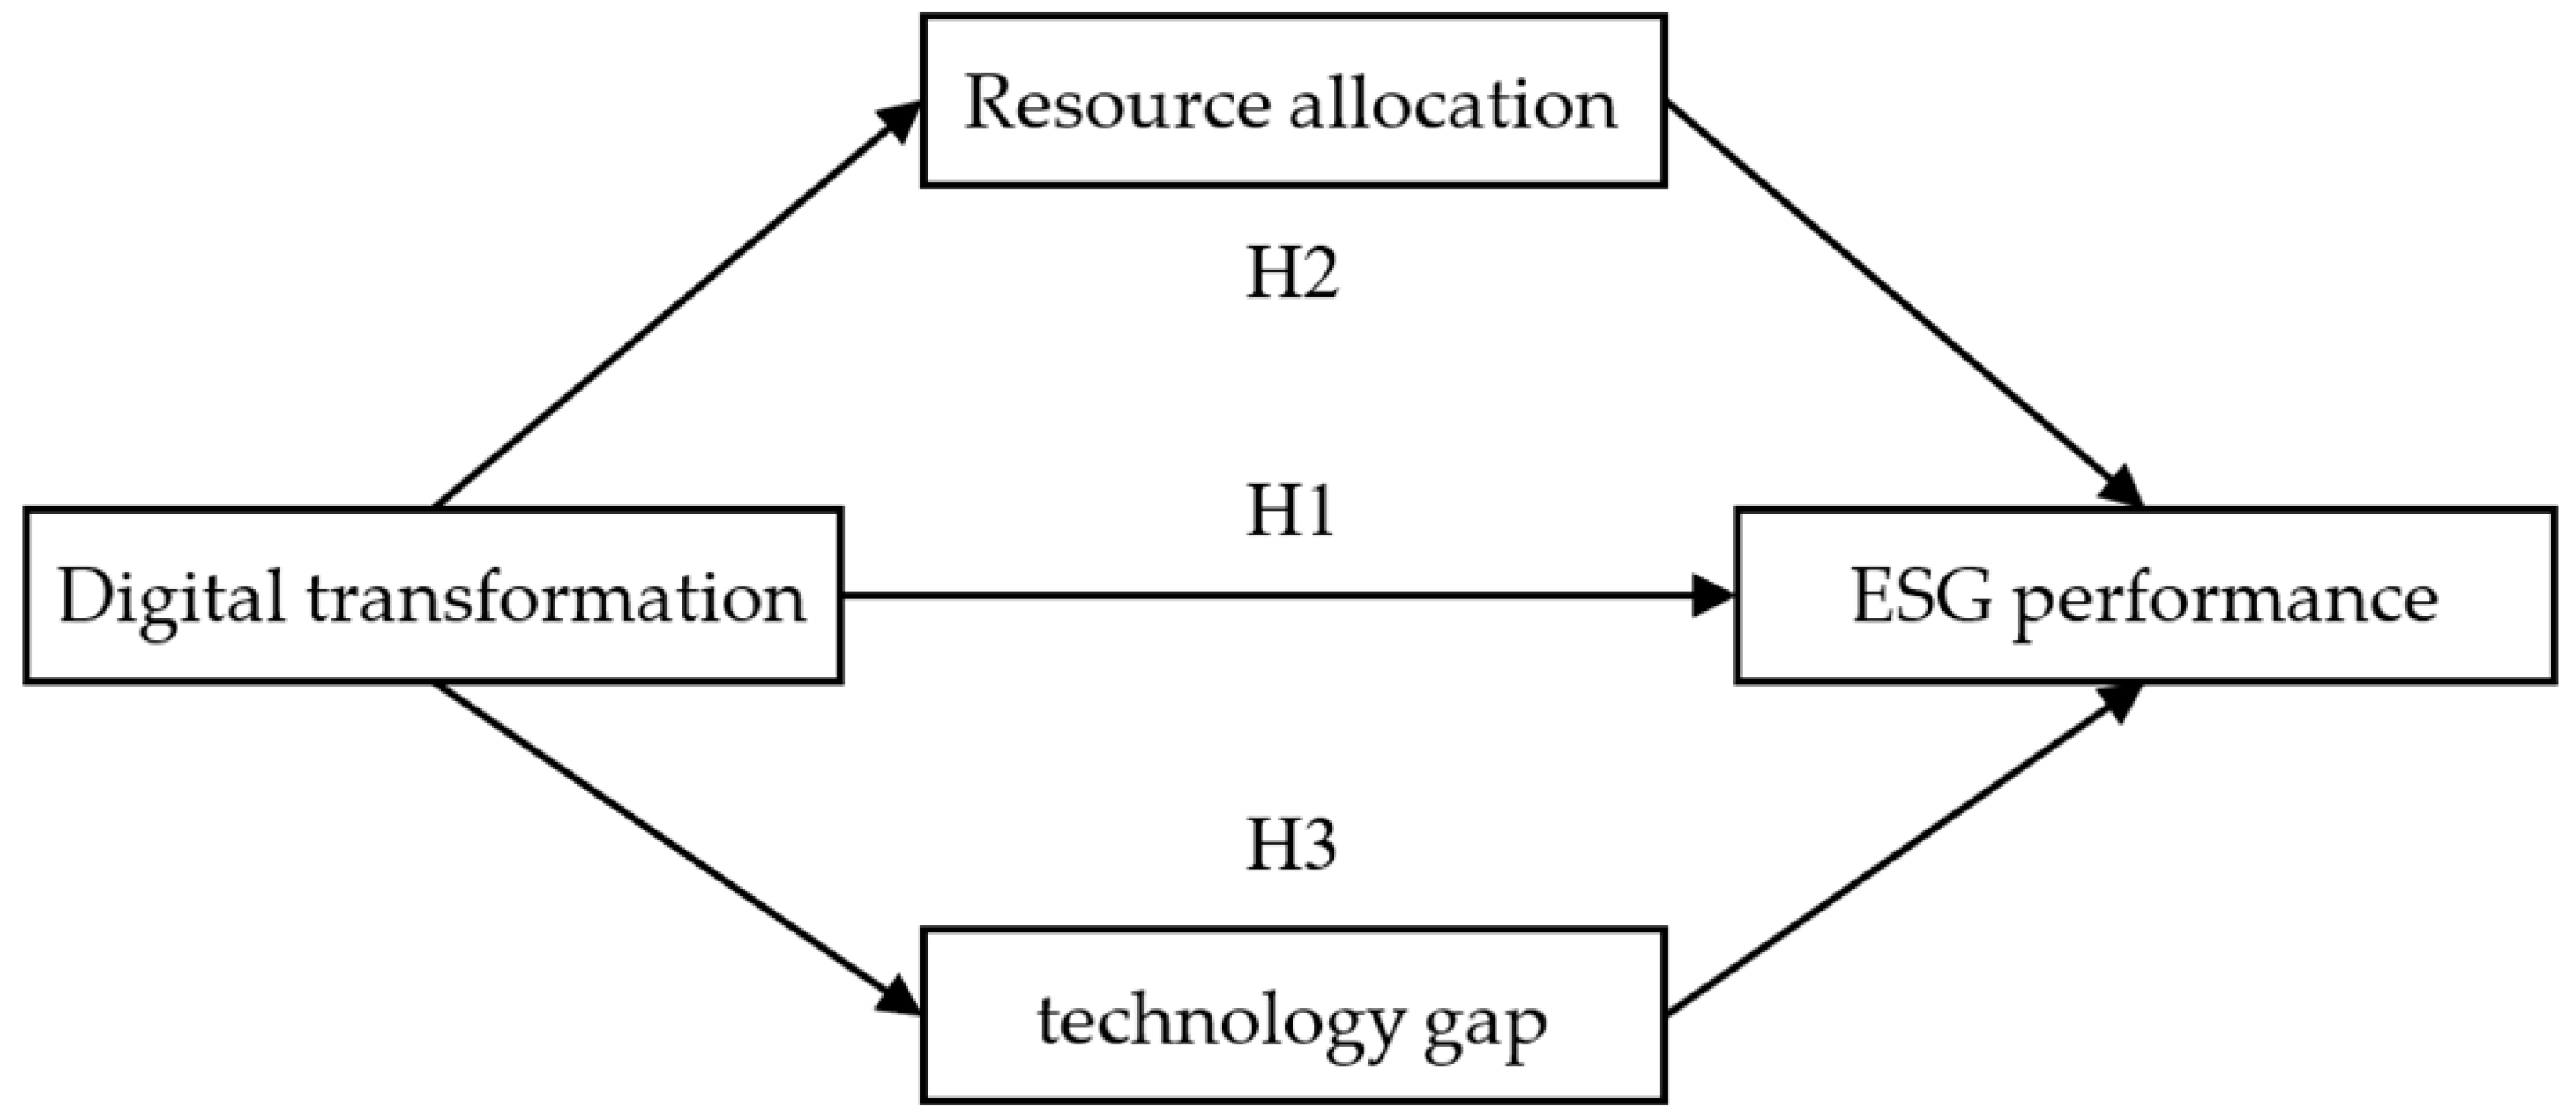
Table 5. In this model, the impact of Dig on corporate ESG is estimated. Control variables and fixed effects are successively included to verify the robustness of the results. Hypothesis 1 posits that digital transformation can significantly improve corporate ESG performance.
Column (1) isolates the direct effect of Dig level on firm ESG outcome. With a significance level of 1%, the regression coefficient derived from the analysis is 0.726. This value strongly suggests that there exists a positive association between digital transformation and ESG performance. Column (2) incorporates control variables, specifically company size, asset–liability ratio, and revenue growth rate. The regression coefficient for the digital transformation level rises to 0.980 and maintains its significance at the 1% level. This further confirms the positive effect of digital transformation on corporate ESG performance, controlling other potential influencing factors. Column (3) introduces industry and year fixed effects. The regression coefficient for the digital transformation level is 0.402 and remains significant and positive. This demonstrates that the positive effect of digital transformation on corporate ESG performance remains even after accounting for industry-specific and temporal characteristics, thereby supporting Hypothesis 1. Meanwhile, firm size and return on assets exhibit a significant positive correlation with ESG performance, indicating that larger firms and those with higher profitability have more resources and capabilities to advance ESG initiatives. In contrast, leverage and revenue growth show a significant negative correlation, suggesting that highly leveraged firms may face financial constraints that limit ESG investments, while rapidly growing firms may prioritize short-term profitability over ESG development. Additionally, governance factors such as the largest shareholder’s ownership ratio and board independence also influence ESG performance to some extent. Based on the data issued by the National Bureau of Statistics of China, the Gross Domestic Product (GDP) of China in 2023 witnessed an approximate 98% growth compared to that in 2014. This growth pattern is congruent with the developmental trajectory of ESG. To sum up, the outcomes of the benchmark regression validate that digital transformation is capable of substantially enhancing corporate ESG ranking. Moreover, even after accounting for relevant variables and fixed effects, this positive correlation remains stable and reliable.

4.4. Robustness Test

Table 6 displays the robustness checks performed on the benchmark regression. This paper conducts these robustness tests across three dimensions: alternative variables, sample processing, and fixed effects. The specific results are detailed below.
Substitute dependent variable:
The annual value of ESG ratings was substituted by Chinese Research Data Services Platform (CNRDS). As revealed by the regression results, the coefficient of Dig is 1.887, which is significant at the 1% level. This indicates that the positive effect of digital transformation on ESG performance remains robust when the dependent variable is substituted.
Substitute core explanatory variable 1:
Adopting the methodology detailed by Wu et al. [86], the analysis replaces the digital transformation variable with an alternative measure. The findings show that the coefficient of the substitute variable (Dig1) is 0.457, and it is significant at the 1% level. This research result verifies the strong and positive connection between digital transformation and corporate ESG performance.
Substitute core explanatory variable 2:
Employing the method of Zhao et al. [87], a second alternative digital transformation variable (Dig2) was incorporated into the regression analysis. The results indicate a coefficient of 0.383, significant at the 1% level. This offers further support for the conclusion that the positive effect of digital transformation on improving corporate ESG performance is indeed robust.
Exclusion of special samples:
After excluding the samples associated with the 2015 stock market plunge and the 2020–2022 epidemic period, the regression analysis produced a coefficient of 0.346 for digital transformation, again significant at the 1% level. This result demonstrates that sample fluctuations during these specific periods do not significantly influence the effect of digital transformation on ESG performance.
Addition of interactive fixed effects:
When industry–year, city–year, and city fixed effects are incorporated into the model, the regression outcomes reveal that the coefficient of digital transformation is 0.328. Notably, this coefficient still shows significance at the 1% level. This implies that, despite controlling for a more intricate array of fixed effects, the positive impact of digital transformation on corporate ESG performance persists.
Overall, with the exception of the first column, the results of the control variables in the robustness tests remain broadly consistent, which may be due to the use of alternative variables. Firm size and state ownership consistently show a significant positive correlation, suggesting that larger firms and state-owned enterprises have greater capacity to allocate resources or political advantages in the ESG domain. Return on assets is significantly positively correlated across several robustness tests, suggesting that firms with higher profitability are more likely to advance ESG strategies. In contrast, revenue growth consistently shows a significant negative correlation, suggesting that high-growth companies may prioritize short-term profits over sustainable investments. Meanwhile, ownership by the largest shareholder and other variables, such as board independence, are mostly positively correlated across robustness tests, supporting the positive influence of corporate governance structure on ESG performance. The results of these robustness checks increase the believability of the research findings. They show that digital transformation can significantly enhance corporate ESG amidst diverse alternative variable formulations, sample processing approaches, and model arrangements.

4.5. Endogenous Test

4.5.1. IV-2SLS

As presented in Table 7, a two-stage least squares instrumental variable method (IV-2SLS) was employed to address the potential endogeneity issue between digital transformation and corporate ESG performance. The rationale for selecting the mean digital transformation level of other companies in the same city as an instrumental variable is twofold. First, companies located in the same city share similar policy environments, infrastructure, and digital resources. This commonality allows the mean digital transformation level of other companies in the same city to accurately reflect changes in the external digital environment and to significantly affect the digital transformation of the companies themselves. Second, the digital transformation activities of other companies do not directly influence the ESG performance of the target company, thereby satisfying the exogeneity assumption of instrumental variables. Its limitation lies in the possibility of broader industrial linkage effects between companies within the same region, such as common supply chains, market demand, or industry competitive dynamics. These factors may cause instrumental variables to influence ESG performance not only through the digital transformation pathway but also in conjunction with other external factors, potentially undermining its strict exogeneity.
In the initial phase of the regression analysis, the instrumental variable exhibited a regression coefficient of 0.533 with respect to digital transformation, achieving statistical significance at the 1% level. This finding underscores a robust association between the instrumental variable and the key explanatory factor. Additionally, the Cragg–Donald Wald F statistic, calculated at 1446.914, substantially exceeded the threshold for weak instrument concerns, confirming the strong explanatory capacity of the instrumental variables. In the subsequent stage of the analysis, the regression coefficient linking digital transformation to corporate ESG performance was 2.338, which was also statistically significant at the 1% level. This outcome suggests that the beneficial impact of digital transformation on ESG performance persists even after addressing potential endogeneity biases. Furthermore, the Anderson LM statistics, recorded at 1380.111, surpassed the required threshold, thereby reinforcing the appropriateness and validity of the selected instrumental variable.
In summary, the results of the endogeneity testing confirm a causal and significantly positive relationship, aligning with the findings of H1. This addresses potential endogeneity bias and strengthens the credibility of the research conclusions.

4.5.2. PSM Model

To further examine the stability of the influence exerted by digital transformation on corporate ESG performance, this research utilized propensity score matching (PSM), with the specific details elaborated in Table 8. The analysis was executed in two consecutive stages. First, a binary variable was established based on the median value of the Dig score. Specifically, companies whose scores exceeded the median were classified into the treatment group and assigned a value of 1, while those with scores below the median were grouped into the control group and assigned a value of 0. Subsequently, a set of control variables was employed to estimate the propensity scores, and a 1:1 nearest-neighbor matching strategy was adopted. This approach effectively guaranteed the comparability of the treatment and control groups in terms of their fundamental characteristics, thus significantly reducing the impact of sample heterogeneity. Once the matching process was completed, a regression analysis was performed on the matched sample. The post-matching regression results demonstrated that the coefficient of digital transformation was 0.625, and it was statistically significant at the 1% level. This finding indicates that enterprises with higher degrees of digital transformation achieve notably better ESG performance compared to those with lower levels of digital transformation, thereby validating the results of hypothesis H1.
Moreover, even after addressing observable differences between the treatment and control groups, the link between digital transformation and ESG performance remains significant, reinforcing the reliability of the baseline regression results. The PSM method, designed to mitigate potential sample selection bias, enhances the credibility of the findings. However, it is important to acknowledge that PSM primarily accounts for observable factors, leaving the possibility that unobservable confounders may still influence the estimated effects. Despite this limitation, the consistency of results across multiple robustness checks reinforces confidence in the study’s conclusions.

4.5.3. PSM-DID

As demonstrated in Table 9, propensity score matching difference in differences (PSM-DID) analysis with replacement was employed to account for potential endogeneity concerns between digital transformation and corporate ESG performance. Notably, in this method, we did not use calipers. In 2013, the State Council issued “Several Opinions on Promoting Information Consumption,” which explicitly highlighted the need to advance information consumption growth by stimulating demand, expanding market reach, and diversifying service provisions. That same year, the Ministry of Industry and Information Technology initiated the development of information consumption pilot cities, designating 104 pilot zones to advance information consumption, enhance infrastructure, and cultivate the development of novel business models through a pilot-led strategy. This policy creates quasi-experimental conditions for evaluating the digital transformation of companies. The specific procedures were implemented as follows. First, based on the 2013 establishment of information consumption pilot cities, companies in the pilot zones were assigned to the treatment group with other companies comprising the control group. Second, PSM was implemented to match these two groups of companies in a 1:1 ratio, ensuring that the treatment and control groups exhibited similar baseline characteristics prior to policy enactment. After post-matching, we applied a DID model to determine the causal effects of the pilot policy on corporate ESG performance and digital transformation.
The regression analysis indicates that the coefficient associated with the policy interaction term (DID) in the PSM-DID model is 0.088, significant at the 1% level, suggesting that the information consumption pilot policy advances companies’ digital transformation and significantly enhances their ESG performance. This finding provides strong causal evidence supporting H1, demonstrating that digital transformation positively impacts ESG outcomes within a well-defined policy environment. While the PSM-DID method helps control for observable factors and policy-induced selection bias, unobserved firm characteristics may still influence the results. Additionally, policy effects may vary across regions and industries. Despite these limitations, the consistency of results across robustness checks further reinforces the credibility of the findings, confirming that digital transformation enhances corporate ESG performance.

4.6. Mechanism Test

Table 10 displays the results of the mechanism tests analyzing resource allocation efficiency and technological gaps. To study how digital transformation enhances corporate ESG performance through internal mechanisms, hypotheses H2 and H3 were tested utilizing a two-step methodological approach. First, the significant positive correlation between enterprise digitalization and corporate ESG outcomes is evident. Next, resource allocation efficiency and technological gap were incorporated as mediating variables to analyze the indirect effect of digital transformation on corporate ESG performance. Hypothesis 2 proposes that digital transformation can indirectly improve corporate ESG performance by enhancing resource allocation efficiency. The mechanism regression outcomes suggest a clear negative linkage between the explanatory variable and resource allocation efficiency. Considering that resource allocation efficiency is an inverse measure, this suggests that digital transformation effectively reduces inefficient resource use and optimizes companies’ resource allocation. Digital practices improve the agility and accuracy of resource allocation in firms by optimizing internal management operations and increasing informational transparency. For instance, digital technologies can enable companies to optimize production schedules, curtail energy usage, and minimize waste, thus freeing up resources for environmental stewardship. In addition, digital tools can facilitate efficient capital allocation by, for instance, helping companies identify investment prospects, optimize their financial structures, and improve governance practices through big data analytics. Enhanced resource allocation, accordingly, offers robust support for corporate efforts in environmental protection, fulfilling social responsibilities, and strengthening governance capabilities, thereby contributing to improved corporate ESG performance. Therefore, resource allocation efficiency functions as a key mediating mechanism through which digital transformation affects corporate ESG performance, thus verifying the theoretical underpinnings of hypothesis H2.
Building upon hypothesis H3, digital transformation has the potential to expand a firm’s technological advantage when its technological level is above the industry average (positive technological gap) and reduce its technological disadvantage when its technological level is below the industry average (negative technological gap), thereby driving improvements in corporate ESG performance. Regression analysis of the underlying mechanism indicates that digital transformation significantly expands a company’s positive technological differential while simultaneously and significantly reducing its negative technological differential, which is calculated as an inverse measure. This suggests that digital practices strengthen a company’s competitive position in its industry by advancing its technological capabilities. More accurately, leveraging digital technologies allows companies to more effectively synthesize internal and external technological resources, finally reaching higher levels of innovation. For instance, intelligent manufacturing technologies can optimize production processes and enhance production efficiency, simultaneously minimizing carbon emissions and resource depletion. Furthermore, the technological advantages acquired during digitalization serve as a catalyst for eco-friendly product innovation, process refinement, and sustainability improvements. As firms narrow their technological disparity relative to industry benchmarks, they not only sustain their market edge but also strengthen their environmental and social responsibility capabilities. Thus, the change in technological gaps is a crucial avenue for the digital transformation to affect the ESG performance of companies through technological upgrading and innovation, which substantiates the theoretical inference of hypothesis H3.
In conclusion, digital transformation has not only a direct influence on the improvement of ESG performance but also can be achieved through two key mechanisms: improving resource allocation efficiency and narrowing the technological gaps. It suggests that digital transformation can comprehensively promote the sustainable development of companies from two aspects: resource optimization and technological upgrading, verifying the theoretical logic of hypotheses H2 and H3.

4.7. Heterogeneity Test

4.7.1. Heterogeneity of Company Size

To further verify the company size heterogeneity impact, we divided the sample into two groups in Table 11, large-scale and small-scale enterprises, classified according to the median enterprise size. Separate regression analyses are then carried out to examine the differences in the effects of explanatory variable in enterprises of different scales.
The empirical results show that the regression coefficient of digital transformation on the ESG score of large-scale enterprises is 0.553, with a significance level of 1%. For small-scale enterprises, the regression coefficient is 0.259, which is also significant at the 1% level. The above results indicate that digital transformation has a stronger promoting effect on the ESG performance of large-scale enterprises. This phenomenon may be due to the fact that large-scale enterprises have greater advantages in terms of resource endowment, technological foundation, and organizational management capabilities, enabling them to more effectively implement and utilize digital transformation technologies. For instance, larger enterprises typically possess greater financial and human resources, enabling them to allocate more effectively toward developing IT infrastructure. At the same time, their complex organizational structures can more easily achieve resource optimization and technological innovation through digital practices, thus more significantly improving their ESG performance. In contrast, due to resources and technological constraints, although digital transformation still has a significant promoting effect on the ESG performance of small-scale enterprises, the effect is relatively weak. This may be because small-scale enterprises face higher costs and technical barriers during the implementation of digitalization. Meanwhile, they lack a complete governance structure and execution capabilities, resulting in the insufficient manifestation of the effects of digital practices.

4.7.2. Industry Heterogeneity

To analyze the industry heterogeneity in the impact of digital transformation on ESG performance, this study classifies the sample into technology-intensive, asset-intensive, and labor-intensive enterprises according to their industry attributes and conducts separate regression analyses in Table 12 to explore the differences in the effects of digital transformation across different industries.
The regression results show that the regression coefficient of digital transformation on the ESG performance of technology-intensive enterprises is 0.488, which is significant at the 1% level, indicating that digitalization has a significant promoting effect on the ESG performance of technology-intensive enterprises. This may be because technology-intensive enterprises can more easily integrate digital technologies with their core businesses and significantly improve their performance in environmental protection, social responsibility, and corporate governance through technological innovation and process optimization. Digital practices in these enterprises can accelerate technological upgrading, promote green innovation, and enhance resource utilization efficiency, thereby promoting enterprises’ ESG performance.
For asset-intensive enterprises, the regression coefficient is 0.636, which is significant at the 5% level, showing that digital transformation has a relatively strong promoting effect on the ESG performance of these enterprises. Asset-intensive enterprises, including those in the manufacturing and energy industries, typically have substantial fixed-asset investments and high operational costs. Digital transformation serves as a key enabler for optimizing asset management in these enterprises by streamlining production processes, reducing resource wastage, and enhancing operational efficiency, thereby significantly improving ESG performance. Moreover, the stringent environmental regulations imposed on asset-intensive industries provide strong incentives for firms to adopt digital technologies to optimize carbon emissions management and strengthen environmental compliance. By contrast, labor-intensive enterprises, such as those in the textile and retail industries, primarily rely on human input, making their production models less adaptable to rapid digital transformation. As a result, the adoption of digital technologies in these industries remains relatively low, and digital transformation has a limited direct impact on their core business operations. This is reflected in the regression results, where the coefficient of digital transformation for labor-intensive enterprises is 0.073 and fails to pass the significance test, indicating that its impact on ESG performance is relatively insignificant. Furthermore, these enterprises typically face lower technological barriers and operate with narrower profit margins, leading them to adopt a more cautious approach to digital investments. Their strategic priorities often focus on cost control and short-term profitability rather than long-term sustainability goals. Consequently, digital transformation has a weaker impact on the ESG performance of labor-intensive enterprises.

4.7.3. Geographic Heterogeneity

To conduct a regional heterogeneity test, we categorize the locations of enterprises into the western region and the central–eastern region in Table 13. Empirical results show that the regression coefficient of digital transformation on the ESG performance of central–eastern enterprises is 0.410, significant at the 1% level, while that of western enterprises is 0.124 and not significant. This indicates a stronger promoting effect in the central and eastern regions. This is likely because the relatively developed central–eastern regions have complete information infrastructure, giving local enterprises technological and information advantages. Thus, they can easily access and apply digital technologies to production, management, and service. The central–eastern regions serve as focal points for government-led digital economy development, with various policy initiatives such as tax incentives, subsidies, and targeted funding programs aimed at fostering enterprise digital transformation. For instance, in the Yangtze River Delta, the government has implemented measures including low-interest loans and direct financial subsidies to alleviate financial constraints, thereby facilitating technological advancement and innovation. Meanwhile, these regions have larger market scales and diverse digital application scenarios, enabling companies to more effectively improve operational efficiency through digital means, thus having a greater impact on ESG performance.
In contrast, western enterprises face capital and technology challenges in digital transformation. Digital transformation needs large upfront investment, but limited regional financing makes it hard for western enterprises to raise enough funds. Insufficient funds restrict transformation ability and may shrink investment scale or extend the cycle, affecting efficiency. Technically, western enterprises face information asymmetry, making it hard to access advanced technologies. With fewer R&D institutions and technical services, they lack technical support, exacerbating technology-acquisition difficulties. So, even with financial support, technical constraints may slow down digital transformation and limit ESG performance improvement.

4.7.4. Technological Heterogeneity

Following the Industry Classification Guidelines for Listed Companies (2012 Revision), the total sample was divided into a high-tech enterprise group and a non-high-tech enterprise group. Regression analyses were conducted separately in Table 14 to examine the differences in the effects of digital transformation on enterprises with different technological levels.
The empirical results indicate that the regression coefficient of digital transformation on the ESG score of high-tech enterprises is 0.468, significant at the 1% level. However, for non-high-tech enterprises, the regression coefficient is 0.212 and is not significant.
This phenomenon might be attributed to the fact that high-tech enterprises are typically at the forefront of technological innovation. They have a leading edge in R&D and the application of new technologies, enabling them to perceive and seize industry trends earlier and integrate the latest digital technologies sooner. As a result, high-tech enterprises can utilize digital tools more effectively, thereby enhancing their ESG performance across multiple dimensions. In terms of environmental efficiency, high-tech enterprises optimize production processes through digital technologies, reducing energy consumption and waste emissions. When it comes to optimizing social responsibility practices, high-tech enterprises can implement social responsibility projects more precisely and efficiently by leveraging digital means. Regarding corporate governance, high-tech enterprises enhance transparency and decision-making efficiency through digital technologies.
Conversely, non-high-tech enterprises may operate in markets with relatively less competitive pressure. Consequently, they may lack market impetus to improve their ESG performance through digital transformation. These enterprises may consider their existing business models sufficient to meet market demands and thus may not actively pursue ESG improvements via digital transformation. This leads to a lack of the necessary impetus for non-high-tech enterprises to enhance their ESG performance.

5. Conclusions and Recommendations

This research focused on Chinese A-share listed firms spanning 2014–2023 as the empirical sample. A multidimensional evaluation framework was developed by integrating the Huazheng ESG rating with textual analysis quantifying digital transformation-related disclosures in annual reports, systematically assessing organizational digitalization’s influence on ESG outcomes. A two-way fixed-effects model was employed to rigorously investigate the mechanisms through which digital transformation shapes corporate ESG performance. The empirical findings substantiate the previously postulated hypotheses and specifically demonstrate that the following:
First, carrying out digital transformation may significantly enhance ESG performance. Moreover, after conducting a series of robustness tests and the endogeneity tests by IV-2SLS method, PSM method, and PSM-DID method, this conclusion remains robust. This conclusion is consistent with studies from Lu, Xu, Zhu and Sun [31], Wang and Esperança [27], Yang et al. [88], and Ding et al. [89], which confirms the mechanism through which companies pursue that of achieving ESG targets through digital transformation.
Second, this paper evaluates the mediating processes of resource allocation efficiency as well as technological gaps whereby digital transformation indirectly promotes the improvement of corporate ESG performance through enhancing resource allocation efficiency (reducing inefficient investment) coupled with narrowing the technological gap (enhancing technological competitiveness), thus indirectly promoting corporate ESG performance. Previous studies have explored other mediating pathways, such as internal control [31], firm market performance [27], analysts’ attention [90], and mitigating agency conflicts [91]. However, our study provides a novel perspective. In comparison to most existing studies that use R&D investment [92] as well as patent quantity [93] to measure the technological level of companies, this research innovatively selected the technological gap across companies, providing more references from a new dimension on how enterprises can achieve ESG in the future.
Third, through heterogeneity analysis, it is found that the impact of digital transformation on enterprises ESG varies significantly in multiple aspects. Research findings indicate that large-scale, technology-intensive, asset-intensive, central–eastern regions, and high-tech enterprises can reap benefits from digital transformation. This finding aligns with Yang, Liu, Meng, Feng, and Chen [57] that organizational structure, company size, and business orientation are crucial internal variables that affect the scope and extent of digital transformation.
This research not only contributes to the theoretical understanding of digital transformation and its multi-dimensional influence on the sustainable development capabilities of companies but also clarifies the practical perspectives for the companies in realizing the importance of technological gaps and resource allocation during digital transformation procedures. It assists companies in making better decisions with respect to the formulation of digital strategies in accordance with existing circumstances, hence offering a theoretical framework to policymakers for more accurate support measures. First and foremost, for company management, it is evident that ESG goals should not be merely focused on but should be regarded as part of the broader strategy of the company’s development. Accordingly, we propose that corporate oversight bodies institute a framework concerning corporate ESG and designate seasoned executives to oversee related activities, for instance, prioritizing the development of personnel with digital expertise and sustainability principles to contribute to corporate ESG goal attainment. Second, firms should produce digital transformation blueprints aligned with ESG objectives for distributing corporate resources and strengthening interdepartmental collaboration. The sales and marketing division can partner with the information technology department to capitalize on the benefits of big data to accurately identify target markets and augment business development capacities. In addition, the compliance department and the planning department can work in close coordination, integrating evolving environmental regulations with corporate development strategies to nimbly address the effects of such policies, effectively reduce financial burdens, and capture market interest. Third, governments should optimize the subsidy framework for ESG policies. For firms with limited willingness or capacity to undergo transformation, “incentive measures” should be implemented to lower entry barriers, providing direct financial support such as green loan interest subsidies or tax reductions, thereby mitigating the high risks associated with the transformation process. For resource-rich firms, policy incentives such as preferential access to government procurement contracts should be implemented to encourage them to drive the technological advancement of lagging firms within their industry’s value chain.
The study has several inherent limitations that warrant attention. First, the measurement of digital adoption predominantly relies on textual indicators derived from corporate disclosures, which may not comprehensively capture the multifaceted nature of enterprise digitalization processes. Future investigations should adopt multidimensional measurement frameworks that integrate technical infrastructure investments, digital talent metrics, and supply chain connectivity indices to enhance construct validity. Similarly, there are certain limitations in the measurement of resource allocation efficiency. The residual may be affected by various factors and is not necessarily entirely caused by inefficient investment. For instance, sudden changes in the market environment may lead to a deviation between the actual and estimated values of an enterprise’s originally reasonable investment plan in the short term. However, this does not necessarily imply that there are issues with the enterprise’s resource allocation. Second, while the empirical analysis focuses on Chinese listed firms—a context with significant sustainability challenges—the generalizability of findings to other institutional environments remains unexplored. Given the global imperative for sustainable development, extending this research agenda to cross-national contexts (e.g., emerging markets versus developed economies) or conducting comparative regional analyses (e.g., Asia-Pacific versus European regulatory regimes) could yield critical insights into boundary conditions and policy adaptability. Finally, it is important to note that the scope of this study does not extend to non-listed enterprises and small and medium-sized enterprises (SMEs). These enterprises are numerous, and their resource endowments, governance models, and policy applicability may differ significantly from those of listed companies. In future research, therefore, the scope of the sample could be expanded to include SMEs and unlisted companies, and the similarities and differences in digital transformation and ESG practices across different types of companies could be explored to provide more comprehensive insights.

Author Contributions

Conceptualization, Y.S. and K.L.; Methodology, Y.S.; Software, Y.S.; Validation, Y.S., K.L. and P.S.; Formal Analysis, Y.S.; Data Curation, Y.S.; Writing—Original Draft Preparation, Y.S.; Writing—Review and Editing, Y.S., K.L. and P.S.; Supervision, K.L. and P.S.; Project Administration, Y.S.; Funding Acquisition, Y.S. All authors have read and agreed to the published version of the manuscript.

Funding

This research received no external funding.

Institutional Review Board Statement

Not applicable.

Informed Consent Statement

Not applicable.

Data Availability Statement

The data presented in this study are available on request from the corresponding author.

Conflicts of Interest

The authors declare no conflicts of interest.

References

  1. Li, K.; Kim, D.J.; Lang, K.R.; Kauffman, R.J.; Naldi, M. How should we understand the digital economy in Asia? Critical assessment and research agenda. Electron Commer. Res. Appl. 2020, 44, 101004. [Google Scholar] [CrossRef]
  2. Shahzad, U.; Fareed, Z.; Shahzad, F.; Shahzad, K. Investigating the nexus between economic complexity, energy consumption and ecological footprint for the United States: New insights from quantile methods. J. Clean. Prod. 2021, 279, 123806. [Google Scholar] [CrossRef]
  3. Mujtaba, A.; Jena, P.K.; Bekun, F.V.; Sahu, P.K. Symmetric and asymmetric impact of economic growth, capital formation, renewable and non-renewable energy consumption on environment in OECD countries. Renew. Sustain. Energy Rev. 2022, 160, 112300. [Google Scholar] [CrossRef]
  4. Ramanna, K. Friedman at 50: Is It Still the Social Responsibility of Business to Increase Profits? Calif. Manag. Rev. 2020, 62, 28–41. [Google Scholar] [CrossRef]
  5. Muir, D.M. Sustainable Investing and Fiduciary Obligations in Pension Funds: The Need for Sustainable Regulation. Am. Bus. Law J. 2022, 59, 621–677. [Google Scholar] [CrossRef]
  6. Yu, Z.; Li, Y.X.; Li, X.L.; Yu, L. Can green finance policy curb corporate ESG report “green washing”? Experiential evidence from Chinese listed companies. Appl. Econ. Lett. 2024, 1–4. [Google Scholar] [CrossRef]
  7. Sun, Y.C.; Tao, Q.Z.; Wang, D.; Zhang, W. Corporate ESG decoupling and R&D investment. North Am. J. Econ. Financ. 2025, 75, 102278. [Google Scholar] [CrossRef]
  8. Baldi, F.; Pandimiglio, A. The role of ESG scoring and greenwashing risk in explaining the yields of green bonds: A conceptual framework and an econometric analysis. Glob. Financ. J. 2022, 52, 100711. [Google Scholar] [CrossRef]
  9. Erhemjamts, O.; Huang, K.R.; Tehranian, H. Climate risk, ESG performance, and ESG sentiment in US commercial banks. Glob. Financ. J. 2024, 59, 100924. [Google Scholar] [CrossRef]
  10. Shanaev, S.; Ghimire, B. When ESG meets AAA: The effect of ESG rating changes on stock returns. Financ. Res. Lett. 2022, 46, 102302. [Google Scholar] [CrossRef]
  11. Mao, Z.H.; Wang, S.Y.; Lin, Y.E. ESG, ESG rating divergence and earnings management: Evidence from China. Corp. Soc. Responsib. Environ. Manag. 2024, 31, 3328–3347. [Google Scholar] [CrossRef]
  12. Chen, Z.F.; Xie, G.X. ESG disclosure and financial performance: Moderating role of ESG investors. Int. Rev. Financ. Anal. 2022, 83, 102291. [Google Scholar] [CrossRef]
  13. Eccles, R.G.; Serafeim, G. The Performance Frontier Innovating for a Sustainable Strategy. Harv. Bus. Rev. 2013, 91, 50. [Google Scholar] [PubMed]
  14. Niinimäki, K.; Peters, G.; Dahlbo, H.; Perry, P.; Rissanen, T.; Gwilt, A. The environmental price of fast fashion. Nat. Rev. Earth Environ. 2020, 1, 189–200. [Google Scholar] [CrossRef]
  15. Reefke, H.; Sundaram, D. Sustainable supply chain management: Decision models for transformation and maturity. Decis. Support Syst. 2018, 113, 56–72. [Google Scholar] [CrossRef]
  16. Sang, Y.; Loganathan, K.; Lin, L. Digital Transformation and Firm ESG Performance: The Mediating Role of Corporate Risk-Taking and the Moderating Role of Top Management Team. Sustainability 2024, 16, 5907. [Google Scholar] [CrossRef]
  17. Sanders, A.; Elangeswaran, C.; Wulfsberg, J. Industry 4.0 implies lean manufacturing: Research activities in industry 4.0 function as enablers for lean manufacturing. J. Ind. Eng. Manag. 2016, 9, 811–833. [Google Scholar] [CrossRef]
  18. Teixeira, J.E.; Tavares-Lehmann, A.T.C.P. Industry 4.0 in the European union: Policies and national strategies. Technol. Forecast. Soc. Change 2022, 180, 121664. [Google Scholar] [CrossRef]
  19. Sturgeon, T.J. Upgrading strategies for the digital economy. Glob. Strategy J. 2019, 11, 34–57. [Google Scholar] [CrossRef]
  20. Wang, K.; Chen, X.; Wang, C.Y. The impact of sustainable development planning in resource-based cities on corporate ESG-Evidence from China. Energy Econ. 2023, 127, 107087. [Google Scholar] [CrossRef]
  21. Tian, L.W.; Li, Y. Double-edged sword effect of independent innovations and foreign cooperation: Evidence from China. J. Technol. Transf. 2017, 42, 1276–1291. [Google Scholar] [CrossRef]
  22. Jin, X.L.; Cui, H.Z.; Liu, F.W.; Hu, Z.Q.; Cai, Y.H. Does cybersecurity regulation promote digital transformation? Evidence from the Cyber Security Law in China. Financ. Res. Lett. 2025, 76, 107041. [Google Scholar] [CrossRef]
  23. Shahim, A. Security of the digital transformation. Comput. Secur. 2021, 108, 102345. [Google Scholar] [CrossRef]
  24. Firk, S.; Hanelt, A.; Oehmichen, J.; Wolff, M. Chief Digital Officers: An Analysis of the Presence of a Centralized Digital Transformation Role. J. Manag. Stud. 2021, 58, 1800–1831. [Google Scholar] [CrossRef]
  25. Li, J.; Wu, T.; Liu, B.; Zhou, M. Can digital transformation enhance corporate ESG performance? The moderating role of dual environmental regulations. Financ. Res. Lett. 2024, 62, 105241. [Google Scholar] [CrossRef]
  26. Zhao, Z. Digital Transformation and Enterprise Risk-Taking. Financ. Res. Lett. 2024, 62, 105139. [Google Scholar] [CrossRef]
  27. Wang, S.; Esperança, J.P. Can digital transformation improve market and ESG performance? Evidence from Chinese SMEs. J. Clean. Prod. 2023, 419, 137980. [Google Scholar] [CrossRef]
  28. Liu, Z.; Zhou, J.; Li, J. How do family firms respond strategically to the digital transformation trend: Disclosing symbolic cues or making substantive changes? J. Bus. Res. 2023, 155, 113395. [Google Scholar] [CrossRef]
  29. Zhao, X.; Cai, L. Digital transformation and corporate ESG: Evidence from China. Financ. Res. Lett. 2023, 58, 104310. [Google Scholar] [CrossRef]
  30. Wang, H.; Jiao, S.; Bu, K.; Wang, Y.; Wang, Y. Digital transformation and manufacturing companies’ ESG responsibility performance. Financ. Res. Lett. 2023, 58, 104370. [Google Scholar] [CrossRef]
  31. Lu, Y.; Xu, C.; Zhu, B.; Sun, Y. Digitalization transformation and ESG performance: Evidence from China. Bus. Strategy Environ. 2023, 33, 352–368. [Google Scholar] [CrossRef]
  32. Liang, S.; Tan, Q. Can the digital economy accelerates China’s export technology upgrading? Based on the perspective of export technology complexity. Technol. Forecast. Soc. Change 2024, 199, 123052. [Google Scholar] [CrossRef]
  33. Lin, B.; Xie, Y. Does digital transformation improve the operational efficiency of Chinese power enterprises? Util. Policy 2023, 82, 101542. [Google Scholar] [CrossRef]
  34. Teng, Y.; Du, A.M.; Lin, B. The mechanism of supply chain efficiency in enterprise digital transformation and total factor productivity. Int. Rev. Financ. Anal. 2024, 96, 103583. [Google Scholar] [CrossRef]
  35. Alkaraan, F.; Albitar, K.; Hussainey, K.; Venkatesh, V.G. Corporate transformation toward Industry 4.0 and financial performance: The influence of environmental, social, and governance (ESG). Technol. Forecast. Soc. Change 2022, 175, 121423. [Google Scholar] [CrossRef]
  36. Erevelles, S.; Fukawa, N.; Swayne, L. Big Data consumer analytics and the transformation of marketing. J. Bus. Res. 2016, 69, 897–904. [Google Scholar] [CrossRef]
  37. Shanmugam, R.K.; Dhingra, T. Outcome-based contracts—Linking technology, ownership and reputations. Int. J. Inf. Manag. 2023, 70, 102624. [Google Scholar] [CrossRef]
  38. Matarazzo, M.; Penco, L.; Profumo, G.; Quaglia, R. Digital transformation and customer value creation in Made in Italy SMEs: A dynamic capabilities perspective. J. Bus. Res. 2021, 123, 642–656. [Google Scholar] [CrossRef]
  39. Freeman, R.E.; Dmytriyev, S.D.; Phillips, R.A. Stakeholder Theory and the Resource-Based View of the Firm. J. Manag. 2021, 47, 1757–1770. [Google Scholar] [CrossRef]
  40. Tabrizi, B.; Lam, E.; Girard, K.; Irvin, V. Digital transformation is not about technology. Harv. Bus. Rev. 2019, 13, 1–6. [Google Scholar]
  41. Matt, C.; Hess, T.; Benlian, A. Digital Transformation Strategies. Bus. Inf. Syst. Eng. 2015, 57, 339–343. [Google Scholar] [CrossRef]
  42. Gillani, F.; Chatha, K.A.; Jajja, S.S.; Cao, D.M.; Ma, X. Unpacking Digital Transformation: Identifying key enablers, transition stages and digital archetypes. Technol. Forecast. Soc. Change 2024, 203, 123335. [Google Scholar] [CrossRef]
  43. Yang, Z.; Gao, W.; Han, Q.; Qi, L.; Cui, Y.; Chen, Y. Digitalization and carbon emissions: How does digital city construction affect china’s carbon emission reduction? Sustain. Cities Soc. 2022, 87, 104201. [Google Scholar] [CrossRef]
  44. Tao, Y.; Lu, H.; Ye, Y.; Wu, H. Does the firms’ digital transformation drive environmental innovation in China? Sustain. Dev. 2023, 32, 2139–2152. [Google Scholar] [CrossRef]
  45. Lin, B.Q.; Zhang, Q.X. Corporate environmental responsibility in polluting firms: Does digital transformation matter? Corp. Soc. Responsib. Environ. Manag. 2023, 30, 2234–2246. [Google Scholar] [CrossRef]
  46. Evans, S.; Vladimirova, D.; Holgado, M.; Van Fossen, K.; Yang, M.Y.; Silva, E.A.; Barlow, C.Y. Business Model Innovation for Sustainability: Towards a Unified Perspective for Creation of Sustainable Business Models. Bus. Strategy Environ. 2017, 26, 597–608. [Google Scholar] [CrossRef]
  47. Mahajan, R.; Lim, W.M.; Sareen, M.; Kumar, S.; Panwar, R. Stakeholder theory. J. Bus. Res. 2023, 166, 114104. [Google Scholar] [CrossRef]
  48. Zhang, M.; Tong, L.; Su, J.; Cui, Z. Analyst coverage and corporate social performance: Evidence from China. Pac. Basin Financ. J. 2015, 32, 76–94. [Google Scholar] [CrossRef]
  49. Brammer, S.; Pavelin, S. Factors influencing the quality of corporate environmental disclosure. Bus. Strategy Environ. 2006, 17, 120–136. [Google Scholar] [CrossRef]
  50. Ready, D.A.; Conger, J.A. Make your company a talent factory. Harv. Bus. Rev. 2007, 85, 68. [Google Scholar]
  51. Makarius, E.E.; Srinivasan, M. Addressing skills mismatch: Utilizing talent supply chain management to enhance collaboration between companies and talent suppliers. Bus. Horiz. 2017, 60, 495–505. [Google Scholar] [CrossRef]
  52. Wehrle, M.; Lechler, S.; von der Gracht, H.A.; Hartmann, E. Digitalization and its Impact on the Future Role of SCM Executives in Talent Management—An International Cross-Industry Delphi Study. J. Bus. Logist. 2020, 41, 356–383. [Google Scholar] [CrossRef]
  53. Jiang, W.; Li, J. Digital transformation and its effect on resource allocation efficiency and productivity in Chinese corporations. Technol. Soc. 2024, 78, 102638. [Google Scholar] [CrossRef]
  54. Ding, X.; Vuković, D.B.; Sokolov, B.I.; Vukovic, N.; Liu, Y. Enhancing ESG performance through digital transformation: Insights from China’s manufacturing sector. Technol. Soc. 2024, 79, 102753. [Google Scholar] [CrossRef]
  55. Hanelt, A.; Bohnsack, R.; Marz, D.; Marante, C.A. A systematic review of the literature on digital transformation: Insights and implications for strategy and organizational change. J. Manag. Stud. 2021, 58, 1159–1197. [Google Scholar]
  56. Li, L.; Zhu, W.; Wei, L.; Liu, Y.; Jiang, N. Digital technology-enabled carbon-neutral management: A mechanism of supply chain digitalization in carbon performance. Technol. Forecast. Soc. Change 2025, 210, 123834. [Google Scholar] [CrossRef]
  57. Yang, H.; Liu, X.; Meng, Y.; Feng, B.; Chen, Z. Digital transformation and the allocation of decision-making rights within business groups—Empirical evidence from China. J. Bus. Res. 2024, 179, 114715. [Google Scholar] [CrossRef]
  58. Ode, E.; Ayavoo, R. The mediating role of knowledge application in the relationship between knowledge management practices and firm innovation. J. Innov. Knowl. 2020, 5, 209–217. [Google Scholar] [CrossRef]
  59. Xiao, S.Y.; Xu, J.J.; Li, R. Are digital trends driving corporate environmental, social, and governance practices? Evidence from China. Bus. Strategy Environ. 2024, 33, 5366–5385. [Google Scholar] [CrossRef]
  60. Zhou, H.L.; Liu, J. Digitalization of the economy and resource efficiency for meeting the ESG goals. Resour. Policy 2023, 86, 104199. [Google Scholar] [CrossRef]
  61. Liu, K.; Liu, X.M.; Wu, Z.H. Nexus between Corporate Digital Transformation and Green Technological Innovation Performance: The Mediating Role of Optimizing Resource Allocation. Sustainability 2024, 16, 1318. [Google Scholar] [CrossRef]
  62. Aharonson, B.S.; Schilling, M.A. Mapping the technological landscape: Measuring technology distance, technological footprints, and technology evolution. Res. Policy 2016, 45, 81–96. [Google Scholar] [CrossRef]
  63. Xie, H.J.; Wu, F.Q. Artificial Intelligence Technology and Corporate ESG Performance: Empirical Evidence from Chinese-Listed Firms. Sustainability 2025, 17, 420. [Google Scholar] [CrossRef]
  64. Zhang, Y.; Sun, Z.Y.; Sheng, A.Q.; Zhang, L.Y.; Kan, Y.W. Can green technology mergers and acquisitions enhance sustainable development? Evidence from ESG ratings. Sustain. Dev. 2024, 32, 6072–6087. [Google Scholar] [CrossRef]
  65. Asif, M.; Searcy, C.; Castka, P. ESG and Industry 5.0: The role of technologies in enhancing ESG disclosure. Technol. Forecast. Soc. Change 2023, 195, 122806. [Google Scholar] [CrossRef]
  66. Qi, Y.D.; Han, M.M.; Zhang, C. The Synergistic Effects of Digital Technology Application and ESG Performance on Corporate Performance. Financ. Res. Lett. 2024, 61, 105007. [Google Scholar] [CrossRef]
  67. Rogers, E.M.; Singhal, A.; Quinlan, M.M. Diffusion of innovations. In An Integrated Approach to Communication Theory and Research; Routledge: Abingdon, UK, 2014; pp. 432–448. [Google Scholar]
  68. Kretschmer, T.; Khashabi, P. Digital Transformation and Organization Design: An Integrated Approach. Calif. Manag. Rev. 2020, 62, 86–104. [Google Scholar] [CrossRef]
  69. Peng, Y.; Tao, C. Can digital transformation promote enterprise performance?—From the perspective of public policy and innovation. J. Innov. Knowl. 2022, 7, 100198. [Google Scholar] [CrossRef]
  70. Fang, X.; Liu, M. How does the digital transformation drive digital technology innovation of enterprises? Evidence from enterprise’s digital patents. Technol. Forecast. Soc. Change 2024, 204, 123428. [Google Scholar] [CrossRef]
  71. Yang, X.Y.; Li, Z.J.; Qiu, Z.X.; Wang, J.M.; Liu, B. ESG performance and corporate technology innovation: Evidence from China. Technol. Forecast. Soc. Change 2024, 206, 123520. [Google Scholar] [CrossRef]
  72. Ancillo, A.D.; Gavrila, S.G. The Impact of Research and Development on Entrepreneurship, Innovation, Digitization and Digital transformation. J. Bus. Res. 2023, 157, 113566. [Google Scholar] [CrossRef]
  73. Hall, B.H.; Mairesse, J.; Mohnen, P. Measuring the Returns to R&D. In Handbook of the Economics of Innovation; Hall, B.H., Rosenberg, N., Eds.; Elsevier: Amsterdam, The Netherlands, 2010; Volume 2, pp. 1033–1082. [Google Scholar]
  74. Liu, Y.; Dong, J.; Mei, L.; Shen, R. Digital innovation and performance of manufacturing firms: An affordance perspective. Technovation 2023, 119, 102458. [Google Scholar] [CrossRef]
  75. Fichman, R.G.; Dos Santos, B.L.; Zheng, Z. Digital innovation as a fundamental and powerful concept in the information systems curriculum. MIS Q. 2014, 38, 329–354. [Google Scholar]
  76. Rippa, P.; Secundo, G. Digital academic entrepreneurship: The potential of digital technologies on academic entrepreneurship. Technol. Forecast. Soc. Change 2019, 146, 900–911. [Google Scholar] [CrossRef]
  77. Gaglio, C.; Kraemer-Mbula, E.; Lorenz, E. The effects of digital transformation on innovation and productivity: Firm-level evidence of South African manufacturing micro and small enterprises. Technol. Forecast. Soc. Change 2022, 182, 121785. [Google Scholar] [CrossRef]
  78. Zhang, T.; Shi, Z.-Z.; Shi, Y.-R.; Chen, N.-J. Enterprise digital transformation and production efficiency: Mechanism analysis and empirical research. Econ. Res. Ekon. Istraživanja 2021, 35, 2781–2792. [Google Scholar] [CrossRef]
  79. Nasiri, M.; Ukko, J.; Saunila, M.; Rantala, T. Managing the digital supply chain: The role of smart technologies. Technovation 2020, 96–97, 102121. [Google Scholar] [CrossRef]
  80. Lai, Y.-L.; Lin, F.-J. The Effects of Knowledge Management and Technology Innovation on New Product Development Performance An Empirical Study of Taiwanese Machine Tools Industry. Procedia Soc. Behav. Sci. 2012, 40, 157–164. [Google Scholar] [CrossRef]
  81. Feng, J.; Goodell, J.W.; Shen, D. ESG rating and stock price crash risk: Evidence from China. Financ. Res. Lett. 2022, 46, 102476. [Google Scholar]
  82. Zhen, H.; Wang, X.; Fang, H. Administrative Protection of Intellectual Property Rights and Corporate Digital Transformation. Econ. Res. J. 2023, 11, 62–79. [Google Scholar]
  83. Richardson, S. Over-investment of free cash flow. Rev. Account. Stud. 2006, 11, 159–189. [Google Scholar] [CrossRef]
  84. Aghion, P.; Blundell, R.; Griffith, R.; Howitt, P.; Prantl, S. The Effects of Entry on Incumbent Innovation and Productivity. Rev. Econ. Stat. 2009, 91, 20–32. [Google Scholar] [CrossRef]
  85. Jiang, T. Mediating Effects and Moderating Effects in Causal Inference. China Ind. Econ. 2022, 05, 100–120. [Google Scholar] [CrossRef]
  86. Fei, W.; Huizhi, H.; Huiyan, L.; Xiaoyi, R. Enterprise digital transformation and capital market performance: Empirical evidence from stock liquidity. J. Manag. World 2021, 37, 130–144. [Google Scholar] [CrossRef]
  87. Zhao, C.; Wang, W.; Li, X. How Does Digital Transformation Affect the Total Factor Productivity of Enterprises? Financ. Trade Econ. 2021, 42, 114–129. [Google Scholar] [CrossRef]
  88. Yang, Y.; Han, J.; Management, E. Digital transformation, financing constraints, and corporate environmental, social, and governance performance. Corp. Soc. Responsib. Environ. Manag. 2023, 30, 3189–3202. [Google Scholar]
  89. Ding, X.; Sheng, Z.; Appolloni, A.; Shahzad, M.; Han, S. Environment, Digital transformation, ESG practice, and total factor productivity. Bus. Strategy Environ. 2024, 33, 4547–4561. [Google Scholar]
  90. Cai, C.; Tu, Y.Q.; Li, Z. Enterprise digital transformation and ESG performance. Financ. Res. Lett. 2023, 58, 104692. [Google Scholar] [CrossRef]
  91. Li, Y.X.; Zheng, Y.X.; Li, X.S.; Mu, Z. The impact of digital transformation on ESG performance. Int. Rev. Econ. Financ. 2024, 96, 103686. [Google Scholar] [CrossRef]
  92. Awaworyi Churchill, S.; Inekwe, J.; Smyth, R.; Zhang, X. R&D intensity and carbon emissions in the G7: 1870–2014. Energy Econ. 2019, 80, 30–37. [Google Scholar] [CrossRef]
  93. Li, S.; Gao, L.; Han, C.; Gupta, B.; Alhalabi, W.; Almakdi, S. Exploring the effect of digital transformation on Firms’ innovation performance. J. Innov. Knowl. 2023, 8, 100317. [Google Scholar] [CrossRef]
Figure 1. Theoretical framework.
Sustainability 17 03308 g001
Figure 2. Keywords related to digital transformation.
Sustainability 17 03308 g002
Table 1. Definition of variables in Equation (1).
VariableMeaningCalculation Method
I n v i , t Actual new investment expenditures of a company in year tCash payments for acquiring and developing property, plant, and equipment, intangible assets, and other non-current assets, plus net cash disbursements for the purchase of subsidiaries and other business units, less cash proceeds from the sale of property, plant, and equipment, intangible assets, and other non-current assets, less net cash proceeds from the divestiture of subsidiaries and other business units, lesser sum of depreciation of property, plant, and equipment, amortization of intangible assets, and amortization of long-term deferred charges, as a proportion of total assets at the period beginning.
L e v t 1 Financial leverage ratio in year t − 1Asset liability ratio
G r o w t h t 1 Growth opportunities for a company in year t − 1Tobin Q.
S i z e t 1 Asset size in year t − 1Natural logarithm of total assets.
C a s h t 1 Cash flow status of a company in year t − 1Net cash flows from operating activities/total assets at the beginning of the year.
R t 1 Stock return rate for year t − 1Consider the annual individual stock return rate of cash dividend reinvestment.
A g e t 1 The age of a company in year t − 1Listing period = observation year − IPO year.
ΣYearYear dummy variable
ΣIndustryIndustry dummy variables
Table 2. Definition of key variables.
Variable TypeVariable NameVariable SymbolVariable Definition
Dependent variablesESG performanceESGA Huazhong Securities ESG rating (1–9 scores) is employed, where higher scores indicate stronger ESG performance.
Mechanism variablesResource allocation efficiencyEfficiencyThe Richardson model assesses a company’s capacity for resource allocation optimization.
Technological gapsTechGapThe ratio of company labor productivity to industry labor productivity indicates technological advantages when exceeding 1 and disadvantages when below 1.
Explanatory variablesDigital transformationDigA dedicated index measures the extent of corporate digital transformation.
Control variablesCompany sizeSizeThe natural logarithm of year-end total assets acts as a proxy for company size.
Asset liability ratioLevThe ratio of year-end liabilities to year-end total assets describes a company’s capital structure.
Revenue growth rateGrowthYear-over-year revenue growth is calculated as the current year’s operating revenue divided by the prior year’s operating revenue, less 1.
Net profit margin of total assetsROAProfitability is measured by net profit divided by the average total assets.
Shareholding ratio of the largest shareholderTOP1Equity concentration is represented by the ratio of the largest shareholder’s holdings to total shares outstanding.
Number of directorsBoardThe natural logarithm of the number of board members offers a measure of corporate governance structure.
Proportion of independent directorsIndepBoard independence is reflected in the proportion of independent directors on the board.
Degree of power balanceBalanceThe ratio of the second-largest shareholder’s stake to the largest shareholder’s stake indicates the balance of equity ownership.
Whether it is a state-owned enterpriseSOEState ownership is designated as 1, while other ownership structures are designated as 0.
Industry fixed effectIndIndustry dummy variables control for the effects of industry characteristics on the analysis.
Year fixed effectYearYear dummy variables control temporal systematic variation.
Table 3. Descriptive statistics.
VarNameObsMeanSDMinMedianMax
ESG27,9094.1170.9561.0004.0006.7500
Efficiency27,9090.0390.0510.0000.0230.5735
TechGap27,9091.0010.7780.1140.7814.8975
Dig27,9090.0610.1010.0000.0190.5577
Size27,90922.4291.29919.68722.24326.5158
Lev27,9090.4350.2020.0530.4280.9404
Growth27,9090.1310.378−0.6600.0803.7051
ROA27,9090.0320.070−0.3880.0330.2384
TOP127,9090.3290.1460.0750.3050.7525
Board27,9092.1100.1971.6092.1972.7081
Indep27,90937.8345.42130.77036.36060.0000
Balance27,9090.3710.2850.0090.2930.9974
SOE27,9090.3650.4820.0000.0001.0000
Table 4. Correlation analysis.
ESGEfficiencyTechGapDigSizeLevGrowthROATOP1BoardIndepBalanceSOE
ESG1
Efficiency−0.094 ***1
TechGap0.076 ***−0.036 ***1
Dig0.076 ***−0.015 **0.129 ***1
Size0.254 ***−0.124 ***0.267 ***−0.094 ***1
Lev−0.093 ***−0.050 ***0.145 ***−0.092 ***0.465 ***1
Growth−0.001000.192 ***0.117 ***0.005000.045 ***0.022 ***1
ROA0.226 ***0.068 ***0.095 ***−0.056 ***0.077 ***−0.341 ***0.266 ***1
TOP10.111 ***−0.029 ***0.054 ***−0.153 ***0.214 ***0.038 ***0.010 *0.159 ***1
Board0.032 ***−0.047 ***0.038 ***−0.090 ***0.272 ***0.129 ***0.005000.040 ***0.036 ***1
Indep0.062 ***0.021 ***0.01000.056 ***−0.015 ***−0.00900−0.00900−0.022 ***0.030 ***−0.569 ***1
Balance−0.002000.023 ***−0.017 ***0.072 ***−0.050 ***−0.044 ***0.020 ***−0.035 ***−0.598 ***0.019 ***−0.011 *1
SOE0.055 ***−0.096 ***0.101 ***−0.125 ***0.315 ***0.233 ***−0.044 ***−0.053 ***0.251 ***0.249 ***−0.052 ***−0.176 ***1
Robust t-statistics in parentheses *** p < 0.01, ** p < 0.05, and * p < 0.1.
Table 5. Baseline regression test results.
(1)(2)(3)
VARIABLESESGESGESG
Dig0.726 ***0.980 ***0.402 ***
(13.102)(18.451)(6.038)
Size 0.240 ***0.258 ***
(45.806)(47.810)
Lev −0.870 ***−0.981 ***
(−25.317)(−28.116)
Growth −0.134 ***−0.105 ***
(−8.339)(−6.582)
ROA 2.086 ***2.031 ***
(21.138)(20.774)
TOP1 0.412 ***0.493 ***
(8.642)(10.367)
Board 0.0030.097 ***
(0.091)(2.749)
Indep 0.011 ***0.012 ***
(9.104)(9.831)
Balance 0.150 ***0.163 ***
(6.441)(7.150)
SOE 0.0170.056 ***
(1.391)(4.406)
Constant4.073 ***−1.621 ***−2.208 ***
(608.621)(−12.222)(−16.185)
Observations27,90927,90927,909
R-squared0.0060.1530.216
YearNONOYES
IndNONOYES
Robust t-statistics in parentheses *** p < 0.01.
Table 6. Robustness test.
(1)(2)(3)(4)(5)
Substitute Dependent VariableSubstitute Explanatory VariableExclude Special SamplesInteractive Fixed Effects
VARIABLESESG1ESGESGESGESG
Dig1.887 *** 0.346 ***0.328 ***
(3.209) (5.151)(4.665)
Dig1 0.457 ***
(4.560)
Dig2 0.383 ***
(8.937)
Size1.214 ***0.259 ***0.258 ***0.257 ***0.262 ***
(22.745)(47.934)(47.899)(46.905)(46.320)
Lev2.413 ***−0.981 ***−0.992 ***−0.967 ***−0.940 ***
(7.078)(−28.118)(−28.488)(−27.514)(−25.288)
Growth−0.235 *−0.105 ***−0.104 ***−0.125 ***−0.081 ***
(−1.673)(−6.586)(−6.523)(−7.740)(−4.668)
ROA1.2862.028 ***2.002 ***1.891 ***2.121 ***
(1.483)(20.724)(20.502)(19.176)(19.927)
TOP1−0.7470.490 ***0.481 ***0.431 ***0.430 ***
(−1.560)(10.318)(10.144)(8.905)(8.671)
Board0.5480.095 ***0.093 ***0.093 ***0.103 ***
(1.575)(2.699)(2.636)(2.579)(2.870)
Indep0.0010.012 ***0.012 ***0.011 ***0.013 ***
(0.058)(9.873)(9.783)(9.413)(10.742)
Balance−0.2250.164 ***0.160 ***0.140 ***0.144 ***
(−0.984)(7.181)(7.033)(6.023)(6.090)
SOE0.455 ***0.055 ***0.055 ***0.036 ***0.074 ***
(3.649)(4.318)(4.351)(2.748)(5.392)
Constant−0.607−2.207 ***−2.202 ***−2.134 ***−2.356 ***
(−0.442)(−16.181)(−16.157)(−15.235)(−16.762)
Observations27,90927,90927,90924,81226,543
R-squared0.4170.2150.2170.2200.352
YearYESYESYESYESYES
IndYESYESYESYESYES
Ind*YearNONONONOYES
CityNONONONOYES
City*YearNONONONOYES
Robust t-statistics in parentheses *** p < 0.01, and * p < 0.1.
Table 7. IV-2SLS test results.
(1)(2)
FirstSecond
VARIABLESDigESG
IV0.533 ***
(38.038)
Dig 2.338 ***
(7.727)
Size0.004 ***0.247 ***
(9.513)(44.089)
Lev−0.009 ***−0.957 ***
(−3.057)(−27.716)
Growth0.001−0.107 ***
(0.589)(−7.341)
ROA−0.027 ***2.096 ***
(−3.562)(23.521)
TOP1−0.044 ***0.560 ***
(−10.486)(11.343)
Board−0.0010.105 ***
(−0.493)(2.996)
Indep0.000 ***0.011 ***
(2.843)(9.325)
Balance−0.008 ***0.176 ***
(−4.192)(7.568)
SOE−0.007 ***0.072 ***
(−6.746)(5.577)
Constant−0.089 ***−2.541 ***
(−6.413)(−15.637)
Observations27,90927,909
R-squared 0.192
Anderson canon. corr. LM statistic 1380.111
Cragg–Donald Wald F statistic1446.914
YearYESYES
IndYESYES
t-statistics in parentheses *** p < 0.01.
Table 8. PSM test results.
(1)(2)(3)
VARIABLESESGESGESG
Dig0.625 ***0.950 ***0.339 ***
(8.137)(12.916)(3.686)
Size 0.242 ***0.258 ***
(33.792)(34.965)
Lev −0.827 ***−0.947 ***
(−17.704)(−20.010)
Growth −0.123 ***−0.088 ***
(−5.551)(−3.980)
ROA 2.036 ***1.963 ***
(14.975)(14.513)
TOP1 0.406 ***0.512 ***
(6.254)(7.914)
Board 0.0040.112 **
(0.082)(2.311)
Indep 0.011 ***0.012 ***
(6.591)(7.172)
Balance 0.134 ***0.160 ***
(4.150)(5.048)
SOE 0.0040.047 ***
(0.231)(2.709)
Constant4.072 ***−1.665 ***−2.254 ***
(444.673)(−9.123)(−11.980)
Observations15,19115,19115,190
R-squared0.0040.1440.209
YearNONOYES
IndNONOYES
Robust t-statistics in parentheses *** p < 0.01, ** p < 0.05.
Table 9. PSM-DID test results.
(1)(2)(3)
VARIABLESESGESGESG
DID0.088 ***0.085 ***0.037 **
(4.850)(5.055)(2.176)
Size 0.229 ***0.253 ***
(27.097)(29.071)
Lev −0.873 ***−0.964 ***
(−15.740)(−17.137)
Growth −0.114 ***−0.096 ***
(−4.392)(−3.763)
ROA 2.068 ***2.083 ***
(12.897)(13.074)
TOP1 0.271 ***0.401 ***
(3.590)(5.254)
Board 0.0810.188 ***
(1.387)(3.283)
Indep 0.012 ***0.014 ***
(6.214)(7.098)
Balance 0.118 ***0.136 ***
(3.095)(3.656)
SOE −0.0110.043 **
(−0.582)(2.164)
Constant4.055 ***−1.498 ***−2.343 ***
(318.488)(−6.999)(−10.541)
Observations11,11311,11311,110
R-squared0.0020.1370.210
YearNONOYES
IndNONOYES
Robust t-statistics in parentheses *** p < 0.01, ** p < 0.05.
Table 10. Resource allocation efficiency and technology gap.
(1)(2)(3)
Resource Allocation EfficiencyPositive Technological GapsNegative Technological Gaps
VARIABLESEfficiencyTechGapTechGap
Dig−0.009 **0.310 ***0.215 ***
(−2.254)(3.204)(10.234)
Size−0.005 ***0.076 ***0.059 ***
(−14.164)(9.019)(33.774)
Lev0.014 ***0.259 ***0.079 ***
(6.281)(4.420)(7.759)
Growth0.022 ***0.156 ***0.024 ***
(12.896)(6.555)(4.889)
ROA0.022 ***0.647 ***0.431 ***
(3.657)(4.253)(15.757)
TOP10.0020.251 ***−0.014
(0.928)(3.352)(−0.968)
Board−0.003−0.205 ***−0.064 ***
(−1.492)(−4.029)(−6.205)
Indep0.000 ***−0.005 ***−0.001 **
(2.853)(−2.795)(−2.473)
Balance0.004 ***−0.0090.000
(3.122)(−0.242)(0.046)
SOE−0.008 ***0.075 ***0.015 ***
(−11.734)(3.748)(4.056)
Constant0.139 ***0.338 *−0.615 ***
(17.283)(1.656)(−13.957)
Observations27,909993617,973
R-squared0.1270.1360.238
YearYESYESYES
IndYESYESYES
Robust t-statistics in parentheses *** p < 0.01, ** p < 0.05, and * p < 0.1.
Table 11. Heterogeneity test results of company size.
(1)(2)
Large-Scale CompanySmall-Scale Company
VARIABLESESGESG
Dig0.553 ***0.259 ***
(5.179)(3.033)
Size0.313 ***0.258 ***
(35.255)(18.677)
Lev−0.908 ***−0.991 ***
(−16.521)(−21.642)
Growth−0.142 ***−0.077 ***
(−6.391)(−3.442)
ROA2.496 ***1.835 ***
(15.288)(15.070)
TOP10.444 ***0.518 ***
(6.629)(7.560)
Board0.0480.176 ***
(1.009)(3.445)
Indep0.013 ***0.009 ***
(8.299)(4.921)
Balance0.143 ***0.143 ***
(4.288)(4.527)
Constant−3.504 ***−2.190 ***
(−16.849)(−6.792)
SUSET 4.25 **
Observations13,95013,955
R-squared0.2300.181
YearYESYES
IndYESYES
Robust t-statistics in parentheses *** p < 0.01, ** p < 0.05.
Table 12. Industry heterogeneity test results.
(1)(2)(3)
Technology-Intensive CompanyAsset-Intensive CompanyLabor-Intensive Company
VARIABLESESGESGESG
Dig0.487 ***0.636 **0.073
(6.248)(2.064)(0.535)
Size0.256 ***0.216 ***0.282 ***
(31.843)(17.481)(30.819)
Lev−0.924 ***−1.028 ***−0.990 ***
(−18.106)(−12.241)(−16.807)
Growth−0.148 ***−0.103 ***−0.056 **
(−5.823)(−2.721)(−2.261)
ROA2.489 ***1.555 ***1.610 ***
(17.905)(5.831)(9.870)
TOP10.474 ***0.783 ***0.410 ***
(6.823)(6.943)(5.097)
Board0.167 ***0.197 **−0.038
(3.298)(2.293)(−0.653)
Indep0.010 ***0.014 ***0.012 ***
(5.949)(4.760)(6.405)
Balance0.191 ***0.280 ***0.101 **
(5.995)(5.045)(2.464)
SOE−0.039 **0.0360.175 ***
(−2.030)(1.220)(8.363)
Constant−2.223 ***−1.787 ***−2.467 ***
(−10.913)(−5.743)(−10.952)
Observations13,02353469540
R-squared0.2070.1820.264
YearYESYESYES
IndYESYESYES
Robust t-statistics in parentheses *** p < 0.01, ** p < 0.05.
Table 13. Heterogeneity test results of company geographic.
(1)(2)
Western CompanyCentral–Eastern Company
VARIABLESESGESG
Dig0.1240.410 ***
(0.468)(5.980)
Size0.270 ***0.256 ***
(17.959)(43.899)
Lev−1.103 ***−0.950 ***
(−12.820)(−24.859)
Growth−0.114 ***−0.105 ***
(−2.708)(−6.148)
ROA1.500 ***2.105 ***
(5.691)(19.947)
TOP1−0.257 *0.602 ***
(−1.904)(11.803)
Board−0.0210.131 ***
(−0.222)(3.421)
Indep0.014 ***0.011 ***
(4.592)(8.724)
Balance−0.0180.183 ***
(−0.295)(7.463)
SOE0.058 *0.052 ***
(1.767)(3.773)
Constant−2.308 ***
(−6.102)(−15.300)
Observations389124,018
R-squared0.2500.218
YearYESYES
Robust t-statistics in parentheses *** p < 0.01, * p < 0.1.
Table 14. Heterogeneity test results of company technological levels.
(1)(2)
High-Tech CompanyNon-High-Tech Company
VARIABLESESGESG
Dig0.468 ***0.212
(6.361)(1.379)
Size0.239 ***0.285 ***
(32.962)(34.981)
Lev−0.927 ***−1.038 ***
(−20.316)(−19.221)
Growth−0.144 ***−0.056 **
(−6.506)(−2.460)
ROA2.221 ***1.642 ***
(18.268)(9.820)
TOP10.566 ***0.352 ***
(9.030)(4.801)
Board0.197 ***−0.029
(4.167)(−0.544)
Indep0.011 ***0.013 ***
(6.779)(7.101)
Balance0.174 ***0.137 ***
(6.001)(3.693)
SOE−0.0220.168 ***
(−1.321)(8.679)
Constant−1.968 ***
(−10.598)(−12.761)
Observations16,50211,407
R-squared0.1850.269
YearYESYES
Robust t-statistics in parentheses. *** p < 0.01, ** p < 0.05.
Disclaimer/Publisher’s Note: The statements, opinions and data contained in all publications are solely those of the individual author(s) and contributor(s) and not of MDPI and/or the editor(s). MDPI and/or the editor(s) disclaim responsibility for any injury to people or property resulting from any ideas, methods, instructions or products referred to in the content.

