Article

Settlement Expansion Versus Environmental Protection: Ecosystem Services for Environmental Regulation Planning in Izmir, Turkiye

by
Esra Kut Görgün
1 and
Stefano Salata
2,*
1
Independent Researcher, 35390 Izmir, Turkey
2
Department of Architecture and Urban Studies, Politecnico di Milano, 20133 Milan, Italy
*
Author to whom correspondence should be addressed.
Sustainability 2025, 17(7), 3237; https://doi.org/10.3390/su17073237
Submission received: 28 February 2025 / Revised: 30 March 2025 / Accepted: 2 April 2025 / Published: 5 April 2025
(This article belongs to the Special Issue Sustainable Land Management: Urban Planning and Land Use)

Abstract

:
Land use and planning decisions, such as the designation of urban development areas, have a significant impact on ecosystem services (Ess). In urban planning, it is essential to consider the environmental values of ecosystem services when determining urban development zones. Spatial analyses play a crucial role in guiding decision-making processes by balancing environmental value and urban expansion. This study aims to identify areas of alignment or conflict between environmental values derived from ecosystem services and settlement expansion zones according to the Environmental Regulation Plan in the Izmir metropolitan area. The study employs the InVEST® (Integrated Valuation of Ecosystem Services and Trade-offs) model and Geographic Information Systems (GIS) to map ecosystem services. Environmental values derived from ecosystem services, such as habitat quality, carbon storage and sequestration, and sediment delivery ratio, were analyzed. The results demonstrate a trade-off between high environmental values and settlement expansion zones. The five largest conflict areas with high environmental value are located near the coast and were converted from shrubland and forest areas. This study underscores the importance of identifying and prioritizing conservation sites with high composite environmental value.

1. Introduction

Urban expansion and environmental protection represent competing priorities in spatial planning processes, particularly in rapidly developing metropolitan regions [1]. As cities grow, land use and land cover change intensify, placing increasing pressure on natural ecosystems and the critical services they provide to human communities [2]. In this context, reconciling the demand for urban development with the need to preserve ecological integrity stands a pressing challenge for planners and policymakers worldwide [3].
To address this balance between ecological preservation and urban expansion, planners have increasingly integrated Green Infrastructure as a multifunctional tool for sustainable spatial development. Green Infrastructure (GI) is defined as a planned network of a wide range of ecosystem services to provide help with climate mitigation and adaptation [4]. Green Infrastructure is designed to reduce the environmental effects of land take, alongside tools like Urban Growth Boundaries, Net Environmental Benefit Analysis, and development cost assessments, and provides an advanced framework for managing urban growth, mitigating land consumption, and enhancing urban resilience [5,6].
Within the European Union (EU), implementing GI has become a cornerstone of urban adaptation strategies; in fact, the EU has prioritized GI as a key element in its efforts to achieve climate neutrality and protect natural habitats [7,8]. On 6 May 2013, the European Commission adopted an EU-wide strategy promoting investments in ecosystem services (Ess) and GI to address the increasing risks posed by climate change and integrate these approaches into urban spatial planning [9].
Ecosystem services are defined as the benefits provided by nature’s functioning, ranging from provisioning services (e.g., food, water, and materials) to regulating services (e.g., climate and water regulation, pollination), and cultural services (e.g., recreation, esthetic value, and inspiration) [10,11]. Ecosystem services modeling has become a powerful approach for understanding the complex interactions between socio-ecological and technological systems, enabling planners to incorporate biophysical assessments into land use decisions [12,13,14]. Integrating multifunctional ES assessments into land use planning marks a significant step toward sustainability. These assessments, typically represented as composite index scores, inform land use suitability analyses, ensuring environmentally sound transformations [15]. By linking urban development with ecological functionality, GI and Nature Based Solutions (NBS) contribute to long-term urban resilience and sustainable growth [16,17,18].
In planning processes, the trade-off analysis of ES helps to define optimal decisions by evaluating the costs and benefits of different ecosystem services [19]. Therefore, incorporating ES into planning processes is essential for ensuring environmental sustainability and equitable development. Although environmental planning offers practical methods to integrate ecosystem services, spatial planning science has yet to fully engage with the ecosystem services discourse due to its practice challenges in planning [20,21]. ES provides benefits to human communities in categories; regulating, provisioning, habitat, and cultural services [19,20,21,22]. Ecosystem assessment to integrate in planning plays a vital role in sustainability and climate goals. Sustainable ecosystem services have interaction with land use and land cover [19]. Also, integrating ecosystem services into planning processes helps to reveal potential trade-offs and contributes to more transparent and informed prioritization [23].
Recently developed ecosystem services tools have been designed to inform multiple policy sectors and support their integration into spatial planning, but the concept of ES remains poorly operationalized in many developing countries and at the global level [24]. In addition, there is still limited practical guidance on how ecosystem services should be systematically incorporated into land use and environmental planning processes [25]. The absence of well-defined frameworks underscores a significant research gap and reinforces the need for new studies that explore practical methods for applying ecosystem services in real-world planning contexts.
In Turkiye, considerable uncertainty surrounds both the location and nature of future urban expansion [3]. Also, urban and environmental planning operates within a complex, multi-level framework encompassing national, regional, and local authorities. However, constant institutional changes and overlapping responsibilities have led to difficulties in ensuring policy cohesion. For example, shifts in governance structures such as expanding metropolitan boundaries and redefining rural areas have increasingly blurred the line between urban and rural zones, contributing to rapid urban sprawl. The lack of an integrated, large-scale planning strategy and the tendency to adopt fragmented approaches have made it challenging to reconcile market-driven urban expansion with environmental sustainability.
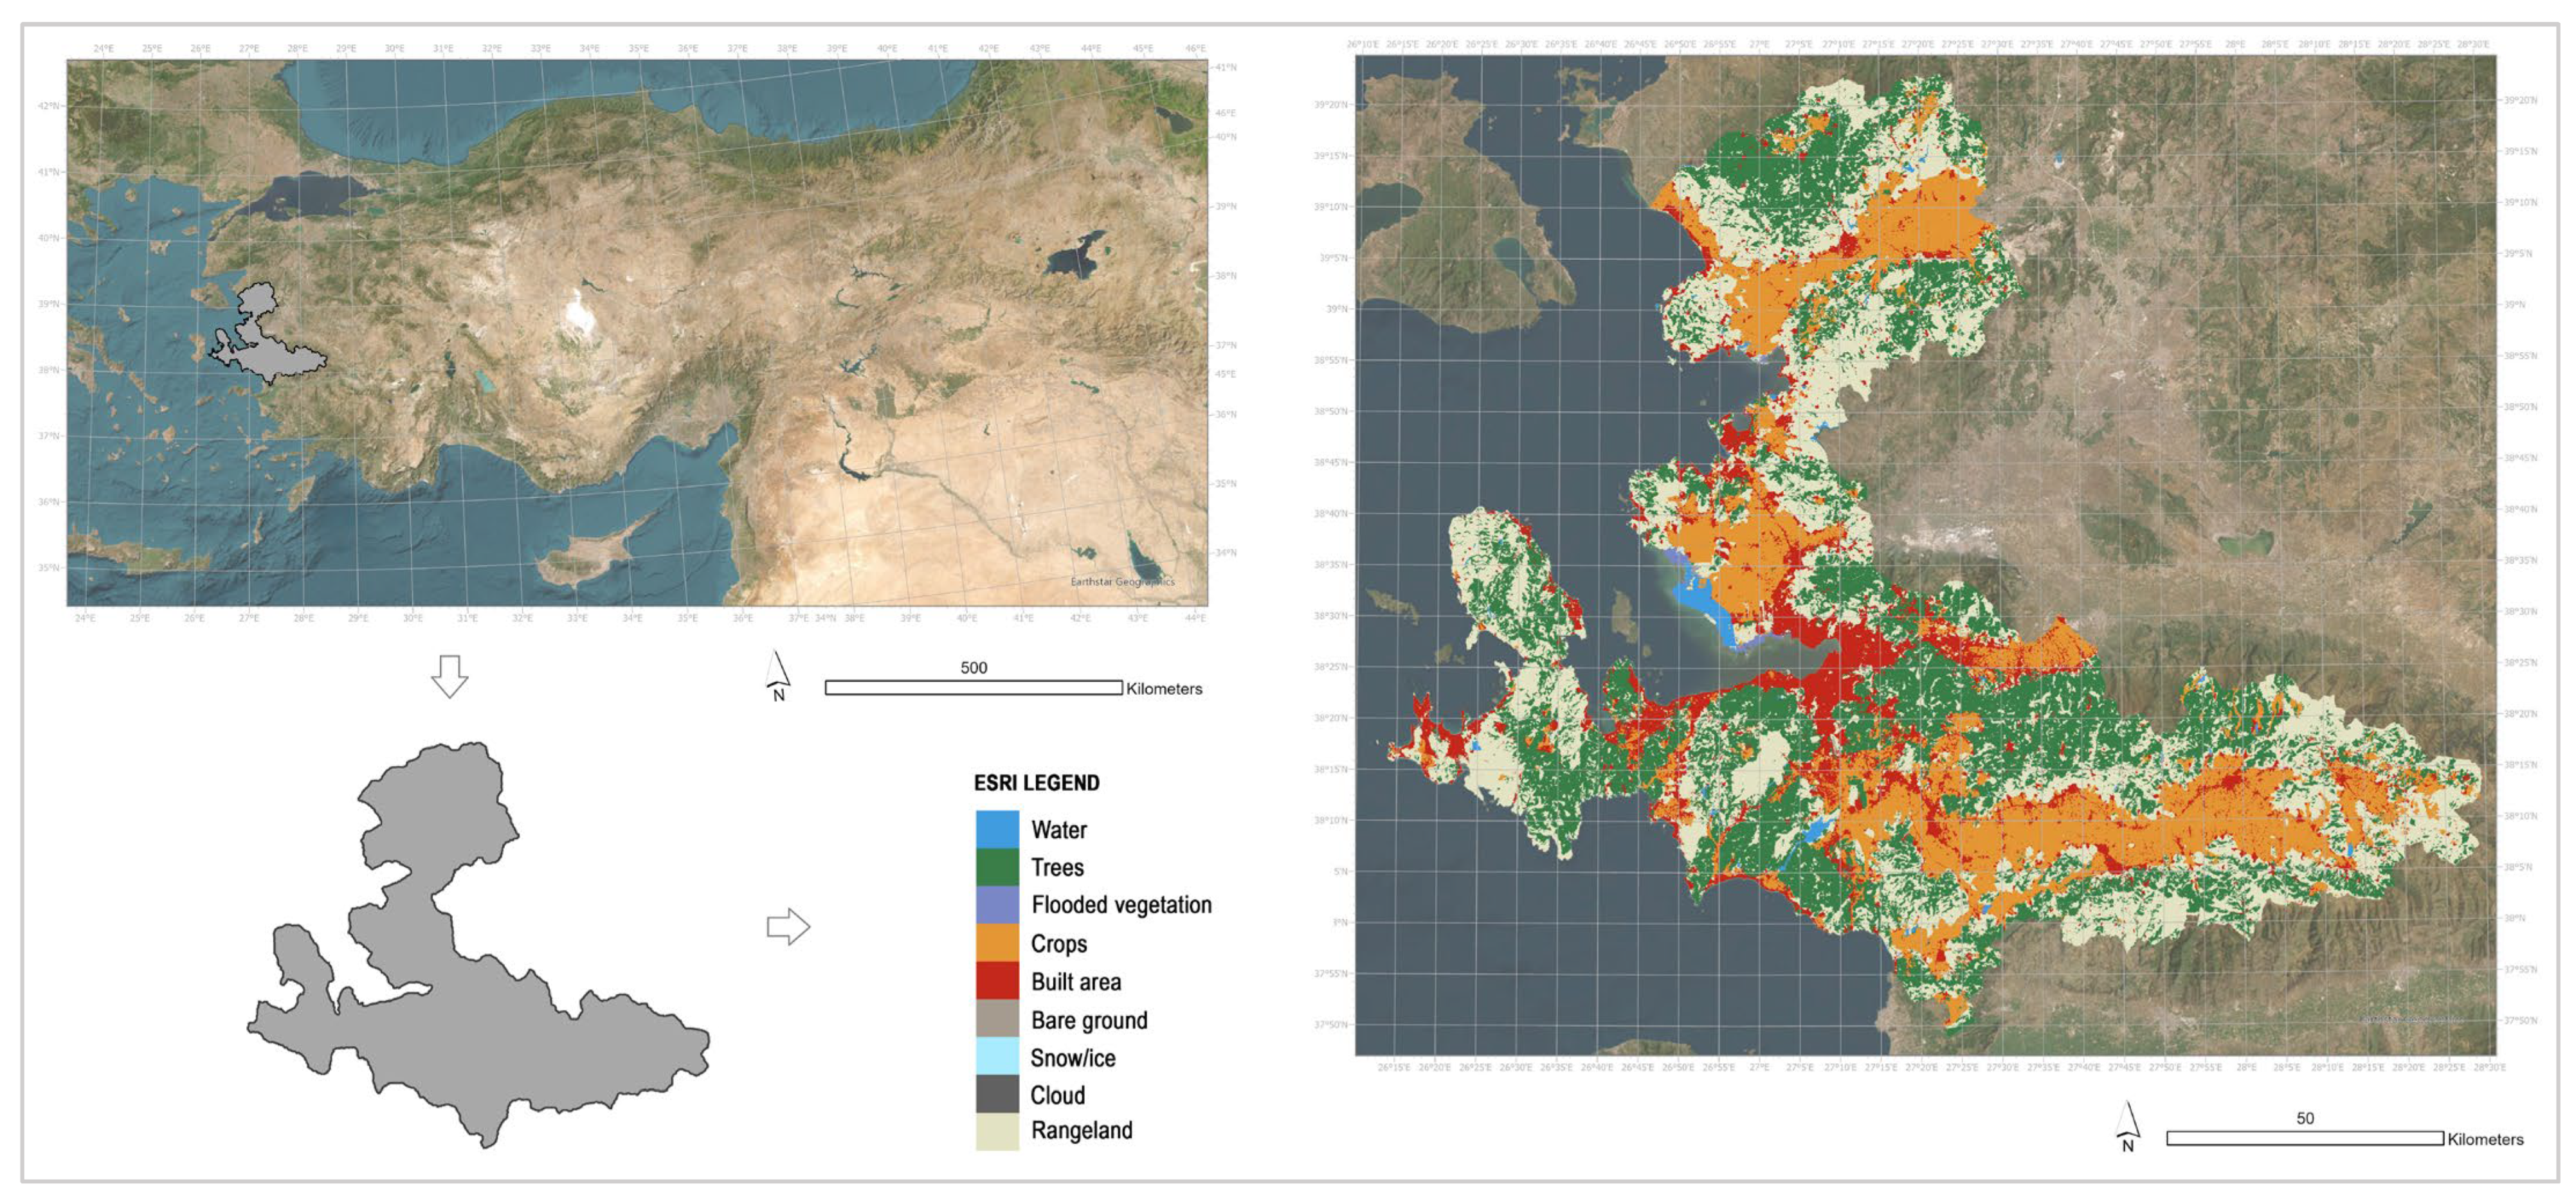
The Izmir Peninsula, characterized by Its unique Mediterranean landscape and centuries of human–environment interaction, is undergoing rapid urbanization [26]. This transformation poses significant challenges to the region’s natural environment, driven by poorly coordinated planning and limited regulatory control over urban expansion. The Izmir Peninsula stands as a representative case of the broader tensions between environmental protection and urban expansion observed in rapidly urbanizing Mediterranean landscapes. While Turkiye’s planning system includes environmental regulation plans at broad scales (1:100,000 and 1:25,000), the preparation of such plans for Izmir has faced persistent challenges since the 1980s. Frequent amendments and inconsistencies in upper-scale plans have hindered their integration with local development efforts, resulting in fragmented and uncoordinated urban growth [27].
This rapid transformation is further compounded by limited awareness of ecosystem vulnerability and habitat quality within planning processes. Although some pioneering projects have integrated ecosystem services approaches, their application remains limited in Turkiye [28]. A stronger emphasis on environmentally sound decision-making and the incorporation of ecosystem services into spatial planning is urgently needed to guide sustainable development.
This study aims to address these gaps by integrating composite ecosystem assessments into planning processes, offering data-driven tools to support informed decisions on both conservation priorities and urban growth management. By utilizing advanced ES models and spatial analyses, the research proposes a methodology to support sustainable development in the metropolitan area of Izmir. The study explores the following questions: (i) How distributed are values of habitat quality, carbon storage, and sequestration or sediment delivery ratio?; (ii) Where are conflicts or synergy areas for environmental value and settlement expansion in the Environmental Regulation Plan in Izmir?; (iii) What are the spatial characteristics of large conflict areas with high environmental value?
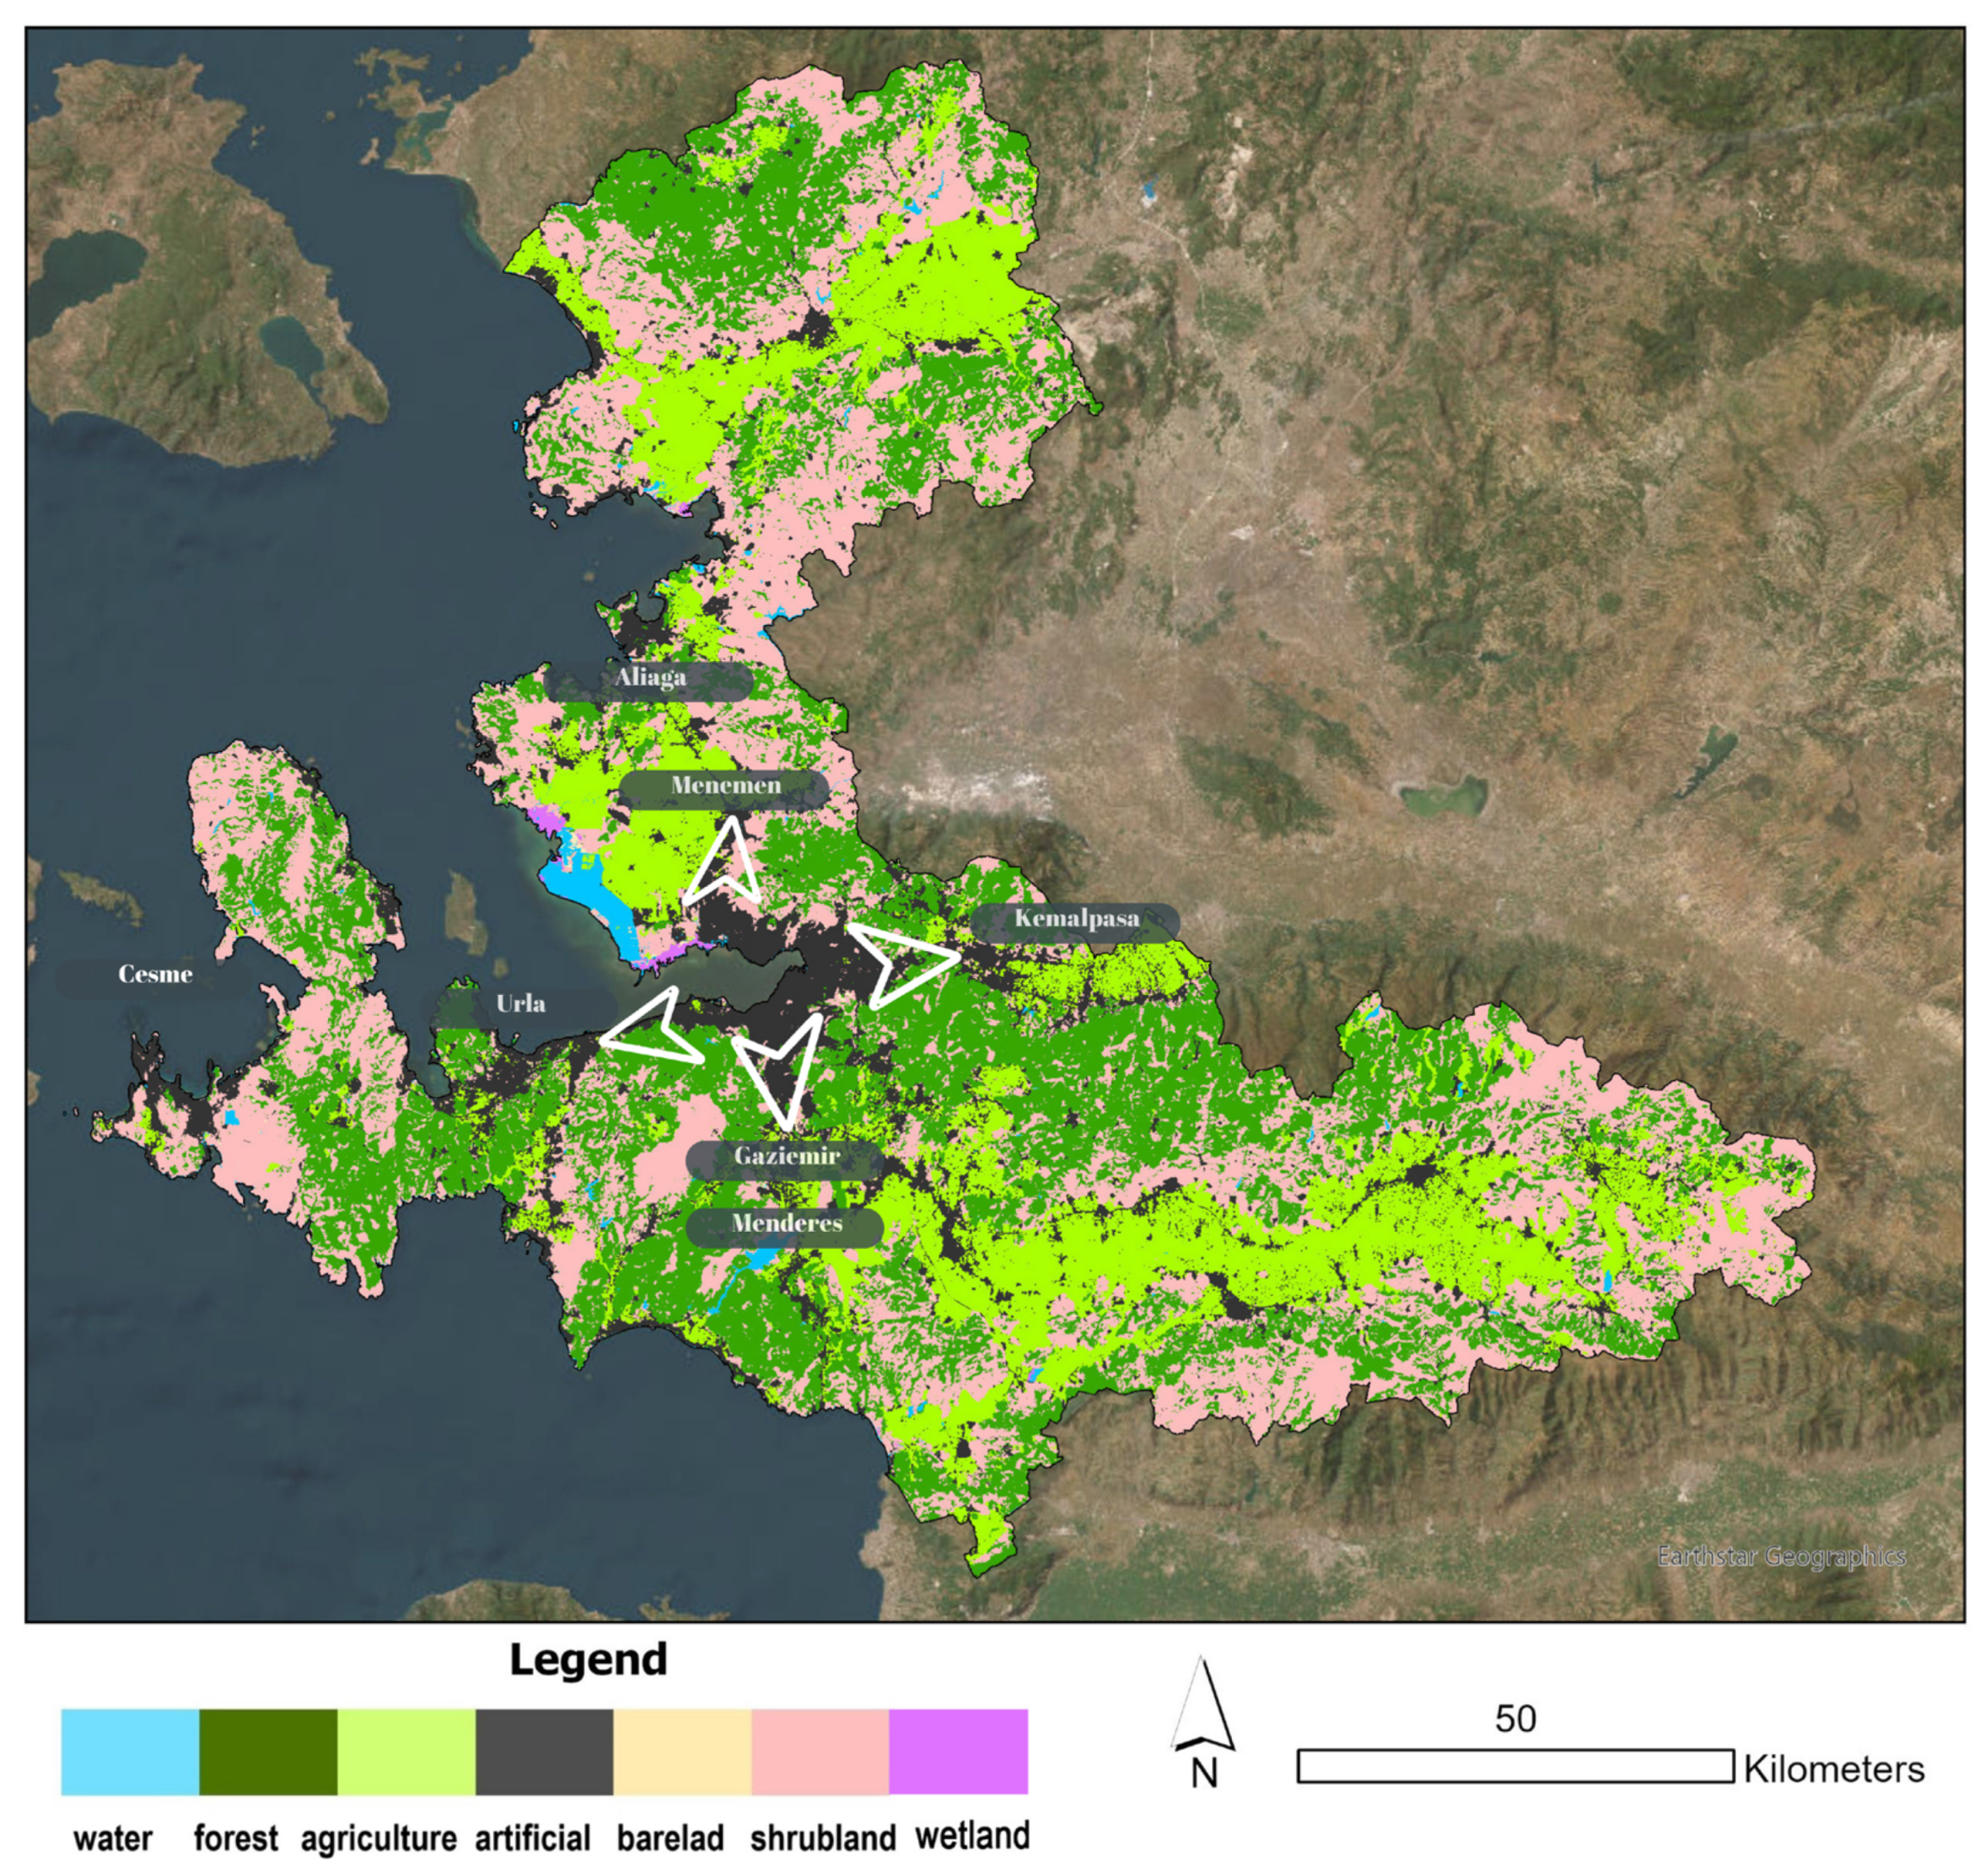
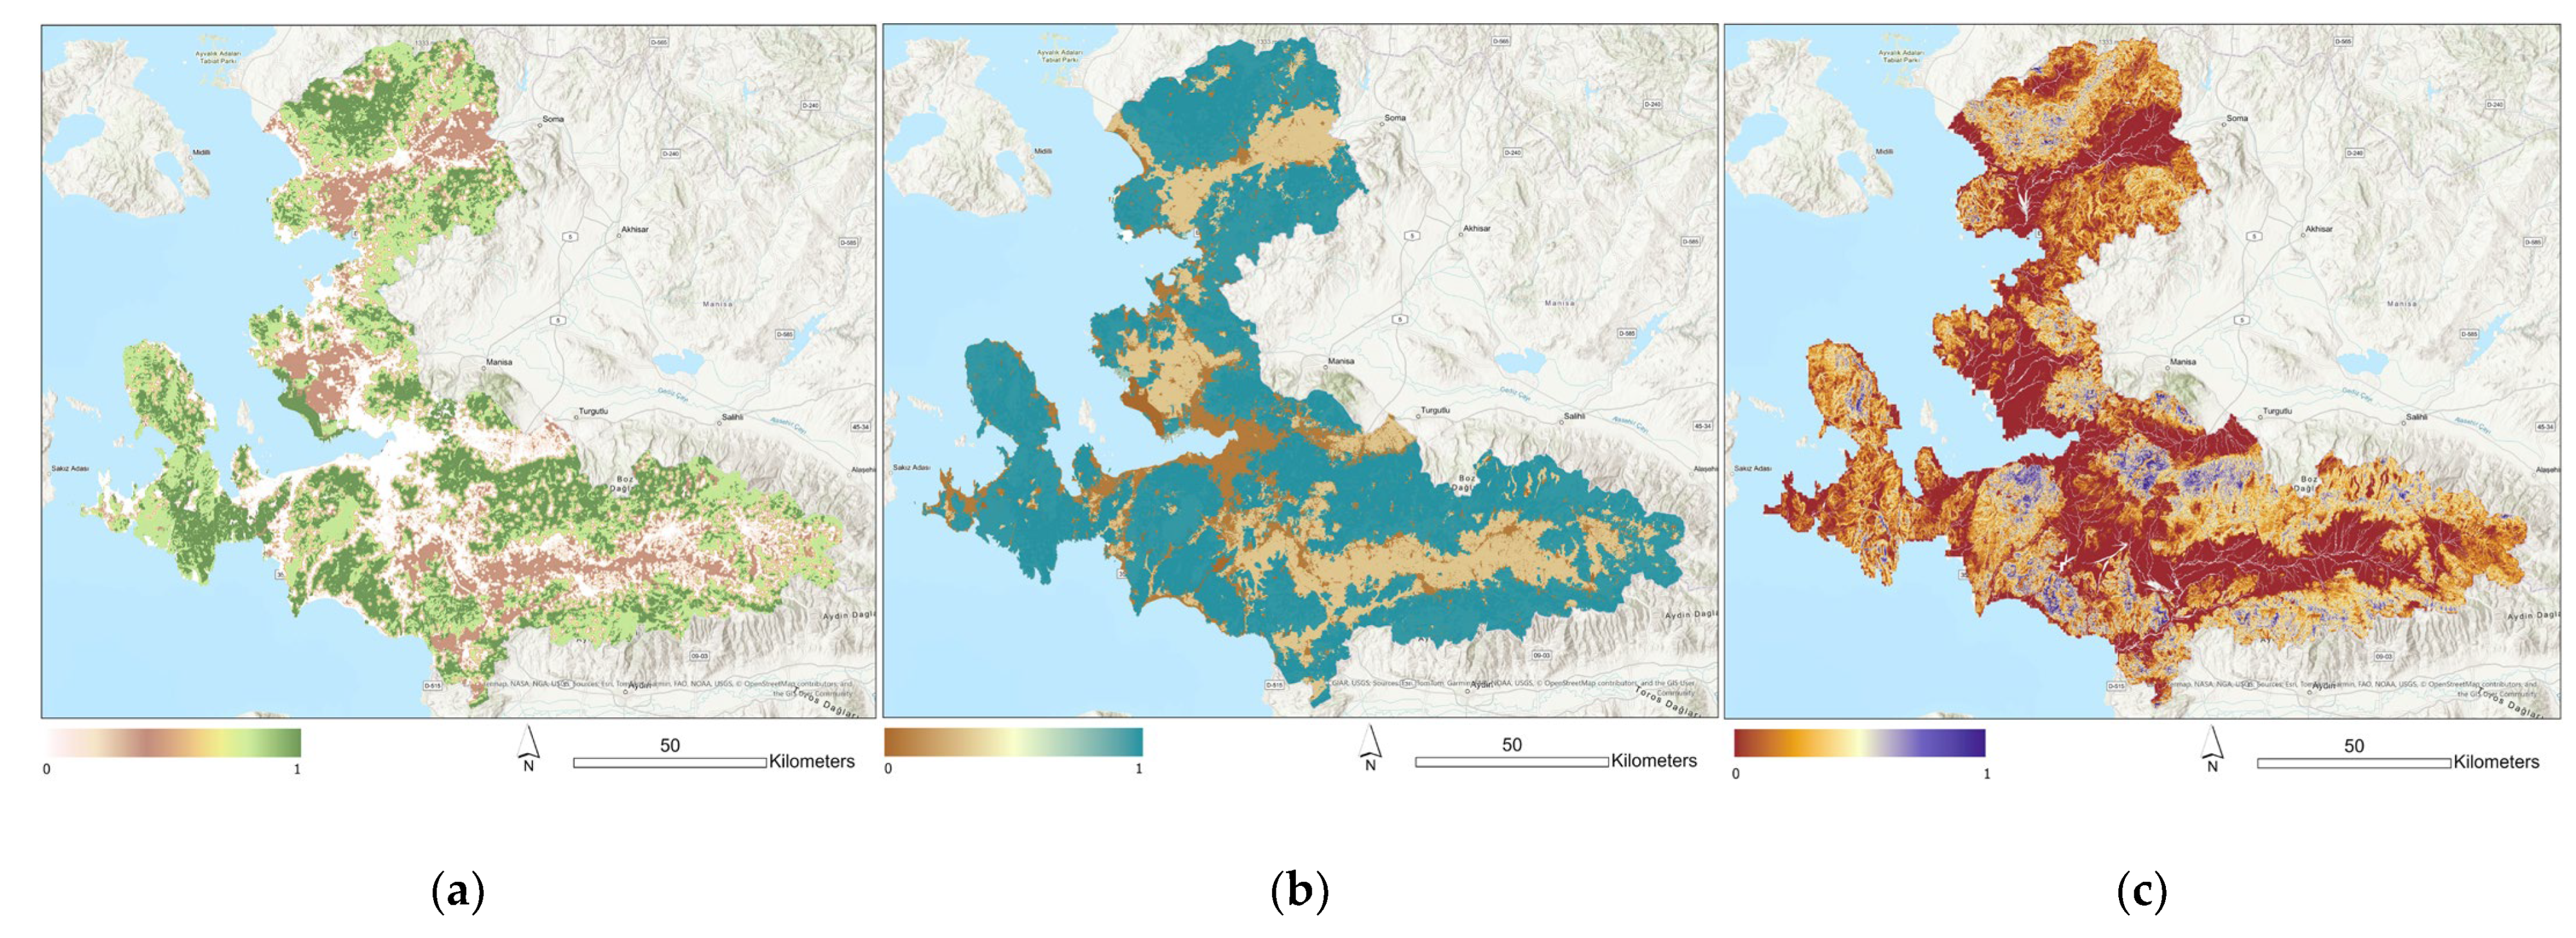
In this study, we conducted a spatial assessment of ecosystem services (Ess) in the İzmir Province by utilizing land use and land cover (LULC) data as the primary input. The LULC map served as the basis for modeling three key ecosystem services: habitat quality, carbon storage and sequestration, and sediment retention. These services were selected due to their relevance to environmental regulation, their sensitivity to urban land conversion, and the availability of reliable data.
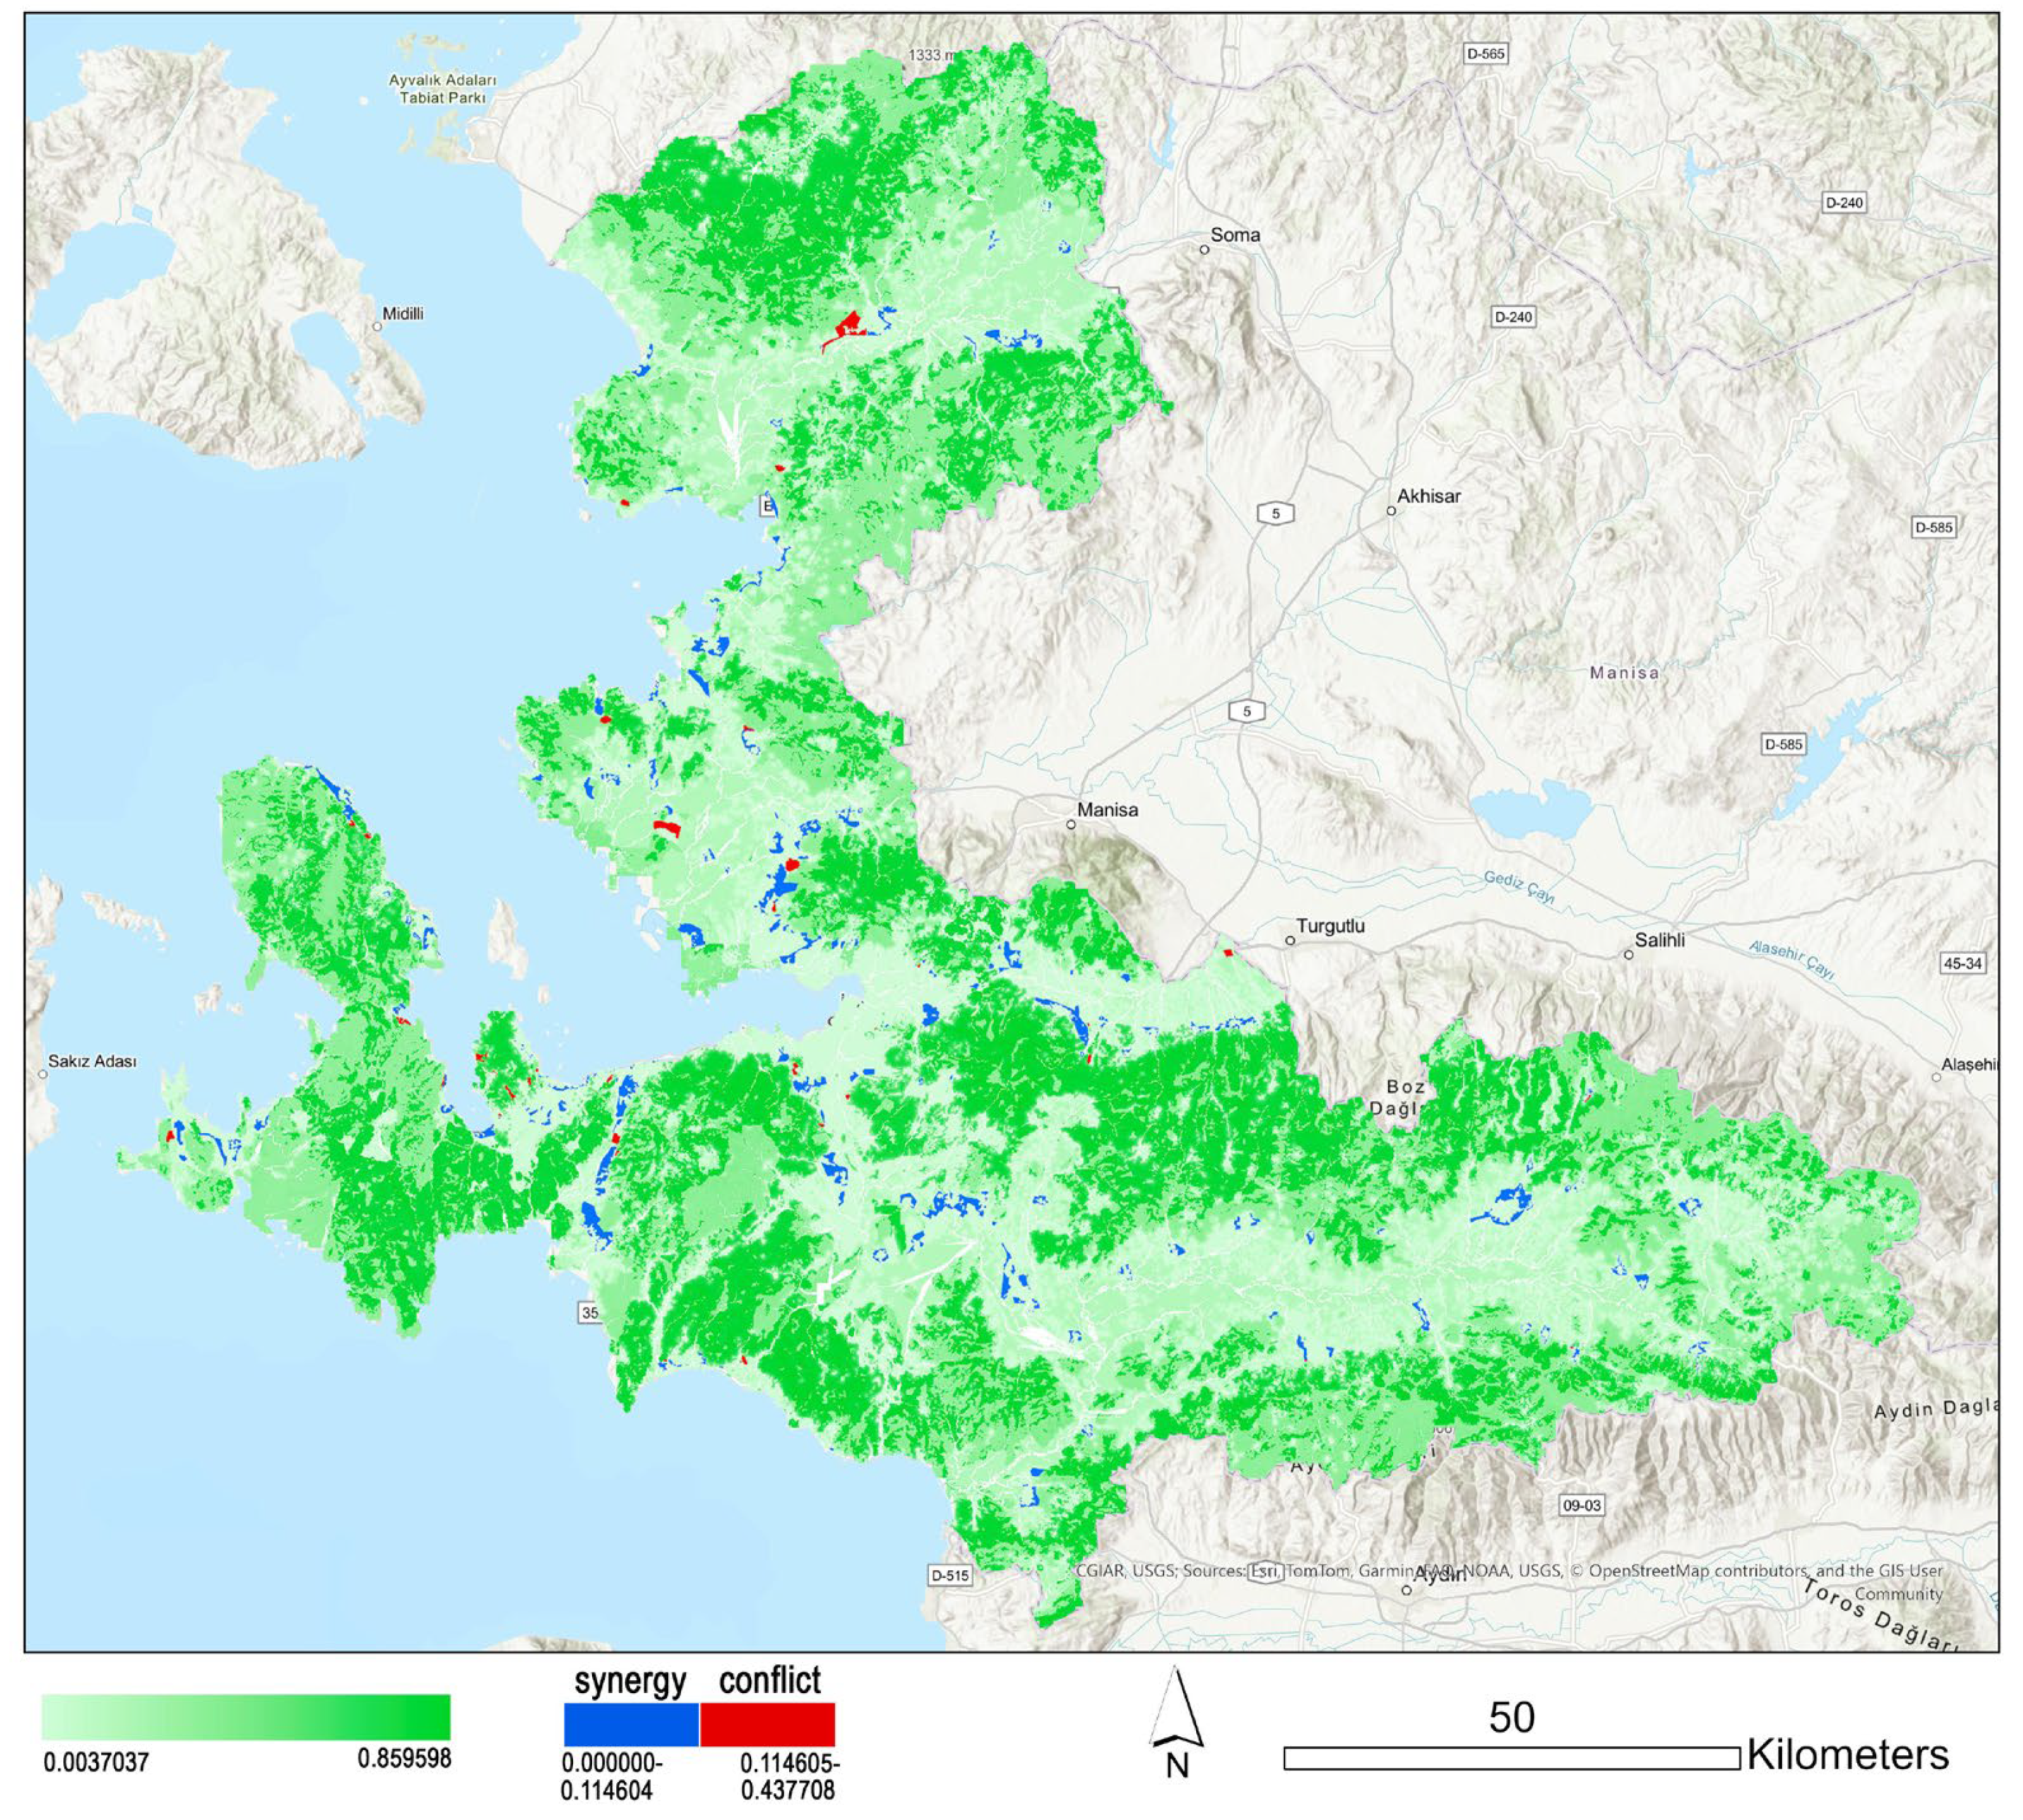
Using a spatial modeling tool (InVEST), we produced individual ES maps representing the spatial distribution and intensity of each service across the study area. Following this, we developed a composite ecosystem services map by aggregating the normalized outputs of the three individual ES models. This composite map reflects an integrated measure of overall environmental value, capturing both ecological function and potential vulnerability. To evaluate the interaction between urban development and ecological value, we overlaid the settlement expansion areas as identified in Izmir’s Environmental Regulation Plan (1:100,000 scale) onto the composite ES map. For each expansion zone, we calculated the mean environmental value, which allowed us to assess the ecological significance of areas targeted for urban growth.
This approach enabled the identification of synergy zones with low environmental value and suitable for development and conflict zones with high environmental value that may be at risk due to planned urban expansion. In the final part of the analysis, we discussed the spatial characteristics of these conflict zones, reflecting on the potential ecological trade-offs and planning implications. The study concludes by proposing how such data-driven ES assessments can support more sustainable and environmentally sensitive spatial planning strategies.

2. Materials and Methods

2.1. Study Area and Data Source

Izmir is situated in the western part of Turkiye and bordered on the west by the Aegean Sea (Figure 1, on the left). As a Mediterranean city, Izmir holds significant importance in urban planning, particularly in the context of ecosystem services and vulnerability to climate change. The city’s population was 4,479,525 in 2023 [29], making it the third-biggest city in the country. According to the most recent population projections within the context of legal migration, it is anticipated that the population of Izmir will reach 5,643,286 by the year 2050 [30]. While population growth will increase the need for urban expansion, its expansion is constrained by natural thresholds such as sea, and forest, necessitating a strategic approach to urban planning. To achieve this objective, it is essential to implement an integrated planning framework that achieves a balance between urban growth and ecological resilience. Izmir was chosen as the focus of this study due to its strategic significance as a rapidly urbanizing Mediterranean city that faces critical sustainability challenges.
The land use map was downloaded from ESRI, an open-source platform for areas of interest in 2023 to avoid errors in user accuracy. ESRI database offers high-resolution, open, accurate, comparable, and timely land use maps with 10 m resolution and annual maps of Earth’s land surface which Sentinel-2 satellites included in the Copernicus program of the European Space Agency from 2017 to 2023 [31]. The land use map has been georeferenced on Universal Transverse Mercator (UTM) WGS84 projection, 35 zones for Izmir, and the map was clipped according to the administrative boundaries of Izmir Province (Figure 1).
In this study, the snow and cloud were excluded from consideration as land use classes for analyses. Based on the site-specific information, the flooded vegetation class has been categorized as wetland, while the rangeland class has been categorized as shrubland. The land cover classification employed in this study was developed based on detailed knowledge of the study area and refined through the authors’ previous experience with supervised classification methods. It is recommended that future studies’ land cover categories should be carefully redefined and tailored to the ecological and geographical characteristics of each respective study area. Accordingly, the classes and codes were redefined for ecosystem assessment analysis purposes (Table 1).

2.2. Assessment of Ecosystem Services

The Integrated Valuation of Ecosystem Services and Trade-offs (InVEST) model is useful for the analysis of ecosystem services produced by Stanford University for the Natural Capital Program [32]. The ecosystem services examined in previous studies are as follows: habitat quality [27,33,34], carbon storage and sequestration [33,34], sediment delivery ratio [33,34], water conservation [34], food supply [34], and Nutrient Retention Model [35]. In this study, three key ecosystem services have been selected to assess the conflict and synergy between settlement expansion. The study utilizes habitat quality, carbon storage and sequestration, and sediment delivery ratio models to generate ecosystem service maps.

2.2.1. Habitat Quality (HQ)

The habitat quality model assesses regional biodiversity by integrating land use data and habitat threat density. The model operates under the assumption of all threats to a landscape [36]. In this study, this model was employed to assess habitat quality and the process followed these steps: firstly, land use and land cover raster data were prepared. The current land cover data adapted from the ESRI map was used for this step. Secondly, for the identification of threats, a threats table (CSV format) was created. Urban areas were designated as sources of threat. Thus, the path of threat data, distance, weight, and decay type as exponential was defined in the threat table. Habitat quality was analyzed according to the sensitivity values in Table 2.
Finally, the half-saturation constant was set to 0.05, following the default value [36]. In addition to fulfilling the required inputs, the optional “Accessibility to Threats (vector)” data were incorporated into the analysis. This dataset represents the relative protection provided by legal, institutional, social, and physical barriers against threats. Given the significance of protected areas in Izmir, this layer was included in the habitat quality analysis. Accessibility values were assigned based on their level of protection, with strictly protected areas set to 0, followed by 0.3, 0.6, and 0.9 in increasing order of reduced protection status [36]. As a result, the habitat quality map was generated, providing insights into the spatial distribution of habitat conditions across the study area.

2.2.2. Carbon Storage and Sequestration (CSS)

The InVEST Carbon Storage and Sequestration model operates by estimating the total carbon stored in a given land parcel based on land use and land cover (LULC) data and predefined carbon pool values [33]. The model employs land use data in conjunction with other variables, including carbon densities in aboveground biomass, belowground biomass, soil, and dead organic matter, to estimate total carbon storage [33,36]. The two essential requirements for the analysis, LULC data and carbon pool values in units of metric tons per hectare (t/ha) were provided. First, the land use and land cover map used in the habitat quality analysis was also utilized for this assessment. The carbon pool values, as presented in Table 3, were adapted from a previous study [27]. The values in the table have been formatted as required for the CSV file. Finally, the Carbon Storage and Sequestration (CSS) map was generated for this study.

2.2.3. Sediment Delivery Ratio (SDR)

In the study, the sediment delivery ratio model presents strategies to reduce sediment load and measures the contribution of vegetation erosion to prevention [36]. It protects water resources by preventing both the sediment held in the pixel and the transport of this sediment to streams. The land use and land cover (LULC) map used for the previous two ecosystem services was also utilized in this analysis. The required DEM, erosivity, and erodibility data for the model were obtained from global datasets and were specifically extracted for the case study area. As shown in Table 4, the sources and data formats are provided.
A customized biophysical table (Table 5) served as a pivotal input for the analytical model. The values in the table have been formatted as required for the CSV file.
The Threshold Flow Accumulation value was set to 2000 pixels based on the characteristics of the study area by the authors. All other parameters were kept at their default values. As a result, the Sediment Delivery Ratio (SDR) map was generated. Among the outputs of the InVEST SDR model, we used the “erosion avoided” layer as the main indicator in our analysis. The primary reason for this choice is that this layer directly reflects the soil retention capacity of a given land parcel and, consequently, its environmental contribution. In other words, high values of “erosion avoided” indicate the effectiveness of natural vegetation cover or land use types in preventing soil erosion.

2.2.4. Environmental Value

The minimum, maximum, and mean values per hectare were determined by the total area (Izmir metropolitan area) before the normalization in ArcGIS Pro 3.4.2 (Esri, Redlands, CA, USA) for each ecosystem services map. Then, the ecosystem service maps (habitat quality, carbon storage sequestration, and sediment delivery ratio) were normalized to a range between 0 and 1. The following formulas were applied using the Raster Calculator tool in ArcGIS Pro (Formula (1)).
Normalized Raster = (Input Raster – Min Value)/(Max Value – Min Value)
The Raster Calculator tool was then used to combine the ecosystem services with equal weighting applied to produce a single integrated environmental value. The normalized ecosystem service rasters were converted into a single equally weighted raster via the raster calculator in ArcGIS Pro. By applying equal weights, each ES layer contributed equally (i.e., with the same influence) to the final composite raster. Thus, a composite environmental value map was generated, reflecting the balanced contribution of all included ES layers. Since these indicators positively contribute to the ecological environment, a positive standardization method was adopted to ensure consistency in processing. In this study, environmental value refers to the composite result obtained by combining the three selected ecosystem services with equal weighting.

2.3. Synergy and Conflicts Method Between Settlement Expansion and Environmental Value

The Synergy and Conflicts Method is an analytical approach used to evaluate the interactions between human activities and environmental values. The Conflict and Synergy analysis is a conceptual and spatial analytical approach adopted from the previous study [27]. It is used to evaluate the interactions between land use changes such as urban expansion and ecosystem services. Thus, it helps to distinguish areas where urban growth either supports (synergy) or negatively impacts (conflict) ecosystem services. In this study, the method was implemented through GIS-based spatial overlay techniques to identify areas of conflict, where urban development negatively impacts ecosystem services, and areas of synergy, where development supports or aligns with environmental values.
Synergies and conflict areas were examined between settlement expansion and environmental value (come from composite ecosystem services maps) which contain the mean value of habitat quality, carbon storage and sequestration, and sediment delivery ratio analyses. Zonal statistics were employed to calculate the mean environmental values within the settlement expansion polygons. Environmental values were then classified into two categories low environmental value and high environmental value by using a natural breaks distribution. Areas classified with low environmental values are considered synergy areas with settlement expansion. This means that the expansion in these areas has a relatively lower impact on ecosystem services because these areas inherently provide fewer ecological benefits. Areas with high environmental values indicate a conflict with settlement expansion that would lead to environmental degradation. Therefore, in this classification system, low environmental values indicate synergy, while high environmental values indicate conflict with settlement expansion.
A histogram to depict the distribution of mean environmental values of conflicts and a scatter plot to analyze the relationship between settlement expansion area (ha) and mean environmental value were created using Rstudio 2023.06.1+524 (Posit Software, PBC, Boston, MA, USA) programming. Additionally, IBM SPSS Statistics 25 (IBM Corp., Armonk, NY, USA) was used for correlation analysis between land use and land cover area and environmental value in conflicts areas (see Supplementary Materials, File S1 for full results). In general, habitat areas larger than 10 hectares are needed to support viable populations [38]. This study focuses on identifying zones of high environmental value within planned settlement expansion areas. To ensure ecological significance, only conflict zones exceeding 10 hectares were included in the analysis. From these, the five zones with the highest environmental values were selected for further examination.

3. Results

3.1. Land Use and Land Cover Map

The metropolitan Izmir land cover distribution in 2023 is as follows: 34% shrubland, 32% forest, 21% agriculture, 11% artificial areas, and 1% water bodies (Table 6). The city center of Izmir has expanded along transportation corridors extending northwards towards the industrial-focused Menemen and Aliaga axis, eastwards towards the Kemalpasa axis, southwards the Gaziemir and Menderes axis, and westwards towards the coastal residential areas of Urla and Cesme. The urban center sprawl affects agricultural areas in the north and east and forested areas in the west and south (Figure 2). Additionally, settlement pressure is also seen in agricultural areas in the north and southeast.

3.2. Ecosystem Services: Habitat Quality, Carbon Storage and Sequestration and Sediment Delivery Ratio

Before normalization and generating the composite index the raw values of ecosystem service indicators were examined to understand their distribution and variability. Habitat quality ranges from 0.05 to 1 with an average of 0.605. In the habitat quality analysis, green areas indicate high-quality habitats such as intact forested and natural areas with minimal human disturbance. White represents degraded habitats with significant human impact, such as urbanized regions, agricultural lands, or areas subjected to industrial activities (Figure 3a). Izmir city center, agricultural areas in the east, and agricultural areas in the north show low habitat quality. As mentioned in Table 2, forest areas were assigned the highest habitat value (0.95), reflecting their critical ecological role in the habitat quality map (Figure 3a).
Carbon storage and sequestration exhibited a broad range, from 0 to 7.2 tons per hectare with an average of 2.529 tons per hectare. The carbon storage and sequestration analysis revealed that Izmir’s forest and shrubland areas are the most significant contributors to carbon sequestration while urban centers constitute the least effective in this regard as well as agricultural areas (Figure 3b). In particular, forest areas demonstrate the highest carbon storage capacity across the study area. As previously presented in Table 3 in the Methods Section, their dominant carbon pool values across all components (aboveground, belowground, soil, and dead organic matter) are reflected in the carbon storage map, highlighting the significant role of forests in supporting ecosystem services.
The sediment delivery ratio showed the highest variability with values spanning from 0 to 130.397 tons per hectare and an average of 7.879 tons per hectare. The sediment delivery ratio analysis indicates that it reaches its lowest levels within the basins with particularly low values observed across a substantial area to the east of İzmir and in the northern regions (Figure 3c).

3.3. Analysis of Environmental Value with Synergy and Conflicts in Environmental Regulation Plan

The ecosystem service maps were normalized to a range between 0 and 1 and generated an environmental value map. As mentioned, we wanted to overlap the environmental (composite ecosystem map) map with the environmental regulation plan (2025) that designs the settlement expansion areas according to the main strategies of development of the province. It is seen that the potential conflict and synergy between the need for environmental protection of high-value areas and the future transformation sites (Figure 4). In Izmir metropolitan area, the study identified 41 conflict zones within a total of 453 designated settlement expansion areas. Figure 4 represents the overall environmental value distribution across the entire study area, with an average value of 0.337, a maximum of 0.86, and a minimum of 0.004.
Additionally, Figure 5 focuses only on the distribution of values within conflict zones, where environmental values range between 0.12 and 0.438, with a lower average of 0.208.
Figure 6 illustrates the relationship between the area size (in hectares) and the mean environmental value of conflict zones across İzmir’s districts. Overall, the plot reveals a general trend where smaller areas tend to have relatively higher environmental values. Bergama stands out with the largest conflict area exceeding 500 hectares; yet, it exhibits a low environmental value of 0.13. On the other hand, districts such as Kemalpasa, Urla, and Foca, which have significantly smaller conflict areas, display higher environmental values. However, the overall distribution of the data points suggests that there is no statistically significant relationship between area size and environmental value in conflict areas (Table 7 and Figure 7).
Overall, 27 areas were selected based on having an area greater than 10 hectares out of 41 identified conflict areas. Study areas were selected based on having the highest mean environmental values. The approach helps identify substantial urban–ecological conflicts. The first area is located south of the Yeni Foca settlement in Foca (Figure 8). The average environmental value of this area is 0.412 and the area of 75 hectares. The bird’s-eye distance from the center point of the settlement expansion polygon to the nearest point on the sea is approximately 2.8 km.
The second area is a coastal area with an average environmental value of 0.404 and an area of 32 hectares in Karaburun (Figure 9). The bird’s-eye distance from the center point of the second settlement expansion polygon to the nearest point on the sea is approximately 340 m.
The third conflict area in Karaburun and the fourth conflict area in Dikili have an environmental value of 0.298. Respectively, their areas are 34 hectares and 55 hectares (Figure 10 and Figure 11). The bird’s-eye distance from the fourth settlement expansion polygon to the sea is 1.27 km and 1.24 km for the fifth area. The distance to the sea varies between 340 m (the second area in Karaburun) and 2.8 km (the first area in Foca) indicating a generally close location.
The fifth area has an average environmental value of 0.296 and occupies 27 hectares in Urla (Figure 12). The bird’s-eye distance from the center point of the third settlement expansion polygon to the nearest point on the sea is approximately 1.7 km. Although the area does not have direct access to the sea, it is located nearby.

4. Discussion

Ecosystem services are shaped based on land use and land cover. Therefore, land use plans drive urban development which affects ecosystem services [39]. In this study, it was observed that habitat quality, carbon storage and sequestration areas, and sediment delivery rate vary spatially according to different land use types. It is supported by studies examining the impact of land use on ecosystem services [40,41]. However, the study differentiates itself from existing research that examines the impact of temporal changes in land use intensity and type on ecosystem services [40,42].
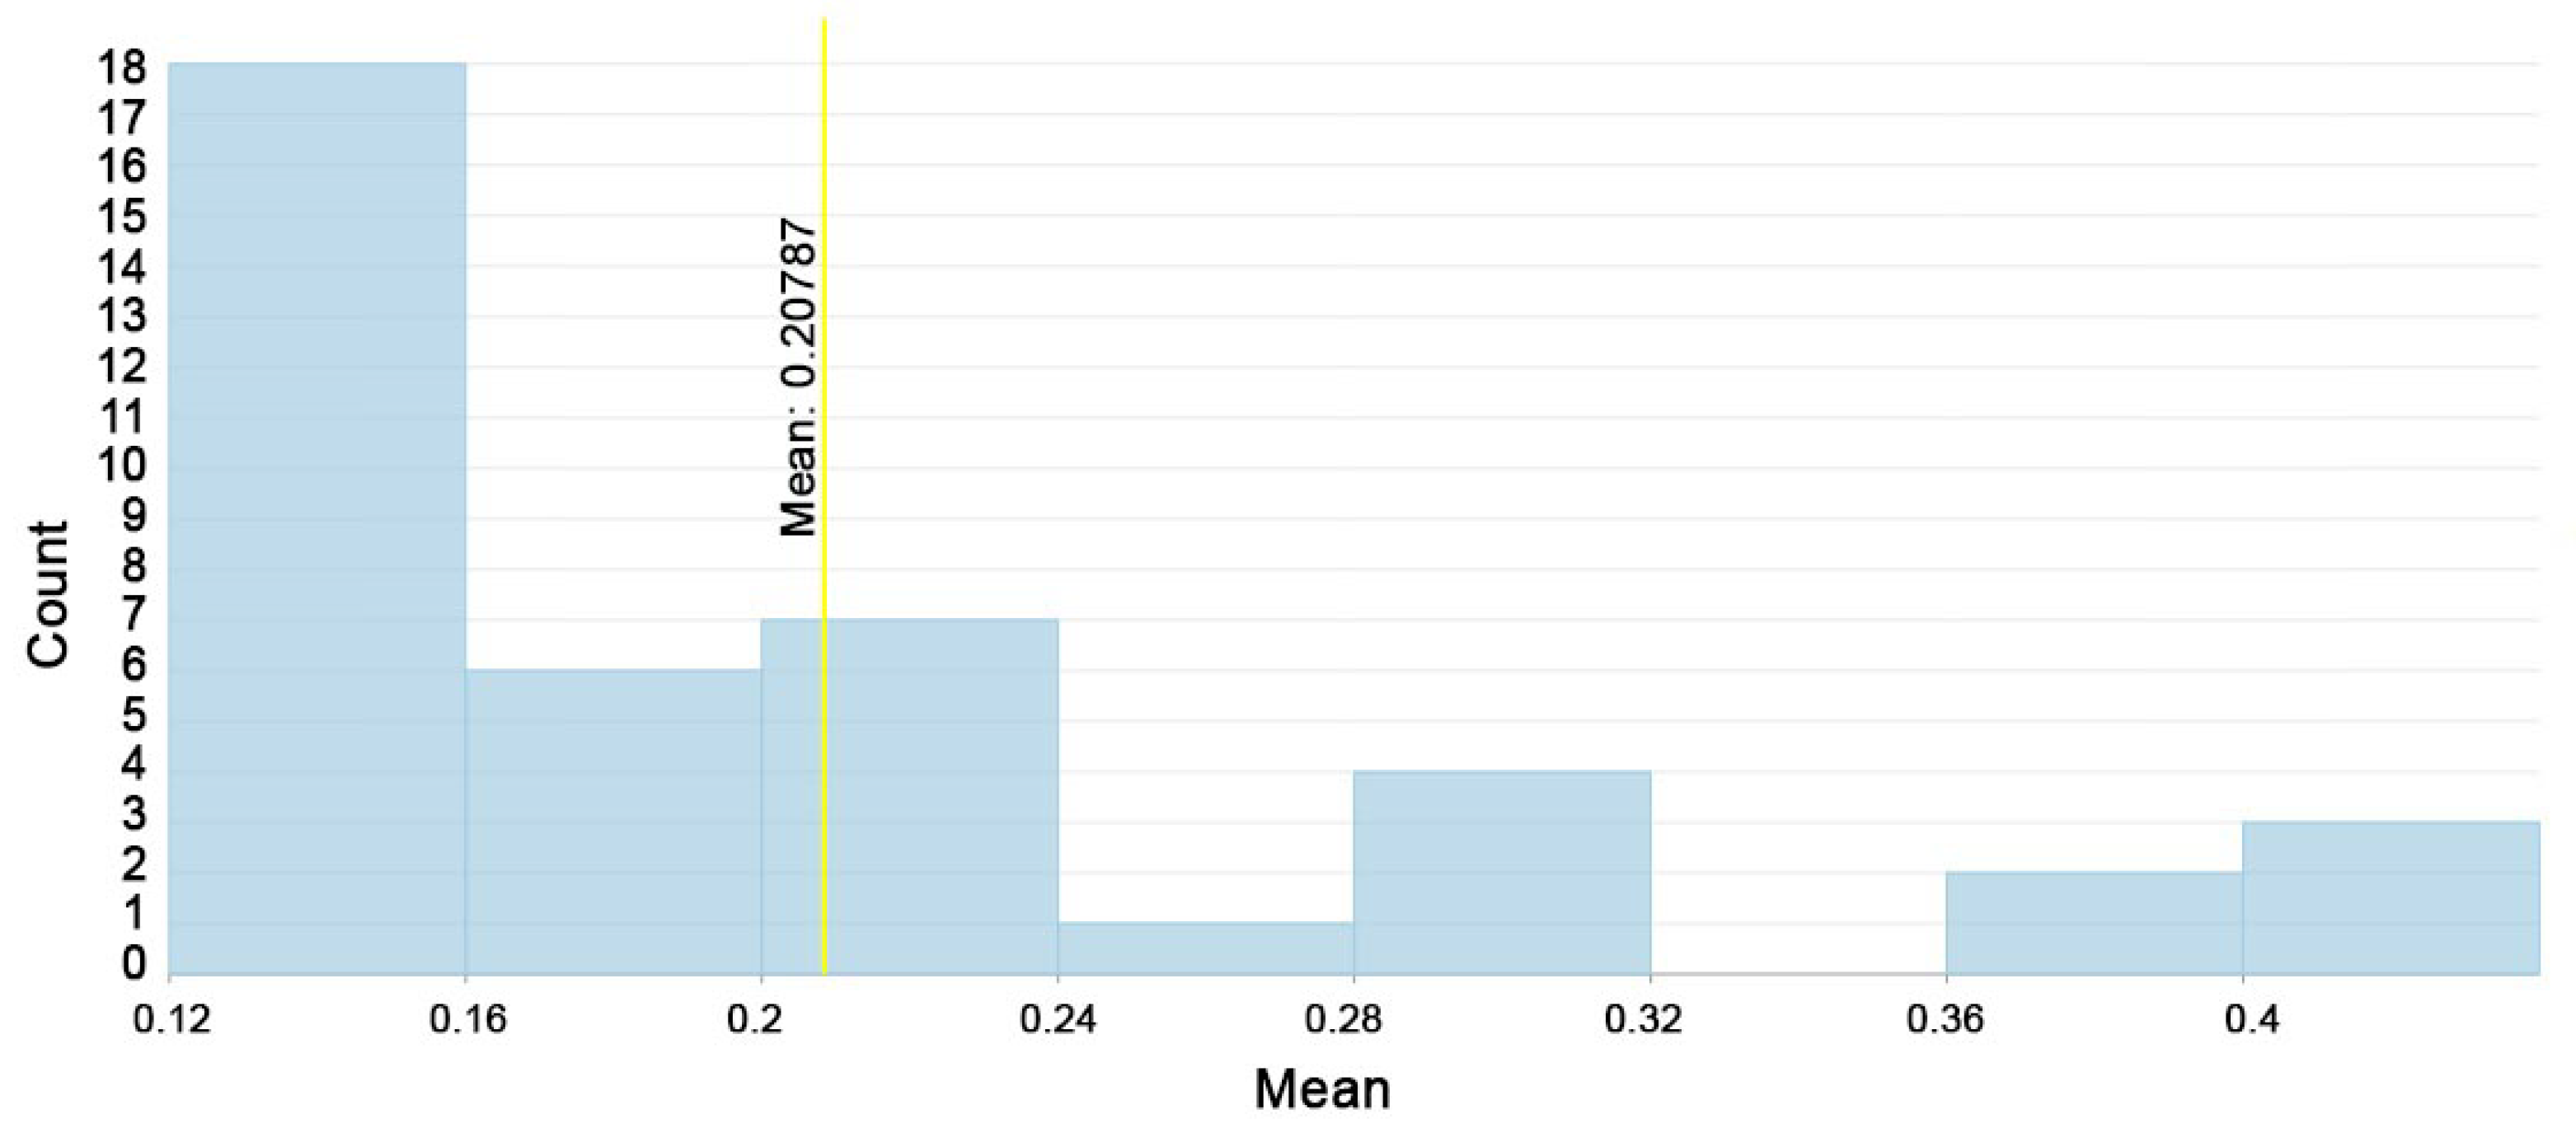
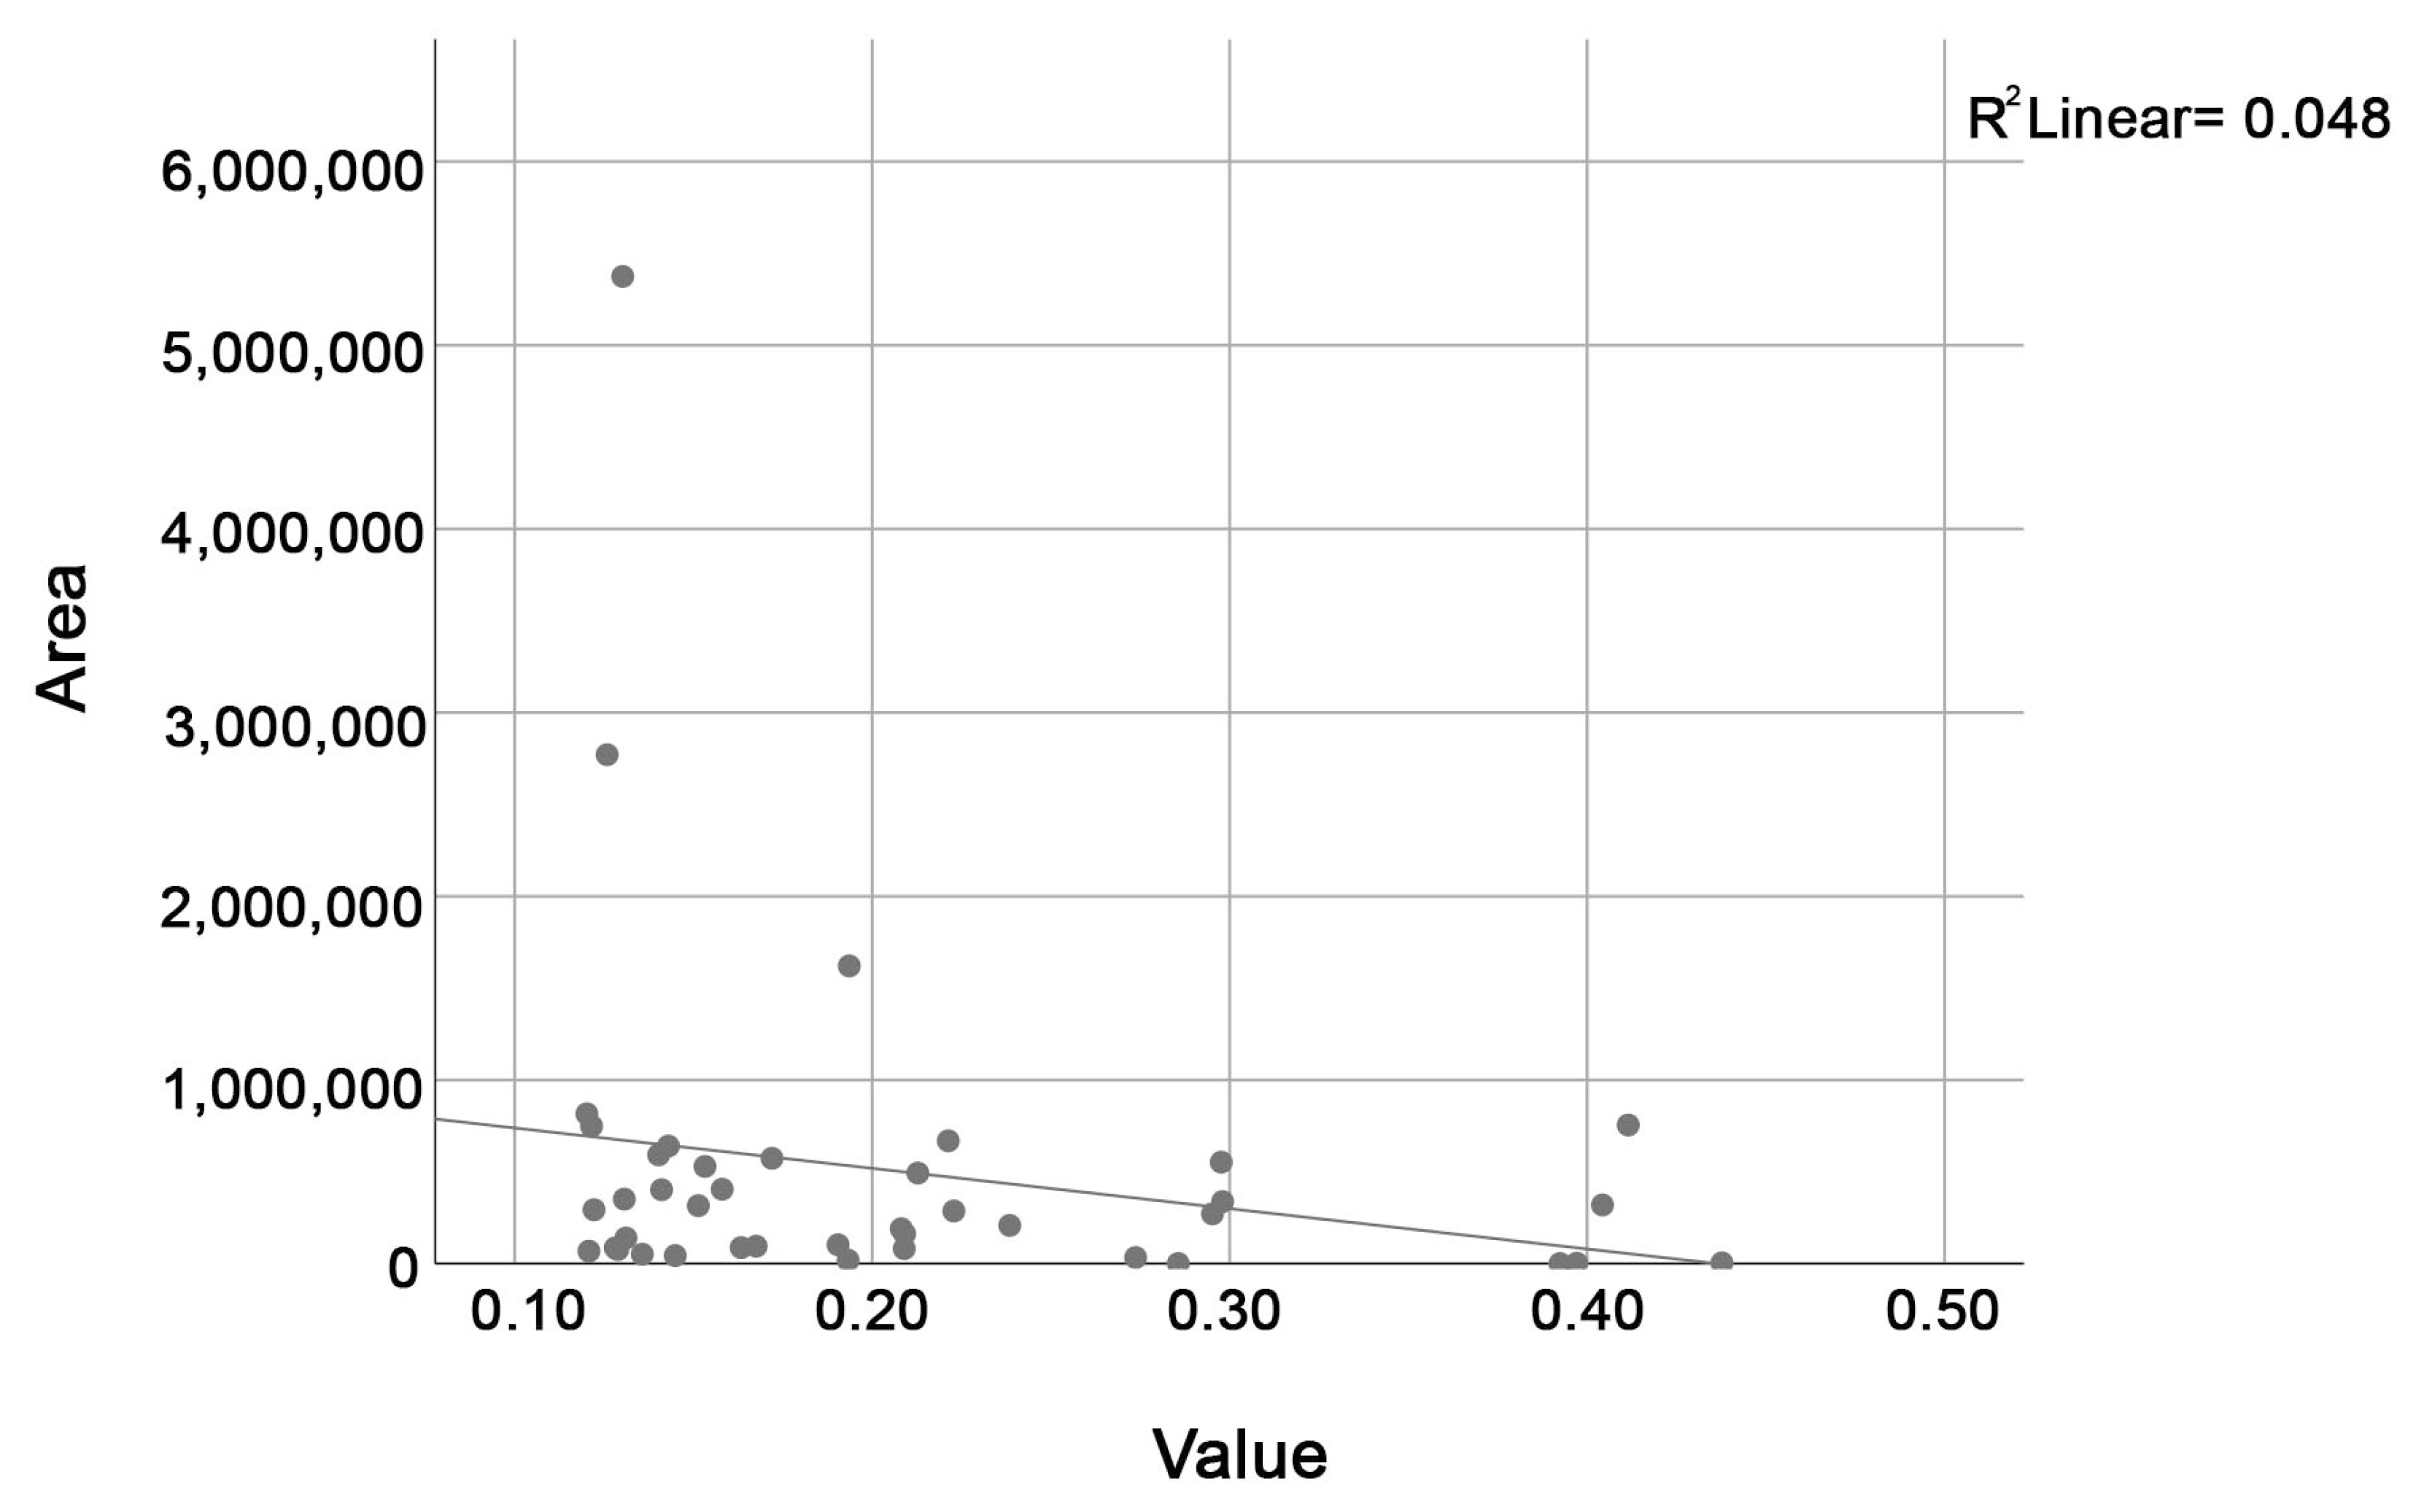
The conflict zones obtained by examining the average environmental value of 453 urban development zones in two categories with natural breaks represent high environmental values. These zones have high environmental values that contradict the urban development decision in planning. According to the correlation analysis conducted between the environmental value and land use categories in 41 conflict regions, there is a significant positive relationship between forest area and environmental value (Table 8). As shown in Table 9, since the wetland class is not present in any of the conflict zones, it could not be included in the Pearson Correlation analysis (Table 8) between land use area and environmental value of the conflict regions.
Forest areas make the most significant contribution to ecosystem services. The limitation of this analysis can be explained by examining only the relationship between environmental value and land use in the conflict areas. However, when the positive contribution of forest areas in the ecosystem services analysis is taken into consideration, it is seen that this result is supported.
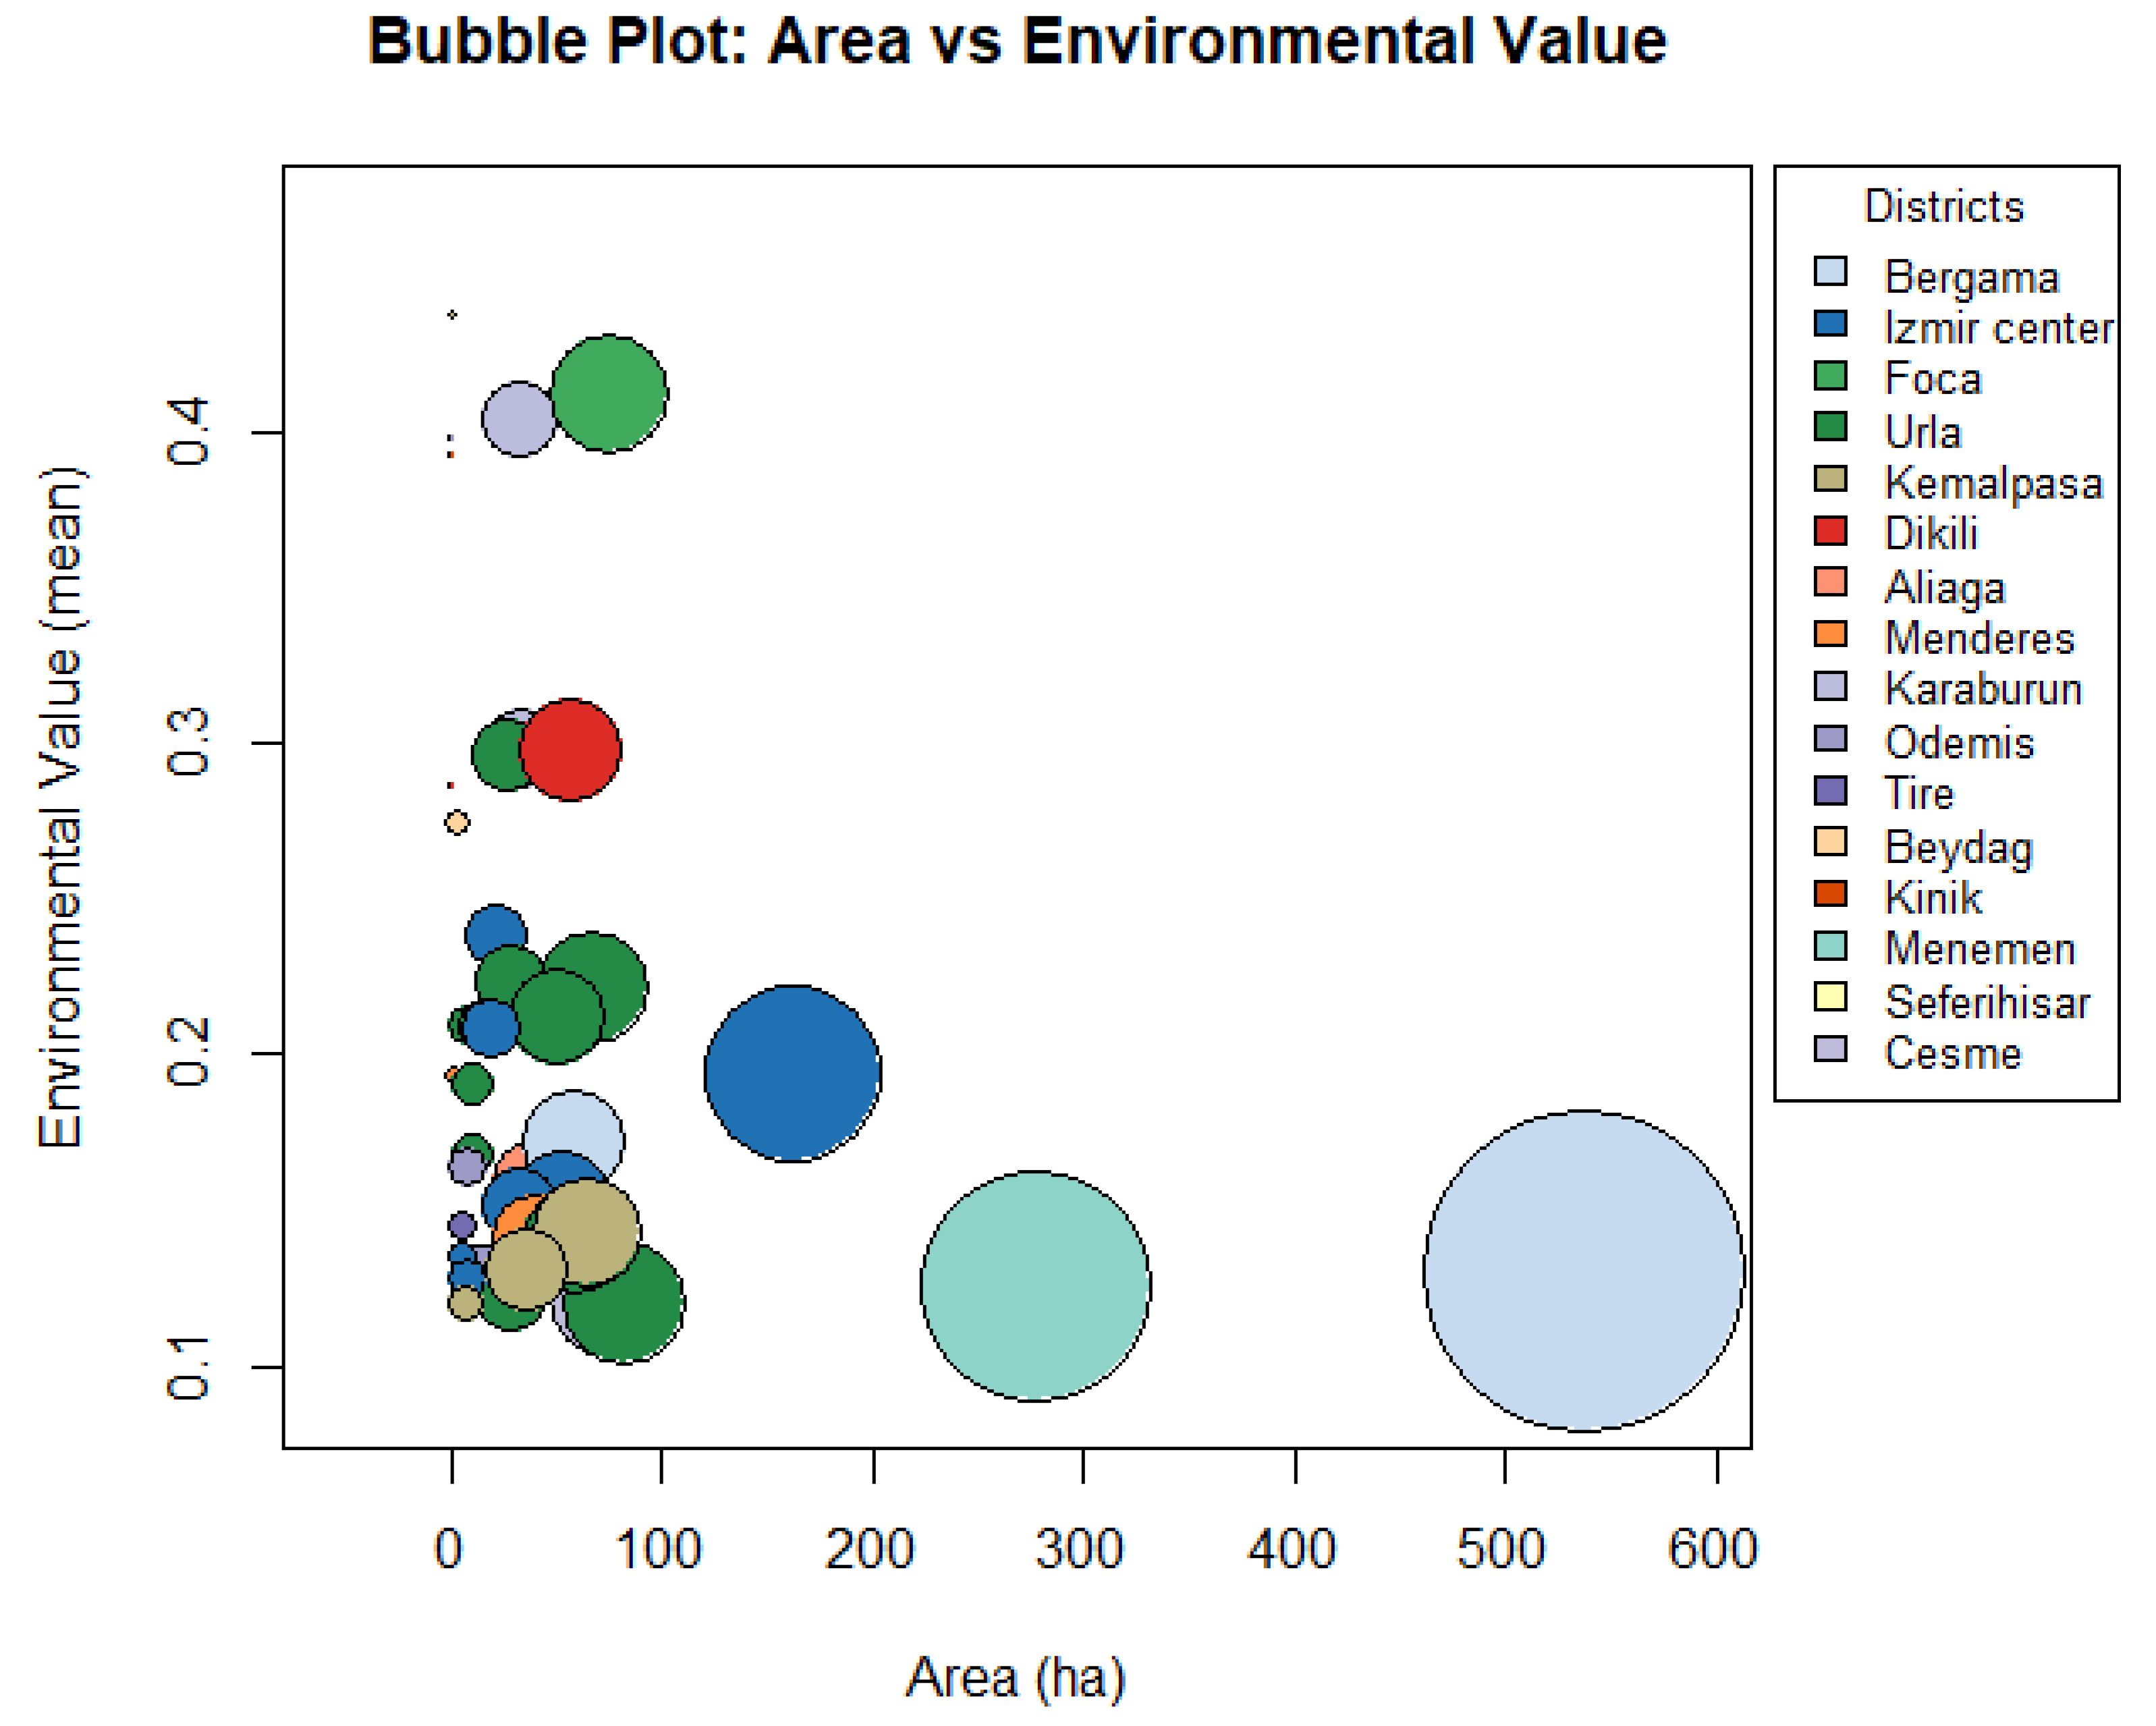
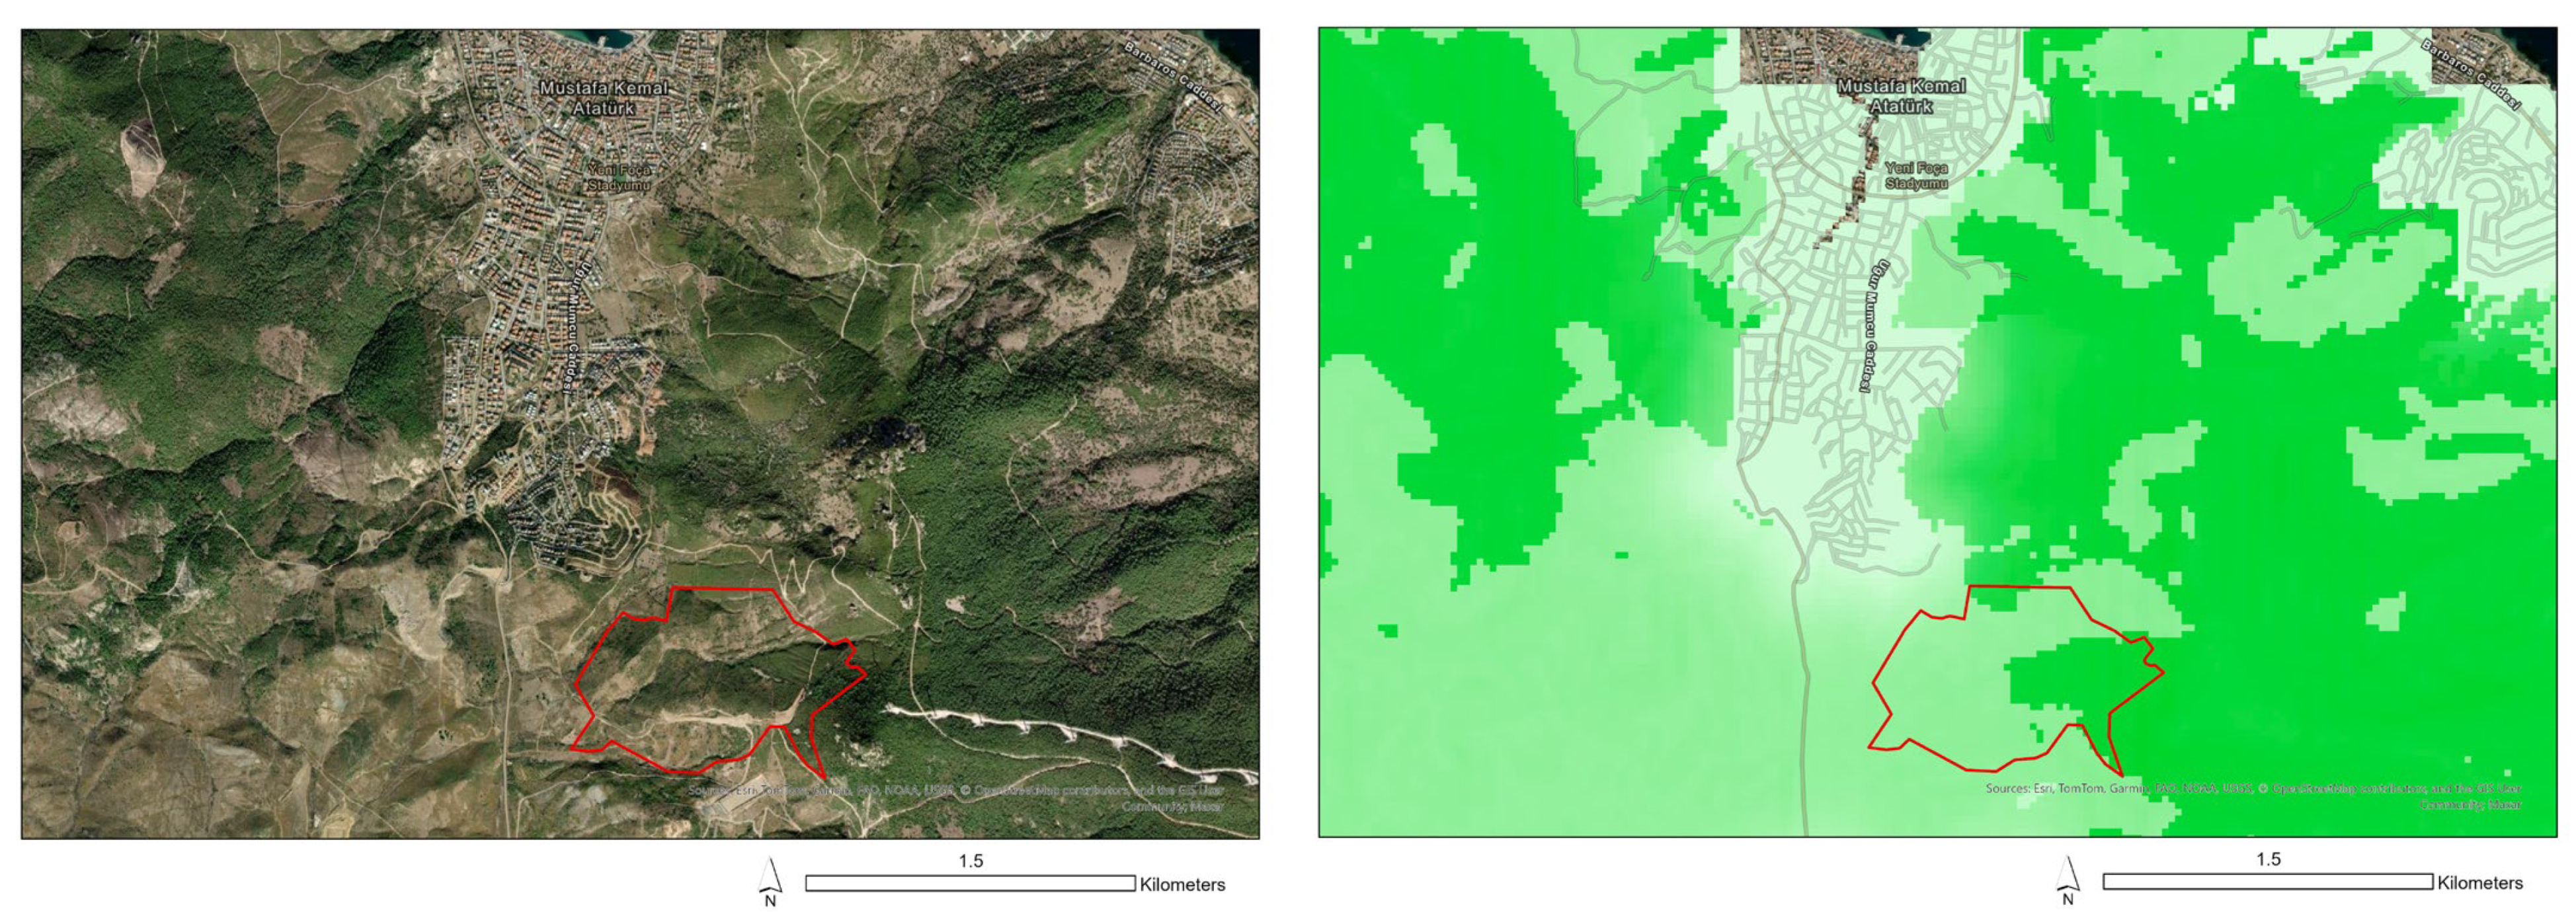
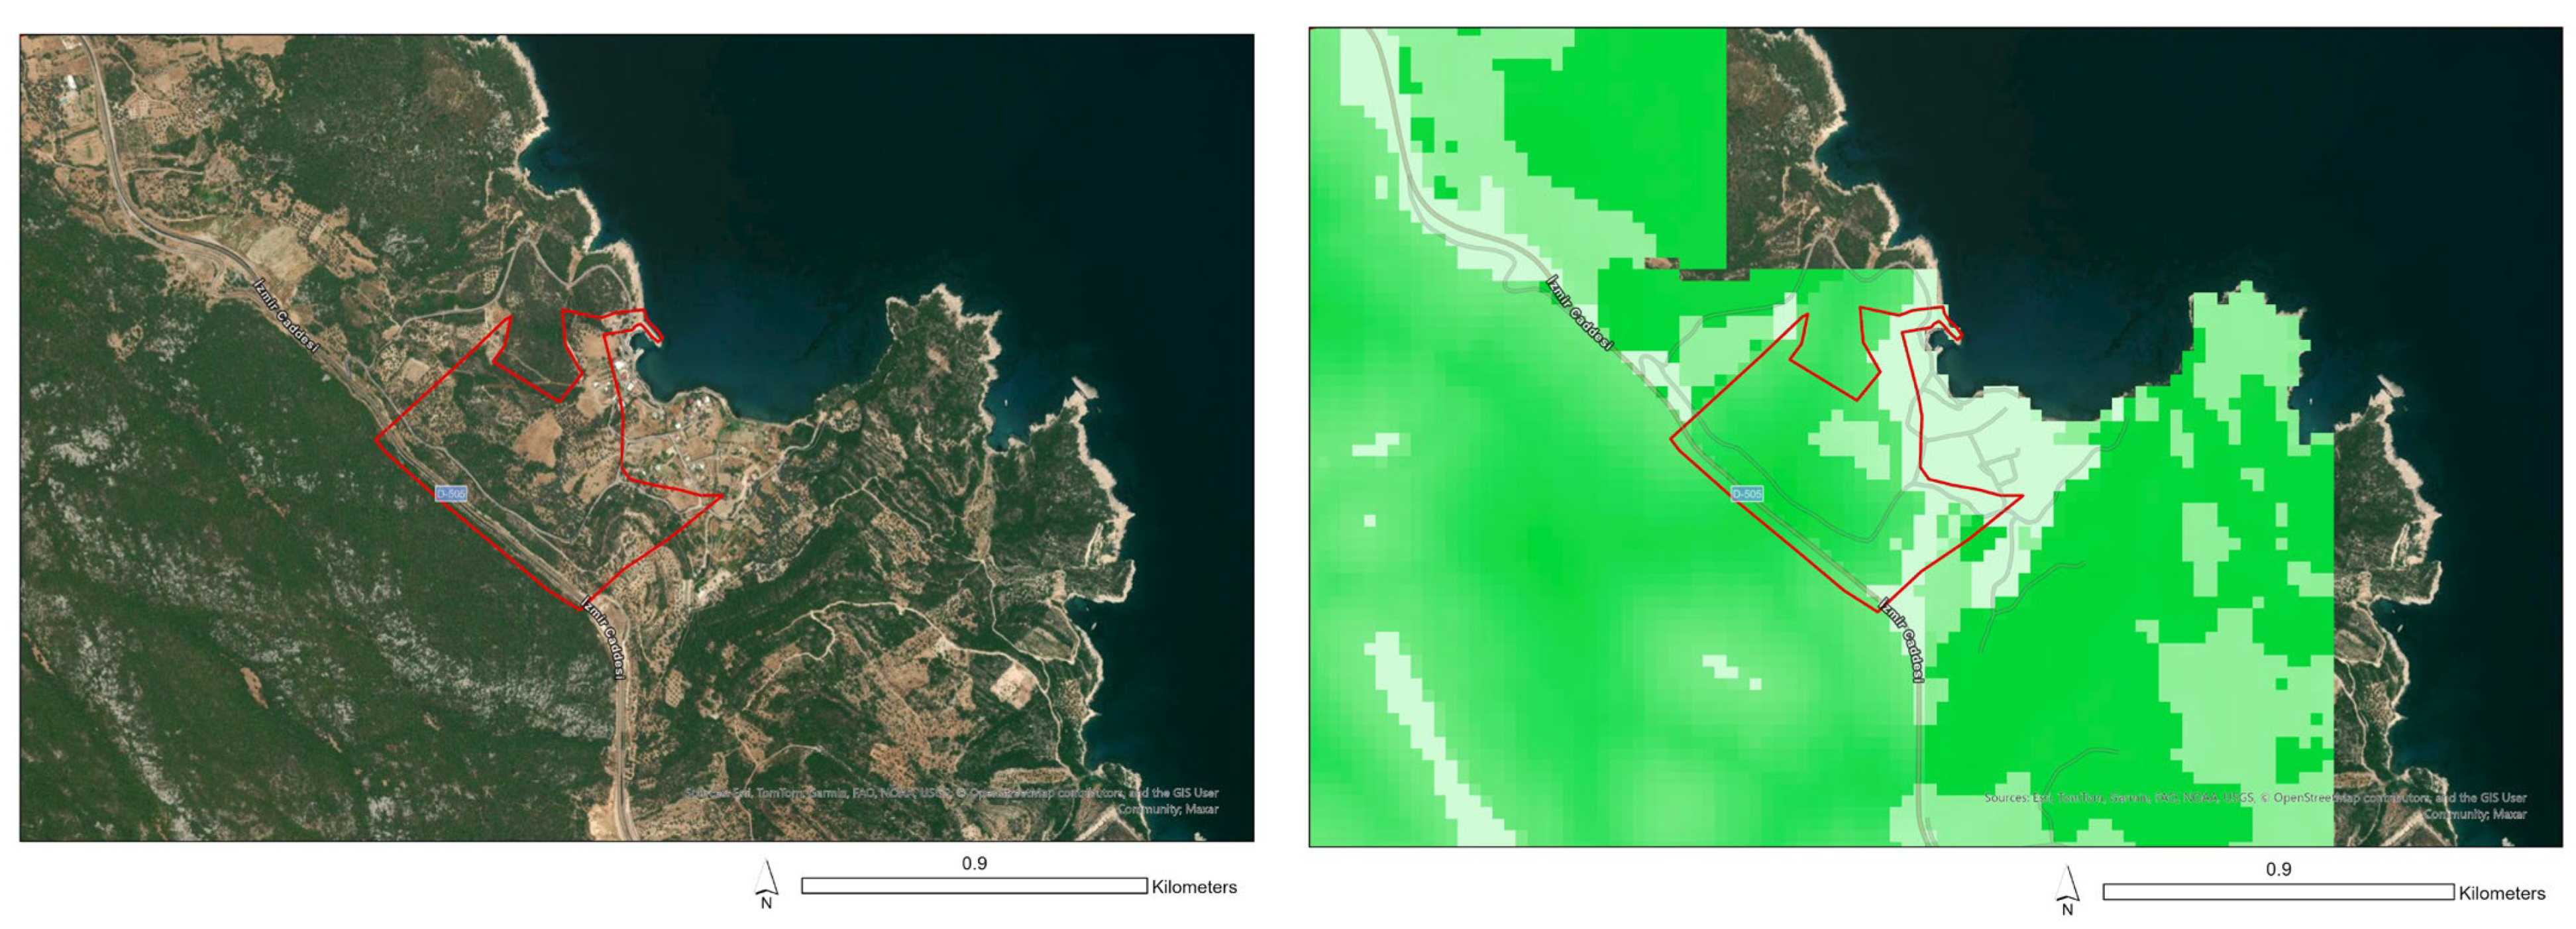
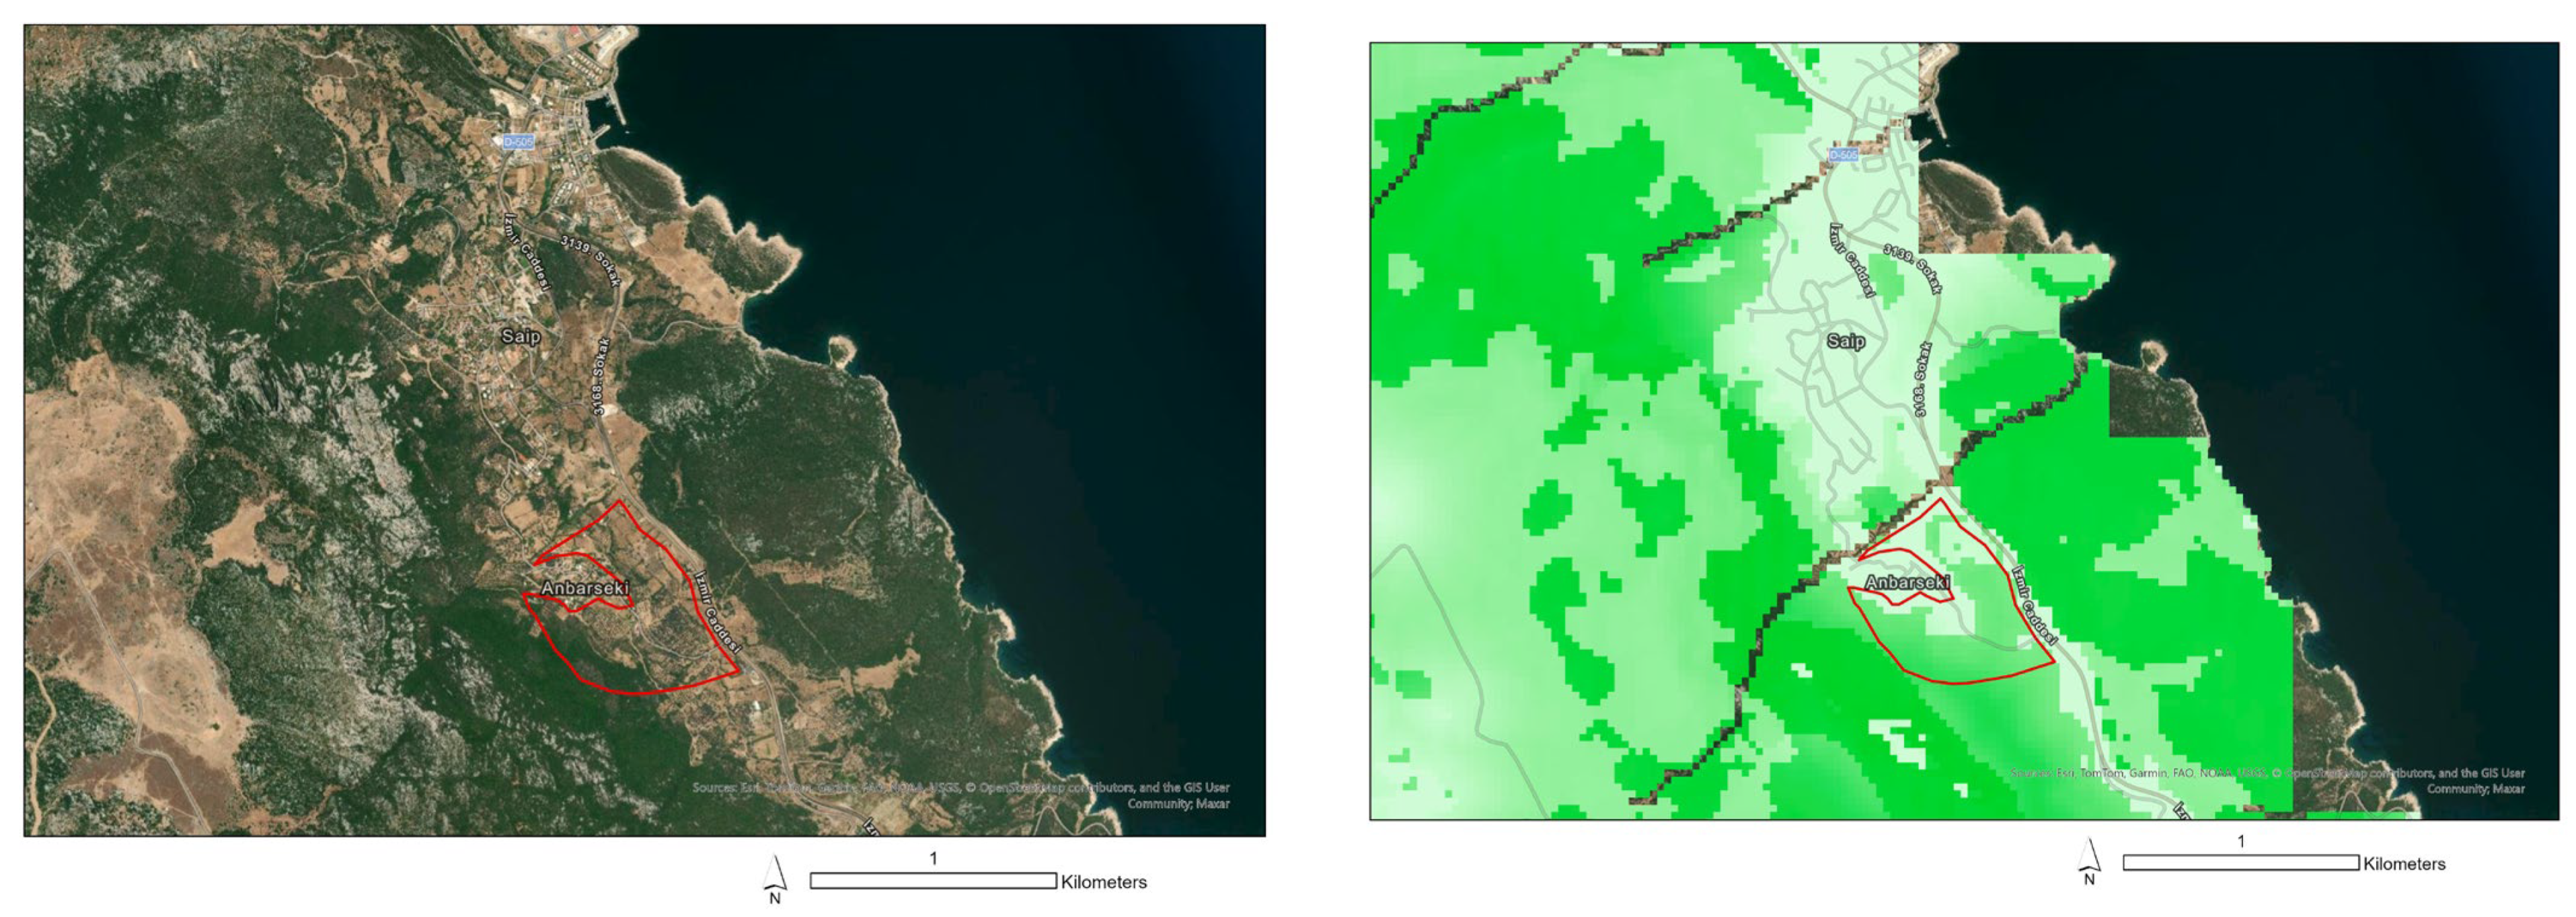
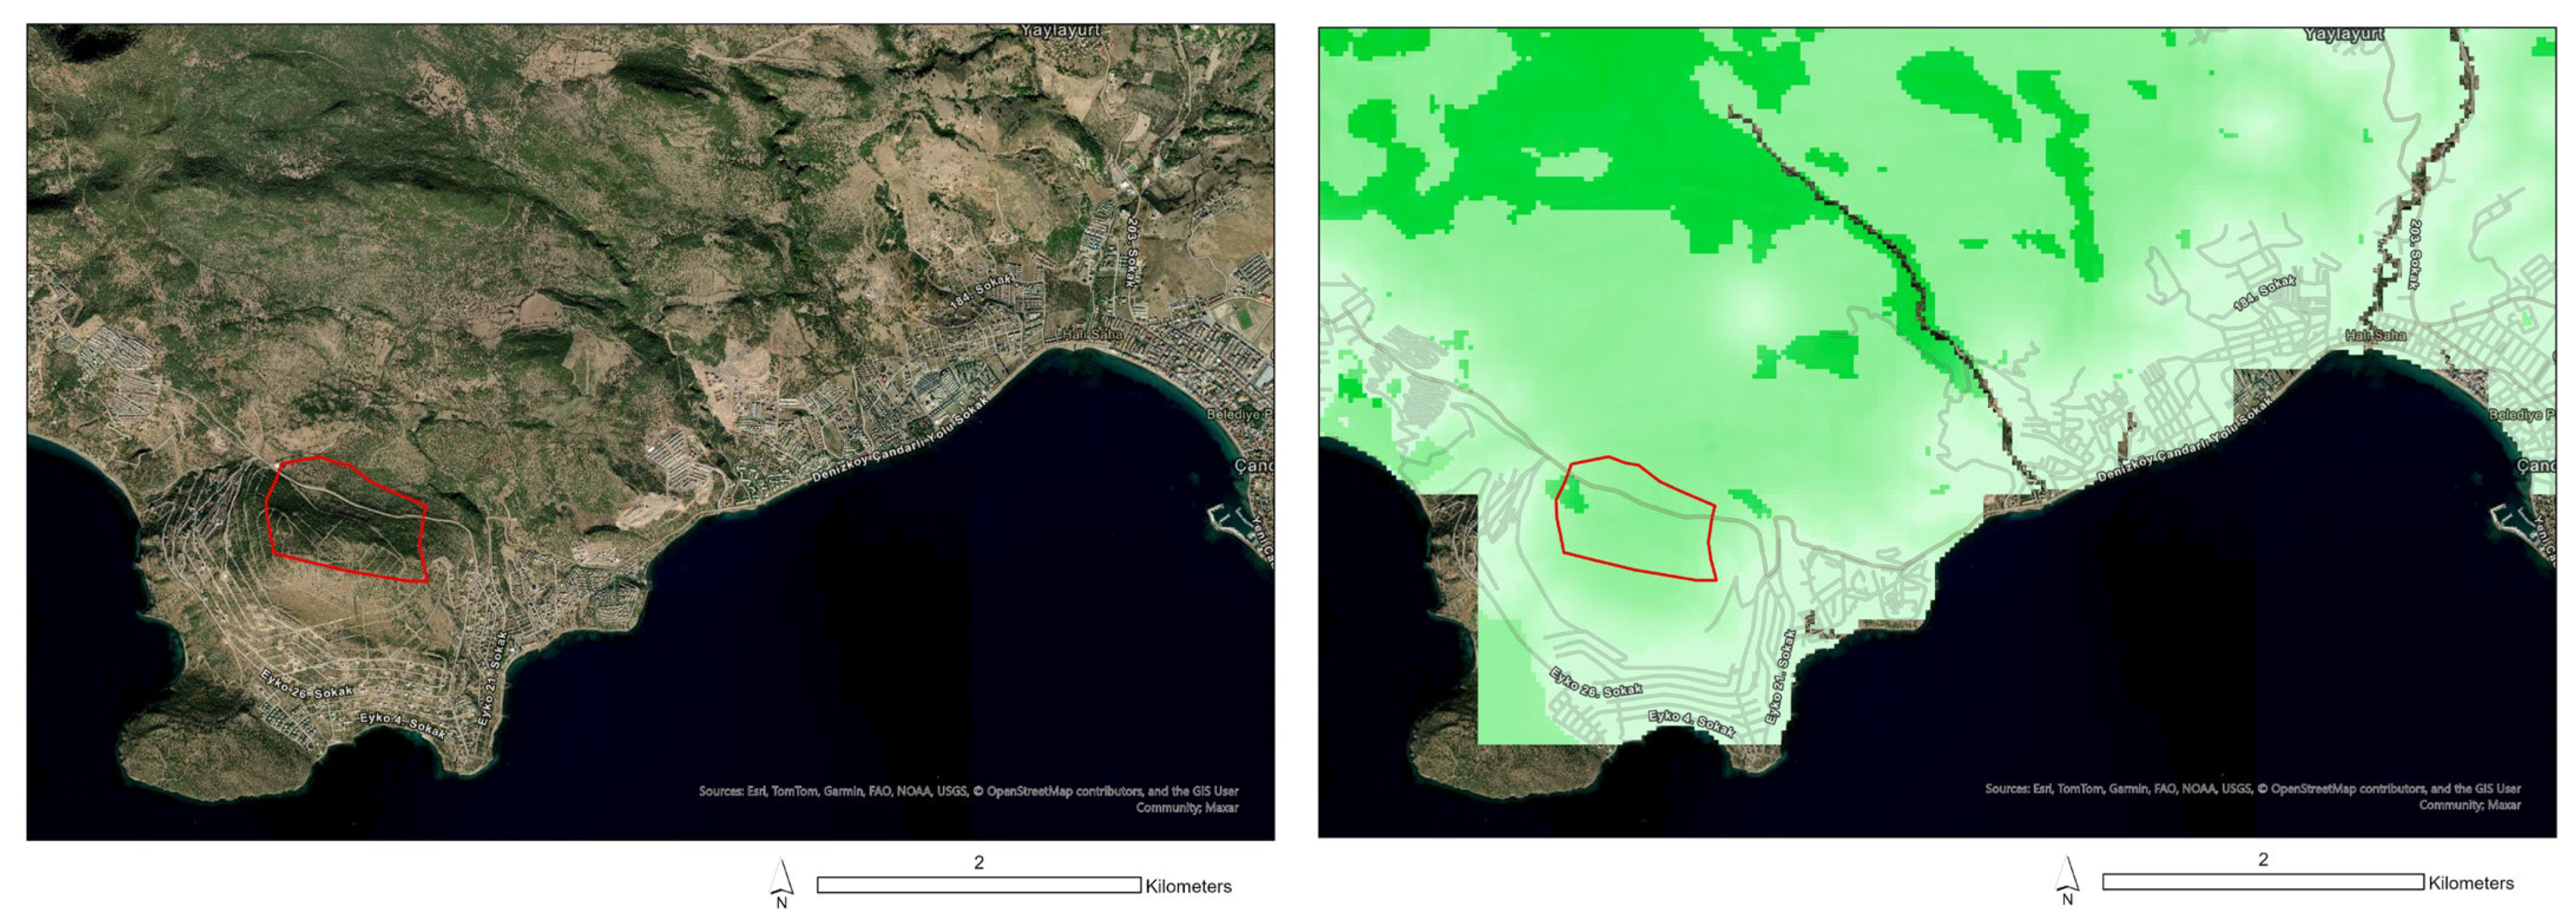
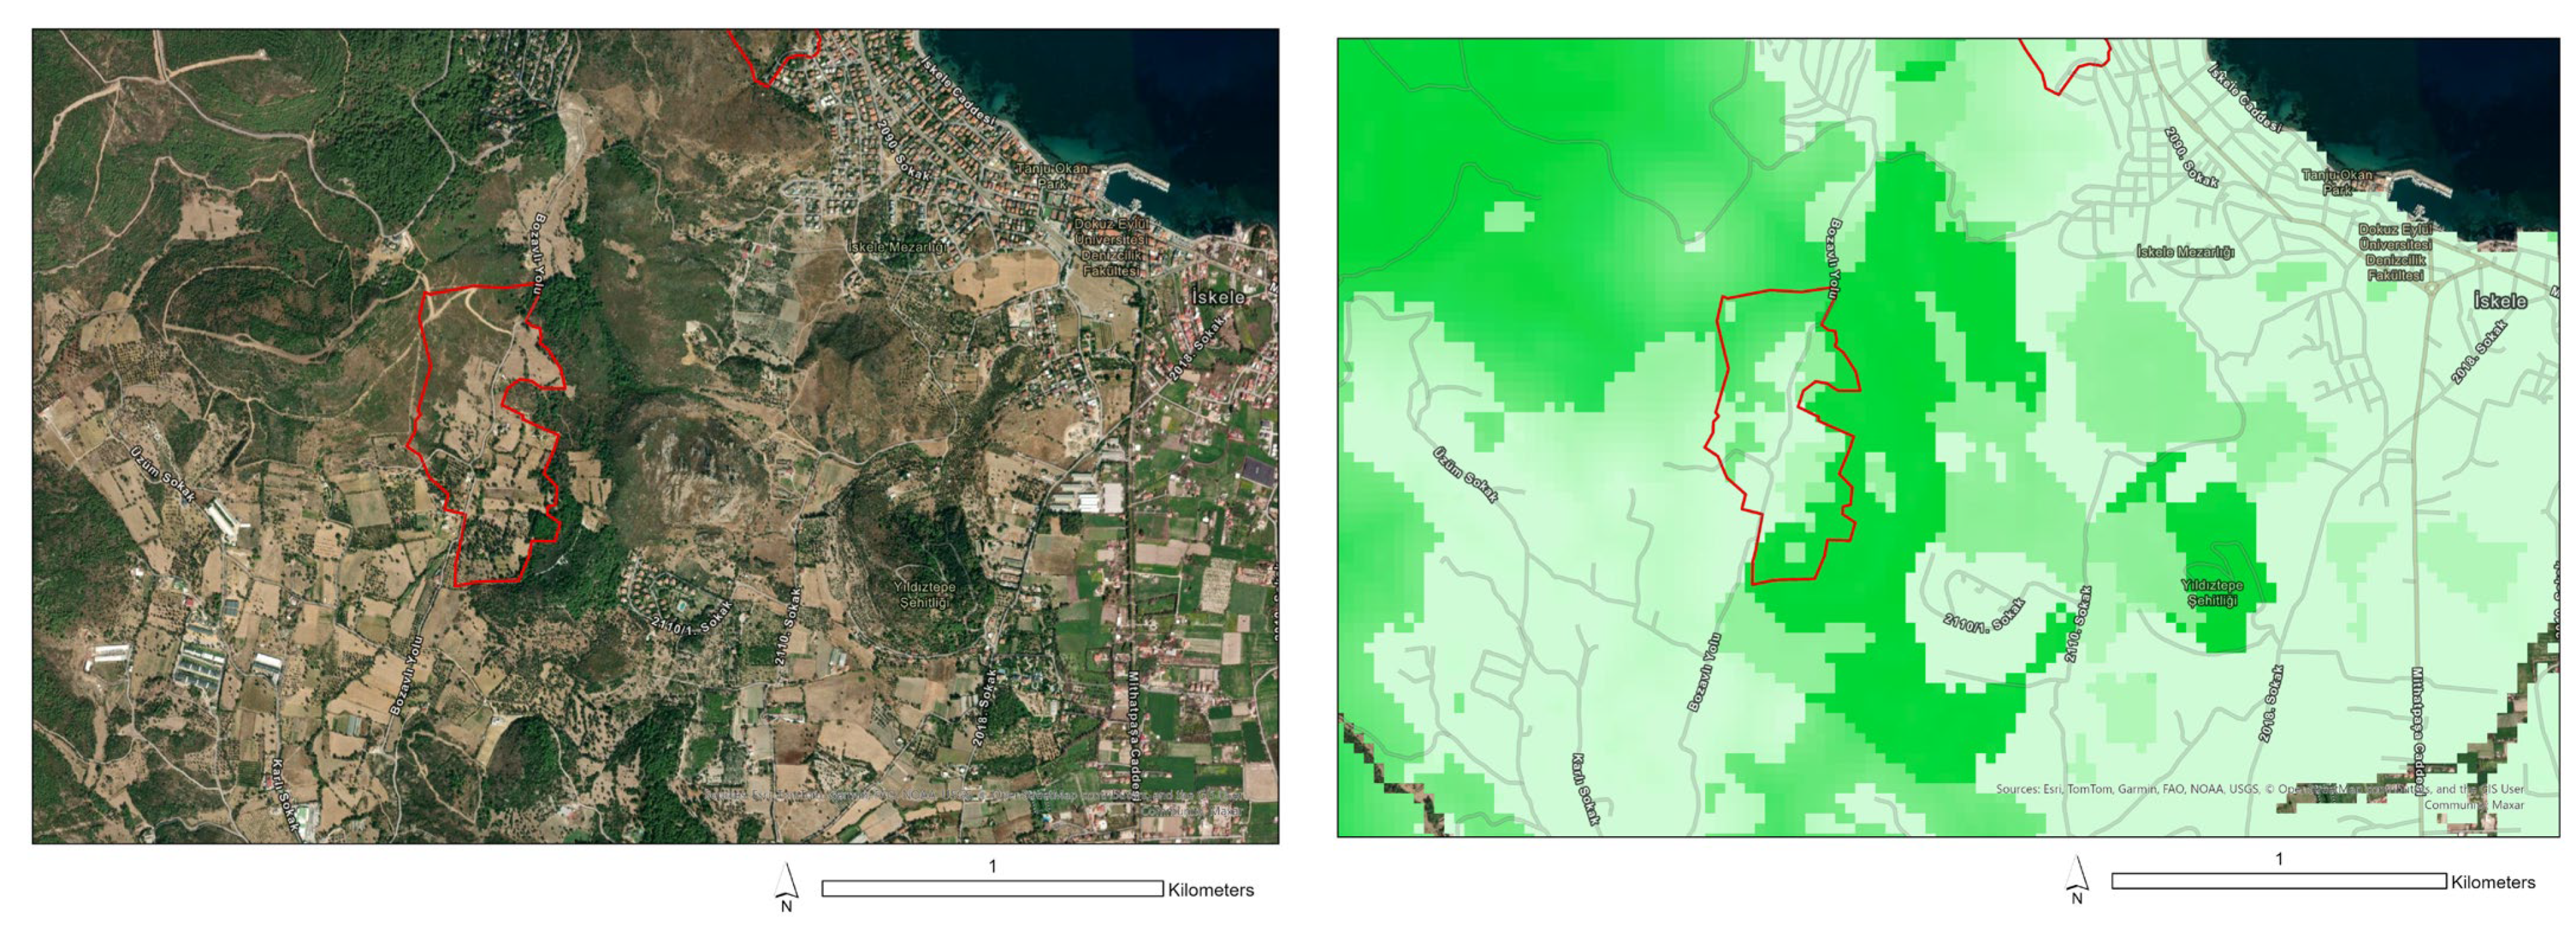
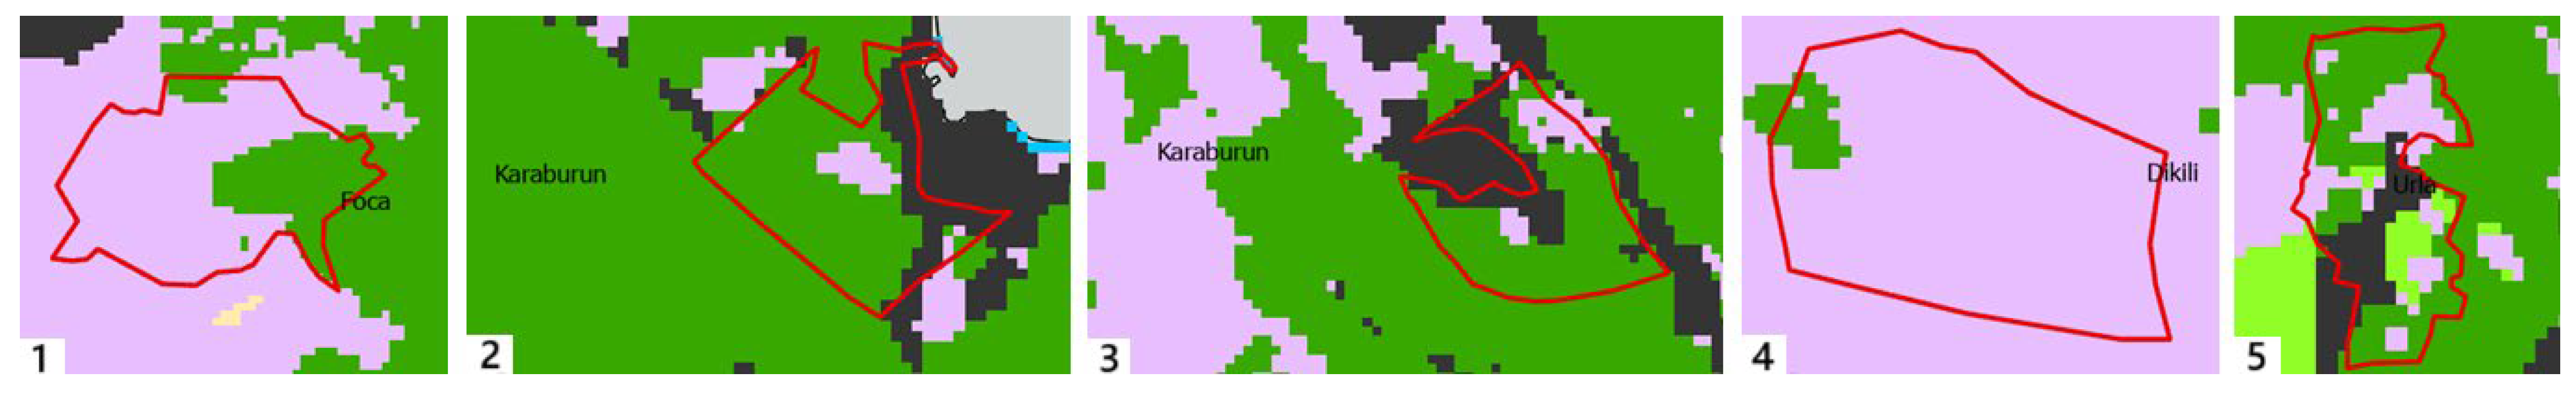
When the five areas with the highest environmental value (larger than 10 hectares) in the Izmir metropolitan area are examined in detail, the highest share in land use rates is shrubland (53%) and forest area (37%). Therefore, shrubland and forest are the most common in conflict areas with environmental value in urban development areas. Shrubland areas are prominent in the Dikili and Foca regions, while forested areas are more extensive in Urla and Karaburun, as shown in Table 9 and Figure 13.
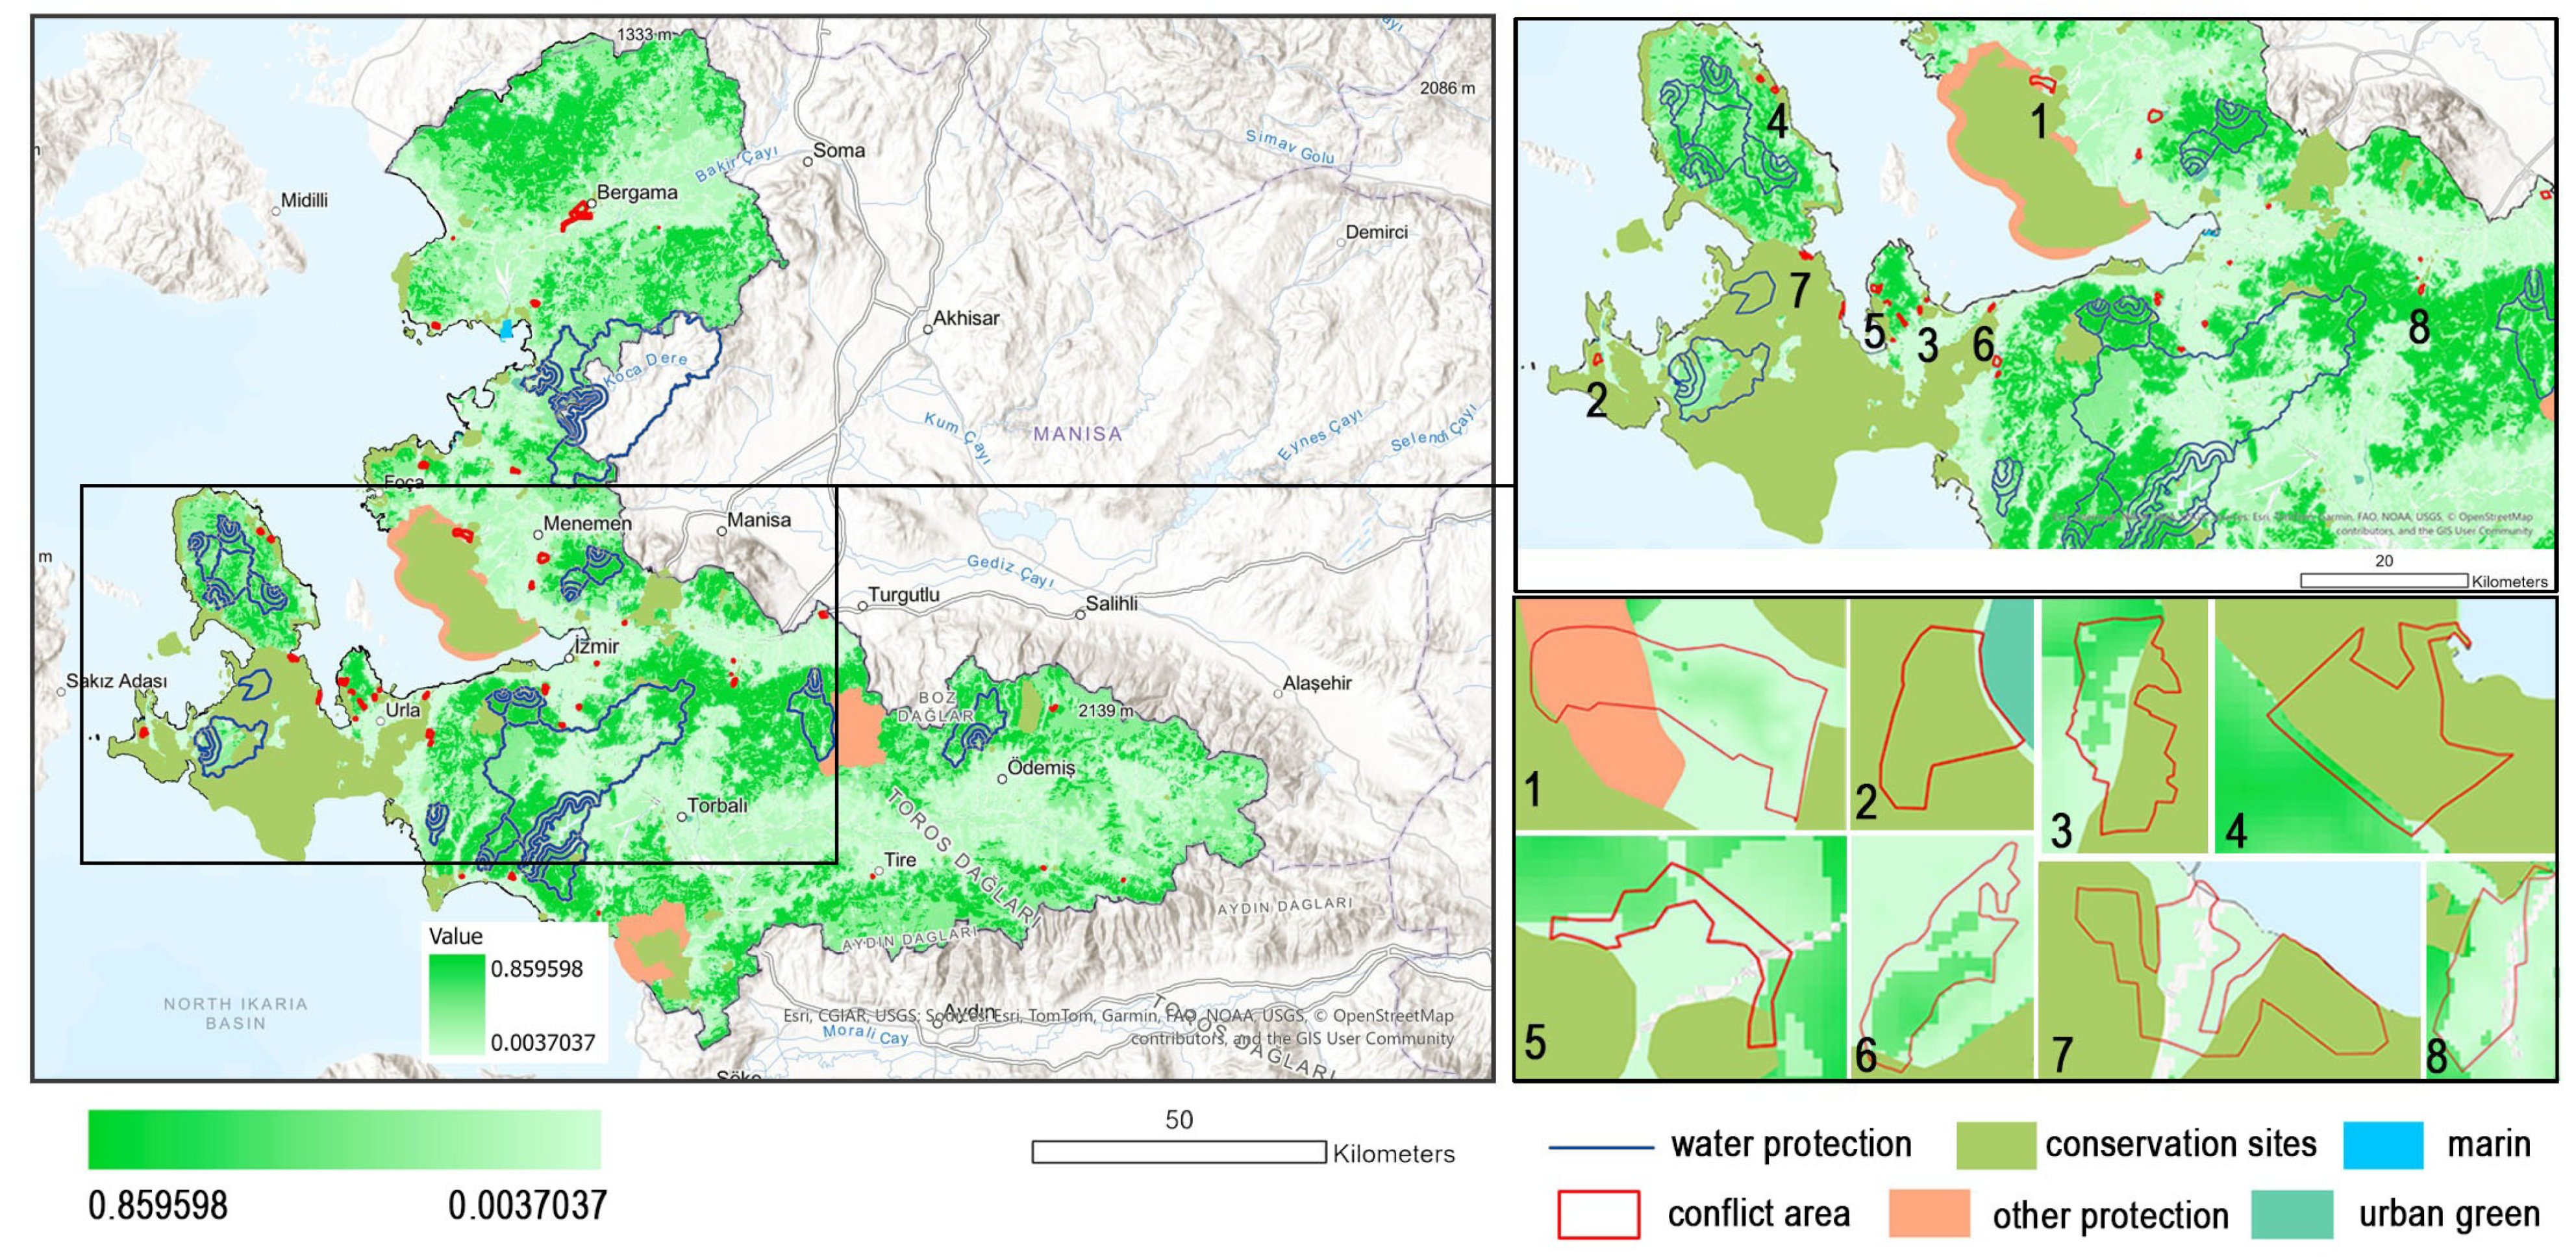
As previously mentioned, the conflict areas (41 areas) are between settlement expansion and composite ecosystem service. When examining the areas designated for environmental protection in the Izmir Environmental Plan (such as water protection areas, conservation sites, marine areas, urban green areas, and other protection areas), 80% of areas (33 areas) fall outside the scope of protection decisions, while 20% of areas (8 areas) overlap with conflict areas. In this case, these areas are not only zones where urban expansion conflicts with the natural environment, but also areas that overlap with existing environmental protection decisions.
Among the 41 conflict areas, 8 overlap with existing environmental protection zones (Figure 14). The first of these areas is located in the Menemen district, with an average environmental value of 0.126. The second area has the lowest average environmental value among the eight, at 0.122 in the Cesme district. Four overlapping areas are located in the Urla district, numbered 3, 5, 6, and 7, with average environmental values of 0.295, 0.190, 0.223, and 0.14, respectively. The area numbered 4, located in the Karaburun district, has the highest average environmental value among the eight, at 0.404. Finally, the eighth area is situated in the Kemalpasa district, with an average environmental value of 0.131.
The discussion indicates that the conservation sites in the plan conflict with settlement expansion with the highest environmental value. Eight out of the forty-one conflict areas overlap with zones that already have environmental protection status. This shows that even areas under official conservation decisions are under pressure from urban expansion. The majority of conflict areas with high environmental value are not currently within protected zones. This is especially important, as some of the most ecologically valuable areas such as Karaburun and Urla are among the top five areas with the highest environmental value (Areas 2 and 5 in Figure 13), yet they face threats from urban growth without any formal protection. These discussions highlight the need to revise conservation strategies by identifying and protecting areas with high composite environmental value, even if they are not yet officially designated.
It is important to examine synergies and conflicts in ecosystem services for sustainable and climate-resilient development [40]. Quantitative analysis of trade-offs and synergies between LULC changes and ES helps accurately identify their quality status and key driving factors in the region [33]. In the study, environmental value was determined by evaluating ecosystem services (habitat quality, carbon storage and sequestration, and sediment delivery ratio) in synergy and conflict areas in Izmir. According to the 2023 land use data, areas that once had high environmental value have now been classified as ’synergy zones’ in the current analysis as they have already been transformed into artificial areas. Therefore, analyzing the changes over the years may reveal different outcomes. This study differs from studies examining temporal land use change [33,40]. The study provides knowledge by investigating the environmental value of ecosystem services and the associated conflicts and synergies in urban development areas by exploring their interactions.

5. Conclusions

The evaluation of ecosystem services has become an urgent necessity for the effective implementation of policies [43]. The increasing pressure of urbanization on ecosystem services (ESs) has become a critical issue highlighting the need to consider these services when identifying urban development areas in the context of planning decisions. Land use and land cover dynamics profoundly affect ecosystem services [34,42,44].
This study examines the relationship between urban development areas, as defined by planning decisions, and the environmental value derived from key analyses of habitat quality, carbon storage and sequestration, and sediment delivery ratio. Areas with the highest environmental value, greater than 10 hectares, are predominantly forested regions. In the İzmir metropolitan area, it has been observed that urban development often conflicts with the environmental value provided primarily by forests. Also, we highlight the need to revise conservation strategies by identifying and protecting areas with high composite environmental value, even if they are not yet officially designated.
In order to mitigate this conflict and support climate neutrality, it is crucial to assess ecosystem services and consider environmental values before making planning decisions. Protecting high-value areas such as forests, which contribute significantly to carbon storage and climate regulation, is essential to reconcile urban growth with environmental and climate goals.
The study acknowledges several limitations such as using local parameters in the InVEST model rather than relying on default values, as this can lead to more accurate and context-specific environmental assessments. In addition, optimizing the contributions of different ecosystem services can improve the reliability of environmental valuations.
Future research should focus on conducting more comprehensive analyses and comparing different case study areas to further refine planning strategies. Synergies and conflicts in other planning decisions (for example; mining area, protected area and, industrial area) can also be examined to drive land use management. The results underscore the importance of integrating ecosystem service analysis into planning processes, not only for sustainable urban development but also for the advancement of climate-neutral land management.

Supplementary Materials

The following supporting information can be downloaded at https://www.mdpi.com/article/10.3390/su17073237/s1, Pdf File S1: Pearson Correlation Analysis Results

Author Contributions

Conceptualization, E.K.G. and S.S.; methodology, E.K.G. and S.S.; software, E.K.G. and S.S.; validation, E.K.G. and S.S.; formal analysis, E.K.G. and S.S.; investigation, E.K.G. and S.S.; resources, E.K.G. and S.S. data curation, E.K.G. and S.S.; writing—original draft preparation, E.K.G.; writing—review and editing, E.K.G. and S.S.; visualization, E.K.G.; supervision, S.S.; project administration, E.K.G. and S.S.; funding acquisition, E.K.G. and S.S. All authors have read and agreed to the published version of the manuscript.

Funding

This research was supported by the Scientific and Technological Research Council of Turkey (TUBITAK) 2219 Postdoctoral Fellowship under the project titled “Land use and land cover change effects on ecosystem services and land use structure optimization based on climate neutrality in Izmir” (no. 1059B192302435).

Institutional Review Board Statement

Not applicable.

Informed Consent Statement

Not applicable.

Data Availability Statement

Data are contained within the article.

Conflicts of Interest

The authors declare no conflicts of interest.

Abbreviations

The following abbreviations are used in this manuscript:
ESEcosystem Services
GIGreen Infrastructure
NBSNature Based Solutions
LULCLand Use and Land Cover
EUEuropean Union (EU)
GISGeographic Information Systems
InVESTThe Integrated Valuation of Ecosystem Services and Trade-offs

References

  1. Hu, Y.; Li, Y.; Li, Y.; Wu, J.; Zheng, H.; He, H. Balancing urban expansion with a focus on ecological security: A case study of Zhaotong City, China. Ecol. Indic. 2023, 156, 111105. [Google Scholar]
  2. Foley, J.A.; DeFries, R.; Asner, G.P.; Barford, C.; Bonan, G.; Carpenter, S.R.; Chapin, F.S.; Coe, M.T.; Daily, G.C.; Gibbs, H.K.; et al. Global consequences of land use. Science 2005, 309, 570–574. [Google Scholar] [PubMed]
  3. Seto, K.C.; Güneralp, B.; Hutyra, L.R. Global forecasts of urban expansion to 2030 and direct impacts on biodiversity and carbon pools. Proc. Natl. Acad. Sci. USA 2012, 109, 16083–16088. [Google Scholar] [PubMed]
  4. European Commission. 2025. Available online: https://environment.ec.europa.eu/topics/nature-and-biodiversity/green-infrastructure_en#:~:text=Green%20infrastructure%20has%20been%20defined,example%2C%20water%20purification%2C%20improving%20air (accessed on 20 January 2025).
  5. Benedict, M.A.; McMahon, E.T. Green infrastructure: Smart conservation for the 21st century. Renew. Resour. J. 2001, 20, 12–17. [Google Scholar]
  6. Salata, S.; Giaimo, C.; Barbieri, C.A.; Garnero, G. The utilization of ecosystem services mapping in land use planning: The experience of LIFE SAM4CP project. J. Environ. Plan. Manag. 2019, 63, 523–545. [Google Scholar] [CrossRef]
  7. Bortolini, L.; Zanin, G. Hydrological behaviour of rain gardens and plant suitability: A study in the Veneto plain (north-eastern Italy) conditions. Urban For. Urban Green. 2018, 34, 121–133. [Google Scholar] [CrossRef]
  8. Isola, F.; Lai, S.; Leone, F.; Zoppi, C. Strengthening a Regional Green Infrastructure through Improved Multifunctionality and Connectedness: Policy Suggestions from Sardinia, Italy. Sustainability 2022, 14, 9788. [Google Scholar] [CrossRef]
  9. European Commission. Future Brıef: No Net Land Take by 2050? European Commission: Brussels, Belgium, 2016. [Google Scholar] [CrossRef]
  10. Albert, C.; Schröter, B.; Haase, D.; Brillinger, M.; Henze, J.; Herrmann, S.; Gottwald, S.; Guerrero, P.; Nicolas, C.; Matzdorf, B. Addressing societal challenges through nature-based solutions: How can landscape planning and governance research contribute? Landsc. Urban Plan. 2019, 182, 12–21. [Google Scholar] [CrossRef]
  11. Angeler, D.G.; Allen, C.R. Quantifying resilience. J. Appl. Ecol. 2016, 53, 617–624. [Google Scholar] [CrossRef]
  12. Clerici, N.; Paracchini, M.L.; Maes, J. Land-cover change dynamics and insights into ecosystem services in European stream riparian zones. Ecohydrol. Hydrobiol. 2014, 14, 107–120. [Google Scholar] [CrossRef]
  13. Dorst, H.; van der Jagt, S.; Raven, R.; Runhaar, H. Urban greening through Nature-Based Solutions—Key characteristics of an emerging concept. Sustain. Cities Soc. 2019, 49, 101620. [Google Scholar] [CrossRef]
  14. Herreros-Cantis, P.; McPhearson, T. Mapping supply of and demand for ecosystem services to assess environmental justice in New York City. Ecol. Appl. 2021, 31, e02390. [Google Scholar] [CrossRef] [PubMed]
  15. Dizdaroglu, D.; Yigitcanlar, T. Integrating urban ecosystem sustainability assessment into policy-making: Insights from the Gold Coast City. J. Environ. Plan. Manag. 2016, 59, 1982–2006. [Google Scholar] [CrossRef]
  16. Castelo, S.; Amado, M.; Ferreira, F. Challenges and Opportunities in the Use of Nature-Based Solutions for Urban Adaptation. Sustainability 2023, 15, 7243. [Google Scholar] [CrossRef]
  17. Donati GF, A.; Bolliger, J.; Psomas, A.; Maurer, M.; Bach, P.M. Reconciling cities with nature: Identifying local Blue-Green Infrastructure interventions for regional biodiversity enhancement. J. Environ. Manag. 2022, 316, 115254. [Google Scholar] [CrossRef]
  18. Raymond, C.M.; Frantzeskaki, N.; Kabisch, N.; Berry, P.; Breil, M.; Nita, M.R.; Geneletti, D.; Calfapietra, C. A framework for assessing and implementing the co-benefits of nature-based solutions in urban areas. Environ. Sci. Policy 2017, 77, 15–24. [Google Scholar] [CrossRef]
  19. Asadolahi, Z.; Salmanmahiny, A.; Sakieh, Y.; Mirkarimi, S.H.; Baral, H.; Azimi, M. Dynamic trade-off analysis of multiple ecosystem services under land use change scenarios: Towards putting ecosystem services into planning in Iran. Ecol. Complex. 2018, 36, 250–260. [Google Scholar]
  20. Von Haaren, C.; Albert, C. Integrating ecosystem services and environmental planning: Limitations and synergies. Int. J. Biodivers. Sci. Ecosyst. Serv. Manag. 2011, 7, 150–167. [Google Scholar] [CrossRef]
  21. Rall, E.L.; Kabisch, N.; Hansen, R. A comparative exploration of uptake and potential application of ecosystem services in urban planning. Ecosyst. Serv. 2015, 16, 230–242. [Google Scholar] [CrossRef]
  22. Chen, H. Land use trade-offs associated with protected areas in China: Current state, existing evaluation methods, and future application of ecosystem service valuation. Sci. Total Environ. 2020, 711, 134688. [Google Scholar] [CrossRef]
  23. Cortinovis, C.; Geneletti, D. Ecosystem services in urban plans: What is there, and what is still needed for better decisions. Land Use Policy 2018, 70, 298–312. [Google Scholar] [CrossRef]
  24. Grêt-Regamey, A.; Sirén, E.; Brunner, S.H.; Weibel, B. Review of decision support tools to operationalize the ecosystem services concept. Ecosyst. Serv. 2017, 26, 306–315. [Google Scholar] [CrossRef]
  25. Woodruff, S.C.; BenDor, T.K. Ecosystem services in urban planning: Comparative paradigms and guidelines for high quality plans. Landsc. Urban Plan. 2016, 152, 90–100. [Google Scholar] [CrossRef]
  26. Velibeyoğlu, K.; Özdemir, S.; Baba, A.; Arsan, Z.D.; Yazdani, H.; Hazar, D.; Kaplan, A.; Boyacı, M.; Kurucu, Y.; Erdoğan, N.; et al. ‘Urla-Çeşme-Karaburun’ Peninsula Sustainable Development Strategy 2014–2023; İZKA (İzmir Development Agency): İzmir, Türkiye, 2014. [Google Scholar]
  27. Salata, S.; Özkavaf-Şenalp, S.; Velibeyoğlu, K. Integrating Ecosystem Vulnerability in the Environmental Regulation Plan of Izmir (Turkey) What Are the Limits and Potentialities? Urban Sci. 2022, 6, 19. [Google Scholar] [CrossRef]
  28. Coskun Hepcan, C. Quantifying landscape pattern and connectivity in a Mediterranean coastal settlement: The case of the Urla district, Turkey. Environ. Monit. Assess. 2013, 185, 143–155. [Google Scholar] [CrossRef]
  29. TURKSTAT. 2024. Available online: https://www.tuik.gov.tr/ (accessed on 20 November 2024).
  30. IZKA. IZMIR Population Projection 2022–2025. 2025. Available online: https://izka.org.tr/wp-content/uploads/pdf/izmir-ili-nufus-projeksiyonlari.pdf#page=24.15 (accessed on 20 March 2025).
  31. ESRI. 2024. Available online: https://livingatlas.arcgis.com/landcover/ (accessed on 13 November 2024).
  32. Arcidiacono, A.; Ronchi, S.; Salata, S. Managing Multiple Ecosystem Services for Landscape Conservation: A Green Infrastructure in Lombardy Region. Procedia Eng. 2016, 161, 2297–2303. [Google Scholar] [CrossRef]
  33. Du, J.; Gong, Y.; Xi, X.; Liu, C.; Qian, C.; Ye, B. The study on the spatiotemporal changes in tradeoffs and synergies of ecosystem services and response to land use/land cover changes in the region around Taihu Lake. Heliyon 2024, 10, e33375. [Google Scholar] [CrossRef]
  34. Hua, Y.; Yan, D.; Liu, X. Assessing synergies and trade-offs between ecosystem services in highly urbanized area under different scenarios of future land use change. Environ. Sustain. Indic. 2024, 22, 100350. [Google Scholar] [CrossRef]
  35. Salata, S.; Garnero, G.; Barbieri, C.A.; Giaimo, C. The integration of ecosystem services in planning: An evaluation of the nutrient retention model using InVEST software. Land 2017, 6, 48. [Google Scholar] [CrossRef]
  36. InVEST. 2024. Available online: https://naturalcapitalproject.stanford.edu/software/invest (accessed on 13 November 2024).
  37. Zhang, Q.; Yang, L.; Xu, S. The relationships of supporting services and regulating services in National Forest City. Forests 2022, 13, 1368. [Google Scholar] [CrossRef]
  38. McGarigal, K.; Cushman, S.A. Comparative evaluation of experimental approaches to the study of habitat fragmentation effects. Ecol. Appl. 2002, 12, 335–345. [Google Scholar] [CrossRef]
  39. Lam, S.T.; Conway, T.M. Ecosystem services in urban land use planning policies: A case study of Ontario municipalities. Land Use Policy 2018, 77, 641–651. [Google Scholar] [CrossRef]
  40. Yang, Y.; Yuan, X.; An, J.; Su, Q.; Chen, B. Drivers of ecosystem services and their trade-offs and synergies in different land use policy zones of Shaanxi Province, China. J. Clean. Prod. 2024, 452, 142077. [Google Scholar] [CrossRef]
  41. Feng, Z.; Sun, L. Response of spatial and temporal variations of ecosystem service value to land use/land cover transformation in the upper basin of Miyun Reservoir. Ecol. Indic. 2024, 160, 111819. [Google Scholar] [CrossRef]
  42. Zheng, H.; Peng, J.; Qiu, S.; Xu, Z.; Zhou, F.; Xia, P.; Adalibieke, W. Distinguishing the impacts of land use change in intensity and type on ecosystem services trade-offs. J. Environ. Manag. 2022, 316, 115206. [Google Scholar] [CrossRef]
  43. Yang, H.; Cao, J.; Hou, X. Study on the Evaluation and Assessment of Ecosystem Service Spatial Differentiation at Different Scales in Mountainous Areas around the Beijing–Tianjin–Hebei Region, China. Int. J. Environ. Res. Public Health 2023, 20, 1639. [Google Scholar] [CrossRef]
  44. García, A.G.; Ruiz, I.P.; Novoa JA, G.; Santiago, C.L.; del Olmo, C.M. Quantifying spatial supply-demand mismatches in ecosystem services provides insights for land-use planning. Land Use Policy Int. J. Cover. All Asp. Land Use 2020, 94, 104493. [Google Scholar] [CrossRef]
Figure 1. The location of Izmir Province in Turkiye and land cover map in 2023 (Adapted from [31]).
Sustainability 17 03237 g001
Figure 2. Land use and land cover map in Izmir, 2023 (Adapted from [24]).
Sustainability 17 03237 g002
Figure 3. Habitat quality (a), carbon storage and sequestration (b), and sediment delivery ratio (c) in Izmir.
Sustainability 17 03237 g003
Figure 4. Environmental value with synergy and conflicts.
Sustainability 17 03237 g004
Figure 5. Distribution of mean environmental value of conflict areas.
Sustainability 17 03237 g005
Figure 6. Bubble plot settlement expansion area (ha) and environmental value (mean).
Sustainability 17 03237 g006
Figure 7. Scatter plot of area size and environmental value of conflict areas.
Sustainability 17 03237 g007
Figure 8. First conflict area in Foca district is shown on the basemap (left) and environmental value map (right).
Sustainability 17 03237 g008
Figure 9. Second conflict area in Karaburun district, shown on the basemap (left) and the environmental value map (right).
Sustainability 17 03237 g009
Figure 10. Third conflict area in Karaburun district, shown on the basemap (left) and the environmental value map (right).
Sustainability 17 03237 g010
Figure 11. Fourth conflict area in Dikili district, shown on the basemap (left) and the environmental value map (right).
Sustainability 17 03237 g011
Figure 12. Fifth conflict area in Urla district, shown on the basemap (left) and the environmental value map (right).
Sustainability 17 03237 g012
Figure 13. Five conflict areas in Izmir (1—Foca, 2—Karaburun, 3—Karaburun, 4—Dikili, and 5—Urla).
Sustainability 17 03237 g013
Figure 14. Overlapping of conservation areas in “Izmir Environmental Regulation Plan” and conflict areas.
Sustainability 17 03237 g014
Table 1. Revised land use and land cover classification (adapted from ESRI landcover dataset [31]).
ESRI CodeESRI LegendCount (Pixel)Study CodeStudy Legend
1Water1,149,6281Water
4Flooded vegetation208,2807Wetland
2Trees38,649,5592Forest
5Crops25,411,8313Agriculture
7Built area13,610,2364Artificial
8Bare ground206,3595Bareland
9Snow/ice170Excluded classification
10Cloud1070Excluded classification
11Rangeland40,028,9656Shrubland
Table 2. Sensitivity table in habitat quality model (adapted from [27,36]).
Lulc CodeNameHabitat ValueUrban
0nodatanullnull
1water11
2forest0.951
3agriculture0.50.7
4artificial0.050
5bareland0.40.6
6shrubland0.80.9
7wetland10.9
Table 3. Carbon pool values in carbon storage model (adapted from [27,36]).
Lulc CodeNameAbove (t/ha)Below (t/ha)Soil (t/ha)Dead (t/ha)
0nodatanullnullnullnull
1water0000
2forest30020013585
3agriculture21105
4artificial2150
5bareland0000
6shrubland88253
7wetland105200
Table 4. Global sources for SDR model.
NameFormatSourceReference Link
DemRaster, tifUSGShttps://earthexplorer.usgs.gov/ (accessed on 10 December 2024)
ErosivityRaster, tifESDAChttps://esdac.jrc.ec.europa.eu/themes/global-rainfall-erosivity (accessed on 10 December 2024)
ErodibilityRaster, tifESDAChttps://esdac.jrc.ec.europa.eu/content/global-soil-erodibility (accessed on 10 December 2024)
Table 5. Biophysical table (adapted from [35,36,37]).
DescriptionLulc CodeUsle_cUsle_pLoad_pEff_pCrit_Len_pRoot_DepthKcLulc_Veg
nodata0nullnullnullnullnullnullnullnull
water10100.415101.050
forest20.02511.360.672035001.0081
agriculture30.41213.570.481510001.11
artificial40.9912.10.261500.20
bareland5110.790.26155000.150
shrubland60.12111.40.62035001.0081
wetland700.20.0050.8150001
Table 6. Land use and land cover in Izmir (adapted from [31]).
Class NameArea (ha)Percentage (%)
Water 11,4961
Forest386,49632
Agricultural area254,11821
Artificial area136,10211
Bareland20640
Shrubland400,29034
Wetland20830
Excluded classes (cloud and snow)10
Table 7. Pearson Correlation analysis between area and environmental value of conflict areas.
AREAAreaEnvironmental Value (mean)
Pearson Correlation1−0.22
Sig. (2-tailed) 0.168
N4141
Table 8. Pearson Correlation analysis between land use/cover types and environmental value in conflict areas.
Environmental Value (Mean)WaterForestAgricultureArtificialBarelandShrubland
Pearson Correlation−0.0660.411 *−0.281−0.247−0.108−0.202
Sig. (2-tailed)0.6820.0080.0750.1190.50.205
N414141414141
* Correlation is significant at the 0.05 level (2-tailed).
Table 9. Land use and land cover of conflict areas (ha).
Conflict Area NoWaterForestAgricultureArtificialBarelandShrublandWetlandTotal
1-Foca022.2800053.2075.48
2-Karaburun0.1322.506.6502.68031.96
3-Karaburun022.1408.0403.63033.81
4-Dikili02.5400052.73055.27
5-Urla013.272.564.7606.55027.14
Total0.1382.732.5619.450118.790223.66
Percentage (%)037190530100
Disclaimer/Publisher’s Note: The statements, opinions and data contained in all publications are solely those of the individual author(s) and contributor(s) and not of MDPI and/or the editor(s). MDPI and/or the editor(s) disclaim responsibility for any injury to people or property resulting from any ideas, methods, instructions or products referred to in the content.

