Article

Which Minimum Indicator Set of Sustainability May Be Utilized in Urban Assessments? Meta-Evidence Gained Through a Systematic Literature Review

Department of Architecture and Design, Architecture Faculty, Sapienza University, Via Flaminia 359, 00196 Rome, Italy
*
Author to whom correspondence should be addressed.
Sustainability 2025, 17(7), 3221; https://doi.org/10.3390/su17073221
Submission received: 21 February 2025 / Revised: 28 March 2025 / Accepted: 31 March 2025 / Published: 4 April 2025

Abstract

The aim of this study is to provide a thorough assessment of the sustainability indicators employed to support the changes related to the United Nations Sustainable Development Goal 11, which seeks to make cities and human settlements inclusive, safe, resilient, and sustainable. A selection of scientific articles published from 2013 to 2022 has been meticulously examined, concentrating on those pertinent to the primary study issues. The utilization of assessment methodologies that draw upon the concepts of divergence (systematic literature review) and convergence (cluster analysis) between diverse information sets is paramount. A dataset of critical indicators for measuring urban sustainability has been gathered. The results show the possibility to identify common patterns among the sustainability assessment indicators, driving towards the construction of a Minimum Indicator Set (MIS), that could be a useful support for, e.g., policymakers and urban planners in realizing sustainable transformative solutions through a common and aligned valuation source.

1. Introduction

Phenomena such as the uncontrolled urban expansion, the air pollution, and the lack of open public spaces hinder the health benefits in cities. Transforming the design and management of urban spaces is significantly essential to ensure sustainable development [1].
One of the key objectives of the Sustainable Development Goal n. 11 (SDG 11) of the United Nations Agenda 2030 [2] precisely concerns “Making cities and human settlements inclusive, safe, durable and sustainable [2,3,4]”. In this context, sustainability indicators play a crucial role, offering quantitative and qualitative tools to measure, monitor, and guide urban transformations. These indicators are designed to evaluate performance in terms of environmental, social, and economic sustainability, measuring the impact of actions taken at different spatial and temporal scales [5].
The analysis of the territorial context requires various indicators applicable across different sectors. In Europe, the Principal European Economic Indicators (PEEIs) developed by Eurostat are essential for understanding the short-term performance of the European economy. The most recent version, updated to 2002, is available as of 2024 [6]. These serve as a crucial reference for economic policy, research, and finance. Meanwhile, the European Taxonomy serves as a crucial benchmark in assessing European policies concerning sustainability in the financial sector through an appropriate set of indicators [7].
In Italy, the National Institute of Statistics (ISTAT) has defined 152 indicators in 2013, organized into 12 key domains of Fair and Sustainable Well-being (BES). They provide a more comprehensive assessment of the population’s well-being compared to traditional economic measures like GDP. Since 2013, a detailed analysis of these indicators has been annually published in the “BES Report” [8]. Additionally, ISTAT releases “Noi Italia”, a collection of statistical data that examines the economic, social, and environmental conditions of the country and its regions. It covers various sectors, including the economy, population, labor, education, health, environment, innovation, and security [9].
The use of indicators is consolidated and often applied in a sectoral manner, but it can be recalibrated from an interdisciplinary perspective to define minimum panels of indicators capable of analyzing and evaluating aspects in an integrated way, rather than for distinct macro-areas.
The purpose of this contribution is to provide a comprehensive review of the indicators that are currently being utilized. This will be accomplished by identifying prevalent trends in the scientific research that has been examined, as well as inconsistencies in urban sustainability metrics. The ultimate objective is to establish a minimal set of indicators (MIS) in order to identify the indicators that are most effective in accelerating sustainable transformations in urban areas. The construction of the MIS has been predicated upon a systematic review of indicators in the extant literature focused on transformations in urban systems. However, rather than providing “meta evidence”, our study is based on a systematic literature review that allows us to extract meta-evidence useful for the construction of a methodological framework for the analysis of urban sustainability indicators. The MIS will serve to measure and evaluate the impacts of the actions undertaken. In doing so, it will provide a support to political decision-makers, urban planners, and stakeholders in the implementation of urban projects oriented towards a common and unified vision of the sustainable city. The current sustainability indicators applied to cities face several limitations that justify the need for a new approach. Many existing indicators adopt a sectoral approach, focusing on specific dimensions such as environmental, social, or economic aspects in isolation. This lack of integration prevents a holistic understanding of urban sustainability, which is essential for addressing the complex interconnections within urban systems. There is a notable lack of standardization among sustainability indicators, making it difficult to compare cities or regions effectively. Without a common framework, benchmarking and sharing best practices across different contexts becomes challenging. Urban planners and policymakers may struggle with the technical expertise or resources required to collect and analyze the necessary data; for this reason, there is a growing consensus on the need for a Minimum Indicator Set (MIS)—a streamlined framework that integrates key sustainability metrics. Such a system would aim to be adaptable to local contexts, standardized for global comparability, and easy to implement while providing actionable insights for sustainable urban transformation.
The work is divided into three stages to establish the meta-analytical framework for defining a commonly utilized indicator set. Namely, in Section 2, the literature review carried out has been illustrated and the methodology implemented for the definition of the Minimum Indicator Set (MIS) has been explained. In Section 3, the outputs obtained by the analysis have been shown and systematically organized, and the MIS has been determined for the considered categories (economy, environment, planning, energy, sociality, transport, waste), in order to highlight the empirical implications of the applied methodology. Finally, in Section 4, the conclusions of the work and its possible future perspectives have been drawn.

2. Materials and Analysis Algorithm

In the context of urban transformation—defined as a holistic approach to resolving urban challenges and fostering lasting economic, social, environmental, and physical improvements—the goal is to identify key indicators for measuring urban sustainability in alignment with intergenerational equity and environmental, social, and economic justice [10]. To this end, a scoping review of the relevant scientific literature has been carried out. This review focuses on analyzing papers that explore the implementation of sustainability indicator sets, appropriately categorized according to internationally recognized frameworks (Section 2.1), and on the methodological elaboration of a core set of metrics through standard clustering procedures (Section 2.2). From this standpoint, the literature review has been utilized as a conduit to formulate a definition for a Minimum Indicator Set (MIS) of sustainability.
The definition of the MIS is instrumentally oriented to identify, for example, which design solutions to implement within urban fabrics in relation to the benefits expected from the initiative in the short, medium, and long term, as well as in consideration of the multiplier effects resulting from a program of settlement transformation actions [11].

2.1. Materials

Innovative policies and technologies play a crucial role in transforming cities into more sustainable and efficient systems; this is one of the EU’s main priorities enabling the EU’s green transition and carbon neutrality by 2050 [12].
In line with the European taxonomy, which aims to boost investments in projects and activities that are essential to achieving the objectives of the European Green Deal, there is a growing emphasis on the need for reliable assessment tools to support sustainable economy initiatives and climate neutrality [12]. Article 9 of the EU taxonomy regulation sets out six key environmental and climate objectives: 1. Climate change mitigation; 2. Climate change adaptation; 3. Sustainable use and protection of water and marine resources; 4. Transition to a circular economy; 5. Pollution prevention and control; 6. Protection and restoration of biodiversity and ecosystems [13]. In addition, it lays out four broad requirements that an economic activity must meet in order to be ecologically sustainable: contribute significantly to one or more environmental objectives, avoid significantly harming any of the climate objectives, adhere to the minimum safeguard measures, and meet the technical selection criteria set out in the delegated acts on taxonomy.
The use of sustainability indicators is aimed at quantifying progress towards the set objectives based on criteria of relevance, measurability, and reliability, facilitating the management of resources and the adoption of strategic decisions [14,15,16].
This approach helps to optimize resource management and supports strategic decision making. A structured framework is needed to develop, select, and organize indicators based on factors like indicator types, levels of aggregation, issue significance, and potential users.
The DPSIR (Drive, Pressures, State, Impact, Response) model offers a structured framework for analyzing socio-economic and environmental problems, allowing the cause–effect relationships that characterize those to be examined. This approach facilitates the identification of the driving forces that affect the changes, the pressures that these exert on the environment, the current state of the environment, and the impacts that these changes have on human health, ecosystems, and the economy [17,18,19,20,21]. In particular, this approach permits the examination of driving forces, which include both natural and human-caused influences on the studied area; pressures, which include indicators like air pollution, noise pollution, electromagnetic fields, waste, industrial discharges, urbanization (land consumption), infrastructure development, deforestation, and wildfires; state, which involves keeping tabs on air, water, and soil quality and biodiversity; and impacts, which include the good and bad effects on ecosystems, human and animal health, and the economy. Examples include soil contamination from leachate and increased greenhouse gas emissions from landfills and recovery plants.
The actions taken by society to address these issues, such as environmental policies, the adoption of sustainable practices, and the integration of new technologies, which are captured through relevant indicators.
The DPSIR methodology has been used across various fields: (i) environmental: “It offers a robust and systematic framework to understand and tackle current environmental challenges, promoting integrated and informed management of natural resources and the environment” [22]; (ii) economic: “economic analysis can leverage the DPSIR model to understand the interconnected forces driving economic shifts and the necessary responses to address them” [23]; (iii) urban and territorial planning: “Urban planning can apply the DPSIR model to develop sustainable cities by addressing the pressures from urban expansion and determining the required responses” [18].
In order to analyze and dimensionally group sets of indicators, it is possible to make use of a cluster analysis, i.e., a statistical analysis technique that groups similar data into homogeneous clusters. This method allows us to identify the prevalent indicators and categorize them in a systematic way, facilitating their interpretation and practical application. It is constituted by grouping objects based on their characteristics, so that there is high intra-cluster similarity and reduced inter-cluster similarity [18]. This means that items within the same cluster are more alike compared to those in other clusters. The process of a cluster analysis generally involves three key steps articulated in defining the classification variables, choosing a dissimilarity measure between statistical units, selecting a clustering algorithm.
The choice of the clustering algorithm depends on the method used to consider the initial dataset (either an agglomerative or divisive method) and how the data should be grouped (hierarchically or partition-based). Among the many partition-based algorithms, the most commonly used are K-means method, K-medoids, Fuzzy c-means, QT clustering [24].
For this research, the K-means algorithm has been deemed most effective. It allows the user, without prior knowledge of the dataset’s classes, to define how many clusters (or groups) they want to create [25,26].

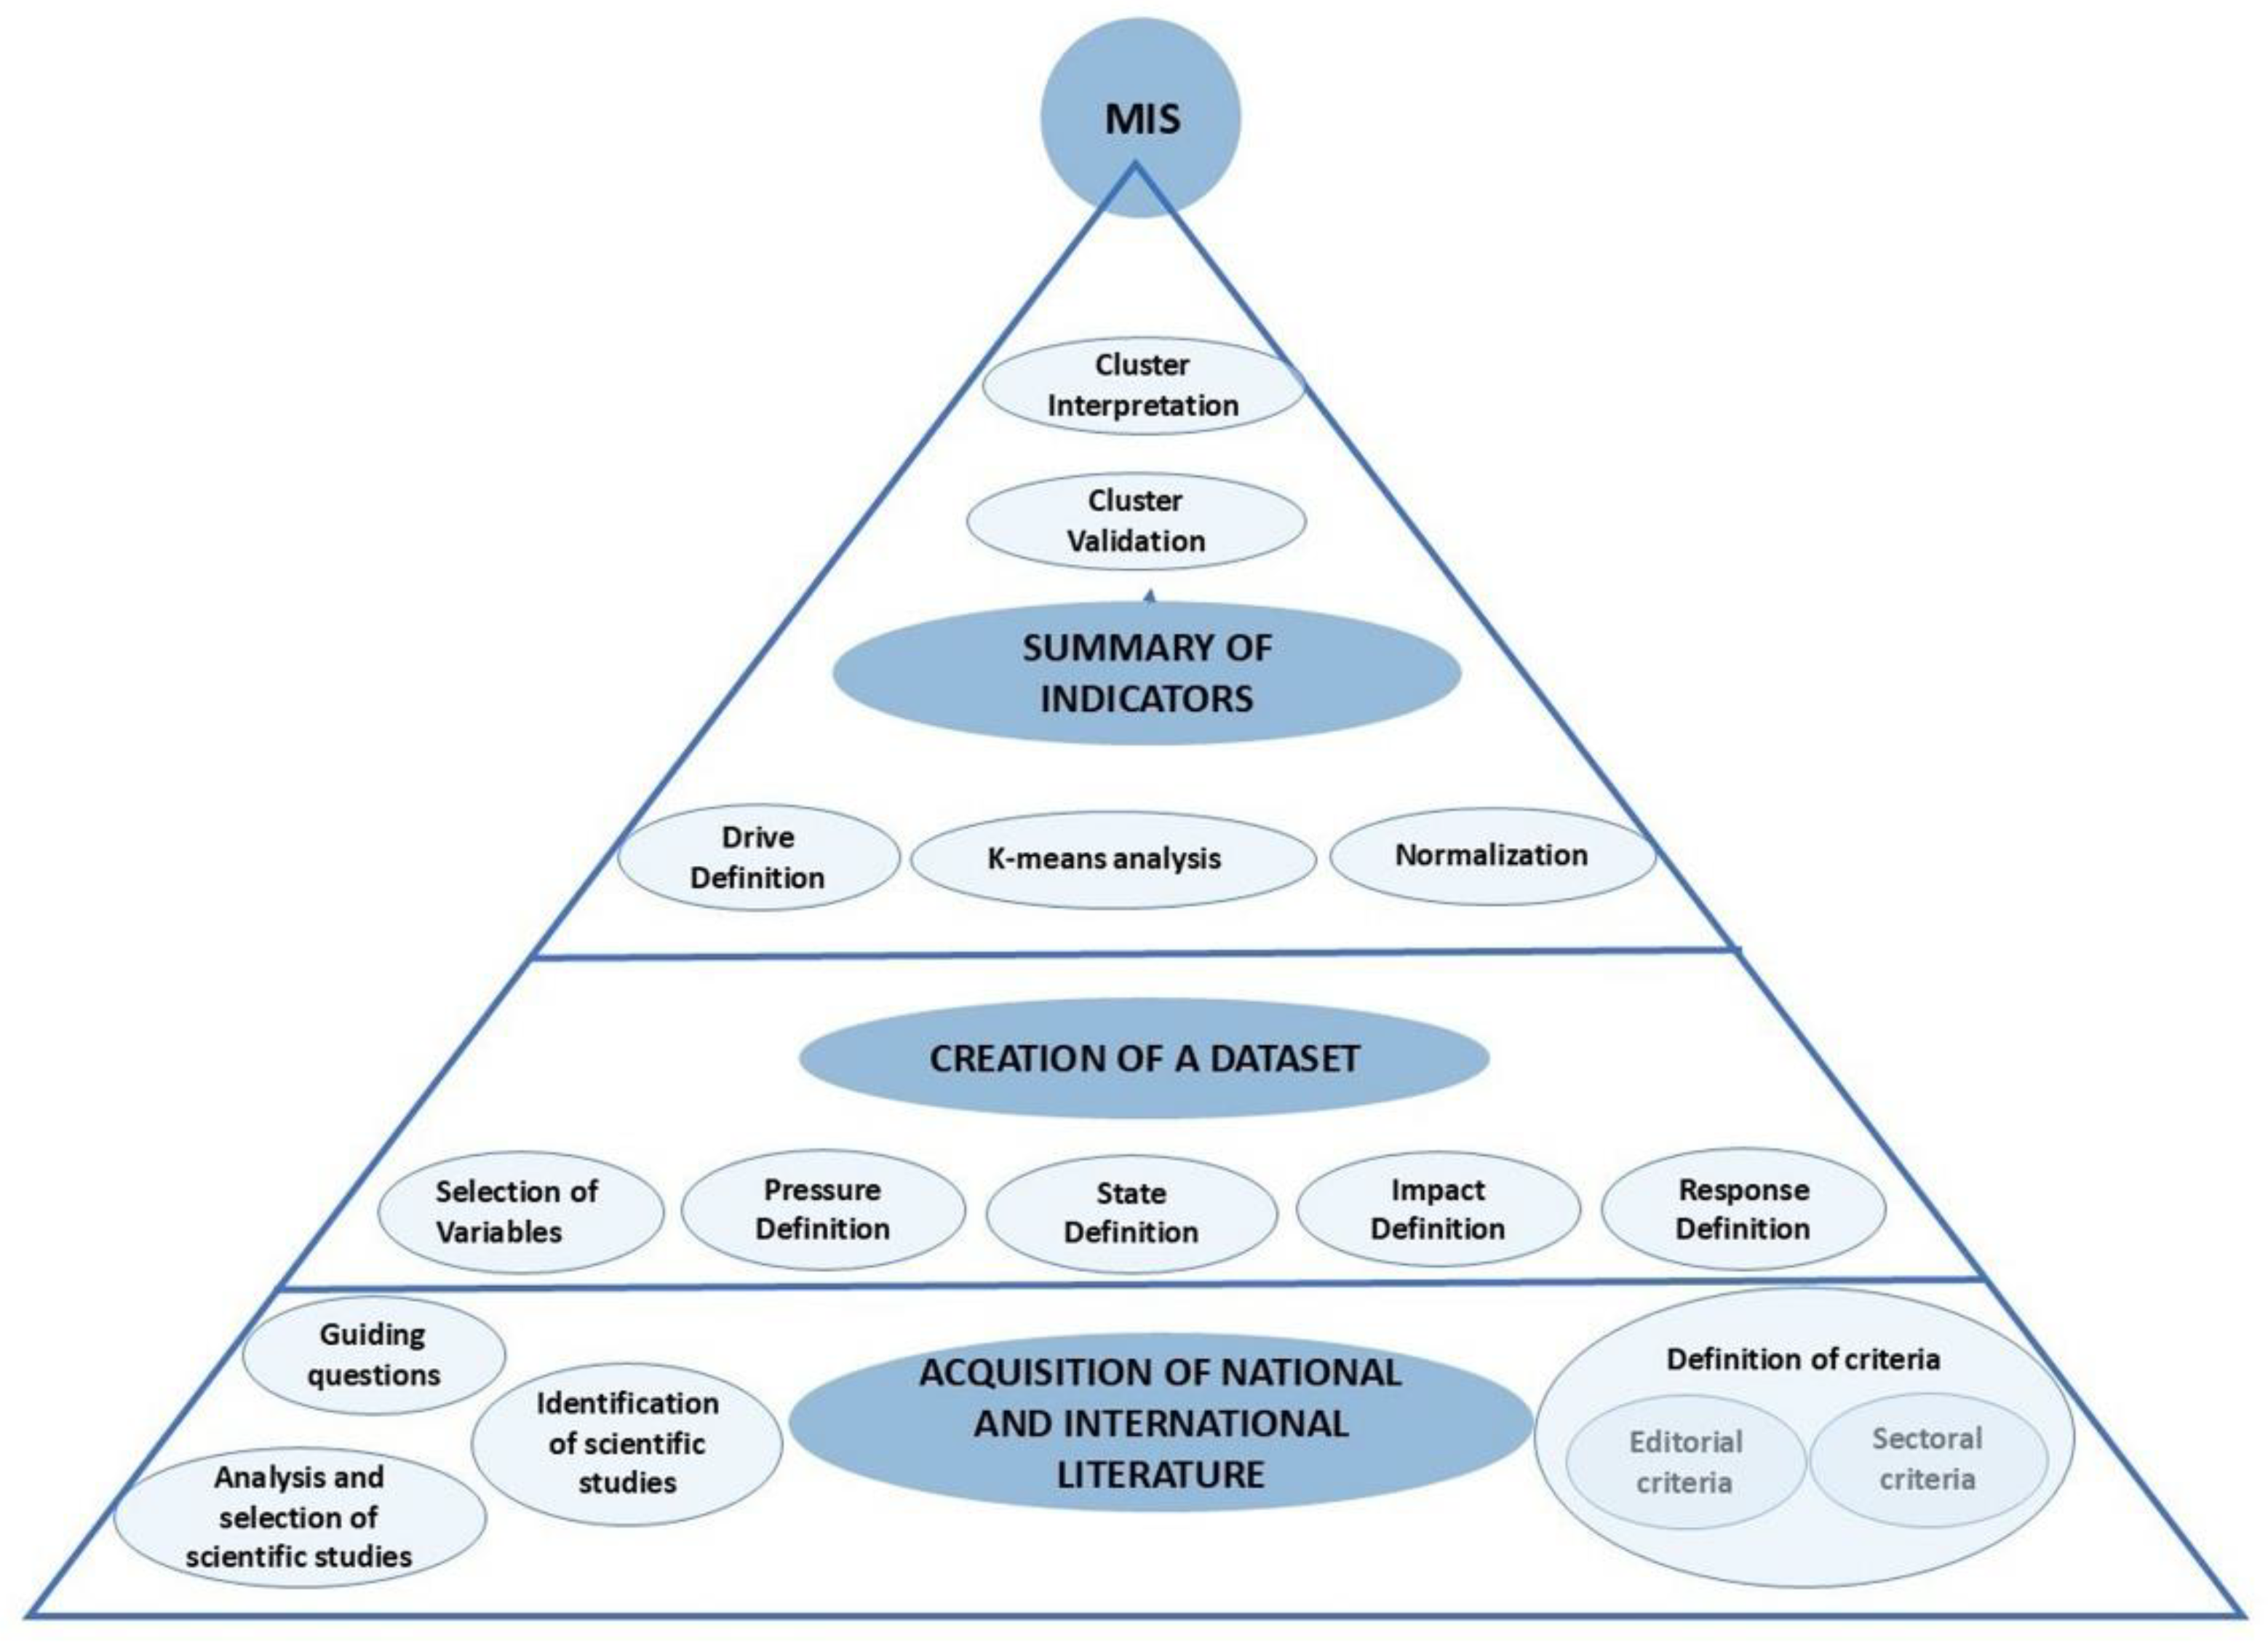
2.2. Analysis Alghoritm

To maximize the effectiveness of the integrated use of indicators at an urban scale with the aim of identifying the effects that sustainability measures bring to the territory over time [27], a structured methodology has been employed, as shown in Figure 1 (and described in the following sections). The literature review was conducted using the PRISMA method, which allows for the transparent and reproducible selection of relevant studies on sustainability indicators related to cities. The search was performed on Google Scholar and Scopus, with keywords such as “urban sustainability assessment”, “sustainability indicators”, and “urban sustainable indicators”. Articles published between 2013 and 2022, available in open access and in English, were included. This methodology allowed for the collection of relevant data, which have been then selected and organized into a dataset. From this dataset, a summary of the indicators has been extracted, leading to the identification of a Minimum Indicator Set (MIS) for sustainability through the creation of a dataset and the application of a cluster analysis [28,29,30,31,32,33,34].

2.2.1. Acquisition of National and International Literature

Guiding Questions
The methodology applied for the identification of the minimum indicators has been developed starting from the definition of three guiding questions for the systematic analysis of the existing national and international literature on the topic of urban sustainability evaluation, by using approaches based on indicators, variables, and qualitative–quantitative criteria.
The Research Questions (RQs) on which the process is based have been: (RQ1) “What are the key indicators used to assess sustainability at the urban scale?” (RQ2)” Which indicators facilitate the assessment of development (drivers) and/or contraction (pressure) in the region concerning economic, social, and environmental sustainability?”
Identification of Scientific Studies
The systematic analysis of the literature has been carried out by identifying scientific studies published between 2013 and 2022, by the Google Scholar and/or Scopus platforms, that are available through open access and are relevant to urban actions and sustainability indicators. Several keywords have been defined for the research, including: urban sustainability assessment, urban sustainable indicators, and sustainability indicators.
Analysis and Selection of Scientific Studies
Exclusion criteria have been specified for scientific studies that are not consistent with the defined guiding questions and, therefore, with the objectives of the literature analysis.
To carry out the analysis of the open access articles that emerged from search engines, the “Covidence” software has been used (https://www.covidence.org/, accessed on 27 March 2025), an online tool designed to help researchers in systematic reviews of scientific literature, to support the import and deduplication of citations and titles and the screening of abstracts and full texts, allowing us to export data directly to RevMan (https://revman.cochrane.org/info, accessed on 28 March 2025) or Excel. This software enables us to define the review parameters, such as the theme and inclusion/exclusion criteria.
Definition of Criteria
The criteria for selecting scientific studies to be applied, chosen in accordance with existing literature, are editorial and sector-specific in nature.
The editorial selection criteria include:
  • Publication Quality:
    -
    Preview: Only articles published in peer-reviewed journals are considered.
    -
    Impact Factor: Preference is given to journals with a high impact factor (Field-Weighted Citation Impact (FWCI) greater than 1).
  • Publication Type:
    -
    Original Research Articles: Empirical and experimental studies.
    -
    Review Articles: Literature reviews.
    -
    Book Chapters and Monographs: Included if they are relevant to the research topic (e.g., environmental, sustainability, indicators, urban planning).
  • Language:
    -
    Specific Languages: Only articles published in languages understood by the reviewers, typically English and other relevant languages.
    -
    Publication Year: A defined timeframe, such as studies published within 2013–2022.
The sector-specific selection criteria applied are defined based on several specific aspects. First, the scope of the research is considered, including studies relevant to a particular disciplinary field. Environmental indicators focused on air and water quality, biodiversity, climate change mitigation, and resource efficiency. Social indicators addressed inclusivity, health, education, safety, and access to public spaces. Economic metrics included employment, growth, innovation, and resource allocation efficiency. Another factor concerns the study population, with a specific focus on groups such as children, the elderly, or patients with certain illnesses. Additionally, the type of interventions or exposures analyzed is evaluated, considering studies that focus on specific themes. Another selection factor is the outcomes or results reported, prioritizing research that presents relevant findings. Finally, the geographical context also plays a significant role, with particular attention given to studies conducted in specific geographical areas or cultural contexts.
After applying the publication selection criteria, inclusion and exclusion criteria were also implemented based on the scientific studies to identify which studies should be removed as irrelevant and which should be included. This literature analysis helps in acquiring relevant case studies of analysis.

2.2.2. Creation of a Dataset

To create a dataset of sustainability indicators, it is necessary to follow a structured approach that identifies and connects different components of the framework [35].
Selection of Variables for Dataset Elaboration
The necessary information data for conducting a rational analysis of the collected sustainability indicators has been identified for inclusion in the dataset. The details contained in the dataset are as follows (Table 1):
  • ID: Unique identifier for the scientific study (e.g., #27);
  • Year: Year of publication;
  • Authors: Authors of the publication;
  • Title: Title of the study;
  • Main Objectives: Summary of the study’s objectives;
  • Categories: Categories to which the indicators belong (e.g., Environmental);
  • Thematic Categories: Specific theme associated with the category of the indicators (e.g., Pollution);
  • Criteria/Indicator/Index: Sustainability indicator;
  • Quantitative: Indicator of a quantitative nature;
  • Qualitative: Indicator of a qualitative nature;
  • Metrics (Elementary Data—ED);
  • Targets (T);
  • Measurement Scale and Unit: Measurement unit;
  • Data Source: Specific research data;
  • Analysis—Scale: Analysis scale (e.g., neighborhood, city, national, international);
  • Territorial Context: Geographical area relevant to the study (e.g., Rome);
  • Services/Disservices for Sustainable Achievement: Each identified indicator has been assigned a relevance metric regarding its use for sustainable development. This analysis metric is characterized by a positive impact scale (+++, ++, +) or a negative impact scale (−) for each identified indicator.
The gathered information facilitates the classification of indicators utilized in various scientific studies, highlighting the scales of analysis and the geographical context in which they have been applied, as well as the sectors (environmental, social, economic) they have been used for [36,37].
Drive–Pressure–State–Impact–Response Model (DPSIR)
The DPSIR methodology has been chosen with the aim of adopting an integrated approach for data collection and analysis, ensuring a complete and systematic vision of environmental, social, and economic dynamics [38,39,40,41,42,43,44,45].
This model enables the organization of the dataset to effectively capture the interconnections among the various components of the analyzed case. Utilizing the DPSIR framework enables the creation of a dataset that reaches beyond simple data collection; it systematically set up information within a logical framework. This structure supports in understanding the cause-and-effect relationships between human activities and the environment, in that way supporting more informed and targeted decision making.
To achieve this, the following typology of indicators has been distinguished: driving-force indicators are linked to underlying causes that influence a number of relevant variables. Driving forces include economic activities, demographic or technological changes, and other socio-economic dynamics that trigger pressures on the territory. Pressure indicators are linked to specific factors that cause problems in the area. Pressure indicators therefore quantify the load that human activities impose on the environment, and status indicators describe the current condition of the environment. These indicators serve to evaluate the level of degradation or conservation of the territory, impact indicators help to understand how variations in the state of the environment concretely affect people’s daily lives and well-being, and response indicators help to monitor the actions undertaken by the company to combat environmental problems. They measure the effectiveness of interventions and provide useful information for the continuous improvement of the strategies adopted.

2.2.3. Summary of Indicators

The analysis and summary of the resulting indicator dataset are conducted using the cluster analysis method by means of the K-means algorithm. After defining the objectives and gathering data, it is essential to execute a preprocessing phase, which includes data cleaning to eliminate errors. The process involves the following steps:
Data-Driven Individualization
Identifying the relevant variables (indicators) for the cluster analysis. Depending on the analysis, these variables may include the sustainability indicators themselves or their transformations (e.g., aggregate indices). They denote the parameters to which a substantial array of indicators may be associated in functional terms. Data normalization may be performed to ensure that variables with different scales do not excessively drive the results towards a prefigured and determined preferred direction.
K-Means Clustering Method
The K-means clustering methodology, a widely used technique for grouping data into distinct clusters based on similarity, aims to partition data into k clusters, where each point belongs to the cluster with the closest mean. It is effective for large datasets and relatively easy to implement. The algorithm aims to minimize the total variance within each group, with each group identified by a centroid or midpoint. This facilitates the division of a set of objects into k groups based on their characteristics. It follows an iterative process, initially creating k partitions and assigning input points to each partition, either randomly or using heuristic information, then calculating the centroid of each group, and subsequently forming a new partition by associating each input point with the group whose centroid is closest; finally, it recalculates the centroids for the new groups, and repeats this process until convergence occurs.
Interpretation and Validation of Clusters
Each group of indicators is examined to identify common characteristics, allowing for the identification of predominant themes and categories represented by the indicators. Subsequently, the resulting clusters are validated to ensure their quality and coherence, analyzing the cluster characteristics to highlight emerging patterns.
Application of Results
The identified clusters are used to create the Minimum Indicator Set (MIS) consisting solely of fundamental indicators aimed at targeted interventions for enhancing sustainability. The sustainability indicators were therefore grouped into several main categories, each representing a specific aspect of sustainability and of the key factors to be considered in settlement transformation processes. This classification emerged from a meta-analysis of the literature, aiming to provide a comprehensive and structured framework that includes both traditional sustainability dimensions and more sector-specific indicators:
  • Economic: Indicators related to economic growth, investments, employment, and project profitability.
  • Sociality: Indicators that measure the well-being and quality of life of the population.
  • Environmental: Indicators that assess the environmental impact of projects.
  • Energy: Indicators related to the energy consumption caused by a project and the use of renewable energy.
  • Transport Indicators: Addressing urban mobility, accessibility, public transportation efficiency, and related environmental impacts.
  • Urban Planning Indicators: Assessing land use, infrastructure development, zoning regulations, and urban density.
  • Waste Management Indicators: Measuring waste production, recycling rates, landfill use, and sustainability of waste disposal systems.

3. Results

The following steps describe the results obtained from the application of the various phases of the methodology adopted as previously described.

3.1. Acquisition of National and International Literature

Through the systematic analysis of national and international literature, 122 studies have been identified, to which the questions posed at the basis of the research and the editorial and sectoral selection and exclusion/inclusion criteria were applied.
The editorial exclusion/inclusion criteria applied have been:
  • Only opened access available papers;
  • Studies not yet underway;
  • Studies not awaiting classification (e.g., in a systematic review, they may have been assigned to a specific topic);
  • Only papers published in English;
  • Papers published within 2013–2022.
Based on these criteria, 62 studies have been excluded from the search.
The sectoral exclusion/inclusion criteria applied have been:
  • Related to urban regeneration issues;
  • Related to the topic of sustainability;
  • Presence of indicator sets;
  • Urban-scale ducts.
Based on these criteria, 17 studies have been excluded.
In total, through the use of the “Covidence” software as represented in Figure 2, 79 scientific studies have been excluded, thus deeming 43 studies acceptable out of the 122 collected.

3.2. Creation Dataset

The application of the DPSIR model has facilitated the creation of a dataset that includes all relevant information data regarding sustainability indicators, specifically pertaining to spatial and measurement aspects, to be utilized at various scales in urban projects. The Table 1, presents an excerpt from the dataset compiled based on the details outlined in the sub-section “Selection of Variables for Dataset Elaboration”. From the information in the columns “Year”, “Authors”, and “Title and Main Objectives”, it can be observed that the majority of scientific studies focusing on the application of sustainability indicators to urban regeneration have been published between 2013 and 2022. The data collected in the columns “Categories”, “Thematic categories”, and “Criteria/Indicator/Index” have identified 1294 sustainability indicators associated with various thematic categories, depending on the case studies analyzed. Using the DPSIR model, the 1294 indicators collected were mapped into the following categories: ‘Driving Forces’ include the driving forces resulting from socio-economic processes, while ‘Pressures’ identify the environmental stresses caused by human activity. Subsequently, the ‘State’ indicators highlight the current state of the environment, ‘Impact’ measures the consequences of such states, and ‘Responses’ collects the actions taken to counter the identified issues. This approach allowed for a structured and functional classification of the indicators, facilitating comparative analysis and the identification of critical points in urban dynamics.
As detailed in the sub-section “Drive-Pressure-State-Impact-Response model (DPSIR)”, a level of relevance has been assigned to the identified indicators, which is noted in the column “Services/Disservices for Sustainable Achievement”. This classification helps categorize the indicators based on their positive or negative influence on sustainability objectives. In the positive scale, values are represented by increasing symbols (+++, ++, +), which correspond to the concepts of Drive, Pressure, and State within the DPSIR model. The negative scale, represented by a single negative symbol (−), reflects the concept of Risk [41].
The column “Services/Disservices for Sustainable Achievement” serves as a guide to evaluate the contribution or threat posed by the indicators concerning sustainability. The positive and negative symbols provide a clear indication of the overall impact of each indicator within the DPSIR framework, thus aiding in understanding environmental and social dynamics and formulating targeted intervention strategies [42].

3.3. MIS Definition

To adhere to the operational procedures outlined in the summary of indicators (Section 2.2.3), the Minimum Indicators Set of 153 items has been derived. Each set of indicators is accompanied by its corresponding category/thematic field of reference and DPSIR classification. The DPSIR classification is essential for analyzing and monitoring the interactions between economic, environmental, and social factors. It provides a clear framework for planning and managing sustainability initiatives effectively. Certain indications are exclusively classified as driver, pressure, or state, while others can be utilized interchangeably in all three categories, as demonstrated in the literature study. The classification of indicators derived from the literature results from cluster analysis, allowing for further customization by removing and/or incorporating additional indicators according to the assessment objectives and the particularities of the relevant decision-making context, including classical dimensions of sustainability (social, environmental, and economic) and more operational and sector-specific indicators (such as energy, transport, urban planning, and waste management). The Minimum Indicators Set is in Table 2 below.

4. Conclusions

This study embarked on a critical mission: to identify a Minimum Indicator Set (MIS) for urban sustainability assessments capable of supporting the transformative changes necessary to achieve the United Nations Sustainable Development Goal 11 (SDG 11). By employing a rigorous methodology that combined a systematic literature review with cluster analysis, we aimed to provide a practical and streamlined tool for policymakers and urban planners seeking to create inclusive, safe, resilient, and sustainable cities.
In recent years, numerous studies have contributed to renew and deepen the evaluation of urban sustainability indicators. Recent works [43,44] have highlighted how the integration of multidisciplinary approaches and the use of big data-based methodologies can further refine the analysis of urban systems and other research [45] have also highlighted the importance of including dynamic indicators that reflect real-time socio-environmental transformations, contributing to a more updated and complex vision of sustainability in cities. These contributions, integrated with our study, reinforce the need to adopt a Minimum Indicator Set (MIS) that is not only based on a systematic review of the consolidated literature, but also includes emerging innovations in the field.
Indeed, based on the selected scientific studies that have been analyzed, there is a strong need to utilize sustainability indicators as a tool for evaluating and monitoring the effectiveness of policies and initiatives in urban redevelopment projects. Although these indicators have been already employed in various sectoral contexts, they require interdisciplinary recalibration to be applied in an integrated manner. The developed and implemented methodology, based on the DPSIR (Drive, Pressures, State, Impact, Response) model, made it possible to structure the indicator dataset in such a way as to reflect the complex interactions among the different socio-economic and environmental components [41,42]. Furthermore, the use of the cluster analysis, and, in particular, the K-means algorithm, has made it possible to identify and categorize the most relevant indicators, facilitating their practical application in specific urban contexts. The development of the proposed Minimum Indicator Set (MIS) could thus assist as a supportive tool for policymakers, urban planners, and stakeholders. The process under discussion has been shown to engender a sense of community participation, whilst concomitantly facilitating the planning of urban regeneration projects to address the immediate needs of cities, as well as social and economic sustainability. The result is that it enhances the legitimacy of decisions made, thereby safeguarding that widely recognized and acceptable transformative sense of a territory from a sustainability perspective. The MIS differs from traditional indicator frameworks, such as the EU taxonomy and the ISTAT BES, in its ability to integrate interdisciplinary dimensions. While existing frameworks offer a robust analysis of the individual components of sustainability, the MIS fills the gap by integrating economic, environmental, and social aspects into a single operational tool, thus facilitating a more holistic approach to urban planning. The reference indicators individuated for the MIS are derived from a systematic analysis and should be selected based on the specific evaluation question.
However, the methodologies applied in the study present some limitations that must be acknowledged to provide a balanced understanding of the results and their implications. One of the main limitations lies in the reliance on existing literature for data collection and indicator selection. While this ensures a thorough review of established knowledge, it inherently restricts the scope of the study to already analyzed contexts, potentially excluding emerging or context-specific indicators that are not yet widely documented.
Future insights should focus on refining the MIS through iterative validation in diverse urban contexts, incorporating local knowledge, and exploring more dynamic modeling approaches and will concern the implementation of these indicators to continuously monitor and evaluate the impacts of pilot urban actions, as this will enable comparisons among different urban areas and an assessment of the effectiveness of policies over time, helping, e.g., to identify priority areas for intervention; in order to achieve an equitable and balanced urban development and to validate the results, a panel of experts will be involved, enhancing the reliability of the study.

Author Contributions

Conceptualization, M.R.G. and F.S.; methodology, G.G. and F.S.; software, F.S.; validation, M.R.G. and F.T.; formal analysis, G.G. and F.S.; investigation, G.G. and F.S.; resources, G.G. and F.S.; data curation, G.G. and F.S.; writing—original draft preparation, M.R.G. and G.G.; writing—review and editing, M.R.G., G.G. and F.S.; visualization, M.R.G. and F.T.; supervision, M.R.G. and F.T.; project administration, M.R.G. All authors have read and agreed to the published version of the manuscript.

Funding

This research received no external funding.

Institutional Review Board Statement

Not applicable.

Informed Consent Statement

Not applicable.

Data Availability Statement

The data are available upon request as it is still being updated to provide the latest version.

Acknowledgments

This contribution was created in the context of the research project “Post-COVID future cities. Methods and tools to design and assess, healthy, sustainable and resilient suburbs”, Sapienza University of Rome.

Conflicts of Interest

The authors declare no conflicts of interest.

References

  1. OECD/European Commission. Cities in the World: A New Perspective on Urbanization; OECD Urban Studies; OECD Publishing: Paris, France, 2020; pp. 1–320. [Google Scholar] [CrossRef]
  2. Agenzia Per La Coesione Territoriale. The UN Agenda 2030 for Sustainable Development. Available online: https://www.agenziacoesione.gov.it/comunicazione/agenda-2030-per-lo-sviluppo-sostenibile/?lang=en (accessed on 20 February 2025).
  3. European Commission. European Green Deal Investment Plan. COM(2020) 21 Final. Available online: https://eur-lex.europa.eu/legal-content/EN/TXT/PDF/?uri=CELEX:52020DC0021 (accessed on 20 February 2025).
  4. United Nations. Sustainable Development Goal 11: Make Cities Inclusive, Safe, Resilient, and Sustainable. Available online: https://www.un.org/sustainabledevelopment/cities/ (accessed on 20 February 2025).
  5. UN-Habitat. Habitat III: New Urban Agenda. United Nations Conference on Housing and Sustainable Urban Development: Quito, Ecuador. 2016. Available online: https://habitat3.org/wp-content/uploads/NUA-English.pdf (accessed on 20 February 2025).
  6. Eurostat. Principal European Economic Indicators (PEEIs). Available online: https://ec.europa.eu/eurostat/web/euro-indicators/database (accessed on 20 February 2025).
  7. World Bank. World Development Report 2021: Data for Better Lives; World Bank Publications: Washington, DC, USA, 2021; Available online: https://www.worldbank.org/en/publication/wdr2021 (accessed on 20 February 2025).
  8. ISTAT. Gli Indicatori Del BES. Available online: https://www.istat.it/statistiche-per-temi/focus/benessere-e-sostenibilita/la-misurazione-del-benessere-bes/gli-indicatori-del-bes/ (accessed on 20 February 2025).
  9. ISTAT. Noi Italia: 100 Statistiche Per Capire Il Paese in Cui Viviamo. Available online: https://noi-italia.istat.it/ (accessed on 20 February 2025).
  10. Couch, C.; Fraser, C. Urban Regeneration in Europe; Blackwell Science: Oxford, UK, 2003; pp. 1–26. [Google Scholar]
  11. Shamaee, S.; Hossein, A.U.Y.; Zahedi, R. Assessing urban development indicators for environmental sustainability. Discov. Sustain. 2024, 5, 341. [Google Scholar] [CrossRef]
  12. European Council. European Green Deal. Available online: https://www.consilium.europa.eu/it/topics/climate-neutrality/ (accessed on 20 February 2025).
  13. European Commission. EU Taxonomy Navigator. Available online: https://ec.europa.eu/sustainable-finance-taxonomy/ (accessed on 20 February 2025).
  14. Regulation (EU) 2020/852. Available online: https://eur-lex.europa.eu/legal-content/EN/TXT/PDF/?uri=CELEX:32020R0852&qid=1725191129583 (accessed on 20 February 2025).
  15. Angel, S.; Sheppard, S.C.; Civco, D.L. The Dynamics of Global Urban Expansion; The World Bank: Washington, DC, USA, 2005; pp. 1–19. [Google Scholar]
  16. Rodrigues, H.; Fukuda, T.; Bibri, S.E. Resilient and Responsible Smart Cities; Springer: Cham, Switzerland, 2022; pp. 1–400. [Google Scholar]
  17. Miranda, M.N.; Silva, A.M.T.; Pereira, M.F.R. Microplastics in the Environment: A DPSIR Analysis with Focus on the Responses. Sci. Total Environ. 2020, 718, 134968. [Google Scholar] [CrossRef] [PubMed]
  18. Liu, S.; Ding, P.; Xue, B.; Zhu, H.; Gao, J. Urban Sustainability Evaluation Based on the DPSIR Dynamic Model: A Case Study in Shaanxi Province, China. Sustainability 2020, 12, 7460. [Google Scholar] [CrossRef]
  19. Kristensen, P. The DPSIR framework. In Paper Presented at the 27–29 September 2004 Workshop on a Comprehensive/Detailed Assessment of the Vulnerability of Water Resources to Environmental Change in Africa Using River Basin Approach; UNEP: Nairobi, Kenya, 2004; pp. 1–10. Available online: http://fis.freshwatertools.eu/files/MARS_resources/Info_lib/Kristensen(2004)DPSIR%20Framework.pdf (accessed on 10 January 2022).
  20. Malmir, M.; Javadi, S.; Moridi, A.; Neshat, A. A New Combined Framework for Sustainable Development Using the DPSIR Approach and Numerical Modeling. Geosci. Front. 2021, 12, 101169. [Google Scholar] [CrossRef]
  21. Michalina, D.; Mederly, P.; Diefenbacher, H.; Held, B. Sustainable Urban Development: A Review of Urban Sustainability Indicator Frameworks. Sustainability 2021, 13, 9348. [Google Scholar] [CrossRef]
  22. European Environment Agency. Environmental Indicators: Typology and Overview; Technical Report No. 25; European Environment Agency: Copenhagen, Denmark, 1999; pp. 1–19. [Google Scholar]
  23. Khan, S.U.; Cui, Y.; Khan, A.A.; Ali, M.; Khan, A.; Xia, X.; Liu, G.; Tracking, M.Z. Sustainable development efficiency with human-environmental system relationship: An application of DPSIR and super efficiency SBM model. Sci. Total Environ. 2021, 783, 146959. [Google Scholar] [CrossRef]
  24. Everitt, B.S.; Landau, S.; Leese, M.; Stahl, D. Cluster Analysis, 5th ed.; Wiley: Chichester, UK, 2011; pp. 1–346. [Google Scholar]
  25. Govender, P.; Sivakumar, V. Application of k-means and hierarchical clustering techniques for analysis of air pollution. Atmos. Pollut. Res. 2020, 11, 40–56. [Google Scholar] [CrossRef]
  26. Miraftabzadeh, S.M.; Colombo, C.G.; Longo, M.; Foiadelli, F. K-Means and Alternative Clustering Methods in Modern Power Systems. IEEE Access 2023, 11, 119596–119633. [Google Scholar] [CrossRef]
  27. Giampaoletti, M.; Amadei, F.; Pani, M.M. Qualitative-quantitative indicators to regenerate public spaces through Nature-based Solutions. TECHNE—J. Technol. Archit. Environ. 2024, 28, 171–180. [Google Scholar] [CrossRef]
  28. Dale, V.H.; Beyeler, S.C. Challenges in the Development and Use of Ecological Indicators. Ecol. Indic. 2001, 1, 3–10. [Google Scholar] [CrossRef]
  29. Obringer, C.; Jochem, P.E.P. Measuring the Immeasurable—A Survey of Sustainability Indices. Ecol. Econ. 2007, 63, 1–8. [Google Scholar] [CrossRef]
  30. Mori, K.; Christodoulou, A. Review of Sustainability Indices and Indicators: Towards a New City Sustainability Index (CSI). Environ. Impact Assess. Rev. (EIA Rev.) 2012, 32, 94–106. [Google Scholar] [CrossRef]
  31. Kamana, A.A.; Radoine, H.; Chimango Nyasulu, C. Urban challenges and strategies in African cities—A systematic literature review. City Environ. Interact. 2024, 21, 100132. [Google Scholar] [CrossRef]
  32. Aboulnaga, M.; Ashour, F.; Elsharkawy, M.; Lucchi, E.; Gamal, S.; Elmarakby, A.; Haggagy, S.; Karar, N.; Khashaba, N.H.; Abouaiana, A. Urbanization and Drivers for Dual Capital City: Assessment of Urban Planning Principles and Indicators for a ‘15-Minute City’. Land 2025, 14, 382. [Google Scholar] [CrossRef]
  33. Li, X.; Cundy, A.; Chen, W.; Lyu, A. Systematic and bibliographic review of sustainability indicators for contaminated site remediation: Comparison between China and western nations. Environ. Res. 2021, 200, 111490. [Google Scholar] [CrossRef]
  34. Dacey, J. Using big data to measure environmental inclusivity in cities. Eos 2021, 102. [Google Scholar] [CrossRef]
  35. Falah, N.; Falah, N.; Solis-Guzman, J.; Marrero, M. An indicator-based framework of circular cities focused on sustainability dimensions and sustainable development goal 11 obtained using machine learning and text analytics. Sustain. Cities Soc. 2025, 121, 106219. [Google Scholar] [CrossRef]
  36. Stern, A.; Kissinger, M. A multi-perspective framework for assessing urban well-being, development, and sustainability. Habitat Int. 2025, 156, 103269. [Google Scholar] [CrossRef]
  37. Lewison, R.L.; Rudd, M.A.; Al-Hayek, W.; Baldwin, C.; Beger, M.; Lieske, S.N.; Jones, C.; Satumanatpan, S.; Junchompoo, C.; Hines, E. How the DPSIR framework can be used for structuring problems and facilitating empirical research in coastal systems. Environ. Sci. Policy 2016, 56, 110–119. [Google Scholar] [CrossRef]
  38. Gupta, J.; Scholtens, J.; Perch, L.; Dankelman, I.; Seager, J.; Sánder, F.; Stanley-Jones, M.; Kempf, I. Re-imagining the Driver–Pressure–State–Impact–Response Framework from an Equity and Inclusive Development Perspective. Sustain. Sci. 2020, 15, 503–520. [Google Scholar] [CrossRef]
  39. Kazuva, E. The DPSIR Model for Environmental Risk Assessment of Municipal Solid Waste in Dar es Salaam City, Tanzania. Int. J. Environ. Res. Public Health 2018, 15, 1692. [Google Scholar] [CrossRef] [PubMed]
  40. Razzaghi Asl, S.; Pearsall, H. How Do Different Modes of Governance Support Ecosystem Services/Disservices in Small-Scale Urban Green Infrastructure? Land 2022, 11, 1247. [Google Scholar] [CrossRef]
  41. Guarini, M.R.; Morano, P.; Sica, F. Historical school buildings. A multi-criteria approach for urban sustainable projects. Sustainability 2020, 12, 1076. [Google Scholar] [CrossRef]
  42. Guarini, M.R.; Chiovitti, A.; Battisti, F.; Morano, P. An integrated approach for the assessment of urban transformation proposals in historic and consolidated tissues. In Proceedings of the Computational Science and Its Applications—ICCSA 2017, Trieste, Italy, 3–6 July 2017; Lecture Notes in Computer Science. Gervasi, O., Murgante, B., Misra, S., Borruso, G., Torre, C.M., Rocha, A.M.A.C., Taniar, D., Apduhan, B.O., Stankova, E., Cuzzocrea, A., Eds.; Springer International Publishing: Berlin/Heidelberg, Germany, 2017; Volume 10406, pp. 562–574. [Google Scholar] [CrossRef]
  43. Kristiadi, Y.; Sari, R.F.; Herdiansyah, H.; Hasibuan, H.S.; Lim, T.H. Developing DPSIR Framework for Managing Climate Change in Urban Areas: A Case Study in Jakarta, Indonesia. Sustainability 2022, 14, 15773. [Google Scholar] [CrossRef]
  44. Santos, E.; Fonseca, F.; Santiago, A.; Rodrigues, D. Sustainability Indicators Model Applied to Waste Management in Brazil Using the DPSIR Framework. Sustainability 2024, 16, 2192. [Google Scholar] [CrossRef]
  45. Hou, X.; Lv, T.; Xu, J.; Deng, X.; Liu, F.; Lam, J.S.L.; Zhang, Z.; Han, X. Evaluation of urban public transport sustainability in China based on the Driving Force-Pressure-State-Impact-Response (DPSIR) framework—A case study of 36 major cities. Environ. Impact Assess. Rev. 2023, 103, 107263. [Google Scholar] [CrossRef]
Figure 1. Analysis algorithm pyramid.
Sustainability 17 03221 g001
Figure 2. PRISMA tree acquired through Covidence tool.
Sustainability 17 03221 g002
Table 1. Excerpt from data-sat table. (Legend: +++ indicates a very high contribution; ++ a high contribution; + a moderate contribution; − a negative effect, in terms of services or disservices for sustainability).
IDYearTitleMain Objectives/
Research Questions
CategoriesCriteria (C)/
Indicator (I)
QuantitiveQualitativeMetrics (Elementaty-Data (ED); Targets (T))Measurment Scale
and Unit
Services/Disservices for Sustainable Achievement
#272021An Integrated SWOT-PESTLE-AHP Model Assessing
Sustainability in Adaptive Reuse Projects
Weighing key sustainability factors influencing the reuse and transformation of the built environmentPolitical(C)
Blocking Neglect Policy
x (+)
(C)
Political Support Level
x (−)
(C)
Urban Re-Development Strategies/Incentives
x (+++)
(C)
Political Inertia
x (−)
Economic(C)
Economic Growth Boost
x(ED)
Spaces for economic, social and cultural activities
(+++)
(C)
Inability to Estimate Economic Viability
x (−)
(C)
Capitalization of Cultural Value
x (++)
(C/I)
Investment Returns
x(ED)
Based on rent or
commercial value
(ED) Maintenance costs
(−)
Socio-cultural(C)
Cultural Values Preservation
x (++)
(C)
Facadism
x (−)
(C/I)
Quality of Life Improvement
x (++)
(C)
Gentrification
x (−)
Technological–Technical(C)
Technological Innovation
xUse of innovative durable techniques, systems, and components[1-0](+++)
(C)
Asset Condition
x (−)
(C)
Cooperation in a wide range of
scientific fields
x (++)
(C)
Technical Difficulties
x (−)
Legal(C)
Legislative Context
x (+)
(C/I)
Building Standards
x (−)
(C)
Land Use Plan and Zoning
x (+)
(C)
Ownership Status
x (−)
Environmental(I)
Reduced Environmental Footprint
x (++)
(C)
Achieving Net-Zero Energy Goals
x (−)
(C)
Eco-Building
x (++)
(C/I)
Indoor Environmental Quality
x (−)
Table 2. Minimum Indicators Set.
Category Minimun Indicators Set per CategoryDPS
Economy Economic development
Economic growth
Access to backup energy source
Aquatic ecosystem preservation
Arable and permanent crop land area per capita (Agriculture)
Average household income
Business facilities
Climate change
Climate emissions
Cost efficiency
Creation of local jobs
Diversity and preservation
Durability of structures
Ecology innovation
Economic activities
Eco-system enhancement
Efficient pricing
GDP per capita (GDP)
Local economy
New investment
Unemployment rate
EnvironmentalAir quality enhancement
Biodiversity
Biophilia
Efficient resources use
Erosion control
Evapotranspiration
Flood risk mitigation
Global average surface temperature
Global warming
Housing demand
Income/spending
Land area
Land conservation
Land tenure ratio
Local contex
Local renewable materials
Long-term finance schemes
Minimizing ecological impact
Natural environment
Natural growth rate
Percentage of households with public water supply coverage
Politics
Pollution innovation
Proportion of green spaces housing
Quality
Recycling and innovation
Reduce light pollution
Reduced environmental footprint
Reuse of materials
Site waste management
Solar radiation
Total CO2 emissions
Use of biodegradable materials
Use of natural topography
Ventilation and moisture control systems
Water pollution and noise pollution prevention
Annual rainfall
Rainwater and maximization of green areas
Air quality monitoring
Air quality and mechanical ventilation
Temperature during summer season
Water quality
PlanningDistance to basic services
Quality of urban landscape
Innovation in different aspects of the urban context
Proximity to land use destinations
Design and quality of public space
Distance between home and daily activities (business, schools, health centers)
Percentage of city population living in slums
Green area (hectares) per 100,000 population
People
Encourage use of local resources
Proportion of buildings certified by an environmental quality sign
Participation/inclusiveness
Influence airflow
Energy use
Anthropogenic heat emissions
Pollution
Consideration of weather conditions to design the city
Exceedance of air quality standards in urban areas
Energy Infrastructure energy efficiency
Percentage of total end-use energy generated on-site
Centralized energy management
Percentage of total primary energy
Primary energy demand for heating
Residential/individual energy consumption
Energy consumption of public buildings per year
Solar shading
Materials shading
Sociality Sustainable behaviors
Involvement demographics
Social inclusive communities
Connected communities
Community cohesion
Local social vitality
Local lifestyle
Education/empowerment
Schools
Health and safety courses
Awareness schemes
Medical facilities
Public participation
Equity/fairness
Neighborhood safety
Crime prevention
Police stations
Availability and proximity of key local public services
Access to recreation facilities
Availability of local food production
Early childhood education level
Cultural Values Preservation
Structural optimization
Trend reduction in population exposure to flood risk
Availability of green areas
Percentage of open/green public areas 29 Number of trees/Kilometer urban road
Distance to basic services
Aging index
Housing area per capita
Residential area
Quality of urban landscape
Lighting and security control
Unemployment rate (the registered urban unemployment rate) (Poverty)
Proportion of green spaces housing
Total population
Working age population/elderly population
Population growth and migration
Citizens’ satisfaction with public services
Mobilize civil society to communicate and raise awareness about SDGs goals
Energy payback time (EPBT)
Trend reduction in population exposure to flood risk
Trasport Access to public transport (PT) stops
Distance between home and daily activities (business, schools, health centers)
Traffic accessibility
Kilometers of high capacity public transport system per 100,000 population
Travel time
The detour factor
Public
Specific emphasis on household-level ICT infrastructure access
Use of smart/innovative air-quality control technologies
Distance to basic services
Waste Proportion of construction and demolition waste (CDW) treated by an authorized waste manager
Ratio of waste emergy outputs to renewable natural resources emergy input
Waste management
Percentage of the city’s solid waste that is disposed of in a sanitary landfill
Use of systems to reuse/treat wastewater
The colour under DPS in Table 2 indicates the differing levels of reference for the indicators, which may be employed solely as Drive, Pressure, State, or for several functions.
Disclaimer/Publisher’s Note: The statements, opinions and data contained in all publications are solely those of the individual author(s) and contributor(s) and not of MDPI and/or the editor(s). MDPI and/or the editor(s) disclaim responsibility for any injury to people or property resulting from any ideas, methods, instructions or products referred to in the content.

