Article

Natural Disaster Risk Assessment in Countries Along the Maritime Silk Road

1
State Key Laboratory of Resources and Environmental Information System, Institute of Geographic Sciences and Natural Resources Research, Chinese Academy of Sciences, Beijing 100101, China
2
China-Pakistan Joint Research Center on Earth Sciences, Chinese Academy of Sciences—Higher Education Commission of Pakistan (CAS-HEC), Islamabad 45320, Pakistan
3
University of Chinese Academy of Sciences, Beijing 101408, China
4
Jiangsu Centre for Collaborative Innovation in Geographical Information Resource Development and Application, Nanjing 210023, China
*
Author to whom correspondence should be addressed.
Sustainability 2025, 17(7), 3219; https://doi.org/10.3390/su17073219
Submission received: 1 March 2025 / Revised: 24 March 2025 / Accepted: 3 April 2025 / Published: 4 April 2025
(This article belongs to the Topic Natural Hazards and Disaster Risks Reduction, 2nd Edition)

Abstract

:
The 21st-century Maritime Silk Road initiative highlights the importance of oceans as hubs for resources, ecology, and trade, yet a comprehensive understanding of marine natural disaster risks within this region remains limited. This study focused on 30 countries along the Maritime Silk Road and developed a multi-hazard natural disaster risk assessment framework tailored for large-scale regional evaluation. It goes beyond single-factor or single-disaster assessments to enhance disaster resilience and support effective disaster response strategies. The framework integrates 65 indicators across four dimensions: disaster-causing factors, disaster-conceiving environments, disaster-bearing bodies, and disaster reduction capacities. It employs five single-indicator evaluation models alongside a combination assessment method based on maximum deviations to evaluate national-scale natural disaster risks. Results reveal spatial consistency in risk evaluations and capture the exposure and sensitivity of 30 countries to different hazards. South Asia exhibits higher seismic risks, while Saudi Arabia consistently receives the lowest risk. Tropical countries like Vietnam and the Philippines face significant storm risks. Drought hazard risk is higher in the Middle East and East Africa, while it is lower in Brunei, Indonesia, and Malaysia. Flood risks are notably higher in Bangladesh, while Iran and Tanzania consistently receive lower risk ratings. Overall, South Asia exhibits higher multi-hazard risks, with medium-to-low risks along the Mediterranean and Southeast Asia. These findings provide technical support for disaster risk reduction by identifying high-risk areas, prioritising resource allocation, and strengthening disaster reduction strategies.

Graphical Abstract

1. Introduction

Oceans have nurtured the earliest life on Earth and contributed significantly to the emergence of advanced civilisations from ancient times to the present. From a spatial viewpoint, oceans occupy more than 70% of the Earth’s surface. As the largest component of the Earth’s hydrosphere, oceans play a critical role in regulating global ecosystems, climate systems, and biogeochemical cycles. This makes them indispensable to life on Earth. Their rich biological, mineral, and energy resources provide the most basic support for the development of human society. Oceans have a significant impact on the living environment in terms of water vapour circulation, temperature regulation, and climate change. The initiative to build the 21st-century Maritime Silk Road was first proposed in 2013. It is not a single route but an open and inclusive regional cooperation framework spanning Southeast Asia, South Asia, the Middle East, Africa, and Europe. It is not a physical road in the oceans. Instead, it seeks to foster a closer community with a shared future by enhancing connectivity, boosting economic and trade ties, and deepening cultural exchanges. As the initiative progresses, the regions benefit from the cooperation. However, they also face significant natural and climatic challenges, such as the frequent extreme weather events, which threaten regional or even global sustainable development. In particular, global climate change exacerbates ocean-related disasters by intensifying tropical cyclones, accelerating sea-level rise, and increasing ocean acidification. This not only heightens the frequency and severity of storm surges and coastal flooding but also disrupts marine ecosystems and threatens the livelihoods of coastal communities. Thus, in the context of global climate change and the sustainable development of oceans, a comprehensive understanding of natural disaster risks along the route is essential to collectively address these challenges.
The evolution of research into natural hazard risk assessments can be broadly categorised into three key phases. The first stage is disaster factor analysis. This stage emphasised the identification and evaluation of specific hazard parameters, such as seismic intensity or rainfall magnitude [1]. However, this kind of methodology exhibited inherent limitations, oversimplifying the complex dynamics of hazard systems. Critically, it often neglected the vulnerability of disaster-bearing bodies (e.g., populations, infrastructure, economies) and the sensitivity of disaster-conceiving environments (e.g., geographical contexts, ecosystems) [2]. Composite risk factor consideration is the second stage. This stage crucially incorporated the vulnerability of disaster-bearing bodies and the sensitivity of disaster-conceiving environments as core analytical components. At the same time, it continued to analyse disaster-causing factors [3]. Researchers increasingly recognised the intricate interplay between natural and socio-economic hazard attributes. They particularly emphasised the pivotal role of disaster-bearing body vulnerability in shaping ultimate risk levels [4]. The stage of system theory formation is the third one. Since the 1990s, researchers have had a more comprehensive understanding of disaster risk, and systematic theories have gradually been formed in disaster risk research. These theories identify the analysis of disaster risk from three aspects: the risk of disaster-causing factors, the vulnerability of disaster-bearing bodies, and the sensitivity of disaster-conceiving environments [5].
In order to further explore and refine the practical application of these theories, several studies have made significant contributions. Cutter et al. (2003), focusing on the frequent occurrence of floods in the United States, proposed the social vulnerability index (SVI) supported by employing factor analysis [2]. Rygel et al. [6] refined and optimised the SVI through principal component analysis and Pareto ranking. Consequently, they constructed a robust social vulnerability index for storm disasters. Peduzzi et al. [7] proposed a comprehensive disaster risk index (DRI), utilising GIS technology and population distribution models to assess the impact of seismic hazards on human losses. In drought risk research, Sheffield and Wood [8] utilised the Standardised Precipitation Evapotranspiration Index (SPEI) to analyse the spatial and temporal distribution characteristics of global droughts. They revealed trends in the frequency and intensity of drought events under a changing climate. Vicente-Serrano et al. [9] further refined the SPEI based on this previous research and applied it to assess drought risk in Spain. The results provided a more granular technical approach for regional drought risk management.
Most studies mentioned above focused on the risk evaluation of single-disaster types, with less research on the risk evaluation of multiple types of natural disasters. A more comprehensive disaster risk evaluation system has not yet been formed and not been applied on a large spatial scale. To address the challenges of natural hazard risk assessment in expansive regions, this study proposes a novel natural disaster risk assessment framework. Unlike traditional approaches that focus on single factors, our framework incorporates 65 indicators spanning four key dimensions: disaster-causing factors, disaster-conceiving environments, disaster-bearing bodies, and disaster risk reduction capacities. To capture the exposure and sensitivity of 30 countries to various hazards, we employed five single-indicator models and a combined evaluation approach based on maximum deviations. This method not only provides a robust tool for identifying high-risk areas but also supports the optimisation of resource allocation and fosters international collaboration on disaster risk reduction. It is expected to provide decision-making references for governments and stakeholders along the Maritime Silk Road and promote maritime security and sustainable development.

2. Study Area and Data
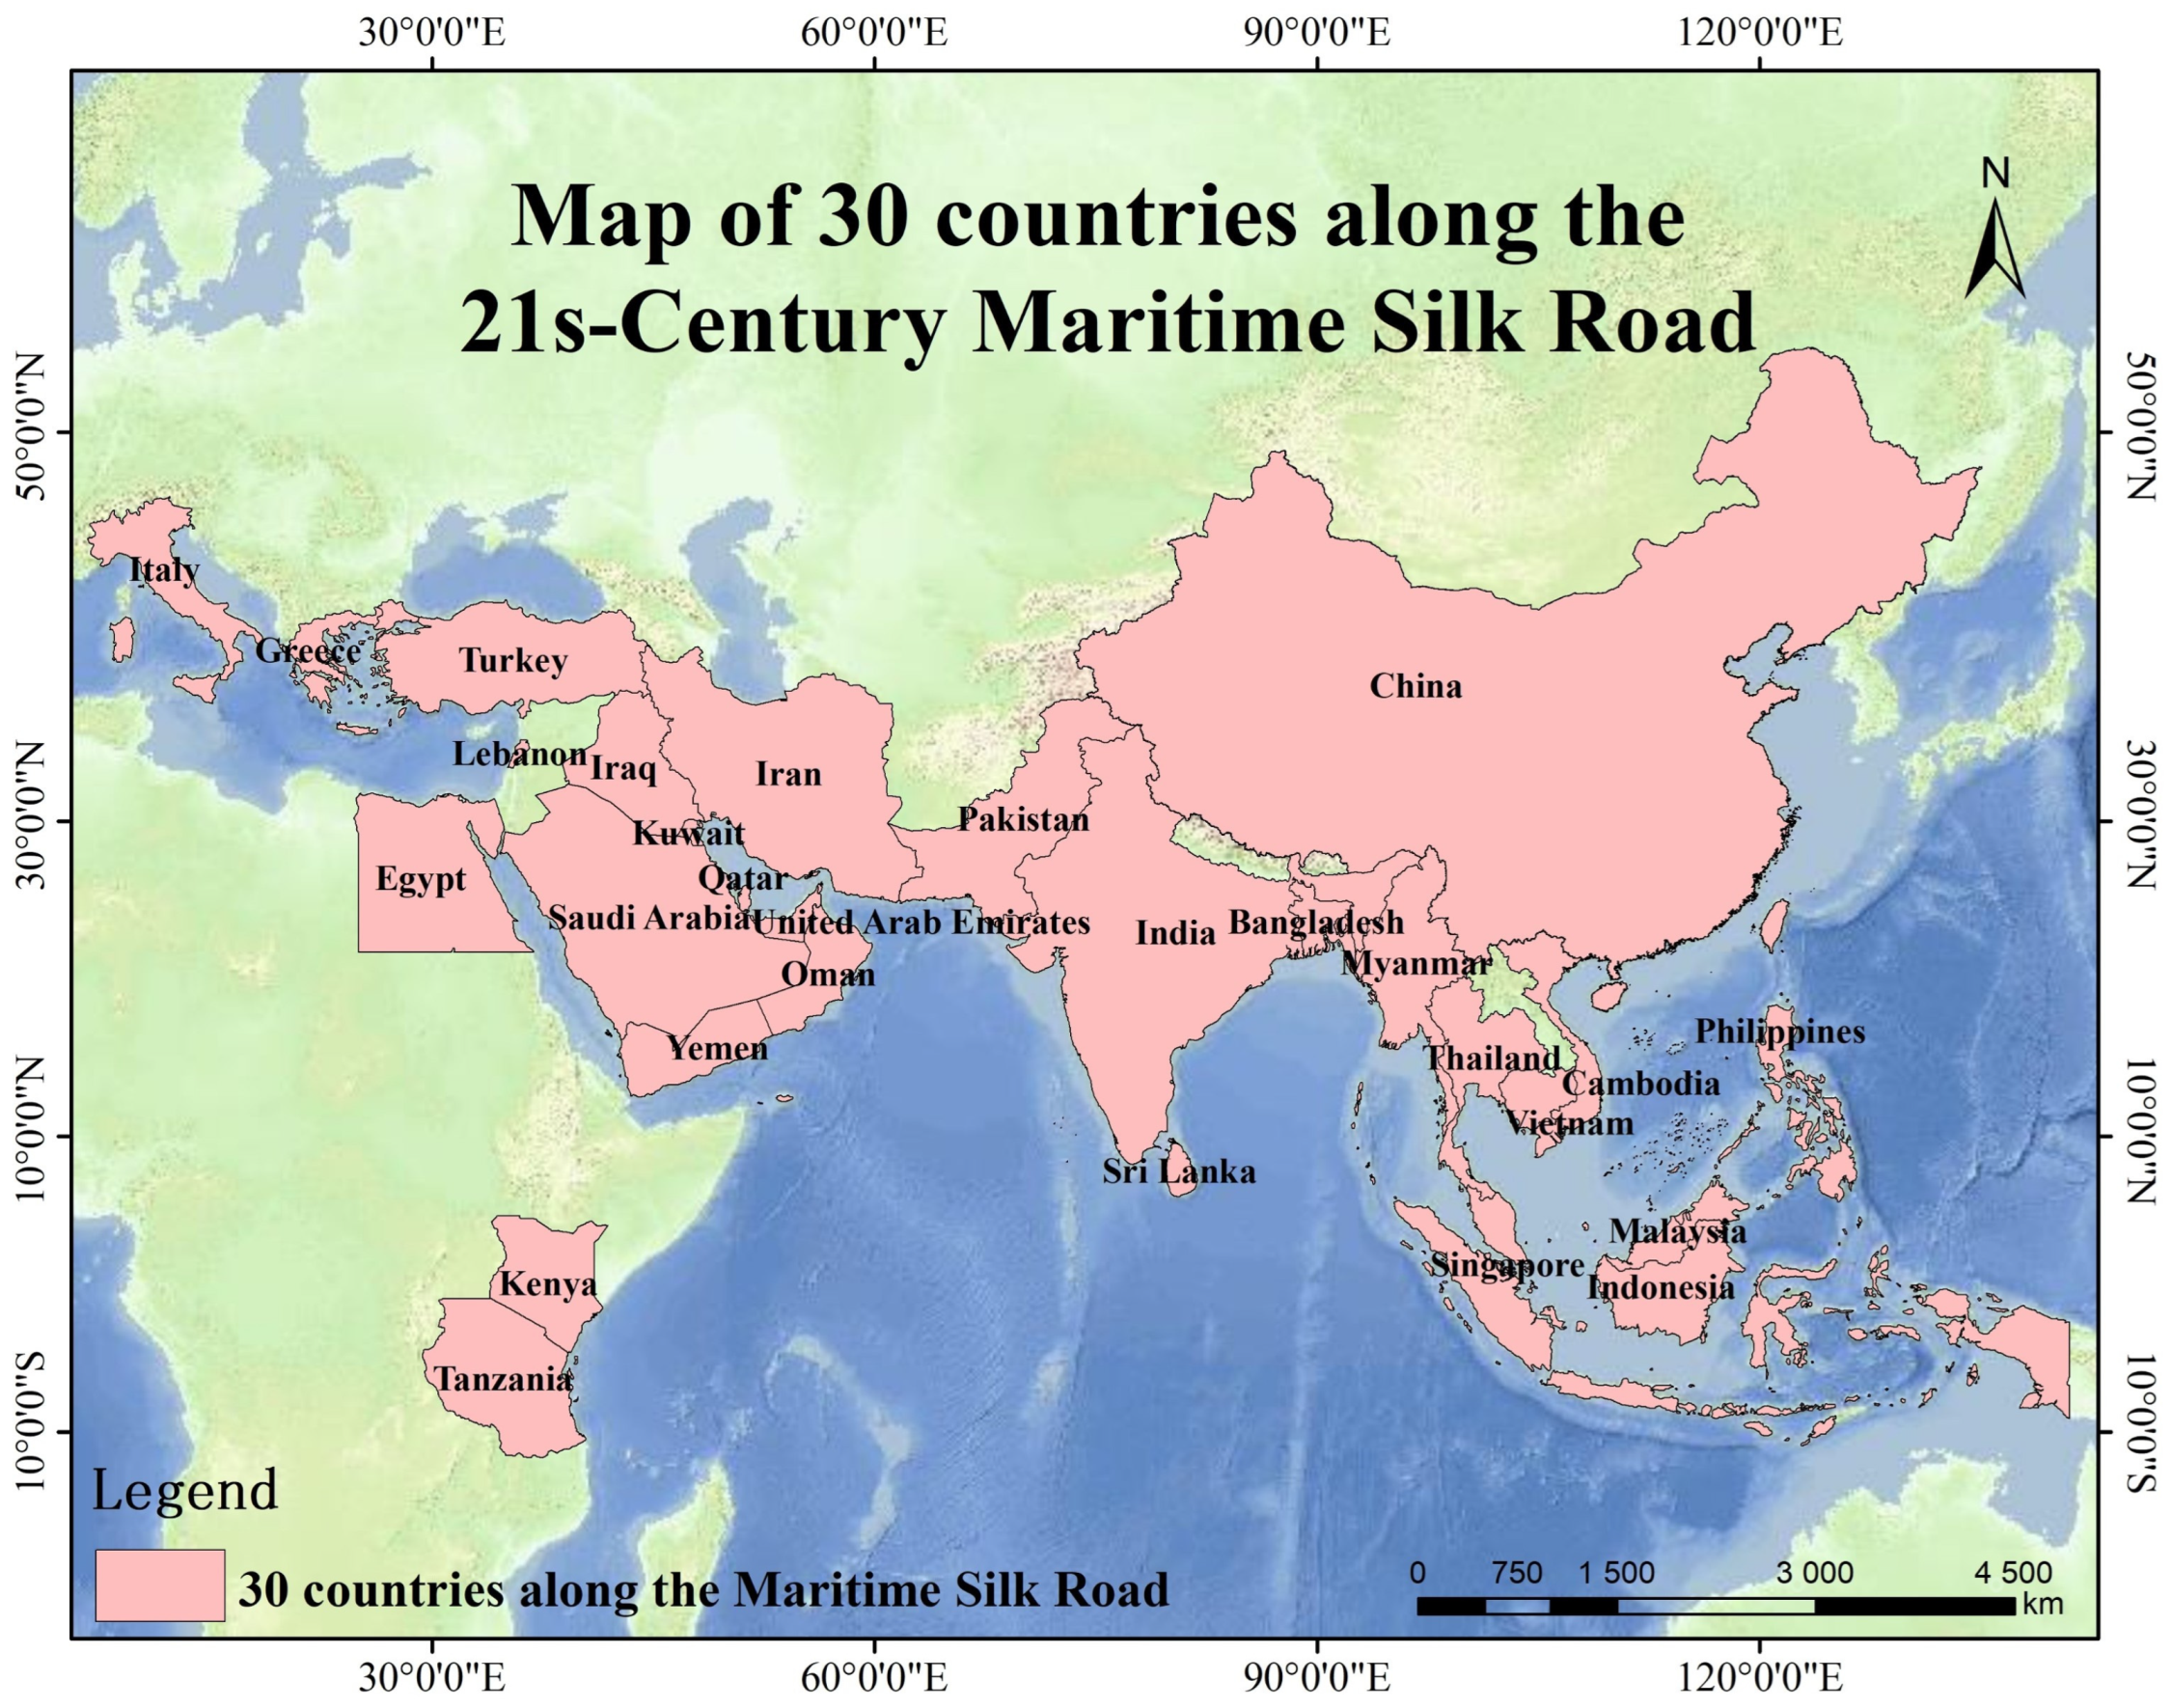
2.1. Study Area

The 21st-century Maritime Silk Road spans East Asia, South East Asia, South Asia, the Middle East, Africa, and parts of Europe (Figure 1). A number of strategic ports and key sea lanes are located along the route, constituting important hubs for global trade networks and infrastructure connectivity. The region is not only economically and strategically important but also encompasses a variety of natural landscapes, such as the Tibetan Plateau, the Ganges Plain, and the East African Plateau, etc. However, the countries along the road are generally vulnerable to severe risks of natural disasters, such as droughts, floods, earthquakes, and tropical storms. These disasters not only pose a challenge to regional maritime security but also impose serious constraints on the achievement of sustainable development goals. Especially in the context of intensifying climate change, the frequency and destructiveness of natural disasters are on the rise. This makes the study of disaster risk assessment in the region particularly important.

2.2. Data

Many types of natural disasters occur in the countries along the Maritime Silk Road. Based on historical disaster data, the four most common natural disaster types—earthquakes, storms, floods, and droughts—were selected. The data sources of natural disaster risk assessment indicators are also extensive, involving data on disasters, society, economy, and even culture. The main data sources included the EM-DAT disaster statistics website, World Bank, Goddard Space Flight Center, Data Service Center, World Clim, national statistical bureaus, and statistical offices, and more details on data sources can be found in Table A1. However, it is important to recognise that data from different countries can vary considerably in terms of quality, availability, and collection methods, making it difficult to compare results across countries. To address this issue, we normalised heterogeneous datasets in international databases to reduce the impact of these differences on the results of risk assessments.

3. Method

As shown in Figure 2, to construct a comprehensive natural disaster risk assessment system, the corresponding indicators were selected from the four aspects, namely, disaster-causing factors, disaster-conceiving environment, disaster-bearing bodies, and disaster risk reduction capacities. Five evaluation methods, including the entropy weight, independence weighting, analytic hierarchy process, and information-weighting methods, were selected to calculate the natural disaster risk index for each method. The results of the five evaluation methods were comprehensively assessed using the maximum deviation algorithm to obtain the comprehensive natural disaster risk index of 30 countries along the Maritime Silk Road.

3.1. Selection of Indicators for Natural Disaster Risk Assessment

Natural disaster risk assessment is a multidisciplinary systematic project aimed at analysing the causes of disasters, the vulnerability of carriers, and the regional capacity for disaster risk reduction [10]. Therefore, based on the aforementioned disaster system theory, this study added a fourth dimension of disaster risk reduction capacities to construct an evaluation system. This system is based on three dimensions, namely, the risk of disaster-causing factors, the sensitivity of the disaster-conceiving environment, and the vulnerability of disaster-bearing bodies. It thus provides a systematic framework for disaster risk assessment and achieves a comprehensive knowledge of natural disaster risks.
Indicators related to the risk of disaster-causing factors can be used to identify factors that lead to natural disasters. For example, historical data on earthquakes are used to establish indicators for the corresponding assessment of seismic hazards. Meteorological data can be used to predict the risk of extreme weather events such as storms and floods [3]. Indicators related to the sensitivity of disaster-conceiving environments focus on the characteristics of the disaster-affected environment and its sensitivity to natural hazards. Topographical factors, for example, can influence the formation of floods and their damage. Wetlands, forests, and shoreline ecosystems can reduce the risk of floods and storms in coastal areas [2]. Indicators of the vulnerability of disaster-bearing bodies need to be able to express the stresses that areas are exposed to in a disaster. Socio-economic characteristics are critical, including population density, property values, infrastructure, etc., which influence the degree to which an area can withstand a disaster [5]. Disaster risk reduction capacities focus on the ability of a region to mitigate losses and improve recovery after a disaster. Its evaluation indicators mainly include the resilience of infrastructure, the establishment of emergency response mechanisms, post-disaster recovery plans, and related training and education [10].
As there are many types of natural disasters, this study selected the four most common types of natural disasters in the countries along the Maritime Silk Road, namely, earthquake, storm, flood and drought, based on historical disaster statistics. The constructed comprehensive risk assessment index system of natural disasters in the countries along the Maritime Silk Road is shown in Table 1.

3.2. Single-Indicator Weight Calculation Methodology

Five indicator evaluation methods were selected to evaluate the disaster risk situation in different countries: the Criteria Importance Through the Intercriteria Correlation (CRITIC) weight method, the independence weighting method, the information-weighting method, the entropy weight method, and the analytic hierarchy process.

3.2.1. CRITIC

The core idea of the CRITIC is to determine weights based on the volatility and correlation of the indicator data. This method comprehensively evaluates the importance of indicators by calculating the standard deviation of each indicator. The correlation coefficient with other indicators is used to measure the conflict. A higher standard deviation represents higher volatility of the indicator and therefore a higher indicator weight. The comparison strength and conflict indicators are multiplied and normalised to obtain the final weight [11].

3.2.2. Independence Weighting Method

The core idea of the independence weighting method (IWM) is to determine weights by analysing the correlation between indicators. This method is based mainly on the linear relationship between indicators. The key step was to use regression analysis to calculate the multiple correlation coefficient or R values. Higher R values indicate stronger collinearity. An indicator with a low correlation represents more independent information for that indicator; therefore, it is weighted higher [12].

3.2.3. Information-Weighting Method

The information-weighting method (IM) quantifies the relative significance of evaluation metrics by analysing their data dispersion through the coefficient of variation calculations. Particularly effective in multi-indicator assessment, this method objectively assigns weights based on each indicator’s inherent informational value derived from its dataset variability. The technique employs a streamlined computational approach that prioritises statistical properties over subjective judgements. The weighting of outcomes is principally determined by the relative spread of observed values across indicators [13].

3.2.4. Entropy Weight Method

The entropy weight method (EWM) employs information entropy theory to objectively quantify indicators’ significance. By measuring information uncertainty inherent in datasets, this technique calculates entropy values reflecting the disorder level of each indicator’s distribution. Higher entropy denotes greater uniformity, warranting reduced weighting, while lower entropy signals concentrated data patterns meriting prioritisation. This method can reduce subjective bias by deriving weights exclusively from intrinsic data characteristics. It proves particularly effective in multi-criteria decision-making frameworks, requiring rigorous differentiation between correlated variables [14].

3.2.5. Analytic Hierarchy Process

The analytic hierarchy process (AHP) is a multi-criteria decision analysis method used to deal with complex decision problems. It provides a systematic approach for decomposing complex decision-making problems into multiple hierarchical levels and comprises five sequential phases: (1) establishment of a hierarchical structure model, (2) construction of pairwise comparison matrices, (3) verification of the consistency ratio, (4) derivation of relative weights, and (5) synthesis of comprehensive evaluation results [15].

3.3. Combination Assessment Method Based on Maximum Deviations

The combination assessment method based on maximum deviations (CAMBMD) directly combines the evaluation values instead of using the traditional weight combination. This approach aims to avoid possible biases caused by weight combinations and to improve the information content of the results. It maximises the difference between combined evaluation values, thereby improving the discrimination of evaluation results. This enables decision-makers to sort and select solutions more intuitively and effectively. The specific implementation process is as follows:
(1)
Indicator object set: Construct the evaluation object set S = {S1, S2, …, Sm}, the indicator set of each object is G = {G1, G2, …, Gn}, let the jth indicator value of the ith object be yij, and, then, Y = (yij) m×n is the attribute matrix.
(2)
Method set: Construct a method set, f = {f1, f2, …, fc}, and use different evaluation methods in the method set f for evaluation. The evaluation result matrix F is obtained. F = (fij)m×c, where fij is the evaluation result of the ith object under method c.
(3)
Calculation of combined weights: Assuming that the weight vector of each single evaluation method is W = [w1, w2, … wc]T, then the combined evaluation value of the ith object can be obtained as follows:
F i = w 1 f i 1 + w 2 f i 2 + + w c f i c
Let dijt be the deviation between the ith and tth objects under a single evaluation method fj, where the dijt can be expressed as follows:
d i j t = f i j f t j
Then, the deviation of two different objects under the combined evaluation method is the following:
d i t = j = 1 c ω j f i j f t j
Therefore, under the combined evaluation method, the total deviation of the object is as follows:
D = i = 1 m t = 1 m j = 1 c ω j f i j f t j
The combined evaluation weight set should maximise the total deviation of all evaluation objects under the combined evaluation method. Therefore, we have the following:
m a x D = i = 1 m t = 1 m j = 1 c ω j f i j f t j
s × t j = 1 c w 2 = 1
The following formula is obtained based on the Lagrangian method:
w j = i = 1 m t = 1 m f i j f t j j = 1 n ( i = 1 m t = 1 m f i j f t j ) 2
The combined weights are calculated after standardisation:
w j * = i = 1 m t = 1 m f i j f t j j = 1 n i = 1 m t = 1 m f i j f t j
The combined evaluation result formula of the final object Si is the following:
H i = w 1 f i 1 + w 2 f i 2 + + w c f i c

3.4. Metric Weights

In this study, the weights of five different single indicator weights were calculated using the SPSS 22.0 software. This process derives the weights of each type of disaster risk indicator under different evaluation methods. The results are shown in Table A2, Table A3, Table A4 and Table A5. Based on the combined evaluation method for maximum deviations, the combined weights of the five single evaluation methods were calculated. The final results are shown in Table 2.

4. Results

The natural disaster risk index of the countries along the Maritime Silk Road was calculated according to the formula for the evaluation results. We used the natural interval classification to classify disaster risk into five different levels in order to compare and analyse the relative magnitude of natural hazard risk in different countries. The levels are higher risk (0–0.2), high risk (<0.2–0.4), medium risk (<0.4–0.6), low risk (<0.6–0.8) and lower risk (<0.8–1).

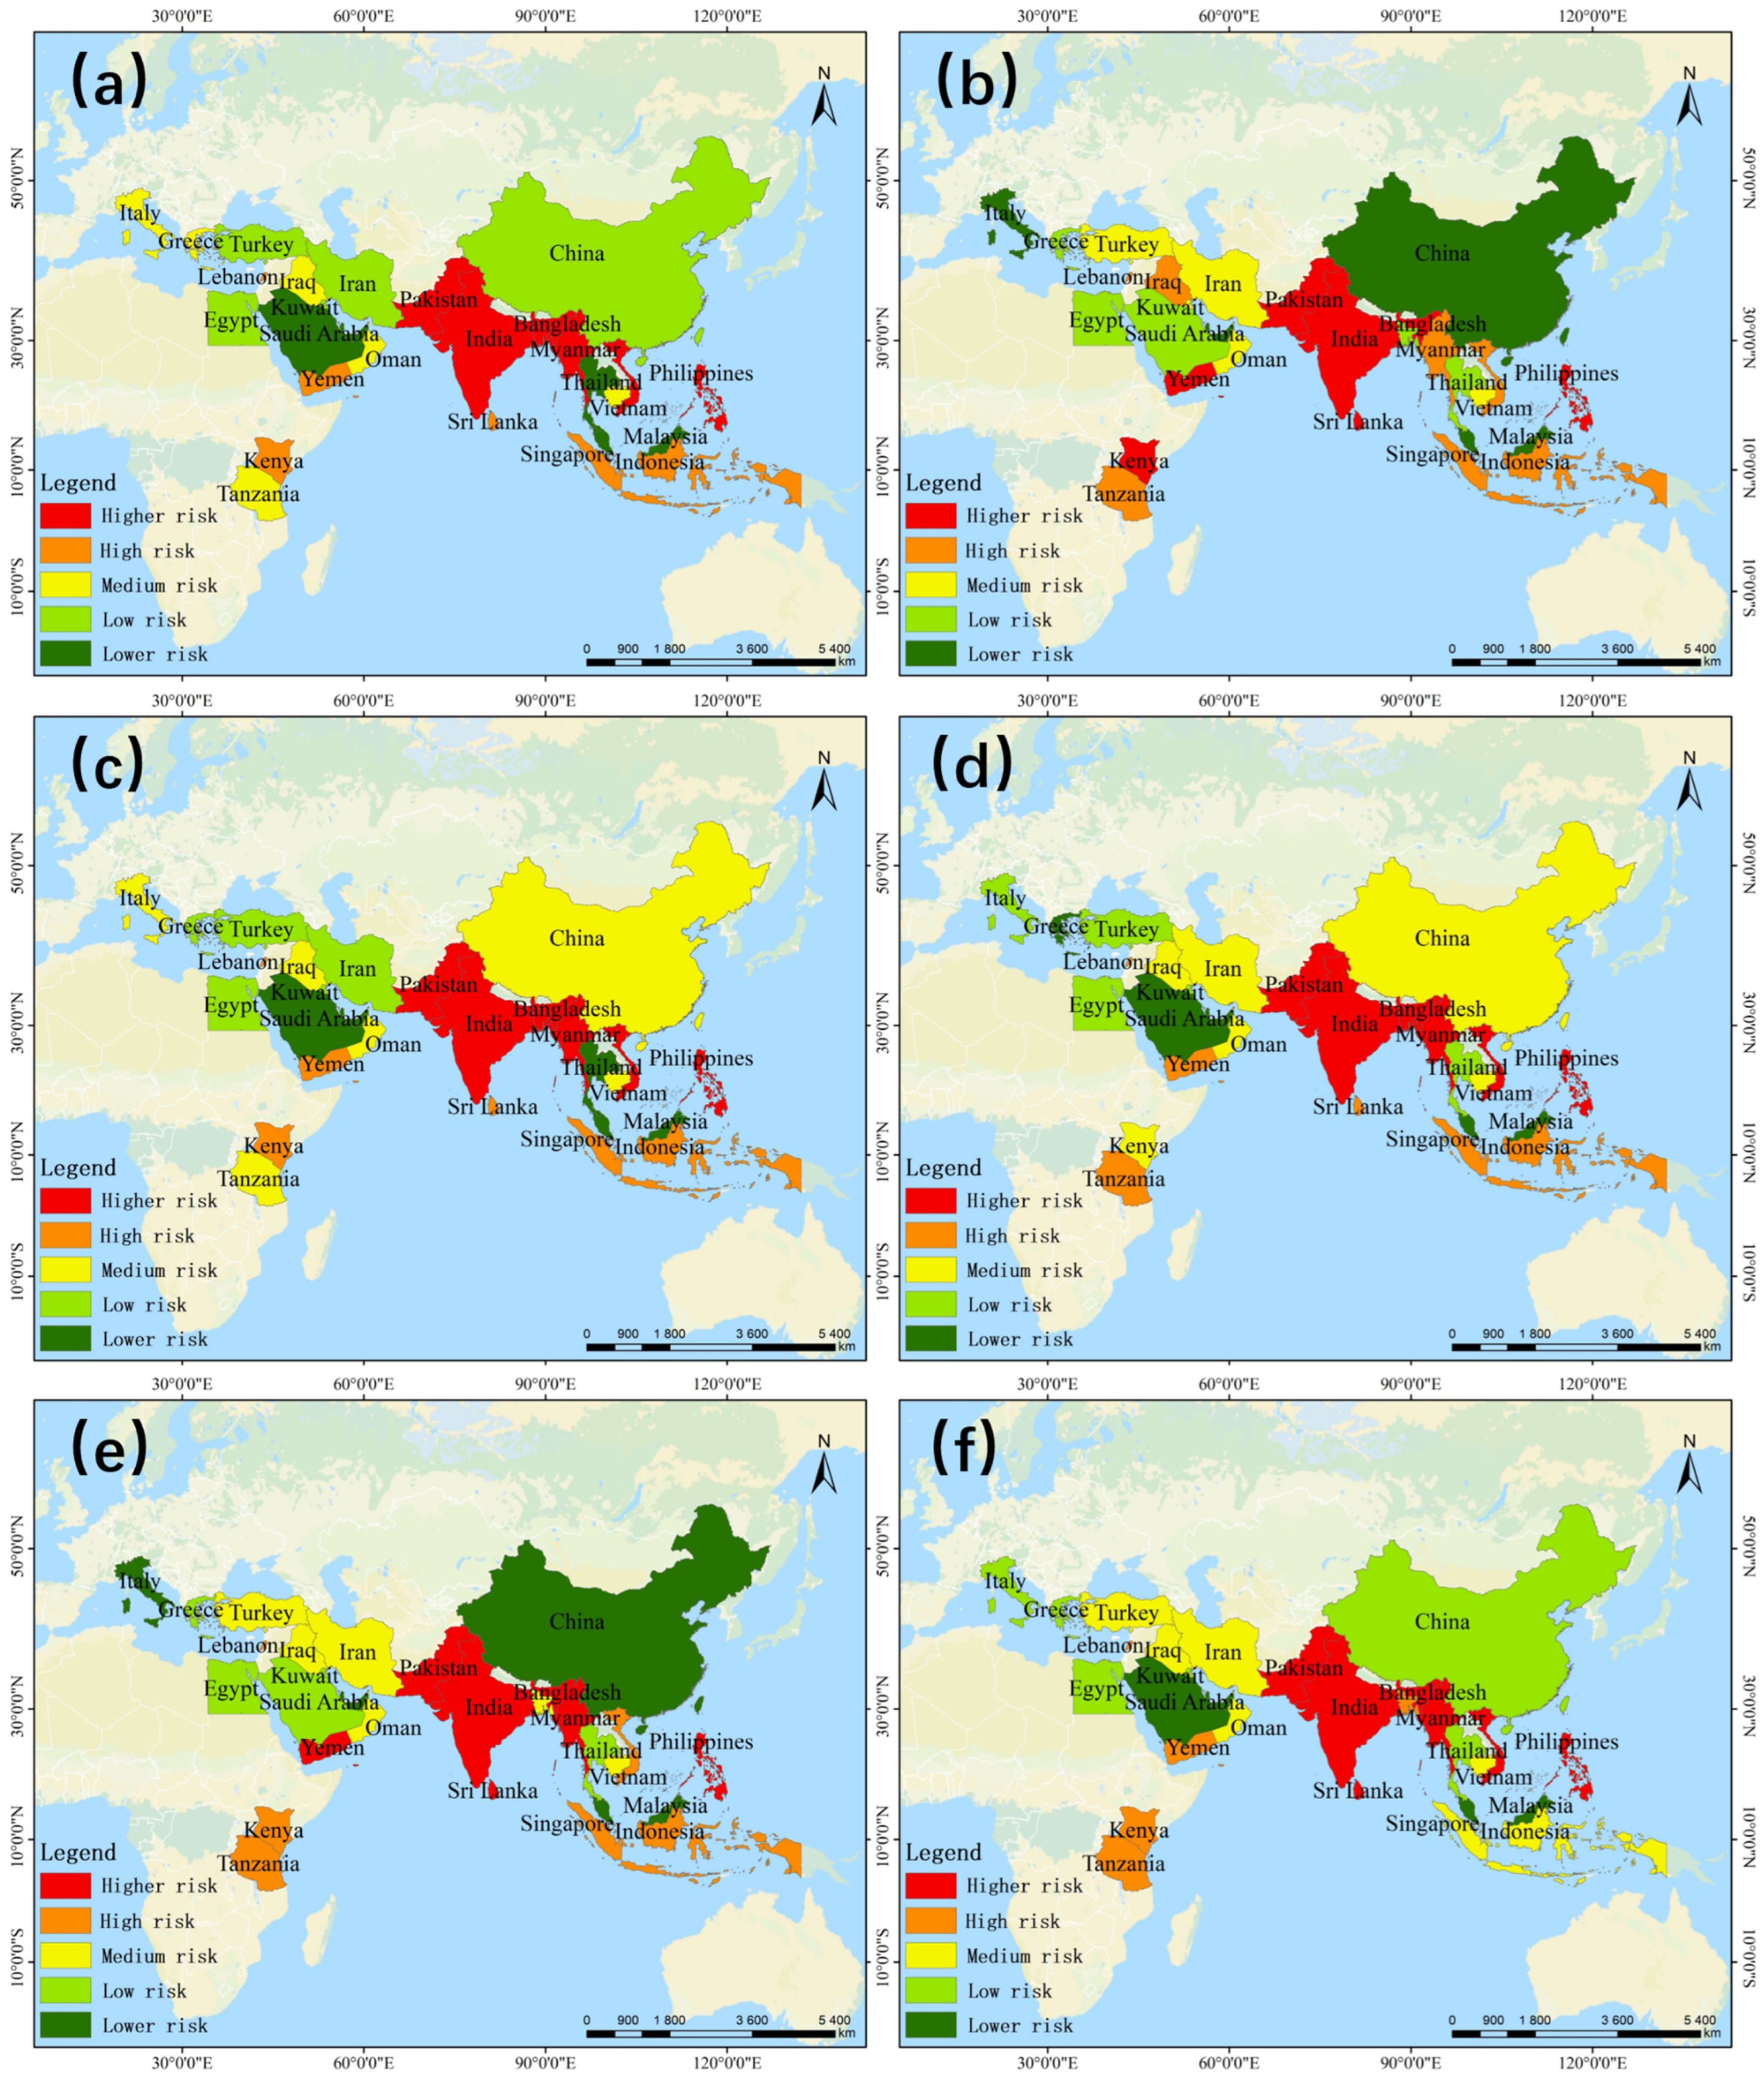
4.1. Seismic Hazard Risk Assessment Results

The results of the seismic hazard risk assessment of the countries along the Maritime Silk Road are shown in Figure 3. Under the CRITIC method assessment results (Figure 3a), the seismic high-risk zones were mainly located in four South Asian countries and Indonesia, with Saudi Arabia having the lowest seismic risk index of 0.494. India has the highest seismic score (0.746). Overall, most countries in South and Southeast Asia have a higher risk of seismic hazards, and most countries near the Arabian Peninsula have a lower risk of seismic hazards. Under the entropy weight method assessment, the high-seismic-risk region was still mainly located in South Asia, with China and European countries becoming lower-risk regions (Figure 3b). The distribution of higher- and lower-risk areas based on the results of the independent weighting method was generally consistent with that of the CRITIC method. Based on the results of the AHP assessment, China’s seismic hazard risk level decreased to lower risk (Figure 3d). The assessment results of the information-weighting method were similar to those of the entropy weighting method (Figure 3e). In fact, seismic risk is still high in regions such as the mountains of southwest China and the Tibetan Plateau.
The higher-risk areas under the combination assessment method were mainly located in South Asia, for example, Pakistan and India. The lower-risk areas were mainly located near the Arabian Peninsula, and Saudi Arabia had the lowest seismic risk, with a risk index of 0.708 (Table A6). From Figure 3a–f, China and countries along the Mediterranean consistently have a low seismic risk. Medium- and high-risk areas are mainly located in Southeast Asia and East Africa. Combining the evaluation results of all six methods, Pakistan, India, and Bangladesh all show high seismic risk ratings, while Saudi Arabia shows the lowest seismic risk for all of them. The high risk of seismic hazards in South Asia is mainly due to deficiencies in disaster risk reduction capacities. This pattern suggests that the rise in seismic risk in South Asian countries is due not only to their geographic exposure to tectonic activity but also to high population densities and weak infrastructures. Countries near the Arabian Peninsula are at lower risk of seismic hazards. This is due to the low frequency of seismic hazards and their good performance in terms of disaster risk reduction capacities.

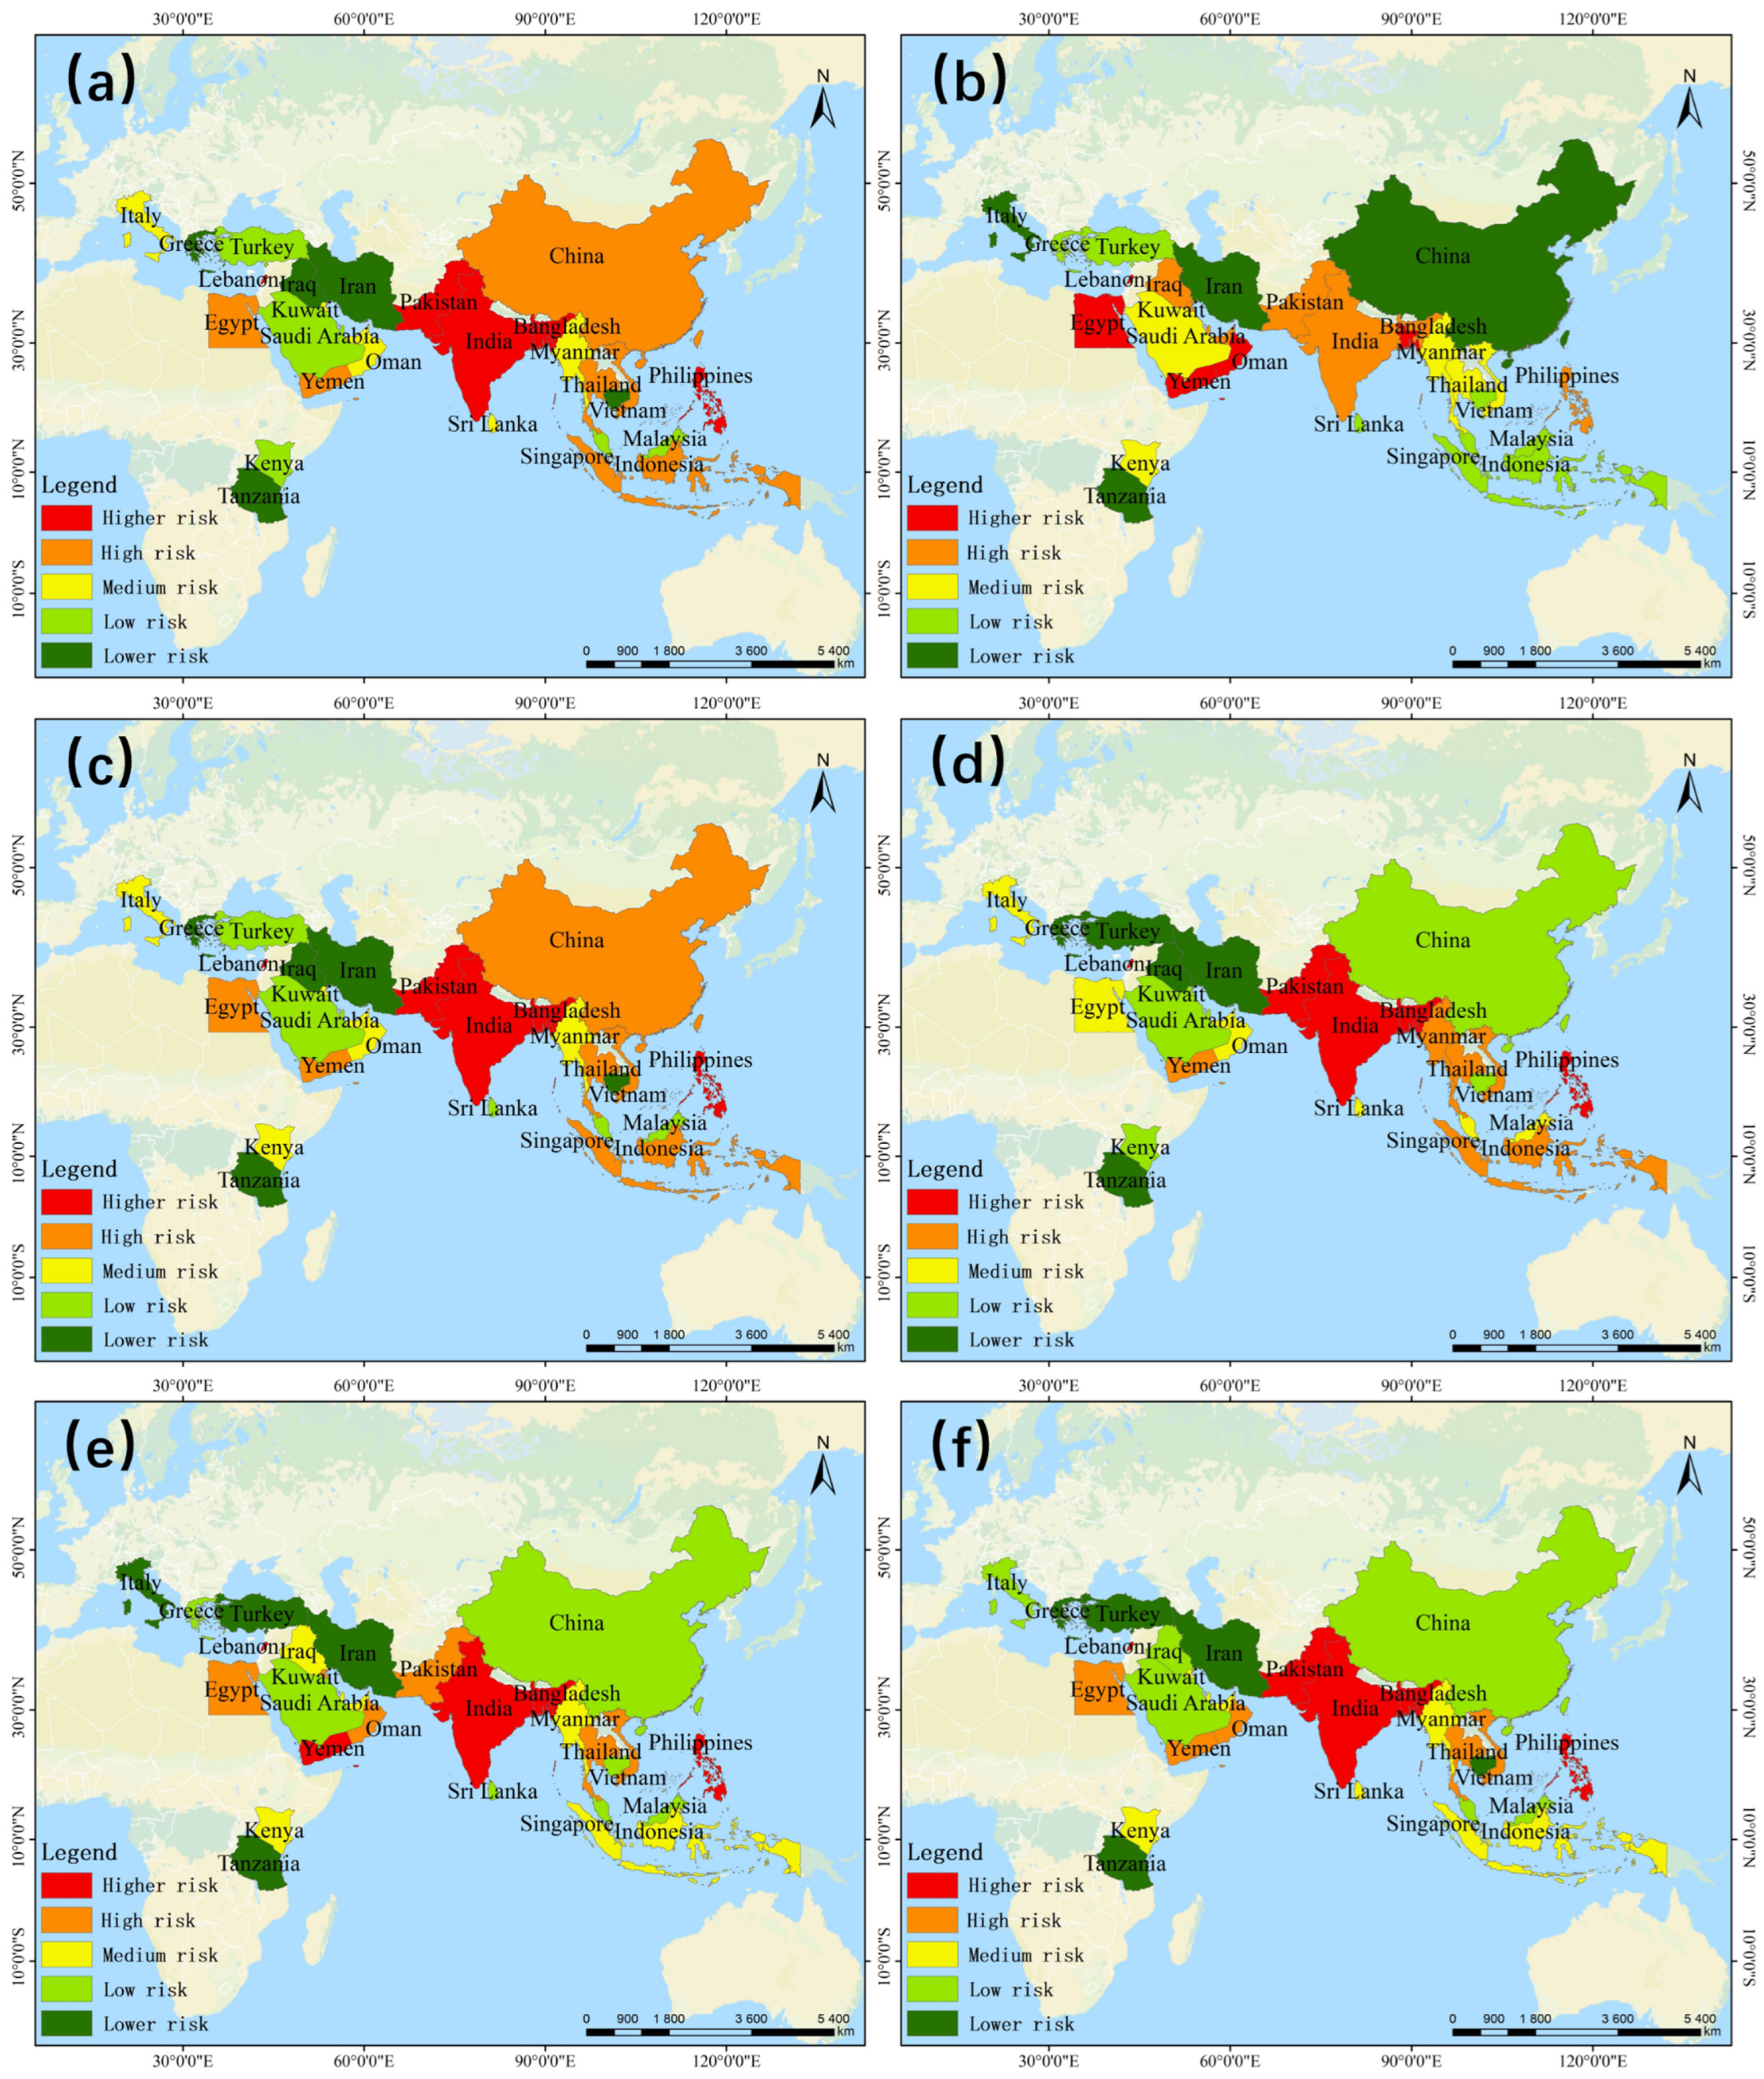
4.2. Storm Hazard Risk Assessment Results

The grading of the storm hazard risk assessment results for the countries along the Maritime Silk Road is shown in Figure 4. Under the results of the CRITIC method of assessment, the high and higher risk areas are mainly located in some countries in South and Southeast Asia. In contrast, most of the countries in the Middle East region, as well as China, are at low risk. These findings are more similar to the combination assessment method. According to the entropy weight method assessment results, the storm risk was low on the west coast of the Persian Gulf, China, and some countries in Southeast Asia. Most of the high-risk areas were located in South Asia and Africa (Figure 4a). It has almost the same assessment results as the information-weighting method. Based on the results of the independence weighting method, higher-risk areas were mainly located in South and Southeast Asia, with lower storm risks in the Persian Gulf, Malaysia, and Brunei (Figure 4c). Most European countries are at medium risk based on the AHP results, and the remaining results are similar to those assessed using the independence weighting method.
In summary, under the combination assessment method, the lower-risk areas were mainly located in the Persian Gulf and countries around the Malay Peninsula, with the UAE having the lowest storm risk (0.751). Higher-risk areas were mostly found in South and Southeast Asia, such as Vietnam and the Philippines, with India having the highest storm risk with a composite score of only 0.388 (Table A7). In all six assessment results, Vietnam, the Philippines and countries in South Asia are consistently shown as higher risk areas, while low-risk areas are mainly located in the Arabian Peninsula. Combining the indicator data for each country shows that the high-risk regions are mainly due to deficiencies in disaster-causing factors. This is due to the geographical vulnerability of South and Southeast Asia to frequent tropical cyclones and monsoons. The Philippines and Vietnam have low scores in terms of the vulnerability of disaster-bearing bodies.

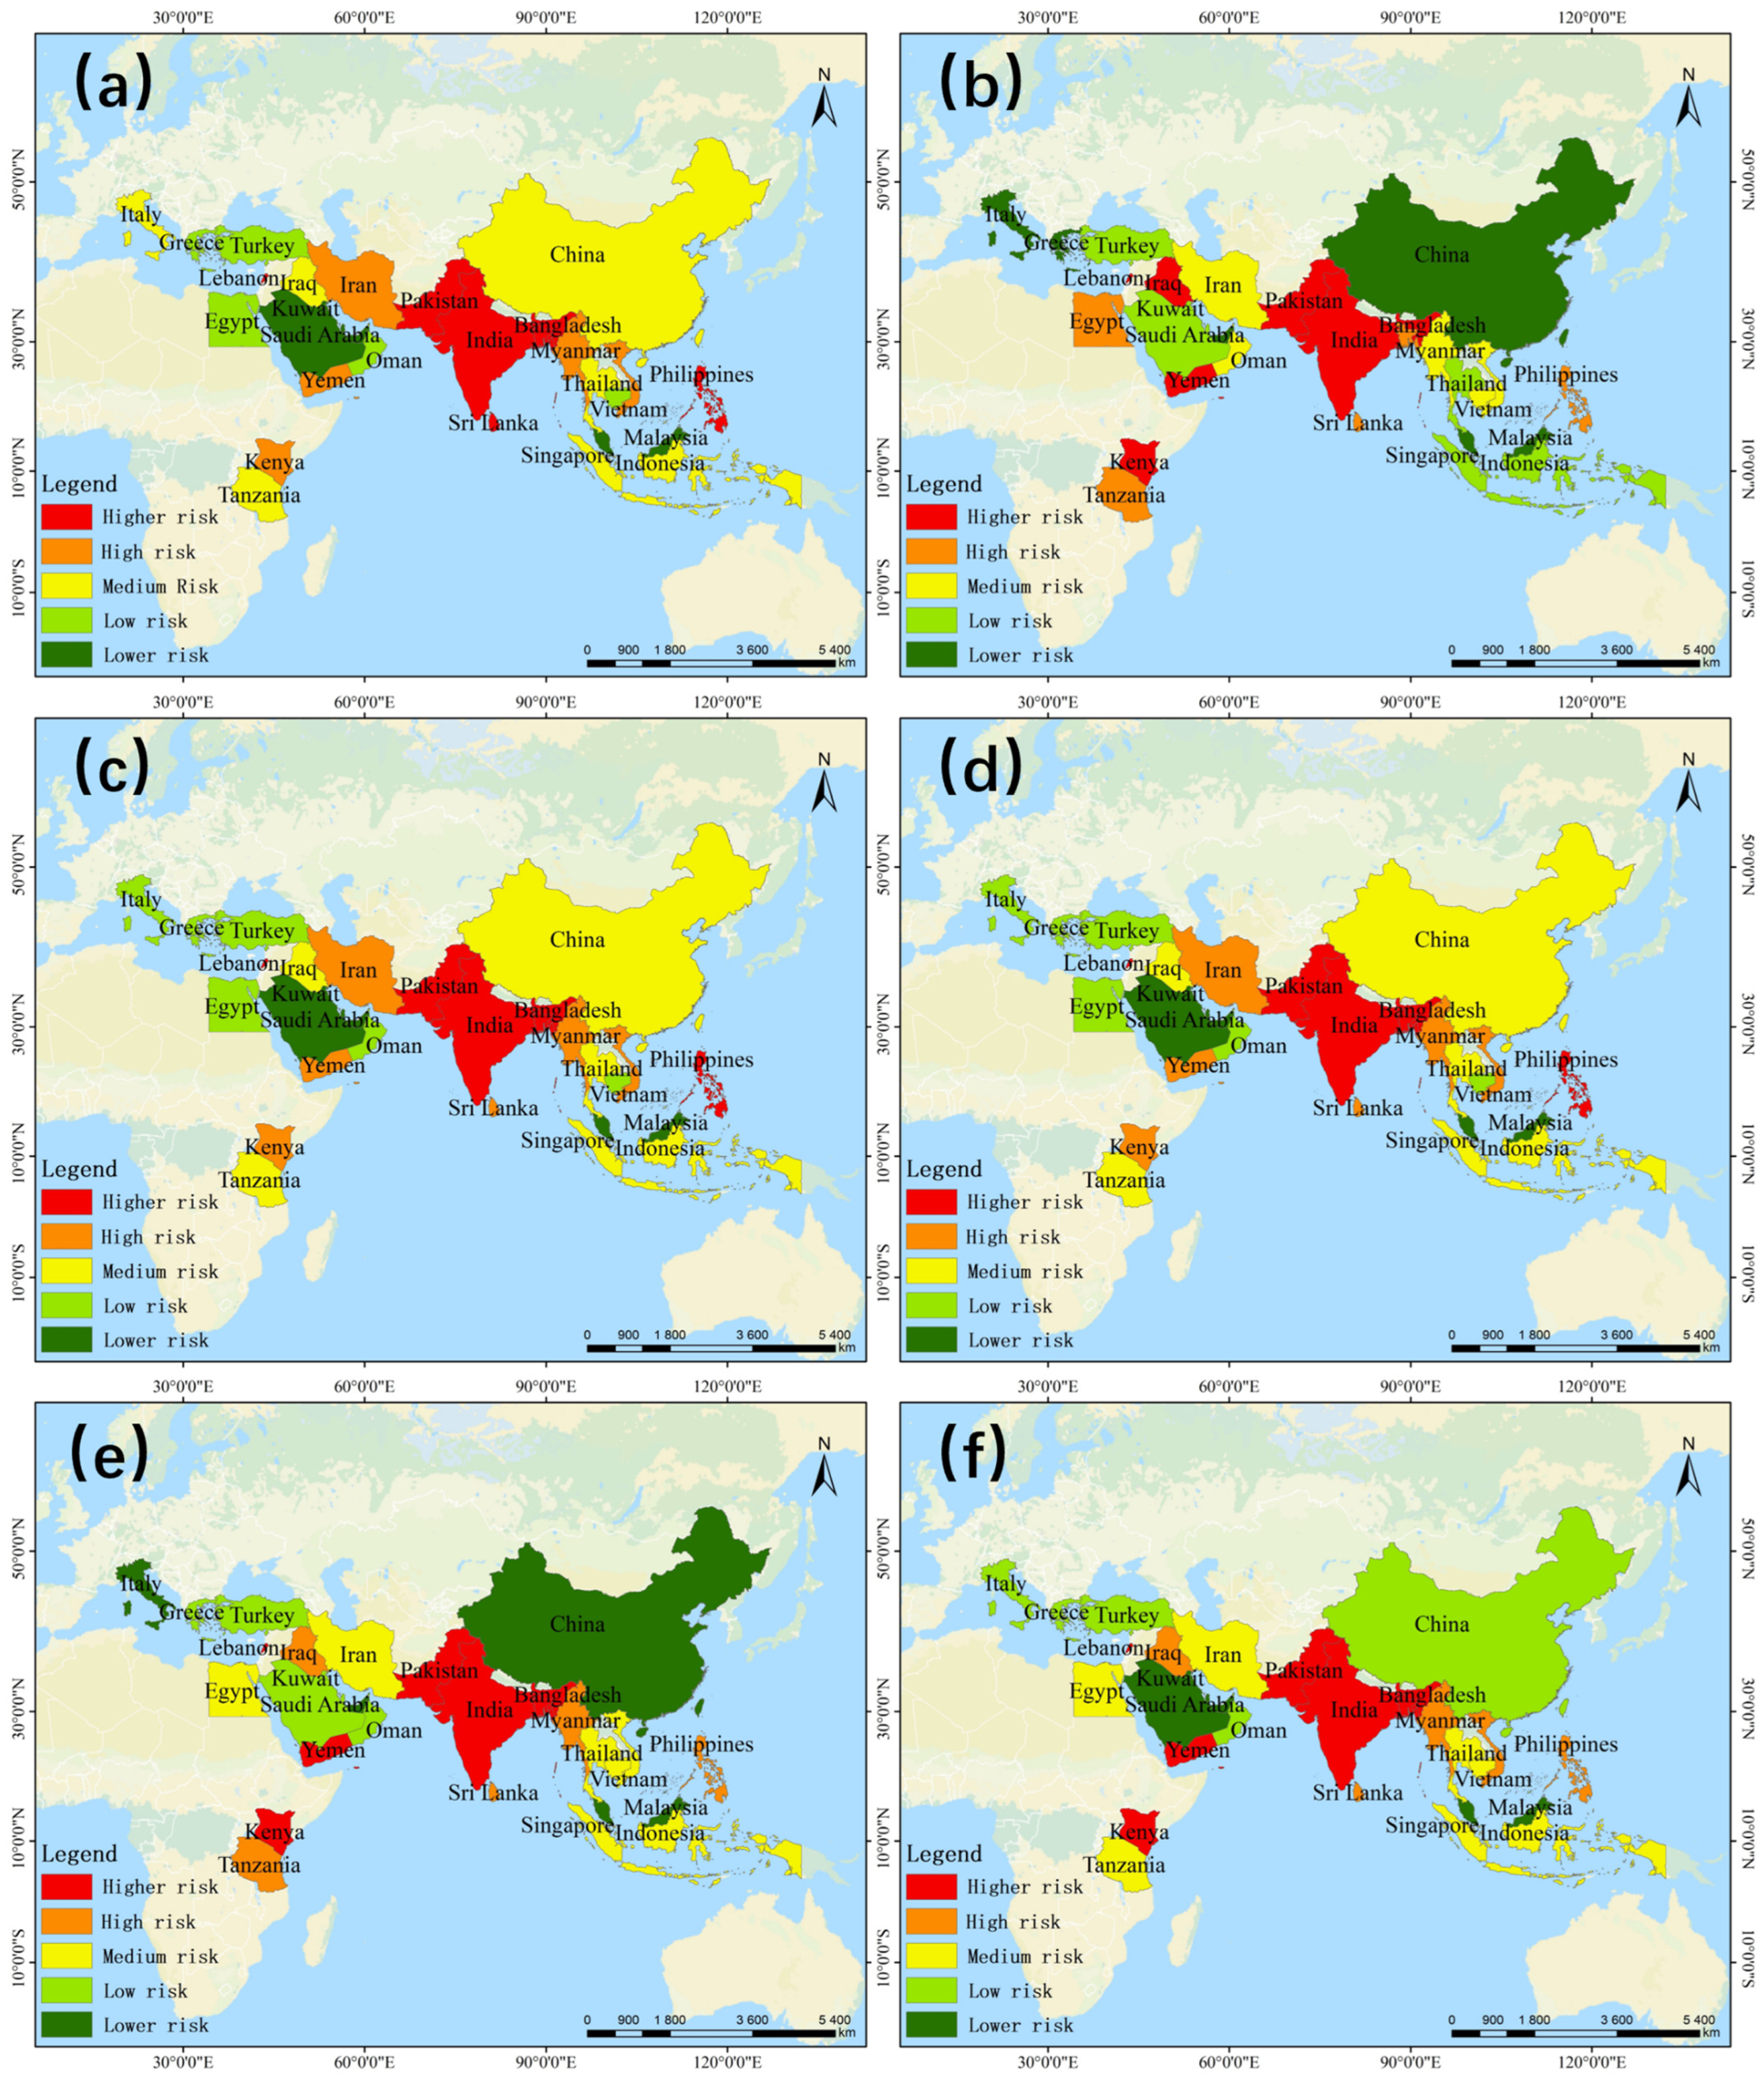
4.3. Drought Hazard Risk Assessment Results

Figure 5 shows the results of drought hazard risk assessments in each country. Under the CRITIC method, higher-risk areas for drought were mainly located in South Asia and East Africa. The lower-risk areas were mostly located on the west coast of the Persian Gulf and Southeast Asian countries, while the medium-risk and high-risk areas were mainly located on the Mediterranean coast and in China (Figure 5a). The assessment results of the independent weighting and analytic hierarchy methods were generally consistent with those of the CRITIC method. Under the entropy weight method, the low- and lower-risk regions for drought were all located in Southeast Asia, with higher drought risk in the Middle East and Africa (Figure 5b). Overall, under the entropy weight method of assessment, the drought risk was low in countries located in the eastern part of the Maritime Silk Road route, excluding China. In contrast, the drought risk was low and high in most countries along the western part of the route. Except for Italy and Indonesia, there is a high level of consistency between the evaluation results of the independence weighting method and those of the AHP method. The results of the information-weighting method are more similar to those of the combination assessment method, but there is a discrepancy in the risk ratings in India and Italy.
Under the combination assessment method (Figure 5f), higher drought risk areas are found in India and Pakistan in South Asia, Iraq and Iran in the Middle East, and Kenya and Tanzania in East Africa. Notably, Kenya has the highest drought risk index of 0.346. Kenya’s high drought risk could stem from both climatic factors and socio-economic vulnerabilities, such as poverty and reliance on rain-fed agriculture. Medium- and high-risk areas are found along the Mediterranean coast and in China, whereas countries in Southeast Asia are at low risk. Brunei has the lowest drought risk, with a composite score of 0.775. Based on the results of these six evaluations, it can be seen that the low and lower drought risk areas are mainly distributed in Southeast Asian countries. The high-risk areas are widespread, mainly located in China, East Africa, Central Asia, and South Asia. Combined with the indicator data for each country (Table A8), it can be seen that countries facing high and higher risks of drought demonstrate suboptimal performance across key indicators. Specifically, these nations show deficiencies in disaster-bearing bodies, disaster-conceiving environments, and disaster risk reduction capacities. Meanwhile, Malaysia and Brunei are at lower risk of drought impacts because of their favourable performance in terms of disaster-causing factors, disaster-conceiving environments, and disaster-bearing bodies.

4.4. Flood Hazard Risk Assessment Results

As shown in Figure 6, under the assessment results of the CRITIC method, the higher-risk and high-risk areas for flooding are mainly located in East Asia, South Asia, and Southeast Asia. The lower-risk areas are mainly located on the Persian Gulf coast and in Eastern Africa (Figure 6a). The results of the independence weighting method are essentially the same as those of the CRITIC method (Figure 6c). Under the entropy weight assessment, areas of low and lower risk of flooding were located mainly in Europe, China, and the Indonesian Archipelago. Areas of high and higher risk were located mainly in South Asia and countries near the Red Sea and the Gulf of Aden (Figure 6b). According to the results of the AHP, the regions of high and higher risk of flooding were mainly located in South and Southeast Asia, whereas the Middle East and Africa were largely at low-to-medium risk (Figure 6d).
Under the combination assessment approach, the low- and lower-risk areas for floods were mainly located in Europe, and the high- and higher-risk areas were mainly located in South and Southeast Asia. Bangladesh has the highest risk of flood hazards, with a risk index of 0.401 (Table A9). This result is almost the same as the evaluation result of the information-weighting method. From all the evaluations, it is clear that the risk of flooding in Tanzania and Iran is consistently lower. The Philippines, Yemen, and South Asian countries such as Bangladesh, India, and Pakistan all showed high risk. Combining the indicator data for each country shows that Lebanon, Bahrain, and Bangladesh have higher risks of flooding because of deficiencies in disaster-conceiving environments and disaster risk reduction capacities. This reflects the weakness of infrastructure, preparedness, and disaster response capacity in these countries. In contrast, India, Pakistan, and the Philippines have lower scores on disaster-causing factors because of frequent exposure to flooding events.

4.5. The Comprehensive Risk of Natural Disaster Assessment Results

Under the CRITIC method assessment (Figure 7a), lower-risk areas were mainly located on the west coast of the Persian Gulf and Malaysia. High- and higher-risk areas were mainly located in South Asia and the Philippines, while most of the Mediterranean coastal countries were at low risk. Its assessment results are basically the same as those of the independence weighting method and the AHP method (Figure 7c,d). Under the entropy approach assessment results, the low- and lower-risk areas were mainly located in China, Europe, the west coast of the Persian Gulf, the Malay Peninsula, and the Indonesian Archipelago. The high- and higher-risk areas were mainly located in Africa and South Asia (Figure 7b). The evaluation results of the information-weighting method (Figure 7e) were broadly consistent with those of the entropy weight method.
Under the combined assessment method, the lower-risk regions were mainly located on the west coast of the Persian Gulf, Malaysia, and Brunei. Brunei has the lowest risk of natural hazards, with a risk index of 0.686, whereas the low-risk regions are mainly located in Europe and China. Medium-risk regions are more dispersed and found in the Middle East, Africa, and Southeast Asia. High- and higher-risk regions are concentrated in South and Southeast Asia, with India having the highest natural disaster risk, with a risk index of 0.417 (Table A10). The evaluation results of the six models all show that the combined natural disaster risk is higher in South Asian countries. Low-risk areas are found in the Arabian Peninsula and the countries bordering the Mediterranean. This spatial pattern not only reflects the region’s exposure to multiple hazards but also correlates with socio-economic vulnerability factors. These factors, such as high population density, insufficiently resilient infrastructure, and limited adaptive capacity, amplify the impact of disasters.

5. Discussion and Recommendations

5.1. Discussion

Based on the evaluation results, South Asian countries such as India, Pakistan, and Bangladesh have a higher seismic risk index. This reflects the fact that they are located at the junction of active tectonic plates (e.g., the collision zone between the Indian and Eurasian plates), which is characterised by high seismic activity [16]. Most countries in Southeast Asia are at medium or high risk of seismic hazards, mainly because of their location in the “Pacific Rim Seismic Belt”, which is characterised by high levels of volcanic and seismic activity [17]. Lower-risk countries (e.g., Saudi Arabia and Kuwait) are located in stable tectonic plate zones with fewer seismic hazards and better disaster risk reduction infrastructure. Thus, for South Asia, the impact of seismic hazards on life and property is particularly severe, as they can destroy fragile buildings and infrastructure. This destruction further exacerbates socioeconomic inequalities in the region. In Southeast Asia, seismic risk not only affects cities and residential areas but also threatens the local coastal tourism industry and marine infrastructure. In West Asia and Europe, on the other hand, despite the relatively low seismic risk in those regions, investments in building resilience to sudden and strong seismic hazards should continue.
The risk of storm disasters is particularly significant in tropical countries, especially in Vietnam and the Philippines in Southeast Asia. This is because the path of typhoons covers this region, and flooding, strong winds, and waves from storms pose a significant threat to both coastal cities and rural areas [18]. Middle Eastern countries, such as the UAE and Qatar, are at lower risk because of their arid climates and high levels of shoreline protection. In Southeast Asia, storms pose serious threats to local food security, damage coastal infrastructures, and trigger large-scale human displacement. In the Middle East, despite the low risk, extreme weather events (such as the heavy rainfall observed in recent years) can cause secondary disasters, such as flooding, affecting local economic activities [19].
Areas of high drought disaster risk are concentrated in Kenya, Africa, and some Middle Eastern countries (e.g., Iran and Yemen). These regions have dry climates with scarce precipitation and are increasingly affected by climate change. Countries at lower risk, such as Malaysia and Indonesia, have abundant annual precipitation because of their tropical rainforest climate zones [20]. In Eastern Africa, drought is a particularly significant threat to countries that are highly dependent on agriculture, leading to a decline in food production, livestock mortality, and water scarcity. The Middle East is under further pressure to manage water resources, with potential impacts on the livelihoods of its population and regional political stability [21]. In Southeast Asia, although the drought risk is low, localised drought phenomena may have regional impacts on agricultural production and water supply systems.
In terms of flood risk, Bangladesh is a higher-risk country for flooding, as monsoon rains are prone to flooding due to its low-lying terrain and many rivers [22]. Studies have consistently shown that Bangladesh’s vulnerability to flooding is exacerbated by factors such as high population density, poverty, and inadequate infrastructure. Additionally, this vulnerability is worsened by climate change impacts, including sea-level rise and increased rainfall intensity [23]. Lower-risk countries such as Iran and Tanzania benefit from their arid or semi-arid climate conditions and scarce precipitation. In South Asia, floods often destroy farmland, displacing people, paralysing infrastructure, and causing outbreaks of infectious diseases, which in turn affect food trade and economic growth [24]. Finally, in East Africa, the Middle East, and Europe, although the risk is low, extreme weather conditions and localised flooding are still possible, impacting city operations and economic activities.
From the perspective of comprehensive natural disaster risk, South Asian countries, such as Pakistan, India, and Bangladesh, have higher composite risk scores. This reflects its simultaneous exposure to the combined risk of multiple hazards and its insufficient capacity for disaster risk reduction. The findings are in line with the Global Assessment Report on Disaster Risk Reduction and the report of the Intergovernmental Panel on Climate Change. Both of these reports emphasise the vulnerability of South Asia, and Bangladesh in particular, to multi-hazard disasters due to its geographic location, socio-economic conditions, and limited adaptive capacity [25,26]. The UAE and countries bordering the Mediterranean have low risk owing to their strong economies, advanced disaster management systems, and favourable geographic conditions. These regions have a high level of resilience in terms of economic loss and protection of life and property. In South Asia, the compounded impacts of multiple hazards can increase poverty, undermine economic development gains, and hinder social stability. In Southeast Asia, despite the medium combined risk, the high frequency of disasters that characterise the region requires countries to respond in a concerted manner and reduce the fragmentation of resources [27].
Furthermore, the choice of specific indicators plays a crucial role in determining the outcome of the assessment. For example, the inclusion or exclusion of indicators such as population density, building density, etc., can significantly affect the results of a country’s risk index calculation. This is because different indicators reflect different aspects of vulnerability and exposure to disasters. The sensitivity of these indicators to extreme values also varies widely. Moreover, the weighting methods used (e.g., entropy weighting vs. hierarchical analysis) tend to assign different importance to these indicators based on their statistical distribution and interrelationships. As a result, even minor differences in indicator selection or data quality can lead to significant differences in overall risk assessment. This highlights the need for a more nuanced indicator selection process that adequately reflects local hazard dynamics and socio-economic conditions.

5.2. Recommendations

The results of the above natural disaster risk assessment show that most countries’ high-risk environments stem from deficiencies in disaster risk reduction capacities and disaster-conceiving environments. Notably, South Asian countries like Pakistan, India, and Bangladesh face higher risks from frequent cyclones, floods, and earthquakes, exacerbated by dense populations and weak infrastructure. In contrast, countries such as Singapore and Malaysia experience lower risks, benefiting from strong governance and advanced systems. To address these challenges, four prioritised recommendations are proposed:
(1) Develop a comprehensive disaster management plan: Through a multi-dimensional risk assessment model, the probability of occurrence, scope of impact, and socio-economic losses of natural disasters should be accurately quantified. Moreover, a risk assessment system including historical data, climate change, and vulnerability should be constructed. There is also a need to integrate disaster risk factors into urban planning and infrastructure development. This means mapping flood- and seismic-prone zones to restrict construction in vulnerable areas, like Bangladesh’s coastal regions. Low-risk countries, like Singapore, should refine risk models with real-time data. (2) Targeted disaster risk education curricula can be developed, and simulation drills and expert lectures can be used to enhance residents’ awareness and ability to prevent disasters. Communities can set up emergency response teams, conduct regular skill training, and ensure that household stockpiles can cope with different disaster risks. In addition, neighbourhood mutual aid networks can be constructed to strengthen community cohesion and risk resilience. Education should focus on low-cost solutions, such as training community leaders to use mobile apps for early warnings, as in India’s Assam flood alerts, and conducting mass evacuation drills in urban slums. In low-risk countries, efforts can emphasise advanced preparedness, like Singapore’s disaster education in schools. (3) Effective post-disaster recovery mechanisms should be established. Establishing rapid assessment teams with technical experts to evaluate infrastructure damage within 72 h of disasters. Priority should be given to keeping roads open to ensure that relief supplies and rescue teams can reach the disaster area in the shortest time. The government should also provide timely support, including temporary housing, employment assistance, and medical and psychological care. High-risk South Asian countries urgently need to retrofit critical infrastructure and pre-position supplies, such as flood shelters in Bangladesh. In low-risk countries, the focus could shift to rapid economic recovery, as in the case of Malaysia, where drones could be used for rapid damage assessment. (4) Promoting the application of science and technology in disaster risk reduction: Artificial intelligence, remote sensing and big data should be integrated to build a high-precision and real-time disaster warning system, which should be delivered to individuals. In disaster response, search and rescue drones or robots can significantly improve rescue efficiency and safety, while advancing disaster-resistant building materials and designs can enhance infrastructure resilience. The priority should lie in adopting cost-effective technologies in South Asian countries, such as satellite-based flood forecasting in India’s Brahmaputra basin. For low-risk countries, the goal is to push boundaries—Singapore, for example, can lead with AI-driven urban flood analytics.

6. Conclusions

In summary, this study evaluates the risk of natural hazards in 30 countries through a multi-hazard risk assessment framework. The conclusions obtained are presented below:
(1) This study constructed a natural disaster risk assessment framework with 65 indicators, based on the four dimensions of disaster-causing factors, disaster-conceiving environments, disaster-bearing bodies, and disaster risk reduction capacities. This framework innovatively enabled a large-scale regional assessment of multi-hazard types, including earthquakes, storms, droughts, and floods. (2) Regional risk hotspots are mapped through five assessment models and a combination assessment method. South Asia has the highest risk of seismic hazards, while Saudi Arabia has the lowest risk. Seismic hazard risk is low in most European countries, with moderate-risk areas mainly in Southeast Asia and East Africa. In terms of storm hazard risk, low-risk areas are located in the Persian Gulf and the Malay Peninsula, while high/higher-risk areas are located in Vietnam and the Philippines. Drought risk is most severe in the Middle East and East Africa, while it is lower in Brunei, Malaysia, and Indonesia. The low/lower-risk zones in the flood hazard are mainly located in the UAE and Europe, while the high/higher-risk zones are located along the Arabian Sea coast. The comprehensive risk evaluation shows that the low-risk areas are concentrated in the Persian Gulf, Malaysia, and Brunei, while South Asia is at higher risk. The indicator of capacity for disaster risk reduction is key in influencing the overall level of risk in the country. (3) Recommendations for disaster risk reduction were proposed based on the analysis above. The Maritime Silk Road nations face divergent disaster risks shaped by governance capacity and geographic exposure. High-risk South Asian countries require prioritised infrastructure retrofitting, community-based preparedness (e.g., mobile warning systems), and cost-effective technologies like satellite flood forecasting. Low-risk states like Singapore should advance AI-driven models and systemic resilience. Suitable solutions include integrating multi-hazard risk mapping into urban planning, employing rapid damage assessment teams, and fostering regional knowledge sharing.
However, our study still has some limitations: First, this study conducts disaster risk assessment on a national scale. However, due to the large scale, it is difficult to accurately reflect the specific situation of local disaster high-risk areas. Therefore, future research will adopt a rasterization method to carry out disaster risk assessment at a finer spatial scale illustrating the detailed local characteristics. Second, determining the weighting of different disaster types in comprehensive natural disaster risk assessment remains a methodological challenge. Further refinement is needed to ensure a more accurate and balanced evaluation. Finally, different countries have different geographical, climatic, and economic backgrounds, but studies have difficulties adequately taking into account the impact of these differences because data are not available. With the Open Science development [28], future research should conduct a more nuanced analysis based on the diverse background data of national conditions to improve the reliability of the assessment results.

Author Contributions

C.X.: Conceptualisation, writing of the original draft, and visualisation. J.W.: conceptualisation, formal analysis, methodology, writing, review, and editing, and funding acquisition. J.L.: Data collection, curation, and visualisation. H.W.: Assistance in data processing. All authors have read and agreed to the published version of the manuscript.

Funding

This work was supported by the National Key Research and Development Program of China [grant number 2023YFE0208000] and the Construction Project of the China Knowledge Centre for Engineering Sciences and Technology [grant number CKCEST-2023-1-5]. A special acknowledgement for support to China-Pakistan Joint Research Center on Earth Science, Chinese Academy of Sciences.

Institutional Review Board Statement

Not applicable.

Informed Consent Statement

Not applicable.

Data Availability Statement

Data will be made available upon request.

Conflicts of Interest

The authors declare that they have no competing financial interests or personal relationships that may have influenced the work reported in this study.

Appendix A

Table A1. Data sources for different disaster risk indicators.
Data SourceData NameDisaster Type
EM-DAT data
(https://www.emdat.be/)
Seismic frequencySeismic
Seismic intensity
CasualtiesSeismic\Storm
Economic lossesSeismic\Storm\Drought\Flood
Cumulative number of storm surgesStorm
Storm surge intensity
Drought frequencyDrought
Number of people affected
Frequency of floodsFlood
Human casualties
Land scan population data
(https://landscan.ornl.gov/)
Population densitySeismic\Storm\Drought\Flood
MS Buildings data
(https://gee-community-catalog.org/projects/msbuildings/)
Building densitySeismic
Wiki data
(https://www.wikidata.org/wiki/Wikidata:Main_Page)
Number of bridgesSeismic
Railway transport density
Coastline lengthStorm
Internet penetrationStorm
Road network densityFlood
Quick data
(https://www.kylc.com/stats)
Urban land area shareSeismic
Average annual population growth rate
GDP growth rate in the past five years
GDP per capitaDrought
Statistical bureaus data of various countriesPopulation shares over 65 years oldSeismic\Storm
Per capita disposable incomeSeismic
Number of monitoring and early warning stations
Proportion of income from tourismStorm
Unemployment rateDrought
Food yieldFlood
Proportion of land area protected
World Bank Open data
(https://data.worldbank.org/)
Urbanization rateSeismic
WHO data
(https://www.who.int/en/data)
Number of hospital beds per thousand peopleSeismic
Number of doctors per thousand people
Data from Global Change Research Data Publishing & Repository
(https://www.geodoi.ac.cn/weben/doi.aspx?Id=3753)
Proportion of built-up areaStorm
Data from Food and Agriculture Organization of the United Nations
(https://www.fao.org/faostat/en/#home)
Total marine productionStorm
Index Mundi database
(https://www.indexmundi.com/)
Proportion of population in coastal areasStorm
Proportion of land area below 5 m above sea level
Net national income per capita
R&D expenditure as a percentage of GDP
Universal health coverage index
Proportion of permanent arable landDrought
Proportion of arable land
Proportion of net agricultural output
Fertiliser consumption as a percentage
Forest area percentageFlood
Proportion of gross domestic savings
Rural electricity access
Number of patents
Environmental Performance Index
(https://epi.yale.edu/)
Health and drinking water indexStorm
Proportion of marine protected areas
Renewable freshwater resources per capitaDrought
WMO Catalogue for Climate Data
(https://climatedata-catalogue-wmo.org/)
Palmer Drought Severity IndexDrought
World Clim data
(https://worldclim.org/data/index.html)
Average annual precipitationDrought
Multi-year average rainfallFlood
Goddard Space Flight Center data
(https://www.nasa.gov/goddard/)
Soil surface moistureDrought\Flood
Hydro ATLAS v1.0 data
(https://www.hydrosheds.org/hydroatlas)
River network densityDrought
US Geological Survey data
(https://www.usgs.gov/products/data)
SlopeFlood
Mean elevation
Table A2. Weights of seismic hazard risk indicators under different assessment methods (%).
IndicatorsCRITICEWMIWMIMAHP
Seismic frequency6.803.286.114.284.78
Seismic intensity5.682.736.654.107.88
Casualties5.301.986.533.243.94
Economic losses4.401.395.952.573.40
Population density4.531.745.463.035.84
Building density5.282.086.433.448.04
Number of bridges5.682.625.734.083.16
Urban land area share4.951.645.502.947.56
Population shares over 65 years old5.252.175.613.583.68
Average annual population growth rate6.185.195.656.205.64
Urbanization rate6.593.685.545.256.08
Per capita disposable income7.4515.595.6010.704.84
Number of hospital beds per thousand people6.4110.255.909.086.64
Railway transport density7.208.456.287.759.68
Number of monitoring and early warning stations6.0925.135.7116.896.00
Number of doctors per thousand people5.969.065.498.357.24
GDP growth rate in the past five years6.253.045.854.515.60
Table A3. Weights of storm hazard risk indicators under different assessment methods (%).
IndicatorsCRITICEWMIWMIMAHP
Cumulative number of storm surges4.691.555.732.926.24
Casualties4.281.285.262.615.14
Economic losses5.071.905.383.344.44
Storm surge intensity5.562.936.464.2410.28
Population density4.571.425.342.644.73
Proportion of built-up area5.682.055.433.216.66
Total marine production6.9621.145.3815.263.37
Population shares over 65 years old5.731.775.313.123.37
Coastline length5.601.815.993.075.06
Proportion of income from tourism5.212.576.714.024.27
Proportion of population in coastal areas5.462.085.333.447.93
Proportion of land area below 5 m above sea level5.231.555.392.945.71
Net national income per capita5.8617.535.4112.524.85
R&D expenditure as a percentage of GDP5.6011.445.449.726.59
Health and drinking water index5.305.045.325.796.04
Internet penetration6.756.625.296.234.92
Universal health coverage index5.283.455.304.604.33
Proportion of marine protected areas7.1813.875.5210.356.07
Table A4. Weights of drought hazard risk indicators under different assessment methods (%).
IndicatorsCRITICEWMIWMIMAHP
Palmer Drought Severity Index6.684.567.506.029.85
Drought frequency4.330.946.942.615.98
Economic loss5.111.437.052.894.93
Number of people affected4.891.416.352.984.25
Average annual precipitation8.9613.645.9710.5010.28
Soil moisture8.7010.016.189.448.20
Renewable freshwater resources per capita8.5516.146.3911.786.53
Population density5.921.456.792.926.35
Proportion of permanent arable land8.152.986.414.495.30
Proportion of arable land5.462.046.773.655.98
Proportion of net agricultural output7.074.166.425.307.38
Fertilizer consumption as a percentage5.7411.376.8710.694.18
River network density7.1510.176.019.588.33
GDP per capita7.0816.566.6612.586.25
Unemployment rate6.223.147.694.596.25
Table A5. Weights of flood hazard risk indicators under different assessment methods (%).
IndicatorsCRITICEWMIWMIMAHP
Frequency of floods6.372.797.394.245.98
Multi-year average rainfall8.063.996.115.129.85
Human casualties6.002.756.744.224.93
Economic losses6.372.397.263.924.25
Slope7.826.426.166.827.33
Forest area percentage7.1212.796.099.907.33
Mean elevation7.2711.656.1610.095.18
Soil surface moisture8.325.896.286.205.18
Population density4.831.496.252.936.53
Road network density6.994.116.245.188.20
Food yield5.702.127.333.5410.28
Proportion of land area protected6.389.777.799.535.85
Rural electricity access6.061.526.732.919.23
Number of patents6.4726.616.9018.996.05
Proportion of gross domestic savings6.245.716.586.403.88
Table A6. Results of seismic hazard risk assessment.
CountryCRITICEWMIWMAHPIMFinal Score
Vietnam0.6360.3840.6680.6460.4940.562
Malaysia0.6250.4460.6520.6200.5170.569
Philippines0.5820.3920.6080.6050.4710.528
Indonesia0.5690.4430.5990.5890.4950.537
Singapore0.5710.4780.5750.5110.5100.528
Brunei0.7070.5080.7320.7090.5870.646
Cambodia0.6630.3510.7000.6720.4840.569
Thailand0.5910.3920.6140.5850.4750.529
Myanmar0.5760.3300.6080.5820.4350.502
Pakistan0.5630.3090.5960.5680.4170.487
Sri Lanka0.5310.3440.5380.5220.4290.470
India0.4940.3400.5140.5070.4070.450
Oman0.7140.5090.7420.7260.5860.652
Yemen0.6230.3530.6590.6480.4650.545
United Arab Emirates0.6820.4930.7140.6740.5660.623
Qatar0.6430.4960.6590.6060.5460.588
Iran (Islamic Republic of)0.5600.3530.6000.5850.4410.504
Saudi Arabia0.7460.6150.7710.7550.6620.708
Kuwait0.7120.5440.7360.7180.6060.660
Egypt0.6330.3830.6680.6410.4890.559
Kenya0.6230.3450.6540.6180.4620.536
Tanzania0.6090.3280.6420.6140.4440.523
Turkey0.5870.5280.6150.6140.5560.579
Greece0.6320.5670.6540.6490.5980.619
Italy0.5950.6240.6000.6310.6120.613
Lebanon0.6500.4660.6730.6570.5460.596
Bahrain0.5850.4470.5940.5430.4930.531
Iraq0.6080.3580.6450.6080.4590.532
Bangladesh0.5600.2960.5880.5400.4080.475
China0.6200.5420.6300.6500.6150.610
Table A7. Results of storm hazard risk assessment.
CountryCRITICEWMIWMAHPIMFinal Score
Vietnam0.4930.3460.5050.4960.4020.446
Malaysia0.7060.5040.7260.7180.5810.644
Philippines0.4550.2630.4680.4650.3350.394
Indonesia0.5490.3460.5760.5970.4250.495
Singapore0.6590.5490.6860.6960.6020.636
Brunei0.7350.4560.7710.7730.5690.656
Cambodia0.5930.3480.6270.6260.4430.523
Thailand0.6690.4790.6910.6990.5550.615
Myanmar0.4930.2850.5190.4910.3640.427
Pakistan0.4700.2290.5000.4940.3200.398
Sri Lanka0.5270.2610.5620.5720.3670.453
India0.4360.2800.4460.4560.3370.388
Oman0.6330.3680.6580.6410.4700.550
Yemen0.5460.2330.5840.6090.3550.460
United Arab Emirates0.7890.6640.7960.8110.7060.751
Qatar0.7060.5510.7300.7170.6090.660
Iran (Islamic Republic of)0.6510.3800.6800.6630.4890.568
Saudi Arabia0.7230.4610.7500.7560.5620.646
Kuwait0.6670.4480.6900.6940.5310.602
Egypt0.6590.4510.6780.6770.5280.595
Kenya0.5620.2690.5950.6200.3830.481
Tanzania0.5660.2920.5990.5980.3950.486
Turkey0.6550.4130.6830.7040.5110.589
Greece0.6430.5020.6610.7110.5600.613
Italy0.6370.5670.6460.6720.5940.622
Lebanon0.5400.2860.5640.5830.3860.467
Bahrain0.5150.3430.5360.5180.4100.462
Iraq0.6220.3360.6590.6550.4490.539
Bangladesh0.4910.4870.4860.4670.4770.482
China0.6550.5280.6480.6450.5810.610
Table A8. Results of drought hazard risk assessment.
CountryCRITICEWMIWMAHPIMFinal Score
Vietnam0.5380.4470.5770.5620.4820.519
Malaysia0.7070.7080.7450.7410.7100.722
Philippines0.5960.5120.6260.6330.5380.579
Indonesia0.6210.5390.6460.6450.5610.601
Singapore0.6430.5350.6710.6620.5710.614
Brunei0.7970.7210.8120.8170.7370.775
Cambodia0.5950.4490.6250.6050.4940.551
Thailand0.5400.4310.5700.5590.4670.511
Myanmar0.6150.5010.6380.6150.5290.578
Pakistan0.4530.2640.4980.4580.3400.400
Sri Lanka0.5280.4060.5640.5560.4510.499
India0.4130.3110.4270.4310.3500.385
Oman0.6180.4060.6710.6110.4930.557
Yemen0.4790.2370.5220.4820.3310.406
United Arab Emirates0.6440.4820.6930.6260.5520.597
Qatar0.6470.4830.6940.6290.5500.598
Iran (Islamic Republic of)0.4090.2620.4280.4070.3140.362
Saudi Arabia0.5840.3740.6300.5760.4560.521
Kuwait0.6400.4630.6940.6250.5430.591
Egypt0.5690.3530.6200.5680.4470.508
Kenya0.4070.2080.4510.3980.2810.346
Tanzania0.4490.2610.4970.4480.3280.394
Turkey0.5590.4200.5890.5570.4680.517
Greece0.5080.3970.5480.5190.4350.480
Italy0.5400.4740.5700.5410.4930.522
Lebanon0.4620.2980.5140.4720.3650.420
Bahrain0.5810.4330.6350.5650.5040.542
Iraq0.4640.2700.4940.4500.3410.401
Bangladesh0.4920.4100.5070.5160.4390.471
China0.4970.4060.5000.4850.4380.464
Table A9. Results of flood hazard risk assessment.
CountryCRITICEWMIWMAHPIMFinal Score
Vietnam0.5610.3950.5670.5730.4460.506
Malaysia0.6040.4540.6230.6210.5010.558
Philippines0.5090.3390.5270.5350.3960.458
Indonesia0.5700.4110.5770.5830.4620.518
Singapore0.5990.5600.6160.5850.5680.585
Brunei0.7190.5460.7520.7200.6110.667
Cambodia0.6470.4720.6600.6670.5350.593
Thailand0.5550.3950.5660.5940.4480.509
Myanmar0.5940.4050.6020.6020.4680.531
Pakistan0.5070.3430.5010.5690.3970.460
Sri Lanka0.6000.4300.6190.6170.4900.548
India0.4810.3640.4730.5190.3960.444
Oman0.5820.3290.5890.6050.4190.501
Yemen0.5400.3200.5460.5920.3960.475
United Arab Emirates0.6000.3690.6130.6160.4570.527
Qatar0.6230.3770.6430.6510.4710.549
Iran (Islamic Republic of)0.6590.5530.6640.6980.5870.630
Saudi Arabia0.6190.4100.6310.6670.4860.559
Kuwait0.5960.3460.6090.6260.4390.519
Egypt0.5540.3180.5710.6140.4030.488
Kenya0.6080.3910.6120.6330.4660.538
Tanzania0.7050.5630.7090.6940.6160.655
Turkey0.6350.5390.6520.6750.5680.612
Greece0.6380.4730.6590.6690.5310.591
Italy0.5850.5600.5970.6220.5620.584
Lebanon0.5100.3370.5210.5480.3900.458
Bahrain0.5260.2890.5430.5500.3740.452
Iraq0.6450.3770.6550.6910.4720.563
Bangladesh0.4580.2900.4490.4850.3400.401
China0.5670.5750.5690.6320.5610.580
Table A10. Results of natural disaster risk assessment.
CountryCRITICEWMIWMAHPIMFinal Score
Vietnam0.5570.3930.5790.5690.4560.508
Malaysia0.6610.5280.6860.6750.5770.623
Philippines0.5350.3760.5570.5600.4350.490
Indonesia0.5770.4350.6000.6040.4860.538
Singapore0.6180.5300.6370.6130.5630.591
Brunei0.7400.5580.7670.7550.6260.686
Cambodia0.6250.4050.6530.6420.4890.559
Thailand0.5890.4240.6100.6090.4860.541
Myanmar0.5690.3800.5920.5730.4490.510
Pakistan0.4980.2860.5240.5220.3690.436
Sri Lanka0.5460.3600.5710.5670.4340.493
India0.4560.3240.4650.4780.3730.417
Oman0.6370.4030.6650.6460.4920.565
Yemen0.5470.2860.5780.5830.3870.472
United Arab Emirates0.6790.5020.7040.6820.5700.625
Qatar0.6550.4770.6820.6510.5440.599
Iran (Islamic Republic of)0.5700.3870.5930.5880.4580.516
Saudi Arabia0.6680.4650.6960.6890.5420.609
Kuwait0.6540.4500.6820.6660.5300.593
Egypt0.6040.3760.6340.6250.4670.538
Kenya0.5500.3030.5780.5670.3980.475
Tanzania0.5820.3610.6120.5890.4460.515
Turkey0.6090.4750.6350.6370.5260.574
Greece0.6050.4850.6310.6370.5310.576
Italy0.5890.5560.6030.6160.5650.585
Lebanon0.5400.3470.5680.5650.4220.485
Bahrain0.5520.3780.5770.5440.4450.497
Iraq0.5850.3350.6130.6010.4300.509
Bangladesh0.5000.3700.5080.5020.4160.457
China0.5850.5120.5870.6030.5470.566

References

  1. Smith, K.; Smith, K. Environmental Hazards: Assessing Risk and Reducing Disaster, 6th ed.; Routledge: London, UK, 2013. [Google Scholar] [CrossRef]
  2. Cutter, S.L.; Boruff, B.J.; Shirley, W.L. Social Vulnerability to Environmental Hazards*. Soc. Sci. Q. 2003, 84, 242–261. [Google Scholar] [CrossRef]
  3. Blaikie, P.; Cannon, T.; Davis, I.; Wisner, B. At Risk-Natural Hazards, People’s Vulnerability and Disasters, 2nd ed.; Routledge: London, UK, 2004. [Google Scholar] [CrossRef]
  4. Adger, W.N. Vulnerability. Glob. Environ. Change 2006, 16, 268–281. [Google Scholar] [CrossRef]
  5. Aguirre, B.E. Review of Disasters: A Sociological Approach by Kathleen TierneyPolity Press, Cambridge, UK; 2018; ISBN 9780745671024; 311 Pp.; $26.95. Nat. Hazards Rev. 2020, 21, 07519001. [Google Scholar] [CrossRef]
  6. Rygel, L.; O’Sullivan, D.; Yarnal, B. A Method for Constructing a Social Vulnerability Index: An Application to Hurricane Storm Surges in a Developed Country. Mitig. Adapt. Strat. Glob. Change 2006, 11, 741–764. [Google Scholar] [CrossRef]
  7. Peduzzi, P.; Dao, H.; Herold, C.; Mouton, F. Assessing Global Exposure and Vulnerability towards Natural Hazards: The Disaster Risk Index. Nat. Hazards Earth Syst. Sci. 2009, 9, 1149–1159. [Google Scholar] [CrossRef]
  8. Sheffield, J.; Wood, E.F. Global Trends and Variability in Soil Moisture and Drought Characteristics, 1950–2000, from Observation-Driven Simulations of the Terrestrial Hydrologic Cycle. J. Clim. 2008, 21, 432–458. [Google Scholar] [CrossRef]
  9. Vicente-Serrano, S.M.; Beguería, S.; López-Moreno, J.I. A Multiscalar Drought Index Sensitive to Global Warming: The Standardized Precipitation Evapotranspiration Index. J. Clim. 2010, 23, 1696–1718. [Google Scholar] [CrossRef]
  10. Yang, X.; Qin, X.; Zhou, X.; Chen, Y.; Gao, L. Assessment of Disaster Mitigation Capability Oriented to Typhoon Disaster Chains: A Case Study of Fujian Province, China. Ecol. Indic. 2024, 167, 112621. [Google Scholar] [CrossRef]
  11. Diakoulaki, D.; Papayannakis, L. Determining Objective Weights In Multiple Criteria Problems: The Critic Method. Comput. Ops. Res. 1995, 22, 763–770. [Google Scholar] [CrossRef]
  12. Huling, J.D.; Greifer, N.; Chen, G. Independence Weights for Causal Inference with Continuous Treatments. J. Am. Stat. Assoc. 2024, 119, 1657–1670. [Google Scholar] [CrossRef]
  13. Fagbohun, B.J.; Aladejana, O.O.; Okonye, I.F.; Tobore, A.O. Assessing Gully Erosion Susceptibility Dynamics Using Information Value and Hazard Index Methods: A Case Study of Agulu-Nanka Watershed, Southeast Nigeria. CATENA 2024, 241, 108070. [Google Scholar] [CrossRef]
  14. Cheng, W.; Xi, H.; Sindikubwabo, C.; Si, J.; Zhao, C.; Yu, T.; Li, A.; Wu, T. Ecosystem Health Assessment of Desert Nature Reserve with Entropy Weight and Fuzzy Mathematics Methods: A Case Study of Badain Jaran Desert. Ecol. Indic. 2020, 119, 106843. [Google Scholar] [CrossRef]
  15. Schmoldt, D.L.; Kangas, J.; Mendoza, G.A.; Pesonen, M. (Eds.) The Analytic Hierarchy Process in Natural Resource and Environmental Decision Making. Managing Forest Ecosystems; Springer: Dordrecht, The Netherlands, 2001; Volume 3, ISBN 978-90-481-5735-8. [Google Scholar]
  16. Wang, G.; Tian, X.; Li, Y.; Xu, T.; Wan, B.; Chen, Y.; Nie, S.; Yang, X.; Zuo, S.; Zhang, J. Indian Plate Blocked by the Thickened Eurasian Crust in the Middle of the Continental Collision Zone of Southern Tibet. Earthq. Res. Adv. 2023, 3, 100233. [Google Scholar] [CrossRef]
  17. Hui, G.; Li, S.; Wang, P.; Suo, Y.; Somerville, I.D. Implications of Earthquakes for the Slab Subduction Dynamic Process in Southeast Asia. J. Asian Earth Sci. 2020, 194, 103955. [Google Scholar] [CrossRef]
  18. Jian, W.; Lo, E.Y.-M.; Stojanovski, P.; Pan, T.-C. Quantifying Uncertainties in Tropical Cyclone Wind Hazard Assessment Due to Synthetic Track Stochastic Variability for Southeast Asia. Weather Clim. Extrem. 2023, 41, 100599. [Google Scholar] [CrossRef]
  19. Al-Ruzouq, R.; Shanableh, A.; Jena, R.; Gibril, M.B.A.; Hammouri, N.A.; Lamghari, F. Flood Susceptibility Mapping Using a Novel Integration of Multi-Temporal Sentinel-1 Data and eXtreme Deep Learning Model. Geosci. Front. 2024, 15, 101780. [Google Scholar] [CrossRef]
  20. Abdul Talib, S.A.; Idris, W.M.R.; Neng, L.J.; Lihan, T.; Abdul Rasid, M.Z. Irregularity and Time Series Trend Analysis of Rainfall in Johor, Malaysia. Heliyon 2024, 10, e30324. [Google Scholar] [CrossRef]
  21. Hameed, M.; Ahmadalipour, A.; Moradkhani, H. Drought and Food Security in the Middle East: An Analytical Framework. Agric. For. Meteorol. 2020, 281, 107816. [Google Scholar] [CrossRef]
  22. Hasan, M.H.; Ahmed, A.; Nafee, K.M.; Hossen, M.A. Use of Machine Learning Algorithms to Assess Flood Susceptibility in the Coastal Area of Bangladesh. Ocean. Coast. Manag. 2023, 236, 106503. [Google Scholar] [CrossRef]
  23. Brammer, H. Bangladesh’s Dynamic Coastal Regions and Sea-Level Rise. Clim. Risk Manag. 2014, 1, 51–62. [Google Scholar] [CrossRef]
  24. Devi, S. Pakistan Floods: Impact on Food Security and Health Systems. Lancet 2022, 400, 799–800. [Google Scholar] [CrossRef] [PubMed]
  25. Intergovernmental Panel On Climate Change (IPCC) Climate Change 2021—The Physical Science Basis: Working Group I Contribution to the Sixth Assessment Report of the Intergovernmental Panel on Climate Change, 1st ed.; Cambridge University Press: Cambridge, UK, 2023; ISBN 978-1-00-915789-6.
  26. Reduction, U.N.O. for D.R. Global Assessment Report on Disaster Risk Reduction 2022: Our World at Risk: Transforming Governance for a Resilient Future; Global Assessment Report on Disaster Risk Reduction (GAR) Series, 1st ed.; United Nations Publications: New York, NY, USA, 2022; ISBN 978-92-1-232028-1.
  27. Van Der Keur, P.; Van Bers, C.; Henriksen, H.J.; Nibanupudi, H.K.; Yadav, S.; Wijaya, R.; Subiyono, A.; Mukerjee, N.; Hausmann, H.-J.; Hare, M.; et al. Identification and Analysis of Uncertainty in Disaster Risk Reduction and Climate Change Adaptation in South and Southeast Asia. Int. J. Disaster Risk Reduct. 2016, 16, 208–214. [Google Scholar] [CrossRef]
  28. UNESCO. UNESCO Recommendation on Open Science; UNESCO: Paris, France, 2021. [Google Scholar] [CrossRef]
Figure 1. Study area.
Sustainability 17 03219 g001
Figure 2. Technology roadmap.
Sustainability 17 03219 g002
Figure 3. Results of seismic hazard risk assessment: (a) CRITIC; (b) EWM; (c) IWM; (d) AHP; (e) IM; and (f) CAMBMD.
Sustainability 17 03219 g003
Figure 4. Results of storm risk assessment: (a) CRITIC; (b) EWM; (c) IWM; (d) AHP; (e) IM; and (f) CAMBMD.
Sustainability 17 03219 g004
Figure 5. Results of drought risk assessment: (a) CRITIC; (b) EWM; (c) IWM; (d) AHP; (e) IM; and (f) CAMBMD.
Sustainability 17 03219 g005
Figure 6. Results of flood risk assessment: (a) CRITIC; (b) EWM; (c) IWM; (d) AHP; (e) IM; and (f) CAMBMD.
Sustainability 17 03219 g006
Figure 7. Results of comprehensive risk assessment for four types of natural hazards: (a) CRITIC; (b) EWM; (c) IWM; (d) AHP; (e) IM; and (f) CAMBMD.
Sustainability 17 03219 g007
Table 1. Risk assessment indicators for 4 natural disasters.
Primary IndicatorSecondary IndicatorTertiary IndicatorNature
Seismic disaster riskDanger of disaster-causing factorsSeismic frequency-
Seismic intensity-
Casualties-
Economic losses-
Vulnerability of disaster-bearing bodiesPopulation density-
Building density-
Number of bridges-
Urban land area share-
Population shares over 65 years old-
Average annual population growth rate-
Urbanisation rate-
Disaster risk reduction capacitiesPer capita disposable income+
Number of hospital beds per thousand people+
Railway transport density+
Number of monitoring and early warning stations+
Number of doctors per thousand people+
GDP growth rate in the past five years+
Storm disaster riskDanger of disaster-causing factorsCumulative number of storm surges-
Casualties-
Economic losses-
Storm surge intensity-
Vulnerability of disaster-bearing bodiesPopulation density-
Proportion of built-up area-
Total marine production
Population shares over 65 years old-
Coastline length-
Proportion of income from tourism-
Proportion of population in coastal areas-
Proportion of land area below 5 metres above sea level-
Disaster risk reduction capacitiesNet national income per capita+
R&D expenditure as a percentage of GDP+
Health and drinking water index+
Internet penetration+
Universal health coverage index+
Proportion of marine protected areas+
Drought disaster riskDanger of disaster-causing factorsPalmer Drought Severity Index+
Drought frequency-
Economic loss-
Number of people affected-
Sensitivity of disaster-conceiving environmentsAverage annual precipitation+
Soil moisture+
Renewable freshwater resources per capita+
Vulnerability of disaster-bearing bodiesPopulation density-
Proportion of permanent arable land-
Proportion of arable land-
Proportion of net agricultural output-
Disaster risk reduction capacitiesFertiliser consumption as a percentage+
River network density+
GDP per capita+
Unemployment rate-
Flood disaster riskDanger of disaster-causing factorsFrequency of floods-
Multi-year average rainfall-
Human casualties-
Economic losses-
Sensitivity of disaster-conceiving environmentsSlope-
Forest area percentage+
Mean elevation+
Soil surface moisture-
Vulnerability of disaster-bearing bodiesPopulation density-
Road network density-
Food yield-
Disaster risk reduction capacitiesProportion of land area protected+
Proportion of gross domestic savings+
Rural electricity access+
Number of patents+
Table 2. Combined weights of five assessment methods.
MethodologyCRITICEWMIWMIMAHP
Weight0.1910.2040.1990.1880.218
Disclaimer/Publisher’s Note: The statements, opinions and data contained in all publications are solely those of the individual author(s) and contributor(s) and not of MDPI and/or the editor(s). MDPI and/or the editor(s) disclaim responsibility for any injury to people or property resulting from any ideas, methods, instructions or products referred to in the content.

