Article

How Do Core Management Team Network Ties Affect Green Innovation? Evidence from the Chinese ICT Industry

by
Youxuan Wang
and
Zhuohang Li
*
Faculty of Business, City University of Macau, Macau 999078, China
*
Author to whom correspondence should be addressed.
Sustainability 2025, 17(7), 3217; https://doi.org/10.3390/su17073217
Submission received: 6 March 2025 / Revised: 20 March 2025 / Accepted: 2 April 2025 / Published: 4 April 2025
(This article belongs to the Section Economic and Business Aspects of Sustainability)

Abstract

In the context of green sustainable development, improving the quality of green innovation (GI) has become an urgent issue for enterprises. Corporate social networks play a vital role in improving the quality of GI, but there is a lack of research on how the social networks established by management team members influence GI, the pathways of their relationships, and their moderating effects. This study uses data from Chinese ICT industry listed companies between 2012 and 2022, employing social network analysis to construct the social network connections of core management team members. Mechanism analysis indicates that degree centrality and structural holes have positive effects on GI, while network density has a negative effect. R&D expenditure and personnel investment mediate the relationship between structural holes/network density and GI. Environmental information disclosure (EID) strengthens the relationship between structural holes/network density and GI. This research integrates the mediating effect and moderating effect models to elucidate the logical relationship among corporate social networks, R&D investment, EID, and GI, which has practical significance for further optimizing government environmental governance mechanisms, adjusting corporate social network structures, and enhancing innovation capabilities.

1. Introduction

In 2021, China’s carbon emissions accounted for about 33% of the global total, ranking first. China has also set the goal of reaching peak carbon dioxide emissions by 2030 and achieving carbon neutrality by 2060 [1]. The concept of green development, incorporated into the guiding principles for economic and social development during the “13th Five-Year Plan” and “14th Five-Year Plan” periods, has made “green” and “innovation” important starting points for the modernization and optimization of China’s economic system in the new era [2]. Green innovation (GI) helps to coordinate the simultaneous development of the ecological environment and economic growth, and has a significant impact in terms of alleviating environmental issues [3]. In addition to the environmental benefits of GI, it can help enterprises improve competitiveness [4] and enhance environmental performance [5] and financial performance [6], thereby strengthening their green competitive advantages amidst fierce market competition [7,8]. An increasing number of companies are beginning to prioritize the strategic management of green innovation to achieve sustainable development [9]. Moreover, corporate GI is also profoundly influenced by the external environment and stakeholder expectations [10,11,12]. In the context of increasing global attention being paid to sustainable development and environmental protection, businesses must effectively disclose their environmental performance to meet societal and market demands for environmental information. The Ministry of Ecology and Environment of China issued the “Reform Plan for the Environmental Information Disclosure System” in 2021, proposing the requirement to “legally promote the mandatory disclosure of environmental information by enterprises” [13]. Subsequently, in 2022, the “Measures for the Administration of Enterprise Environmental Information Disclosure” came into effect [14]. Through environmental information disclosure (EID), companies can not only demonstrate their efforts and sense of social responsibility in environmental protection and sustainable development but also effectively communicate their GI strategies and achievements. This disclosure behavior enhances corporate reputation and fosters trust with partners, thereby having a profound impact on GI.
In the modern economic and social context, the GI models of enterprises are gradually evolving towards complexity and refinement. Particularly in the case of technology-driven GI, which involves various processes such as the acquisition of GI resources, knowledge transformation, and knowledge spillovers, the innovation risks are continuously increasing. Relying solely on independent innovation within the enterprise is becoming increasingly challenging. Therefore, enterprises need to integrate multiple resources, including enterprise networks, into their research and development activities. According to social network theory, businesses are embedded within social networks, which facilitate the development and promotion of diverse and abundant knowledge flows [15]. These networks enable firms to acquire valuable incremental information from the external environment, enabling the sharing and absorption of external knowledge. By breaking organizational boundaries and leveraging inter-firm relationships to build resource information exchange networks, enterprises can continuously access the heterogeneous resources needed for GI, efficiently reconstruct and allocate resources and information, and enhance their GI performances [16]. Currently, most research on the antecedents of GI focuses on absorptive capacity [17,18], managerial backgrounds [19,20,21,22], and stakeholder concerns [23,24] from a resource-based perspective; emphasizes environmental regulations [25,26,27] and green credit policies [28,29,30] on the basis of institutional theory; and discusses government subsidies [31,32,33], as well as digitalization levels, from the perspective of innovation diffusion theory [34,35,36].
Although the existing literature on the relationship between corporate social networks and GI has made certain progress, most studies have only explored the impact of a single social network metric, such as “centrality”, on GI [3,37,38]. Few studies have simultaneously examined multiple metrics of social networks, such as centrality, structural holes, and network density, from a multidimensional perspective to explore their combined impact on corporate green innovation. Additionally, the existing literature often explores the relationship between GI and social networks from perspectives such as director networks [3,38,39], shareholder networks [16], and CEO networks [40,41,42], with limited studies investigating the impact of the overall top management team’s (directors, supervisors, executives) social relationships on GI. Furthermore, although recent literature has examined the impact of EID on GI [43,44,45,46] and the impact of R&D investment on GI [47,48,49], the separate roles of EID and R&D investment in the relationship between social networks and GI have not been examined. Current research lacks clarity on the pathways connecting corporate social networks to GI, with limited attention paid to both mediating mechanisms and moderating factors influencing this relationship.
To fill the current research gap, this study draws on network embedding theory and resource dependency theory. It constructs a theoretical analysis framework of “enterprise social network embedding—resource acquisition—quality of GI” and focuses on Chinese information and communication technology (ICT) companies listed on the Shanghai and Shenzhen stock exchanges from 2012 to 2022. By collecting information on executive team members’ concurrent appointments in other companies, the study builds social network relationships among companies. It subdivides enterprise social networks into three measures—centrality, structural holes, and network density—to explore the fundamental question of the impact of corporate social networks on GI, as well as the mediating roles of R&D expenditure investment and R&D personnel investment and the moderating role of EID quality. This research expands the boundaries of both the GI and social network domains and reveals the mechanisms and paths of enterprises in promoting GI, enabling a deeper understanding of how internal resource allocation and knowledge flow influence GI. This helps companies better utilize their R&D resources, providing more effective innovation strategies. It also provides valuable theoretical support and empirical evidence for companies to promote GI by enhancing transparency and information disclosure. This assists companies in taking appropriate measures to effectively enhance the quality of GI and provides policy recommendations for government agencies.
The paper is organized into six sections: Section 1 introduces the research background and contributions; Section 2 develops theoretical frameworks and hypotheses; Section 3 outlines methodology and data sources; Section 4 analyzes empirical findings; Section 5 discusses conclusions and practical implications; and Section 6 addresses study limitations and suggests future research directions.

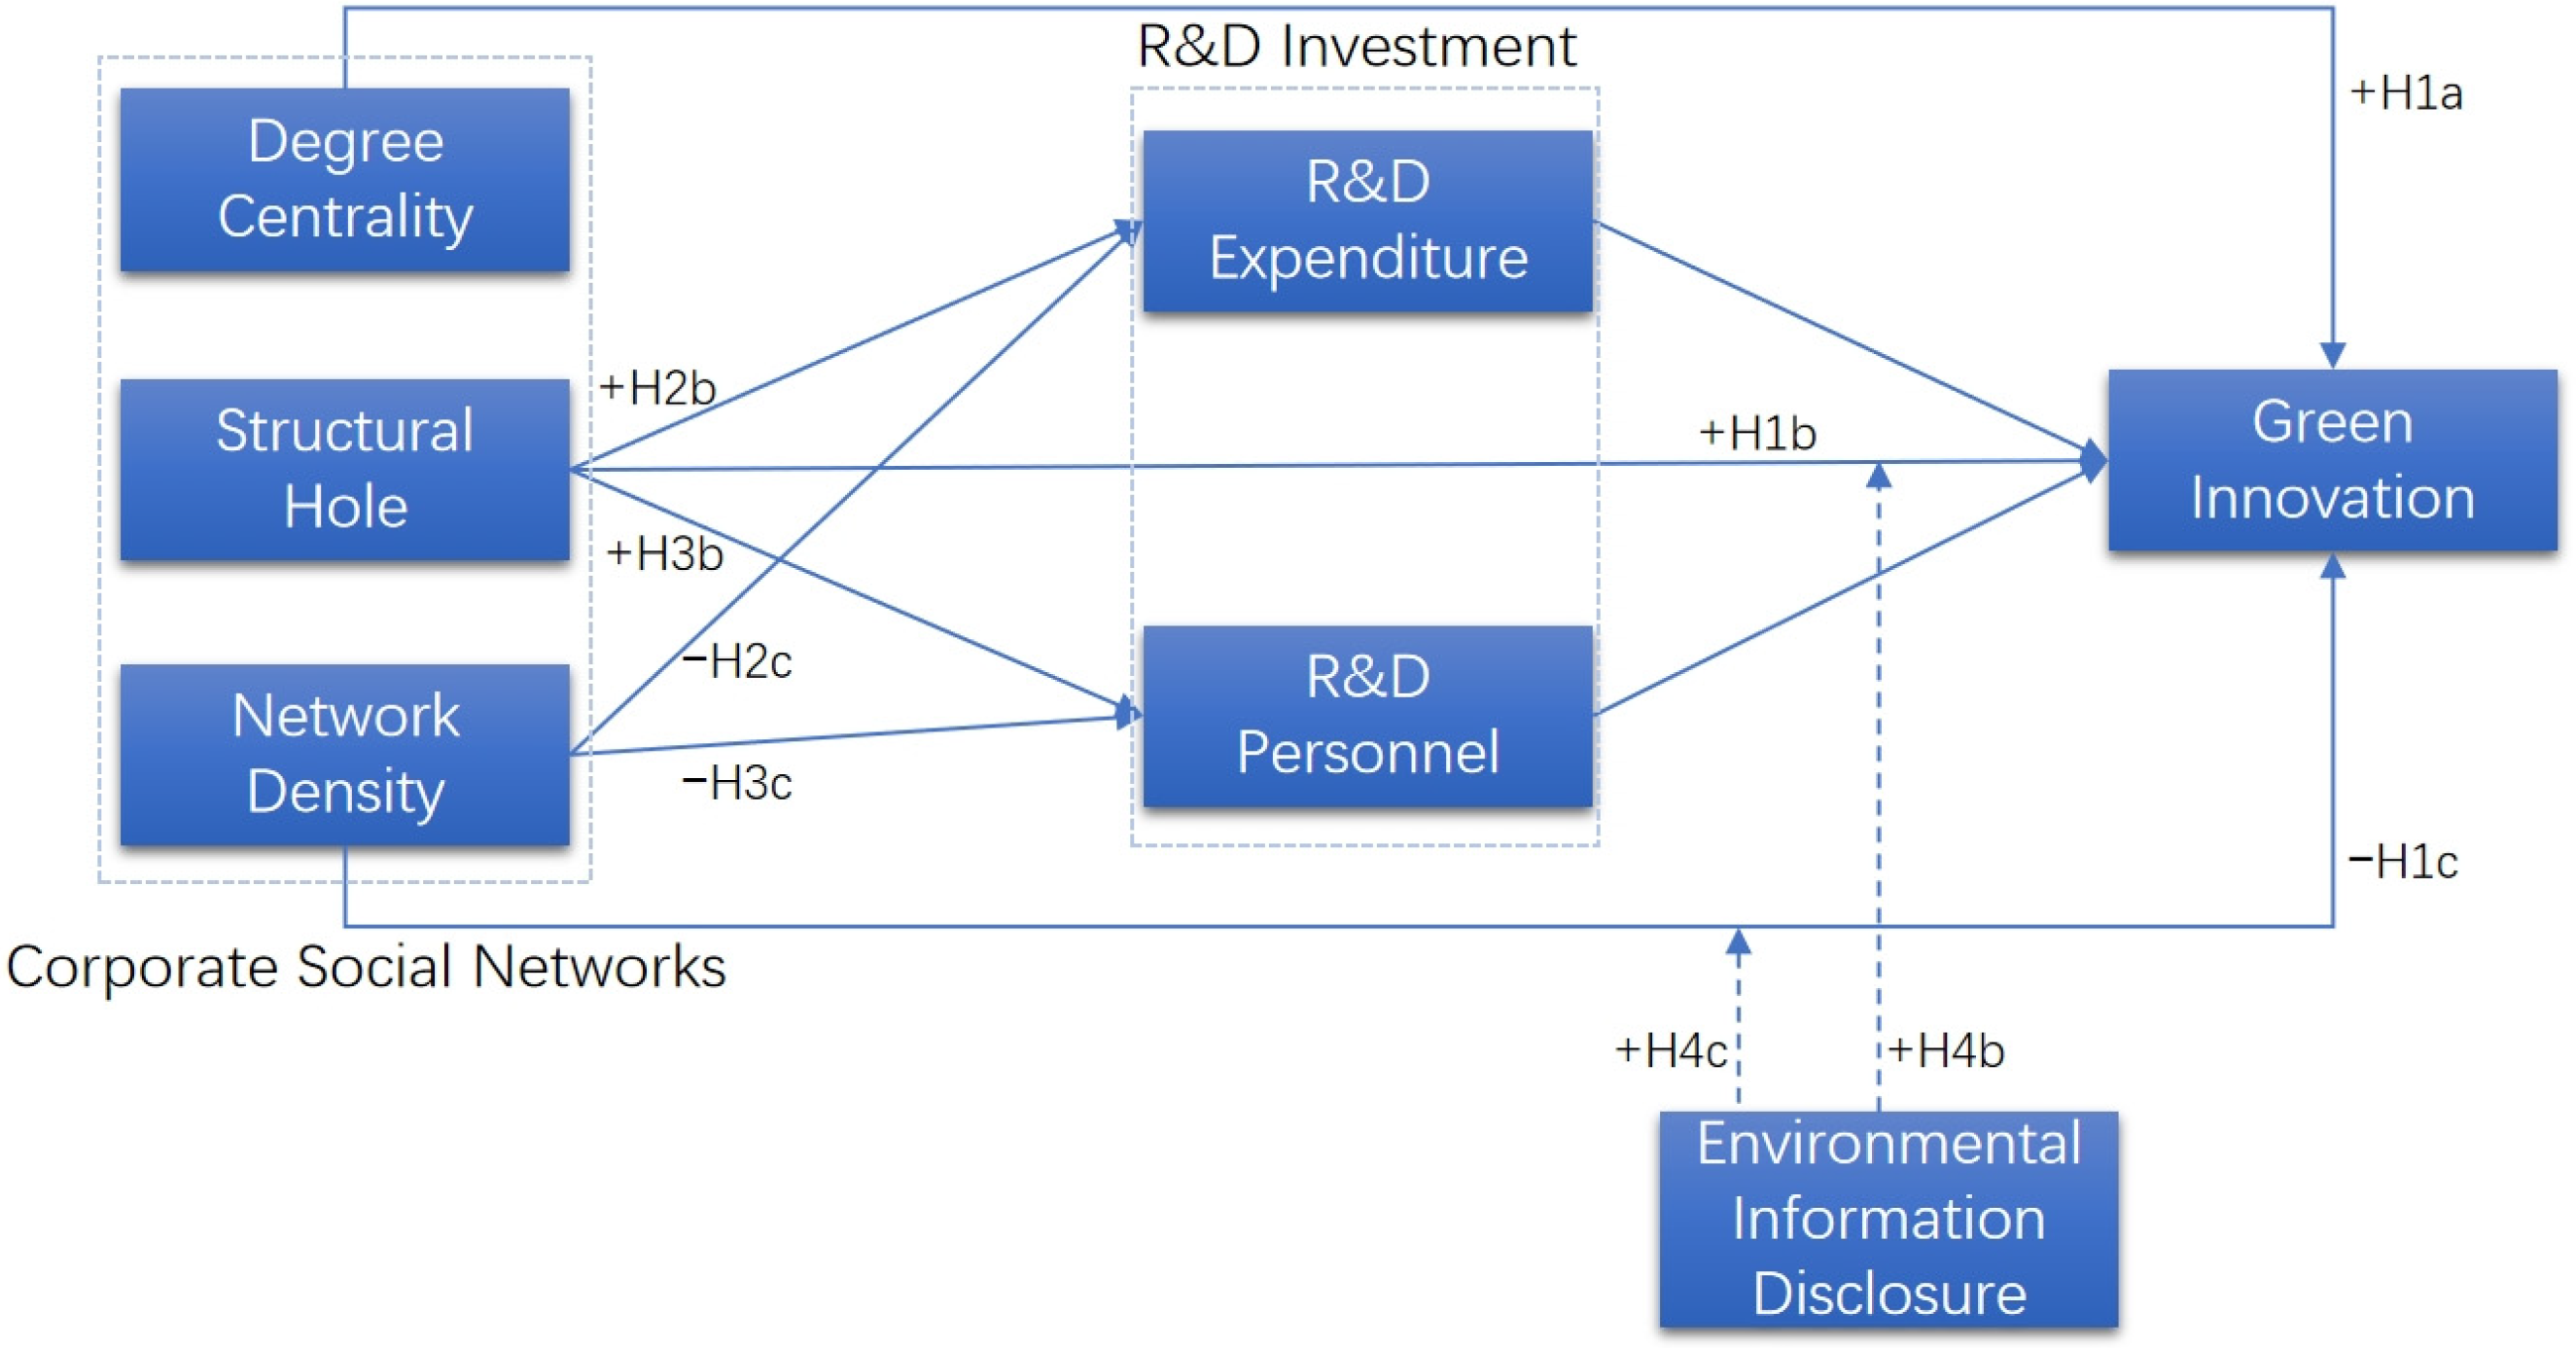
2. Theoretical Analysis and Hypothesis Development

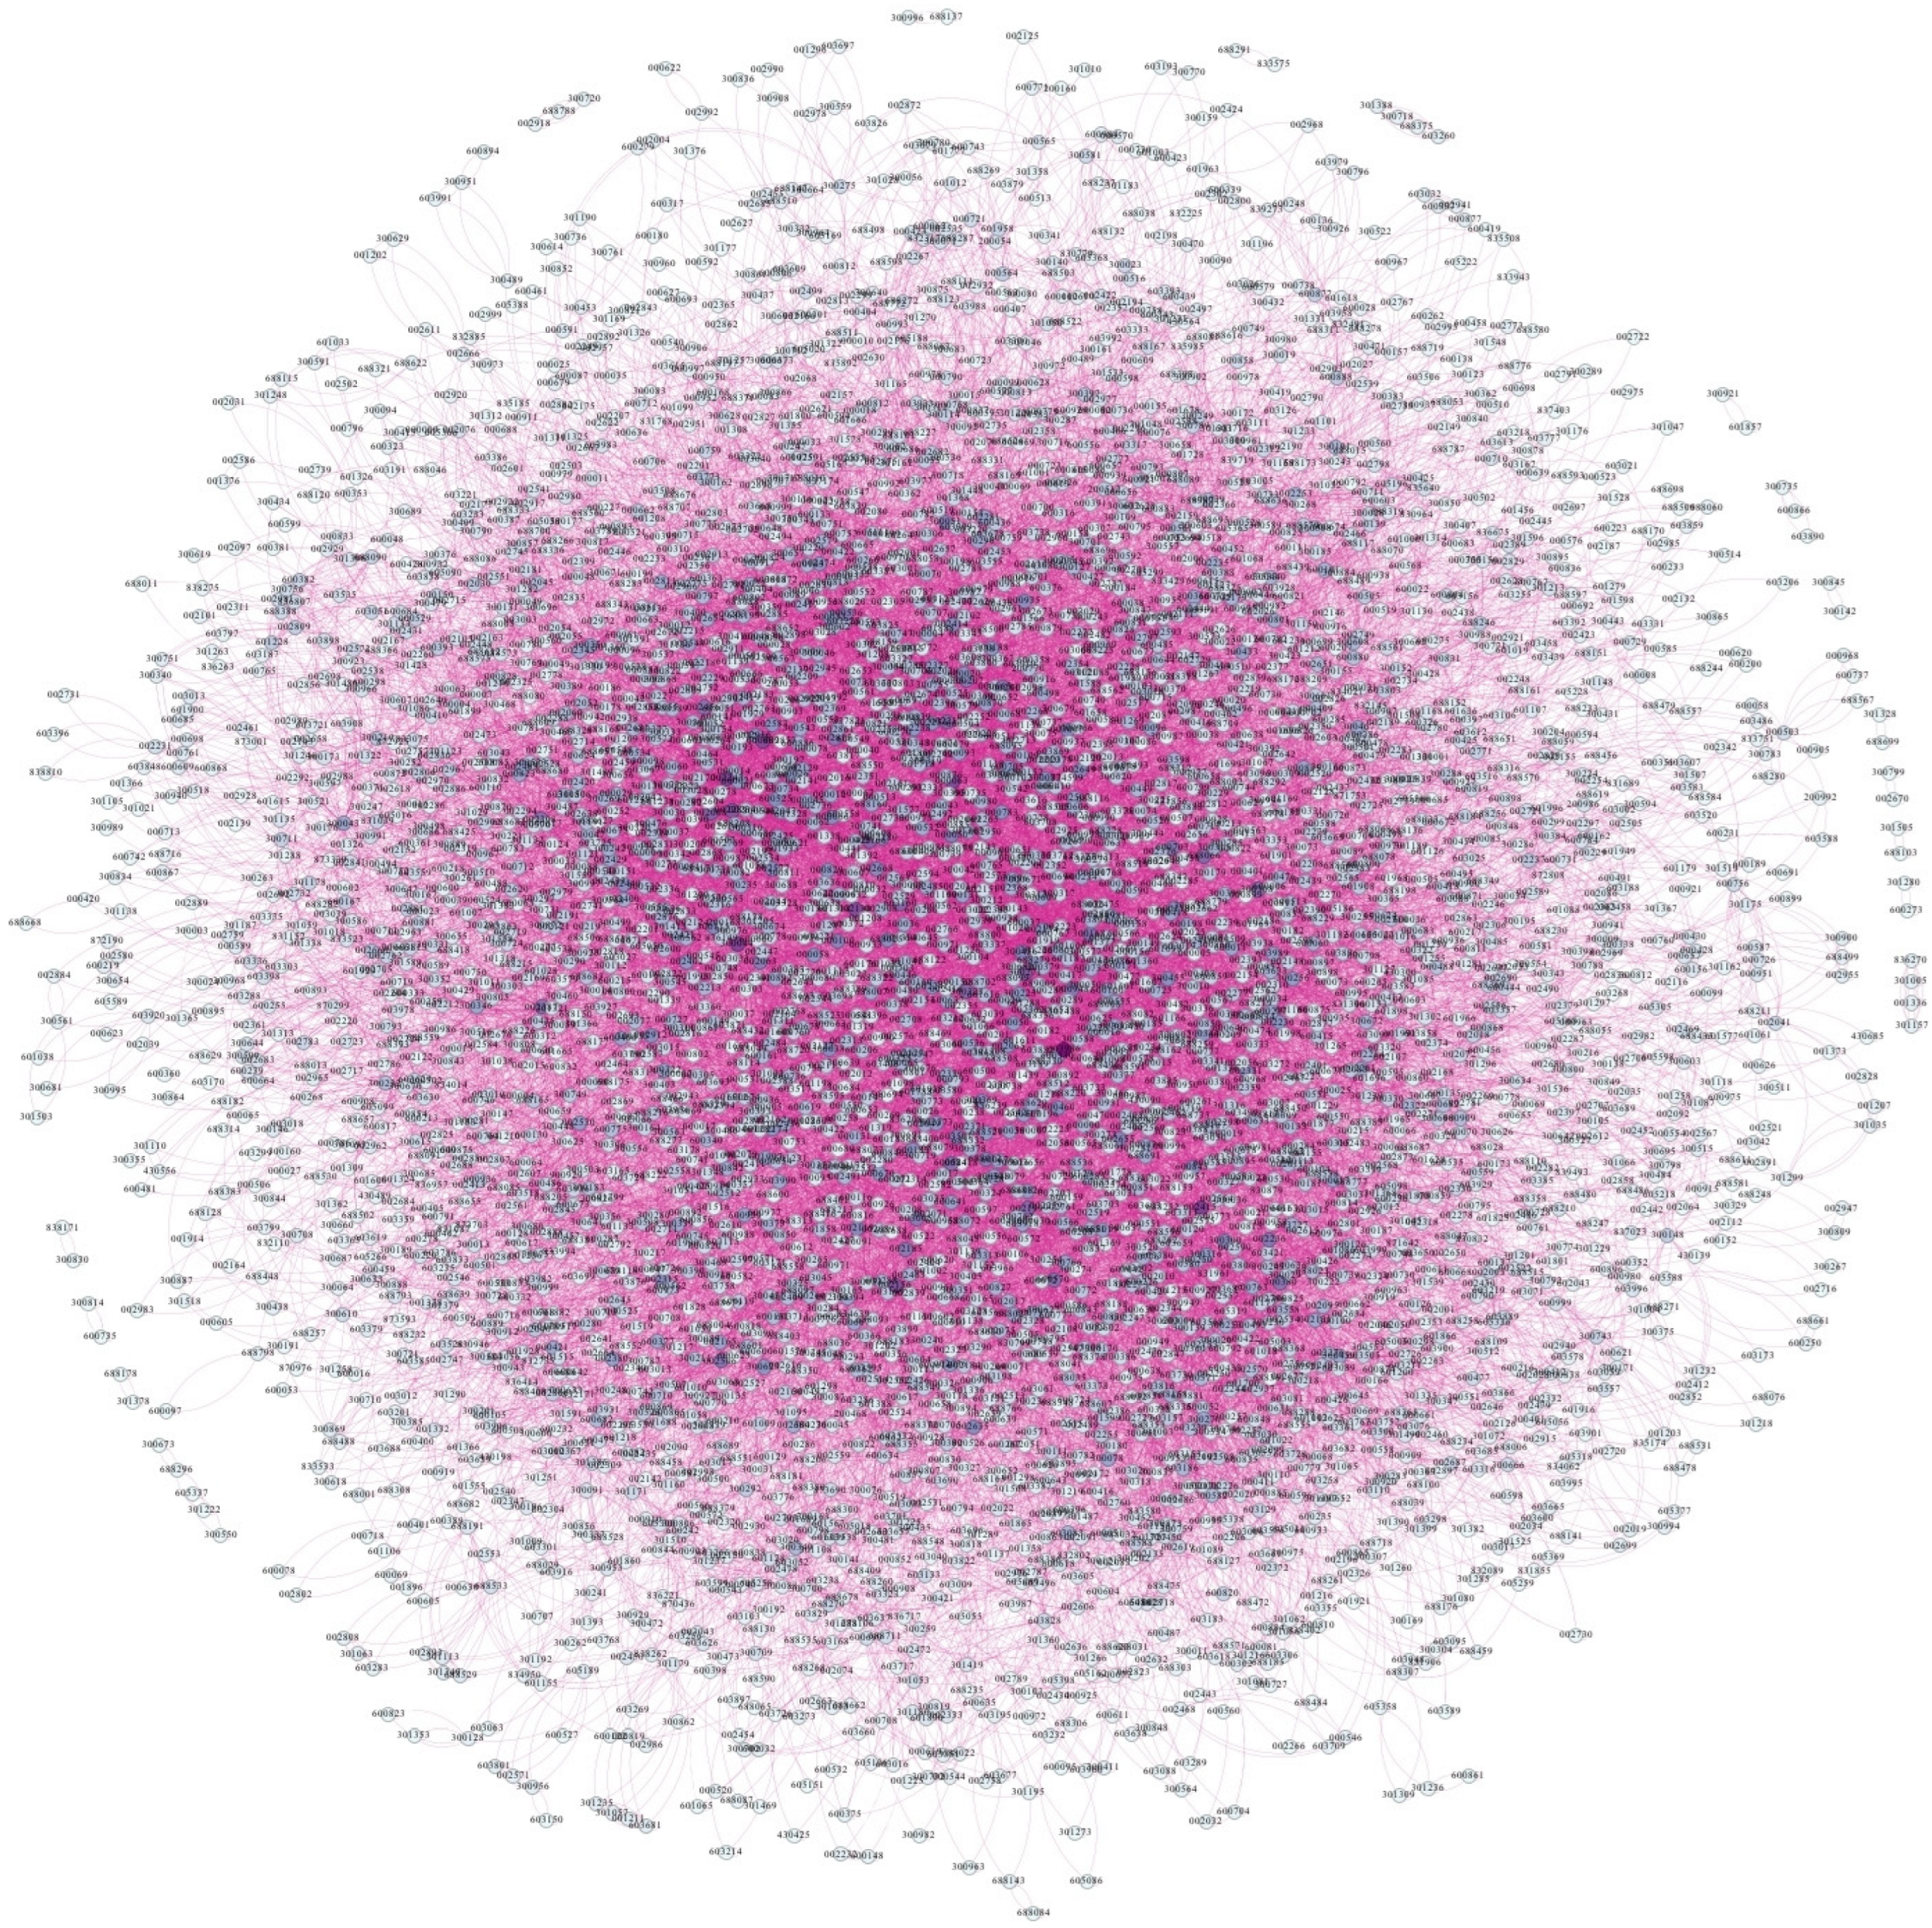
2.1. Enterprise Social Networks

SNA is a quantitative method used for studying social structures and relationships. It was developed by sociologists based on sociometric analysis, mathematical methods, and graph theory. The core issue in SNA is the examination of the structure and characteristics of social relationships formed by various individuals or organizations. Its starting point is to conduct quantitative analysis of these social structures.
There are currently two approaches in academia to constructing board/executive networks. The first approach, typified by Fracassi and Tate (2012) [50], treats individuals as nodes in the social networks. They consider company directors or executives as network nodes and measure the social relationships among directors/executives within or outside the company based on four aspects: current employment, prior employment, education, and other activities. They then establish a network of board/executive connections and calculate the social network characteristic indicators for each director or executive as proxy variables to evaluate the company’s social network characteristics.
The second approach, exemplified by Larcker et al. (2013) [51], directly treats companies as nodes in social networks. This approach emphasizes that if two companies share at least one director or executive, a social network connection exists between them and a corporate connection network is established. This means that a social network is formed when directors or the CEO serve on the boards of other companies [52]. Cai and Sevilir (2012) [53] further differentiate corporate-level connections into “primary connections” and “secondary connections”, where a primary connection refers to a director holding board positions in two companies simultaneously, and a secondary connection refers to directors from different companies serving on the board of a third company. Additionally, some scholars use survey methods to determine whether network connections exist between companies [54].
Network embedding takes network position as a core indicator, with the main variables being centrality and structural hole metrics [55,56]. From a social network perspective, companies, organizations, and individuals can be considered as nodes in the network. Centrality is used to measure the power, activity, and communication convenience of these nodes. Degree centrality is a widely utilized approach for precise analysis [57]. Degree centrality indicates the total number of units from which a focal unit receives knowledge. Higher degree centrality indicates that the unit has more sources of knowledge [58]. As Freeman (2002) [59] pointed out, degree centrality is the most suitable centrality measure for assessing individual actors’ information or knowledge acquisition.
Another measure of social network node characteristics is structural holes, which emphasize non-redundant relationships in the social networks. The non-redundancy of network connections determines whether the connections can provide valuable information for companies. Individuals occupying structural holes possess greater information and resource advantages [60,61,62]. On the one hand, occupying structural holes can enable one to obtain more information by connecting multiple entities, thereby reducing information asymmetry and transaction costs. Conversely, individuals occupying structural holes can establish more competitive advantages by dominating resources at both ends of these structural holes [62,63].
Network density serves as a fundamental and significant metric among various indicators used for assessing network structure, and it refers to the number of connections between nodes within a network [64]. It can globally describe the tightness of connections between various organizations within the network [65], manifested in the interaction frequency among network members. Gnyawali and Madhavan (2001) [66] emphasize that the volume of inter-node connections significantly shapes communication and collaborative processes among individuals, thereby positioning network density as a critical determinant of behavioral patterns and outcomes.
In summary, this research will select degree centrality, structural holes, and network density as explanatory variables in order to comprehensively analyze the embedded characteristics of companies in social networks. This approach can effectively measure the status, influence, and importance of companies in social networks. Expanding from the common “board/CEO social networks” to “core management team networks”, this study constructs social connection relationships based on multiple directorships in listed companies in the ICT industry, focusing on the core management team (directors, supervisors, executives). It calculates degree centrality, structural holes, and network density in social networks, exploring their different impacts on GI.

2.2. Enterprise Social Networks and Green Innovation

On one hand, the theory of network embedding suggests that strategic resources critical to a firm’s development, such as valuable, scarce, and difficult-to-replicate or -substitute resources, are not only found within the firm but are widely distributed across the firm’s network. As a result, the scope of a firm’s resource acquisition expands from internal organization to the external relational network in which it is embedded [67]. On the other hand, based on resource dependency theory, due to significant differences in the resources possessed by different firms and the inherent immobility of these resources, firms must interact with other organizations in the environment that control these scarce resources to acquire them, thereby deepening the organization’s dependence on its surrounding environment.
Social networks, made up of various participants, are crucial for the sustainable development of businesses [68] and they facilitate GI. Firstly, they facilitate the acquisition of fundamental knowledge and technologies external to the organization. Dangelico (2016) [69] proposed that the internal and external collaboration networks of an enterprise, along with knowledge and information flow transmission, affect GI. Enterprises, along with their business partners and clients, can drive GI by collectively sharing green resources and information and by acquiring green knowledge [70]. Secondly, social networks foster a shared environment where employees from different companies can mutually share and learn from each other’s experiences [71]. Thirdly, social networks help firms develop and implement environmentally favorable strategies to enhance environmental performance, thereby promoting GI [72].

2.2.1. Degree Centrality and Green Innovation

The most commonly used network metric to measure a firm’s position within a network is “centrality”, which refers to the quantity of relationships a firm possesses [73]. Firms situated at central positions within networks are able to leverage their resource and locational advantages to promote GI [16].
Firstly, ICT companies need to leverage social capital to establish connections with individuals who can offer resources [74] and should utilize information and communication technology to facilitate collaboration between businesses, universities, governments, and other organizations. Firms with high centrality have larger numbers of partners and can access large amounts of heterogeneous information. As a result, they understand and utilize more green information and technologies, accumulate greater industry-related experience, and capture the latest market insights [75]. This aggregation of knowledge creates a rich resource pool for central firms, further facilitating their access to various types of relational resources [76].
Secondly, being centrally positioned facilitates a firm’s coordination and control of green resources. Firms with higher centrality are located closer to the core of the network, giving them access to key resources within the industry. On one hand, central firms can leverage their good reputations to facilitate the flow of green knowledge and resource information between companies [77]. On the other hand, they can stimulate knowledge sharing among cooperation partners by utilizing various bilateral relationships. Specifically, core firms with stronger network power are the rule makers within networks, possessing greater resources to control the opportunities for knowledge sharing and the recipients of that knowledge [78]. This increases the dependence of peer firms on the core firm, thereby granting it greater network power. It helps the core firm swiftly acquire relevant new information within the network, select high-quality partners, and collaborate with firms that possess abundant green resources and a strong green reputation to overcome challenges [79].
Central firms can leverage advantages in resource allocation within the network [80] to seize market opportunities and implement GI strategies [16]. They can conduct extensive technological research to identify valuable heterogeneous resources and high-quality GI elements, breaking through resource constraints and cognitive inertia. This provides valuable insights into generating new ideas within the firm, thereby promoting high-quality GI. We hypothesize the following:
H1a. 
Degree centrality positively influences green innovation.

2.2.2. Structural Holes and Green Innovation

Structural holes refer to non-redundant relationships between different nodes in a network that lack direct connections [62]. The richness of structural holes in a company’s network affects its dominant position in the entire information transmission network, reflecting the company’s “bridging role” within the network [81]. Individuals occupying structural holes can manipulate resources and information [55] and access a broader range of information sources from different groups.
There are two reasons why companies with abundant structural holes can promote their GI. First, such firms play a crucial bridging and strategic role in collaborative innovation networks. Research indicates that non-redundant collaborations are the most effective type of collaboration [82]. Companies occupying structural holes have an advantage in acquiring knowledge and information resources. The more structural holes a company occupies, the more opportunities it has to access new innovation resources [83], particularly in terms of controlling highly heterogeneous resources [84]. Companies with abundant structural holes can obtain more heterogeneous resources for GI strategies, leveraging first-mover advantages to enhance the quality of GI decisions [16].
Secondly, occupying structural holes helps firms to avoid “cognitive traps”. Firms with numerous structural holes can uncover innovation resources and identify technologies and knowledge that significantly differ from their own. These heterogeneous resources help overcome technical bottlenecks, fostering firm development and enhancing GI performance [85]. We hypothesize the following:
H1b. 
Structural holes positively influence green innovation.

2.2.3. Network Density and Green Innovation

Network density reflects the closeness of connections between network nodes [86,87]. Many researchers believe that the negative impact of high network density on corporations outweighs the benefits it brings. For example, high network density can inundate managers with potentially irrelevant knowledge, diverting their attention and reducing the efficiency of acquiring knowledge [86]. Swaminathan and Moorman (2009) [88] noted that enterprises with lower network density are more agile in cultivating relationships between firms, which allows them to engage more effectively in new knowledge exchanges with the “right” firms. Additionally, lower network density may encompass diverse knowledge resources, facilitating the creation of new knowledge [89] and thereby promoting the development of new products [90].
First, firms embedded in high-density networks may reduce the intensity of green knowledge research, diminishing the tendency to seek new green knowledge [91]. The restricted openness of firms to external knowledge within high-density networks’ collective social capital hinders the promotion of innovation [92,93]. Specifically, in high-density networks, firms are less open to different opportunities and perspectives, preferring to acquire and absorb new green knowledge internally rather than seeking it outside the existing network. This diminishes the likelihood of innovating new green products [94].
Second, firms in high-density networks engage in less new knowledge exchange due to the higher social costs within these networks [88]. A high density can reduce individuals’ capacity to gain from the diversity of green knowledge, whereas low network density offers more opportunities for acquiring new knowledge, thereby fostering innovation [95]. High network density may also diminish the potential value of the diversity of green knowledge for GI in enterprises, while low density can provide a more optimal environment for enterprises, allowing them to concentrate on specific relationships, reducing distractions caused by information overload, promoting the dissemination of new knowledge, and thereby facilitating innovation [86].
Lastly, some scholars argue that that high social pressure to adhere to network standards and groupthink is associated with high network density, further inhibiting innovation [87,96]. We hypothesize the following:
H1c. 
Network density negatively affects green innovation.

2.3. Mediating Effect of R&D Investment

R&D investment is a crucial input for promoting innovation, helping firms to establish themselves in increasingly competitive environments [97]. Therefore, R&D expenditure is crucial for the sustained development of companies in high-tech industries. Researchers have found that investing in R&D resources enables firms to generate research outputs, thereby driving innovation. Enterprises will struggle to develop effective R&D capabilities without proper guidance and adequate R&D funding [98].
Innovation investment is characterized by high uncertainty and significant burdens. It lacks a fixed pattern to follow, making it a non-routine behavior [99]. This uncertainty often causes corporate decision-makers to adopt a cautious approach to R&D investment decisions. However, in the face of intense market competition, firms experience pressure to innovate or risk falling behind. To maintain their market position, companies urgently need methods to reduce the uncertainty of technological innovation investments, thus altering executives’ overly conservative attitudes toward such investments and enhancing their willingness to invest in innovation.
Chuluun et al. (2017) [73] found that firms with relatively low levels of social networking or weak network capabilities face increased risks in their R&D expenditures and innovation activities. According to Simon and March (2015) [100], an individual’s acceptance of information largely depends on their trust in the source of that information. Firms with strong relationships exhibit high levels of trust and close connections, including face-to-face interactions, which is highly beneficial for the sharing and dissemination of tacit technological knowledge [101]. They are also more willing to offer cooperation and trust beyond the contract, reducing the likelihood of conflicts, avoiding mutual blame when responding to crises, and developing mechanisms for jointly solving problems and sharing risks [102,103]. Therefore, when one firm faces a shortage of R&D funds or talent, its partners are more likely to provide support through commercial credit, guarantees, etc., to prevent greater losses from disruptions in green technology R&D.
Additionally, developing a new GI product or technology is often constrained by the firm’s own resources and incomplete information, leading to significant risks. Trust relationships in strong networks can greatly reduce the difficulty and risk of GI, making firms more willing to share green technology resources in low-risk situations [104]. Typically, a firm’s CEO and board provide strategic guidance for R&D activities. When making R&D-related decisions, the firm’s social networks can offer valuable R&D-related information [105]. Helmers et al. (2017) [106] found that a firm’s social networks facilitate the dissemination of new knowledge, enabling the company to conduct new research and resulting in increased R&D investment. Therefore, social network embedding helps firms to acquire abundant green technology resources, reduces the GI risks for the company, and supports increased green R&D investment.
R&D investment can promote GI [107]. R&D expenditure serves as a driving force, both in advancing GI and in developing new environmentally sustainable products and technologies [108], because it can create competitive advantages, help firms absorb environmental costs [109], absorb external knowledge spillover effects [110], and improve their ability to address environmental issues [111], thereby creating GI advantages.
Furthermore, R&D funding and corporate social networks can attract more R&D talent. As carriers of GI technology, human capital can directly participate in R&D to improve the firm’s green technology level and enhance the ability to learn, absorb, and apply existing technologies as well as create new technologies [112], thereby improving the quality of the firm’s GI.

2.3.1. The Mediating Role of R&D Investment Between Degree Centrality and Green Innovation

Network centrality and connectivity are considered key resources for developing innovation capabilities [113]. The study by Iyer et al. (2020) [105] found that when enterprises occupy more central positions in social networks, their R&D expenditures tend to increase accordingly. Dalziel et al. (2011) [98] showed that the connections established by internal directors with high-tech companies positively impact R&D expenditure.
First, firms in central positions can act as points of reference for other businesses in the network, making it easier for them to acquire knowledge about potential reasons for operational losses [114]. Directors holding external positions can obtain more information related to innovation activities [115]. When interlocking executives hold concurrent positions in other enterprises and participate in daily operational management, they can gain insights into how similar technological innovation investment decisions are formulated and implemented by connected enterprises if encountering analogous scenarios. This allows them to acquire firsthand experience in technological innovation investment decision-making, thereby reducing R&D investment risks while increasing R&D expenditure.
Second, centrality enhances a firm’s social status, influencing perceptions of its capabilities [116]. Due to their evident reputation, centrally positioned firms are collectively evaluated, allowing them to make superior collaborative decisions and foster more stable relationships compared to non-central firms [117,118]. They have more opportunities to encounter and absorb new ideas and can better engage with other clients and suppliers linked to strong enterprises [119,120]. This facilitates the acquisition of green financial resources and talent directly from extensive social network contacts. The positive signals obtained when occupying a central position shape a firm’s high reputation, helping to lower perceived risks in terms of resource expansion and encouraging investment in innovation projects [121,122,123]. A good reputation also enables central enterprises to enhance their credit ratings through guarantees from multiple partners, allowing them to secure loans from banks to support the implementation of GI projects.
Central enterprises can connect with various types of partners, who typically have distinctive resources, skills, and experiences [124]. Thus, in a GI network, as centrality increases, firms build collaborative relationships with many network members based on R&D talent, expanding their relational breadth and enabling them to acquire rich R&D talent resources from multiple channels [125]. By engaging in communication with partners, firms can enhance their own R&D human resources, supplementing their internal workforce with green knowledge and accumulating green human capital. Furthermore, a central position within the network is a symbolic one, carrying significant prestige and influence. Firms in central positions tend to value their reputation more highly, which helps to constrain their behavior and signal positive green practices. As a result, they are more likely to attract top external talent and further enrich their green human resources.
Therefore, high social network centrality can help firms to reduce market uncertainty, thereby increasing innovation investment. Centrality enhances a company’s attractiveness to talented employees, broadening the channels for recruiting talent, generating diverse capabilities, and fostering multiple subsequent R&D collaborations [56], thus positively impacting GI. We hypothesize the following:
H2a. 
R&D expenditure investment mediates the effect of degree centrality on GI.
H3a. 
R&D personnel investment mediates the effect of degree centrality on GI.

2.3.2. The Mediating Role of R&D Investment Between Structural Holes and Green Innovation

Structural holes in market innovation competition bring resource advantages, which help to exploit innovation opportunities while mitigating associated risks, ultimately increasing R&D investment [126].
First, firms occupying structural holes have the advantage of recommendation information. Structural holes act as “bridges” in corporate relationship networks, allowing firms that occupy these holes to control and utilize more information [127]. When a company has one or more directors or executives holding external positions, the greater the number of such positions, the more structural holes the company has. In discussing or deciding on R&D projects, these directors or executives, due to their experience in similar R&D project decision processes in other roles or because structural holes broaden their perspectives, can help the firm better understand competitors’ strengths and weaknesses, R&D risks, project feasibility, and growth potential, thus obtaining useful information for R&D decisions.
Second, firms occupying structural holes have the advantage of extracting information, possessing more heterogeneous resources. According to Barney (1991) [67], the heterogeneity of corporate resources is reflected in market resources, technological resources, and managerial capabilities, with relational heterogeneous resources primarily evident in technology. As companies grow and knowledge diffuses, firms can use structural holes to transfer standardized technical knowledge across networks, stimulating innovative learning and integrating knowledge across these networks, which increases R&D investment and accelerates continuous growth. Enterprises positioned in structural holes can access diverse and non-redundant knowledge and information through the “bridge” channels [128], endowing the firm with new creativity, avoiding homogeneity in R&D projects, reducing R&D investment risks, and increasing the expected returns on R&D investments.
Third, firms occupying structural holes have the advantage of timely information. Brüderl et al. (1992) [129] argue that entrepreneurial opportunities arise from information asymmetry, and innovation opportunities reflect entrepreneurs’ alertness. If information asymmetry exists in the market, alert entrepreneurs can keenly perceive it, thereby grasping timely and high-quality innovation opportunities. For firms rich in structural hole positions, decision-makers can capture fleeting R&D opportunities through network information flow, increasing R&D project investment and promoting GI.
Enterprises embedded in networks with abundant structural holes possess greater opportunities for creative knowledge recombination, enhance knowledge-sharing capabilities among colleagues, and gain access to an expanded pool of potential talent beyond geographical constraints [130], thereby recruiting more R&D talent. Limiting the selection of R&D personnel to local searches may make it difficult to find the most qualified individuals to help utilize specific types of knowledge or apply it to particular problems. Being embedded in a closed or redundant structure restricts a firm’s autonomy in seeking and identifying staff with the best capabilities [131]. Conversely, a diverse interdepartmental network within an organization enhances search process flexibility and amplifies the probability of identifying professionals with the requisite expertise to effectively leverage external knowledge. Even if intermediaries cannot directly reach key contacts, a diverse relational network can enhance the chances of obtaining useful recommendations, thereby discovering and recruiting employees with the desired skills and expertise [132], thus increasing the firm’s green R&D capacity and GI capabilities. We hypothesize the following:
H2b. 
R&D expenditure investment mediates the effect of structural holes on GI.
H3b. 
R&D personnel investment mediates the effect of structural holes on GI.

2.3.3. The Mediating Role of R&D Investment Between Network Density and Green Innovation

Higher network density hinders firms’ potential for exploration and innovation, reducing their willingness to pursue GI, which in turn decreases investment in GI and the recruitment of R&D personnel. The reasons for this are as follows:
Firstly, existing research indicates that high density suppresses diversity and the utilization of novel value. Strong ties among members within a high-density network result in a high degree of knowledge homogeneity, leading to knowledge redundancy, increased costs of acquiring knowledge, and low efficiency in knowledge flow [128]. When knowledge spreads among enterprises within high-density networks, the information obtained through indirect connections becomes highly similar to that acquired from direct contact. Consequently, it is less likely for firms to gain new or additional insights from indirect linkages, leading to diminished possibilities for creating novel combinations and reduced competitive advantages in delivering innovation novelty [133]. Furthermore, high-density networks amplify the probability that knowledge and information acquired by companies through their alliance networks will simultaneously be disseminated to partner organizations, potentially causing adverse spillover effects. The diffusion of such knowledge throughout the network can limit the use of novelty and reduce the attractiveness of seeking this novelty [134]. In contrast, the heterogeneous knowledge brought by low-density networks helps firms to overcome path dependence and capability traps associated with specialized knowledge bases [135], improving innovation efficiency, accelerating innovation speed, and reducing innovation costs [64].
Secondly, high-density networks generate reputational effects while providing alliance networks with mechanisms to enforce behavioral constraints among members [136]. While beneficial for managing relational risks, these dynamics may generate intense normative pressures that compel organizational conformity over innovative differentiation [137]. Firms may encounter impediments in forging novel innovative relationships, as implicit loyalty expectations toward existing partners and networks could inhibit the formation of new strategic alliances [138,139,140], thereby reducing their willingness for GI and limiting channels for recruiting R&D personnel. We hypothesize the following:
H2c. 
R&D expenditure investment mediates the effect of network density on GI.
H3c. 
R&D personnel investment mediates the effect of network density on GI.

2.4. Moderating Effect of Environmental Information Disclosure

Social networks empower enterprises to expedite access to external heterogeneous knowledge, facilitate the circulation and sharing of resources, knowledge, and information, and help network members jointly solve problems, achieve mutual development, and gain social support, thereby fostering innovation [141,142,143]. Meanwhile, EID, as a common method for enterprises to communicate environmental information to external stakeholders, is frequently included in CSR reports or annual reports [144]. EID helps firms convey information to stakeholders, reduce information asymmetry [145], and enhance their capacity to collect and organize information [146], thereby strengthening the influence of social networks on resource and information sharing for GI.
First, EID plays a positive moderating role between degree centrality and GI. According to reputation theory, the position held by independent directors in social networks, formed by holding concurrent positions in external companies, is a key means of reputational development. The market for executives holding positions in multiple companies contains expert reputations [147]. When the business decisions made by the companies where external directors serve lead to good business performance or success in specific areas, it sends a strong signal to the market about their expertise in governance and supervision, thereby enhancing their expert reputation. In firms with high degrees of centrality, there are more interlocking directors in central positions within the networks, and they are more likely to care about the social reputation they accumulate. These firms also tend to have more access to green resources and information. EID serves as an information mechanism to raise ecological consciousness among key stakeholders, including consumers, investors, and social entities [148,149]. By emitting favorable environmental signals through EID, corporations can cultivate enhanced social credibility and secure stakeholder support [150].
EID promotes effective communication and a virtuous cycle between the firm and its stakeholders, reducing information asymmetry. Such interactions help firms acquire external resources. Grounded in resource dependence theory, organizations need to engage in resource exchange with their external environments to achieve sustainable growth [151]. The implementation of GI initiatives, including product development and technological upgrades, necessitates substantial resource use. This dependence on external resources leads to a need for acknowledgment from stakeholders through environmental information disclosure, enabling the firm to secure more resources and strengthening the role of degree centrality in promoting GI.
Second, EID plays a positive moderating role between structural holes and GI. A company’s ability to manage the flow of information within its social network depends on the extent to which it occupies bridging positions with its partners within the network. Without these, partners would be disconnected [152]. Companies that occupy structural holes often act as information intermediaries, possessing stronger control over network flows and being able to acquire information and knowledge related to environmental systems and practices from various sources [153]. To further maintain and consolidate this informational advantage, such firms tend to suppress the possibility of forming direct links with other companies within their network [154]. As a result, firms occupying structural holes are often viewed by other companies in the network as self-serving and disloyal, using their informational advantage to harm others’ interests [155,156]. These firms need to establish trust and develop their reputation in order to effectively integrate non-redundant information and resources. Through transparent information disclosure, these firms can demonstrate their commitment to and efforts in GI to the outside world, thereby enhancing their credibility within the network, increasing stakeholder trust, and boosting cooperation with external partners, ultimately enhancing the effectiveness and reliability of information exchange. On the other hand, through EID, firms in structural holes can build stronger trust bridges across various groups, facilitating the sharing of green resources and the transfer of green knowledge, thus driving their level of GI.
Third, EID strengthens the negative effect of network density on GI. To begin with, high network density often leads to redundancy and homogenization in knowledge sharing [157]. The diversity of innovation is limited. EID may further exacerbate information homogenization, as publicly disclosed information spreads quickly among members within the network, potentially leading to convergence in GI paths, thus reducing the diversity and quality of GI. Moreover, high network density typically indicates strong collaboration and communication between firms, and these close relationships may lead to similar ways of thinking and action paths within the network. The public disclosure of EID might reinforce existing ideas and practices, limiting the ability of network members to embrace new external viewpoints and innovations. Firms within high-density networks may rely more on existing information and resources rather than exploring new directions for GI. As a result, EID may reinforce the established GI paths within such dense relational networks, thereby reducing the breakthrough potential of innovation. Furthermore, high network density may constrain information and resource circulation to intra-network members, thereby impeding organizations’ absorptive capacity for external knowledge [92,93]. When firms engage in EID, the involvement of external firms and stakeholders may be relatively low, reducing the motivation for external partners to provide new resources. This diminishes the input of external knowledge and weakens the firm’s GI capabilities. We hypothesize the following:
H4a. 
EID strengthens the relationship between degree centrality and GI.
H4b. 
EID strengthens the relationship between structure holes and GI.
H4c. 
EID strengthens the relationship between network density and GI.

3. Methods

3.1. Sample and Data Collection

To test the hypotheses, this study focuses on A-share listed companies in China’s ICT sector, traded on the Shanghai and Shenzhen stock exchanges during the 2012–2022 period, as the research sample. Following standard practices, ST, PT, and financial insurance firms, as well as firms with incomplete data, were excluded. The industry classification method follows the “National Economic Industry Classification Standard” (GB/T4754-2011) [158] published by the National Bureau of Statistics, defining the IT industry as comprising the manufacturing of information equipment, software, information transmission, and information technology services. Ultimately, 1065 firm-year observations were obtained. The external positions held by the core management team members of these companies in other companies over the past decade were obtained through the CSMAR database. These data were used to establish the social networks among companies, resulting in 4832 firm-year observations. UCINET 6 software was utilized to calculate three measures: degree centrality, structural holes, and density.
Social network diagrams of these sample companies are shown in Figure 1. The diagrams were created by the author using Gephi 0.10.1 software based on corporate social network data. In the diagrams, each company is represented by a circle, with the number on the circle indicating the company’s stock code. The darker the color of the circle, the more social network connections the node company has established. The connections between companies are represented by lines linking the circles. It is important to note that while the total number of enterprise-annual observation values in this study is 4832, which includes repeated observations for each company across different years, the network diagram reflects 3331 distinct companies. This number represents the cumulative corporate ties across the entire 10-year period, with each company appearing as a single node in the network, regardless of its multiple annual occurrences. This approach ensures that the diagram focuses on the stable, long-term connections between companies rather than fluctuations in connections from year to year.
Green patent data for these firms were acquired from the CSMAR database, the Smart Bud Commercial Patent Database, the National Key Industry Patent Information Network, and other platforms. Data on the quality of EID were sourced from the CSMAR database’s environmental research section. Information on R&D investment funds and the number of R&D personnel also came from the CSMAR database.
The reason for selecting Chinese companies as the research sample is that previous studies have primarily focused on developed countries, where the socioeconomic systems are relatively mature, limiting the impact of corporate social network capital. In contrast, in emerging markets like China, where environmental regulations are not yet well established, informal institutions such as social networks are needed to drive companies toward GI [3]. The reasons for selecting this industry sample are as follows: First, focusing on a single industry makes the research question and results more targeted. Second, ICT, as a knowledge-intensive industry, places great emphasis on integrating external innovation resources with the other internal resources of the enterprise [159,160]. It also focuses on the accumulation and utilization of technological knowledge, while prioritizing R&D activities and the exploration of new technologies [161]. Third, the industry places importance on the protection and accumulation of patents and intellectual property, providing comprehensive data for this study.

3.2. Variables and Measurements

3.2.1. Dependent Variable

Green innovation (GI): this study employs the natural logarithm of the number of green patent applications plus one as a measure of GI capability [150,162,163].
The reasons for this are as follows: First, green patent applications have a high acceptance threshold, making them a robust representation of a company’s GI capability [164]. Second, the efficiency of resource input and utilization is ultimately reflected in a company’s technological innovation, and patent applications aptly indicate the output of such innovation [165]. Patent grants require companies to pass rigorous tests and pay annual fees, making them more uncertain and unstable [166].

3.2.2. Independent Variables

Corporate social networks include three metrics: degree centrality, structural holes, and network density. If a company’s directors, supervisors, managers, or other executives simultaneously hold executive positions in other companies, the direct or indirect connections formed between their primary and secondary companies constitute corporate social networks.
(1)
Degree centrality (Deg)
D e g i = s = 1 N C i s N 1
where “N” represents the total number of firms in the social networks. If firm “i” and firm “s” are directly connected, c i s equals 1; otherwise, it equals 0. Finally, division by “N − 1” standardizes the degree centrality to eliminate the impact of network size [167].
(2)
Structural holes (SH)
Due to the widespread application of constraint, the “1-constraint degree” is adopted to measure the network’s structural holes [168,169,170]. The formula is as follows:
S H i = 1 j ( P i j + q P i q P q j ) 2
P i j represents the strength of the direct relationship between firm “i” and firm “j”, P i q P q j represents the strength of the indirect relationship between firm “i” and firm “j” through company “q”, and q P i q P q j represents the sum of all indirect relationships between company firm “i” and firm “j”.
(3)
Network density (Density)
Referring to the method by Oliver (1991) [171], the specific measurement of network density is performed as follows:
Density   =   Ties   N × ( N 1 ) / 2
“N” represents the total number of nodes in the network, “Ties” represents the actual number of direct relationships in the network, and “N × (N − 1)/2” measures the theoretical upper limit of the number of direct connections in a network with “N” nodes.

3.2.3. Mediating Variables

R&D investment includes R&D expenditure (Expenditure) and R&D personnel (Personnel). R&D expenditure is measured as the logarithm of the amount of R&D investment. R&D personnel is measured as the ratio of the number of R&D personnel to the total number of employees [172].

3.2.4. Moderating Variable

The quality of environmental information disclosure (EID) is the moderating variable. This study utilizes the environmental research database from the CSMAR database to classify companies’ EID based on whether it is monetized [173,174,175]. Both monetary and non-monetary environmental disclosures are efficient tools for measuring the level of EID [176]. For monetary information, a combined score for quantitative and qualitative disclosure is assigned a value of 2, qualitative disclosure is assigned a value of 1, and no disclosure is assigned a value of 0. For non-monetary information, scoring for each environmental information disclosure item is described according to Wiseman’s (1982) study [173]. Disclosure is assigned a value of 2, and no disclosure is assigned a value of 0. Specifically, indicators such as environmental liabilities and environmental performance and governance disclosures are considered monetary information, while environmental management disclosures, environmental certification disclosures, and EID carriers are considered non-monetary information.
Referring to scoring items commonly used by Chinese scholars, which include 25 scoring items across two types of information and five aspects, scores are summed and then log-transformed to derive the EID [177]. This index comprehensively reflects the quality of a company’s EID. The specific scoring items for EID are shown in Table 1.

3.2.5. Control Variables

Existing research indicates that the GI capability is also influenced by firm characteristics. Following the methodologies of previous research [180,181,182,183,184], this study selects firm size (Fir), the proportion of independent directors (Ind), firm age (Age), and return on assets (ROA) as control variables. In summary, the definitions of each variable are presented in Table 2 below.

3.3. Models and Measures

The conceptual framework of this research is presented in Figure 2. The degree centrality (Degree), structural hole (SH), and network density (Density) of the corporate social networks are the independent variables. R&D investment (R&D expenditure; R&D personnel) serves as the mediating variable, environmental information disclosure (EID) acts as the moderating variable, and GI is the dependent variable.

3.3.1. Basic Regression Model

To test hypotheses H1a, H1b, and H1c, this study first establishes an OLS (ordinary least squares) regression model. Control represents a series of control variables, “i” denotes individual fixed effects, “t” denotes time fixed effects, and “ ε ” represents the random error. The formula is as follows (model numbers correspond to hypotheses):
Model H1a:
G I i , t = α 1 + β 1 D e g i , t + γ 1 C o n t r o l i , t + ε i , t
Model H1b:
G I i , t = α 2 + β 2 S H i , t + γ 2 C o n t r o l i , t + ε i , t
Model H1c:
G I i , t = α 3 + β 3 D e n s i t y i , t + γ 3 C o n t r o l i , t + ε i , t

3.3.2. Mediating Effect Model

To test hypotheses H2a, H2b, H2c, H3a, 3b, and H3c, this study employs a stepwise regression method to establish models that examine the mediating role of R&D expenditure and R&D personnel. The formulas are as follows:
Model H2a:
E x p e n d i t u r e i , t = α 4 + β 4 D e g i , t + γ 4 C o n t r o l i , t + ε i , t
G I i , t = α 5 + β 5 D e g i , t + γ 5 E x p e n d i t u r e i , t + σ 5 C o n t r o l i , t + ε i , t
Model H2b:
E x p e n d i t u r e i , t = α 6 + β 6 S H i , t + γ 6 C o n t r o l i , t + ε i , t
G I i , t = α 7 + β 7 S H i , t + γ 7 E x p e n d i t u r e i , t + σ 7 C o n t r o l i , t + ε i , t
Model H2c:
E x p e n d i t u r e i , t = α 8 + β 8 D e n s i t y i , t + γ 8 C o n t r o l i , t + ε i , t
G I i , t = α 9 + β 9 D e n s i t y i , t + γ 9 E x p e n d i t u r e i , t + σ 9 C o n t r o l i , t + ε i , t
Model H3a:
P e r s o n n e l i , t = φ 1 + κ 1 D e g i , t + ρ 1 C o n t r o l i , t + ε i , t
G I i , t = φ 2 + κ 2 D e g i , t + ρ 2 P e r s o n n e l i , t + μ 2 C o n t r o l i , t + ε i , t
Model H3b:
P e r s o n n e l i , t = φ 3 + κ 3 S H i , t + ρ 3 C o n t r o l i , t + ε i , t
G I i , t = φ 4 + κ 4 S H i , t + ρ 4 P e r s o n n e l i , t + μ 4 C o n t r o l i , t + ε i , t
Model H3c:
P e r s o n n e l i , t = φ 5 + κ 5 D e n s i t y i , t + ρ 5 C o n t r o l i , t + ε i , t
G I i , t = φ 6 + κ 6 D e n s i t y i , t + ρ 6 P e r s o n n e l i , t + μ 6 C o n t r o l i , t + ε i , t

3.3.3. Moderating Effect Model

To test hypotheses H4a, H4b, and H4c, this study constructs the following models to examine the moderating effects of EID on the relationships between Deg, SH, network density, and GI:
Model H4a:
G I i , t = χ 0 + χ 1 D e g i , t + χ 2 D e g i , t E I D i , t + χ 3 E I D i , t + χ 4 C o n t r o l i , t + ε i , t
Model H4b:
G I i , t = θ 0 + θ 1 S H i , t + θ 2 S H i , t E I D i , t + θ 3 E I D i , t + θ 4 C o n t r o l i , t + ε i , t
Model H4c:
G I i , t = λ 0 + λ 1 D e n s i t y i , t + λ 2 D e n s i t y i , t E I D i , t + λ 3 E I D i , t + λ 4 C o n t r o l i , t + ε i , t

4. Results

4.1. Descriptive Statistics

As shown in Table 3, there are no outliers in the variables that violate general conditions. The mean of GI is 13.814, indicating that few companies focus on GI, and the standard deviation is 43.697, indicating a high degree of data dispersion and significant differences in green patent applications among companies. This suggests that there is substantial room for improvement in GI among Chinese companies. The mean Deg is 0.003, implying that, on average, each company has connections with 0.003% of the total number of listed companies in the same year, indicating a low average number of connections between companies. The mean SH is 0.619, indicating a relatively low richness of SH among the sample companies. The mean Density is 0.484, with a standard deviation of 0.330, indicating that the ratio of the actual number of connections to the maximum possible number of connections in the network is 0.484 on average, with a maximum value of 1 and a minimum value of 0, showing significant variations in the density of connections within the network. The mean EID is 2.208 with a standard deviation of 0.875, showing considerable variability. The mean Personnel is 13.584, with a standard deviation of 13.068, indicating a significant difference in the proportion of R&D personnel among companies. Some companies have a high proportion of R&D personnel, while others have almost none. There is some variation in Expenditure, with some companies investing significantly more than others.
All other variables fall within the normal range and are not elaborated further. For multicollinearity diagnostics, a Variance Inflation Factor (VIF) test was conducted, and the results show that all variables have a VIF of less than 2, with an average VIF of 1.17, indicating that multicollinearity is not a significant issue in the regression model.

4.2. Correlation Analysis

Table 4 presents the Pearson correlation coefficients between the dependent and independent variables in the model. The data results indicate that the GI of the sample companies is positively correlated with the Deg and SH of the social networks at the 1% significance level, suggesting that Deg and SH each have a positive influence on GI. Conversely, there is a significant negative correlation between Density and GI at the 1% significance level, indicating that Density negatively impacts GI. These preliminary findings support the relevant hypotheses, which require further validation.

4.3. Basic Regression Results

This study employs multiple regression analysis to verify the impact of corporate social networks on GI performance. Initially, the Hausman test and F-test were conducted. The Hausman test ruled out the random effects model, indicating that a fixed effects model should be used. In the F-test, the p-value was 0.0000, which was less than 5%, leading to the rejection of the null hypothesis and the exclusion of the OLS model in favor of the fixed effects model. Thus, the empirical results should be based on the fixed effects model.
As shown in Table 5, Model 1 and Model 4, respectively, reflect the significant positive impact of Deg and SH on GI (b = 1610.494, p < 0.001; b = 13.349, p < 0.001), thereby confirming hypotheses H1a and H1b. Model 7 reflects the negative impact of Density on GI (b = −13.742, p < 0.001), thus validating hypothesis H1c.

4.4. Mediation Effect Regression

Table 5 presents the results of the mediation analysis for R&D personnel investment in the relationship between corporate social networks and GI. According to the results of Model 1, Deg positively affects GI (b = 1610.494, p < 0.001). The results of Model 2 show that Deg positively affects Personnel (b = 1121.244, p < 0.001). In Model 3, both Deg and Personnel are included in the model for testing, and the result indicates that the coefficient for Personnel is 0.324, which is significant at the 1% level. Additionally, this study further utilized Sobel and Bootstrap tests. The Sobel test yielded a Z-value of 4.115 with a p-value of 0.00, which was less than 0.1, and the Bootstrap test with 1000 samples resulted in a bias-corrected (BC) interval of [147.8713, 313.8179], excluding 0. The results from all three testing methods confirm that R&D personnel investment mediates the relationship between degree centrality and the quality of GI. Hypothesis H3a is thus validated.
According to the results of Model 4, SH positively affects GI (b = 13.349, p < 0.001). The results of Model 5 show that SH positively affects Personnel (b = 6.217, p < 0.001). In Model 6, both SH and Personnel are included in the model for testing, and the result indicates that the coefficient for Personnel is 0.334, which is significant at the 1% level. The results of the Sobel test show a Z-value of 4.17 and a p-value of 0.00. The Bootstrap test, after bias adjustment, yielded a BC interval of [0.9214194, 1.947183], which excludes 0. The results from all three testing methods confirm that R&D personnel investment mediates the relationship between structural holes and the quality of GI. Hypothesis H3b is thus validated.
Finally, according to the results of Model 7, Density negatively affects GI (b = −13.742, p < 0.001). The results of Model 8 show that Density negatively affects Personnel (b = −6.205, p < 0.001). In Model 9, both Density and Personnel are included in the model for testing, and the result indicates that the coefficient for Personnel is 0.320, which is significant at the 1% level. The results of the Sobel test show a Z-value of 4.876 and a p-value of 0.00. The Bootstrap test, after bias adjustment, resulted in a BC interval of [−1.90976, −0.8885768], which excludes 0. The results from all three testing methods confirm that R&D personnel investment mediates the relationship between network density and the quality of GI. Hypothesis H3c is thus validated.
Table 6 presents the results of the mediation analysis for R&D expenditure investment in the relationship between corporate social networks and GI. According to the results of Model 10, Deg positively affects GI (b = 1610.494, p < 0.001). The results of Model 11 show that Deg positively affects Expenditure (b = 120.510, p < 0.001). In Model 12, both Deg and Expenditure are included in the model for testing, and the result indicates that the coefficient for Expenditure is 7.091, which is significant at the 1% level. Moreover, the Sobel test yielded a Z-value of 2.54 with a p-value of 0.01, and the Bootstrap test with 1000 samples resulted in a bias-corrected (BC) interval of [622.5361, 1003.654], excluding 0. The results from all three testing methods confirm that Hypothesis H2a is validated.
According to the results of Model 13, SH positively affects GI (b = 13.349, p < 0.001). The results of Model 14 show that SH positively affects Expenditure (b = 0.566, p < 0.001). In Model 15, both SH and Expenditure are included in the model for testing, and the result indicates that the coefficient for Expenditure is 7.114, which is significant at the 1% level. The Sobel test yielded a Z-value of 3.581 and a p-value of 0.00. The Bootstrap test, after bias adjustment, yielded a BC interval of [2.721701, 4.898724], excluding 0. The results from all three testing methods confirm that Hypothesis H2b is validated.
According to the results of Model 16, Density negatively affects GI (b = −13.742, p < 0.001). The results of Model 17 show that Density negatively affects Expenditure (b = −0.598, p < 0.001). In Model 18, both Density and Expenditure are included in the model for testing, and the result indicates that the coefficient for Expenditure is 6.997, which is significant at the 1% level. The Sobel test yielded a Z-value of 4.102 and a p-value of 0.00. The Bootstrap test, after bias adjustment, resulted in a BC interval of [−5.037176, −2.981522], excluding 0. The results from all three testing methods confirm that Hypothesis H2c is validated.
These findings indicate that R&D expenditure investment acts as a mediator in the relationship between corporate social networks (Deg, SH, and Density) and GI.

4.5. Moderation Effect Regression

Table 7 displays the regression results for the interaction effects of EID in the relationship between social network measures (Deg, SH, Density) and GI. To reduce multicollinearity in the interaction effect models, Deg, SH, Density, and EID were centered before calculating the interaction terms.
In Model 20, the coefficient for the interaction between Deg and EID (EID × Deg) is 945.898 (p < 0.01). It is significantly positive, indicating that EID positively moderates the relationship between Deg and GI. Hypothesis H4a is confirmed.
In Model 22, the coefficient for the interaction between SH and EID (EID × SH) is 8.035 (p < 0.01). It is significantly positive, suggesting that EID positively moderates the relationship between SH and GI. Hypothesis H4b is confirmed.
In Model 24, the coefficient for the interaction between Density and EID (EID × Density) is −7.564 (p < 0.01) and it is significantly negative. The main effect of Density on GI is also negative. This indicates that EID positively moderates the relationship between Density and GI. Hypothesis H4c is confirmed.
These results suggest that EID strengthens the relationship between corporate social networks (Deg, SH, and Density) and GI quality.

4.6. Robustness Checks

(1)
Replacing the dependent variable
The baseline regression model employed a fixed effects approach, controlling for year and firm effects, thus mitigating the endogeneity issues that might arise from omitted variables to some extent. However, it may still be susceptible to concerns of reverse causality, where firms with higher levels of GI might be more embedded in corporate social networks. Addressing bidirectional causality is therefore a crucial concern for this study. Based on previous research, green patent grants (grantedGI) were used as an alternative measure for the dependent variable GI [145,185].
According to the results of regression Models 25, 28, and 31 in Table 8, the main effects passed the test, confirming hypotheses H1a, H1b, and H1c.
Model 27 includes both Deg and Personnel in the model for testing. Based on the empirical results, the coefficient for Personnel is significantly positive at 0.123, while the coefficient for Deg is not significant. Hence, hypothesis H3a is not supported. The results of Models 28–31 and the Sobel tests demonstrate that the mediating effects of R&D personnel between SH/Density and GI are supported, thus validating hypotheses H3b and H3c.
The results of regression Model 36 in Table 9 indicate that both Deg and Expenditure are used in the model for testing. The coefficient of Expenditure is significantly positive at 3.607, while the coefficient of Deg is not significant. Hence, hypothesis H2a is not supported. However, the results of Models 37–42 and Sobel tests demonstrate that the mediating effects of R&D expenditure between SH/Density and GI passed the test, supporting hypotheses H2b and H2c.
According to Model 44 in Table 10, the interaction term between Deg and EID (EID × Deg) has a coefficient of 287.329 (p > 0. 1). The result is not significant. Therefore, the moderating effect of EID between Deg and GI does not pass the test, and so hypothesis 4a is not supported. However, the results of Models 45–48 demonstrate that the moderating effects of EID between SH/Density and GI passed the test, confirming hypotheses H4b and H4c.
(2)
Lagged Independent Variable
To further validate the robustness of the study results, this paper employs a lagged independent variable regression method, which can to some extent ensure causality. The results are presented in Table 11, and the test results show that the use of the lagged independent variable regression remains robust. This reaffirms that hypotheses H1a, H1b, and H1c are supported.
(3)
Instrumental Variable Method
Using the instrumental variable IV-2SLS regression approach, this study draws on the methods of Ferris et al. (2017) and other scholars [186]. The first step involves constructing the initial instrumental variable—the average social network metric in the region where the firm is located. This includes the regional average degree centrality (avgDeg), regional average structural holes (avgSH), and regional average network density (avgDen). Since listed companies within the same region face similar operating environments and competitive pressures, it is highly likely that the social network relations and characteristics of the target firm are affected by other companies in the same region. Therefore, this paper posits that a firm’s Deg, SH, and Density are positively correlated with the regional averages of these metrics (avgDeg, avgSH, avgDen). Typically, the individual characteristics of other firms do not impact the target firm’s decision-making and performance, making avgDeg, avgSH, and avgDen ideal instrumental variables for studying the relationship between social networks and GI.
Drawing on the methods of Chuluun et al. (2014) [187] and Feng et al. (2019) [188], this study constructs a second instrumental variable—the number of companies in the region where the firm is located (FirmNum). The greater the number of listed companies in a region, the higher the likelihood that the target firm will establish social network connections with other companies, potentially leading to lower connection tightness. Therefore, this paper posits that the firm’s Deg and SH are positively correlated with FirmNum, while Density is negatively correlated with it. Moreover, since the number of companies is an external indicator encompassing numerous listed companies across various industries within a region, the theoretical link between FirmNum and GI in firms is relatively weak. In summary, at least at the theoretical level, the two instrumental variables proposed in this paper are positively correlated with the firm’s social network characteristics and have no significant correlation with the firm’s GI. Therefore, avgDeg, avgSH, avgDen, and FirmNum meet the criteria for effective instrumental variable selection.
The IV-2SLS regression results are shown in Table 12. In the first-stage regression, the instrumental variables avgDeg and FirmNum are both significantly positively correlated with Deg at the 1% level. avgSH and FirmNum are both significantly positively correlated with SH at the 1% level. avgDen and FirmNum are both significantly positively correlated with Density at the 1% level, while FirmNum is significantly negatively correlated with Density at the 1% level.
In the second-stage regression, after controlling for endogeneity, the instrumented Deg still has a significant positive impact on GI at the 1% level, and the instrumented SH still has a significant positive impact on GI at the 1% level. The instrumented Density still has a significant negative impact on GI at the 1% level.
All IV-2SLS regression results are consistent with the conclusions of the baseline regression (Table 5), indicating that degree centrality and structural holes indeed positively promote GI, while network density negatively impacts GI. This further confirms the validity of hypotheses H1a, H1b, and H1c.
All models with validated hypotheses are shown in Figure 3.

5. Conclusions and Implications

5.1. Discussion

The main conclusions of this study are as follows:
Firstly, enterprise social network embeddedness plays a positive role in enhancing firms’ GI capabilities. Specifically, degree centrality and structural holes have positive effects on GI, while network density has a negative effect. This indicates that rich enterprise social networks bring greater green information advantages to firms. Higher degree centrality allows firms to occupy better power positions and broaden their sources of knowledge. Firms occupying structural holes can access more heterogeneous information resources through structural embedding. Organizations forming weak ties in low-density networks can acquire diversified and heterogeneous knowledge, establish deeper collaborative relationships with key partners, and acquire more novel and unique resources and information from these partners, thereby advancing GI projects more effectively.
Secondly, R&D expenditure mediates the impact of structural holes and network density on GI. Social network connections between firms can increase their willingness to invest in GI and reduce the risk associated with R&D investment decisions. Executives and directors, through their positions in structural holes, can access non-redundant resources from different companies and industries, such as R&D funds, technical support, or market information. These R&D funds can be effectively utilized to advance GI through high-level strategic integration. Low-density networks reduce information and resource redundancy, allowing firms to better identify and assess the most worthwhile GI projects, making R&D expenditure allocation and usage more direct and effective, and reducing uncertainty in the innovation process.
The reasons why R&D expenditure does not mediate the relationship between degree centrality and GI can be explained as follows: First, according to Cohen and Levinthal (1990)’s absorptive capacity theory [189], firms with stronger external networks are able to more effectively acquire and absorb external technological information, reducing their reliance on internal R&D investment. In the ICT industry, which exhibits strong technological spillovers, firms in central positions may rely on technology sharing within their social network, diminishing the need for internal R&D (for example, by directly adopting mature green technologies from partners), thus weakening the mediating effect of R&D expenditure. Moreover, firms with high degrees of centrality maintain extensive connections with many other nodes. Although it brings a wealth of resources and information flow, it may also lead to resource dispersion. In such cases, it may be difficult to concentrate R&D expenditure on specific GI projects, reducing its effectiveness. Additionally, high centrality might mean that firms face multiple collaboration opportunities and project demands, causing funds to be spread across several small projects. This fragmentation of funds may not provide sufficient support for any single GI project, thereby weakening the mediating effect of the R&D expenditure.
Thirdly, R&D personnel investment mediates the impact of structural holes and network density on GI. Companies in structural hole positions can acquire non-redundant information from other companies or groups that are not directly connected, allowing them to assess technological and market uncertainties. R&D personnel use this information to capture environmental technology trends, market demands, and policy trends, providing support for green innovation and reducing trial-and-error costs. ICT companies connect to different knowledge networks through structural holes, and R&D personnel optimize resource allocation through cross-organizational collaboration and information integration, efficiently applying scattered resources to green technology development. In low-density networks, companies can access more heterogeneous information sources, avoid information homogenization, and accurately identify high-value resources, thus avoiding redundant investments. R&D personnel transform diverse information into technical capabilities, focusing efforts on high-potential green projects.
The reason why R&D personnel investment does not mediate the effect of degree centrality on GI may be that companies in central positions typically acquire information from industry partners, where the information and resources are more redundant, making it difficult for R&D talent to access novel and diverse knowledge. In networks with high degrees of centrality, R&D talent faces numerous resource allocation decisions, and these resources may already be fixed in other areas, making it difficult to focus on GI.
Finally, EID strengthens the relationship between structural holes and network density with GI. Firms occupying structural holes hold strategic bridging positions in the network, allowing them to connect diverse resources and information sources. Through EID, firms can fill information gaps in structural holes and the enhance recognition of their GI capabilities among other network members. This transparency helps firms better utilize resources within structural holes and drive the realization of innovation achievements.
Firms with low network density help to maintain the diversity of information and knowledge, avoiding redundancy. EID increases transparency and information flow, enabling firms to better leverage diverse knowledge in the network. This fosters the creation of novel value and the implementation of GI. It also enhances the credibility of the firm’s collaborations with strategic partners, making other network members more willing to share unique knowledge and resources.
EID’s moderating effect between degree centrality and GI may not be robust because high-centrality companies are at the core of the network, with strong control and information access capabilities. They can already easily obtain information and resources within the network, so the marginal effect of additional information brought by EID on resource acquisition and reputation enhancement may be small, thus not significantly benefiting these companies’ GI.

5.2. Theoretical and Policy Implications

This study integrates network embeddedness theory and resource dependence theory to propose an analytical framework of “social network embedding—resource acquisition—green innovation quality”, making three major contributions to the theoretical boundaries. First, it refines social network embedding into a multidimensional measurement system comprising centrality, structural holes, and network density, breaking away from the traditional reliance on a single dimension of a network’s structure. This framework reveals the differential impact mechanisms of various network characteristics on resource acquisition paths (such as degree centrality strengthening resource control, structural holes facilitating the integration of heterogeneous knowledge, and low network density enhancing resource selection accuracy by reducing redundant information), thus deepening the explanatory power of network embeddedness theory in dynamic resource allocation contexts. Secondly, by verifying the dual mediating effects of R&D investment (expenditure and personnel), this study clarifies the micro-level realization path of the “resource transformation” element in resource dependence theory, converting abstract resource advantages into measurable innovation-driving factors and addressing the operationalization gap in the theory. Lastly, by introducing the quality of environmental information disclosure as a moderating variable, this study builds an analytical model of the interaction between institutional pressure and network resources, providing a new perspective for resource dependence theory in terms of acquiring external legitimacy and internal resource integration. This expands the theoretical understanding of the “institution–firm” symbiotic relationship in the field of green innovation. This framework offers a new analytical paradigm for future research on cross-level dynamic networks and asymmetric resource dependence relationships.
The research results offer management and policy implications for both enterprises and governments:
Firstly, enterprises should obtain higher degree centrality by actively participating in industry conferences, establishing strategic partnerships, and expanding their network connections with other companies. This will allow them to move toward the center of the network, gain more control over corporate discourse, and influence the dissemination of green information. Additionally, enterprises should enhance the richness of their structural holes in the network, bridging gaps to access heterogeneous information from different fields to provide more support for innovation activities. In practice, this can be achieved by participating in cross-industry cooperation projects, collaborating with research institutions, or forming partnerships with external experts in technology and environmental protection to acquire innovative outcomes and technologies from different fields. Lastly, enterprises should be cautious of the knowledge spillover risks caused by high network density, which may hinder green innovation. They should maintain weak ties with low network density and expand their external connections, especially by building relationships with companies from different industries or regions, in order to effectively access diversified green technologies and innovative ideas beyond their existing network.
However, enterprises may face some challenges when actively expanding their social networks. First, expanding the network may require substantial time and resources, which could lead to excessive resource dispersion, especially for small and medium-sized enterprises with limited resources. Second, when collaborating with other companies, enterprises may encounter cultural differences and managerial conflicts, which could affect the effectiveness of cooperation. Therefore, when expanding cooperation, enterprises should selectively choose suitable partners and focus on establishing long-term cooperative mechanisms and mutual trust to ensure the smooth advancement of green innovation.
From the government’s side, more channels and platforms should be provided to facilitate connections and communication between enterprises, thereby promoting collaboration. Specifically, the government can set up industry network platforms, organize cross-industry exchange activities, and create enterprise cooperation alliances to encourage information sharing and resource alignment between companies. These platforms can help enterprises break down industry barriers and improve collaboration efficiency in green innovation. For example, the government can push relevant departments to jointly organize green technology forums or policy support projects, attracting companies from different sectors to participate, share green innovation experiences, and showcase technological achievements. Additionally, the government can offer financial and policy support to help enterprises overcome the initial costs of cross-sector collaboration and lower the barriers to cooperation.
However, there are some challenges the government may face when implementing these measures. First, ensuring the fairness and transparency of these platforms is crucial to prevent large companies from dominating all the resources, leaving small companies with limited opportunities. Second, cooperation between enterprises may see issues of competition and trust in the early stages. The government needs to establish incentive mechanisms or provide third-party supervision to facilitate deeper cooperation between enterprises.
Secondly, enterprises should allocate more funds and talent to R&D, especially in green technologies and innovation projects. They should leverage their established social network advantages to collaborate with other companies, share resources, and exchange technologies with leading domestic and international firms.
Managers should adjust their R&D investment allocation strategies flexibly according to different network structures. For example, from a network density perspective, R&D expenditure should be concentrated on key collaborative projects. In high-centrality networks, expenditure should avoid excessive dispersion and focus on the most innovative projects to improve expenditure efficiency. It is crucial to recognize the innovation potential within structural holes and direct R&D expenditure towards GI projects that can fill these gaps. Additionally, companies should review their internal management mechanisms to ensure the effective management of R&D expenditure and optimal resource utilization.
In terms of R&D personnel investment, managers should establish efficient R&D teams, strengthen collaboration with universities and research institutes, and implement robust incentive mechanisms to stimulate employees’ innovative potential and team spirit, thereby enhancing the company’s GI capabilities and competitive advantage. Specifically, from the perspective of degree centrality, there should be a focus on positioning R&D personnel at key nodes within the social networks to maximize their mediating effect at central nodes. From the perspective of structural holes, it is necessary to prioritize recruiting R&D personnel with interdisciplinary backgrounds, provide cross-disciplinary training, and form cross-functional teams consisting of multiple R&D professionals. From the perspective of network density, it is necessary to increase the number of R&D personnel associated with core partners to enhance the effectiveness of collaborations and the depth of innovation.
The government can encourage enterprises to increase R&D investments through measures such as tax reductions, rewards, or subsidies. It should establish a series of policies to support GI, such as providing financial subsidies, lowering the barriers to the application of green technologies, and increasing funding support for GI projects to stimulate greater investment in and practice of environmental protection. Additionally, the government should enhance talent subsidies, recruitment incentives, and special funds to build innovation collaboration networks and support enterprises in attracting R&D talent.
Thirdly, enterprises should proactively disclose environmental information, including data on environmental protection measures, carbon emissions, and resource utilization efficiency, to ensure the authenticity and transparency of the information, thereby enhancing the company’s sense of social responsibility and reputation. By showcasing their GI methods and results to the public, companies can build a positive image of environmental responsibility, attract more investors, drive development, and increase company value.
Specifically, companies in central positions within the social networks should enhance their reputation through the proactive disclosure of environmental information and GI achievements to attract more collaboration opportunities and resource support. From the perspective of structural holes, companies should encourage cross-sector collaboration, using EID to attract partners from diverse fields and leverage unique external resources and knowledge to enhance the synergy of GI. From the perspective of network density, companies should use EID to avoid issues of information redundancy and knowledge homogeneity associated with high-density networks. They should focus on the breadth and depth of information flow to ensure that innovative thinking and resources are fully utilized. Managers should concentrate resources on key cooperative relationships and use EID to strengthen the quality and effectiveness of these collaborations, enabling the strategic allocation of resources to better leverage network diversity and avoid knowledge redundancy.
The government should establish and improve an EID system, deepen the disclosure details for different industries, actively formulate EID rules and regulatory frameworks, and encourage and strengthen the involvement of third-party EID rating agencies in oversight. It should guide companies to conduct substantive information disclosure, primarily focused on targeted data, and ensure that companies disclose information related to environmental protection in a timely and accurate manner. Additionally, the government can promote the establishment of cross-industry GI alliances, encouraging companies to collaborate and share information across different networks. This will enable companies to better leverage the synergies brought by EID and enhance overall GI capabilities.

6. Limitations and Future Research

This study has several limitations that provide directions for future research. Firstly, the sample of this study consisted of Chinese ICT industry listed companies in the Shanghai and Shenzhen stock exchanges. The industry classification was based on the “National Economic Industry Classification Standard” (GB/T4754-2011) published by the National Bureau of Statistics, defining the ICT industry as comprising three main sectors: information equipment manufacturing, software, and information transmission and information technology services. However, the heterogeneity of enterprise size and technology (such as hardware manufacturing versus software development) within these sectors was not specifically addressed. Future studies could explore how these factors affect the relationship between corporate social networks and GI, as well as investigate whether these findings can be generalized to other industries or non-listed companies.
Secondly, besides degree centrality, structural holes, and network density, other measures of corporate social networks, such as eigenvector, closeness centrality, and betweenness centrality, should be considered as variables in future research to explore their relationships with innovation.
Thirdly, this study delved into the rich connotations of GI quality. Future research could further deconstruct the core concept of GI and establish and compare more precise and detailed causal mechanisms under subdivided dimensions of the core explained variables, thereby enhancing the theoretical innovation in the study.
Fourthly, due to the lack of unified and authoritative enterprise-level EID data indicators in China, scholars determine the indicator system according to the needs of their respective research content, which introduces subjectivity. In future research, further discussion of the evaluation criteria for environmental information should be conducted to produce a more scientific and comprehensive evaluation system, ensuring more objective results of disclosure assessments.
Finally, this study was conducted in the context of China’s emerging market, and there are institutional differences between emerging markets and developed countries that may affect the universality of the conclusions. The regulatory environment, market maturity, and institutional frameworks in emerging markets, such as China, can differ significantly from those in developed countries. Therefore, the findings may not be directly applicable to firms in developed countries. Future research could explore whether and how these institutional differences influence the relationship between corporate social networks and green innovation across different countries and market contexts.

Author Contributions

Conceptualization, Y.W. and Z.L.; methodology, Y.W. and Z.L.; software, Y.W.; validation, Y.W.; formal analysis, Y.W. and Z.L.; resources, Y.W.; data curation, Y.W.; writing—original draft preparation, Y.W.; writing—review and editing, Z.L.; supervision, Z.L. All authors have read and agreed to the published version of the manuscript.

Funding

This research received no external funding.

Institutional Review Board Statement

Not applicable.

Informed Consent Statement

Not applicable.

Data Availability Statement

The datasets generated during and/or analyzed during the current study are not publicly available but are available from the corresponding author on reasonable request.

Conflicts of Interest

The authors declared no potential conflicts of interest with respect to the research, authorship, and/or publication of this article.

References

  1. Wang, Y.; Guo, C.; Chen, X.; Jia, L.; Guo, X.; Chen, R.; Zhang, M.; Chen, Z.; Wang, H. Carbon Peak and Carbon Neutrality in China: Goals, Implementation Path and Prospects. China Geol. 2021, 4, 720–746. [Google Scholar] [CrossRef]
  2. Wang, X.; Li, J.; Song, R.; Li, J. 350 Cities of China Exhibited Varying Degrees of Carbon Decoupling and Green Innovation Synergy. Energy Rep. 2022, 8, 312–323. [Google Scholar] [CrossRef]
  3. Qiu, Q.; Yu, J. Impact of Independent Director Network on Corporate Green Innovation: Evidence from Chinese Listed Companies. Corp. Soc. Responsib. Environ. Manag. 2023, 30, 3271–3293. [Google Scholar] [CrossRef]
  4. Berrone, P.; Fosfuri, A.; Gelabert, L.; Gomez-Mejia, L.R. Necessity as the Mother of ‘Green’ Inventions: Institutional Pressures and Environmental Innovations. Strateg. Manag. J. 2013, 34, 891–909. [Google Scholar] [CrossRef]
  5. Li, W.; Dai, H.; Zhao, L.; Zhao, D.; Sun, Y. Noise-Induced Consensus of Leader-Following Multi-Agent Systems. Math. Comput. Simul. 2023, 203, 1–11. [Google Scholar] [CrossRef]
  6. Fan, Y.; Liu, X.; Li, J.; Chang, T. A Miniaturized Circularly-Polarized Antenna for In-Body Wireless Communications. Micromachines 2019, 10, 70. [Google Scholar] [CrossRef]
  7. Afeltra, G.; Alerasoul, S.A.; Strozzi, F. The Evolution of Sustainable Innovation: From the Past to the Future. Eur. J. Innov. Manag. 2023, 26, 386–421. [Google Scholar] [CrossRef]
  8. Barforoush, N.; Etebarian, A.; Naghsh, A.; Shahin, A. Green Innovation a Strategic Resource to Attain Competitive Advantage. Int. J. Innov. Sci. 2021, 13, 645–663. [Google Scholar] [CrossRef]
  9. Huang, J.-W.; Li, Y.-H. Green Innovation and Performance: The View of Organizational Capability and Social Reciprocity. J. Bus. Ethics 2017, 145, 309–324. [Google Scholar] [CrossRef]
  10. Xie, J.; Abbass, K.; Li, D. Advancing Eco-Excellence: Integrating Stakeholders’ Pressures, Environmental Awareness, and Ethics for Green Innovation and Performance. J. Environ. Manag. 2024, 352, 120027. [Google Scholar] [CrossRef]
  11. Ullah, S.; Ahmad, T.; Lyu, B.; Sami, A.; Kukreti, M.; Yvaz, A. Integrating External Stakeholders for Improvement in Green Innovation Performance: Role of Green Knowledge Integration Capability and Regulatory Pressure. Int. J. Innov. Sci. 2024, 16, 640–657. [Google Scholar] [CrossRef]
  12. Xu, J.; Hu, W. How Do External Resources Influence a Firm’s Green Innovation? A Study Based on Absorptive Capacity. Econ. Model. 2024, 133, 106660. [Google Scholar] [CrossRef]
  13. Zheng, Y.; Wang, B.; Sun, X.; Li, X. ESG Performance and Corporate Value: Analysis from the Stakeholders’ Perspective. Front. Environ. Sci. 2022, 10, 1084632. [Google Scholar] [CrossRef]
  14. Li, Z.; Zhang, T.; Zhao, X.; Zhu, Y. Monitoring or Colluding? Institutional Investors’ Heterogeneity and Environmental Information Disclosure Behavior. Front. Psychol. 2022, 13, 911901. [Google Scholar] [CrossRef]
  15. Burt, R.S. A Note on Social Capital and Network Content. Soc. Netw. 1997, 19, 355–373. [Google Scholar] [CrossRef]
  16. Gu, W.; Yuan, W. Research on the Influence of Chain Shareholder Network on Enterprise Green Innovation. J. Bus. Res. 2024, 172, 114416. [Google Scholar] [CrossRef]
  17. Cheng, J.; Xu, N.R.; Khan, N.U.; Singh, H.S.M. The Impacts of Artificial Intelligence Literacy, Green Absorptive Capacity, and Green Information System on Green Innovation. Corp. Soc. Responsib. Environ. Manag. 2025, 32, 2375–2389. [Google Scholar] [CrossRef]
  18. Amaranti, R.; Govindaraju, R.; Irianto, D. Do Green Dynamic Capabilities and Absorptive Capacity Affect Green Innovation Performance? A Study on Companies in Indonesia. J. Ind. Eng. Manag. 2024, 17, 424–444. [Google Scholar] [CrossRef]
  19. Liao, Z.; Wu, Y. CEO Background Experience and Firms’ Environmental Innovation: The Moderating Effect of Tenure. Corp. Soc. Responsib. Environ. Manag. 2024, 31, 5801–5814. [Google Scholar] [CrossRef]
  20. Guo, R.; Zhao, J. CEO’s Financial Background and Corporate Green Innovation. Sustainability 2024, 16, 4129. [Google Scholar] [CrossRef]
  21. Pan, J.; Bao, H.; Cifuentes-Faura, J.; Liu, X. CEO’s IT Background and Continuous Green Innovation of Enterprises: Evidence from China. Sustain. Account. Manag. Policy J. 2024, 15, 807–832. [Google Scholar] [CrossRef]
  22. Zhang, Y.; Wu, J.; Chen, M. The Influence of Executives’ Education Background on Corporate Green Innovation: A Dual Perspective of Risk Bearing and Social Responsibility. Sustainability 2024, 16, 8382. [Google Scholar] [CrossRef]
  23. Cheng, P.; Zhang, J.; Chen, J.; Zheng, Y.; Li, Z. Stakeholder Attention and Ambidextrous Green Innovation: Evidence from China. Bus. Strategy Environ. 2025, 34, 1007–1026. [Google Scholar] [CrossRef]
  24. Ma, Y.; Chen, B. Impact of Stakeholder Pressure on Green Innovation: A Moderated Mediation Model. J. Environ. Plan. Manag. 2025, 68, 1165–1186. [Google Scholar] [CrossRef]
  25. Zhao, Z.; Zhao, Y.; Lv, X.; Li, X.; Zheng, L.; Fan, S.; Zuo, S. Environmental Regulation and Green Innovation: Does State Ownership Matter? Energy Econ. 2024, 136, 107762. [Google Scholar] [CrossRef]
  26. Song, W.; Han, X.; Liu, Q. Patterns of Environmental Regulation and Green Innovation in China. Struct. Change Econ. Dyn. 2024, 71, 176–192. [Google Scholar] [CrossRef]
  27. Zhang, X.; Zhao, W.; Xie, D. Environmental Regulation, Academic Top Managers and Green Innovation: Evidence from China. Financ. Res. Lett. 2024, 69, 106129. [Google Scholar] [CrossRef]
  28. Fang, X.; Liu, M.; Li, G. Can the Green Credit Policy Promote Green Innovation in Enterprises? Empirical Evidence from China. Technol. Econ. Dev. Econ. 2024, 30, 899–932. [Google Scholar] [CrossRef]
  29. Li, W.; Cheng, H.; He, J.; Song, Y.; Bu, H. The Impacts of Green Credit Policy on Green Innovation of High-Polluting Enterprises in China. Financ. Res. Lett. 2024, 62, 105167. [Google Scholar] [CrossRef]
  30. He, J.; Xue, H.; Yang, W.; Zhong, Y.; Fan, B. Green Credit Policy and Corporate Green Innovation. Int. Rev. Econ. Financ. 2025, 99, 104031. [Google Scholar] [CrossRef]
  31. Duan, Y.; Xi, B.; Xu, X.; Xuan, S. The Impact of Government Subsidies on Green Innovation Performance in New Energy Enterprises: A Digital Transformation Perspective. Int. Rev. Econ. Financ. 2024, 94, 103414. [Google Scholar] [CrossRef]
  32. Han, F.; Mao, X.; Yu, X.; Yang, L. Government Environmental Protection Subsidies and Corporate Green Innovation: Evidence from Chinese Microenterprises. J. Innov. Knowl. 2024, 9, 100458. [Google Scholar] [CrossRef]
  33. Zhao, S.; Abbassi, W.; Hunjra, A.I.; Zhang, H. How Do Government R&D Subsidies Affect Corporate Green Innovation Choices? Perspectives from Strategic and Substantive Innovation. Int. Rev. Econ. Financ. 2024, 93, 1378–1396. [Google Scholar] [CrossRef]
  34. Chen, W.; Zhu, C.; Cheung, Q.; Wu, S.; Zhang, J.; Cao, J. How Does Digitization Enable Green Innovation? Evidence from Chinese Listed Companies. Bus. Strategy Environ. 2024, 33, 3832–3854. [Google Scholar] [CrossRef]
  35. Fang, L.; Li, Z. Corporate Digitalization and Green Innovation: Evidence from Textual Analysis of Firm Annual Reports and Corporate Green Patent Data in China. Bus. Strategy Environ. 2024, 33, 3936–3964. [Google Scholar] [CrossRef]
  36. Zhang, K.; Deborah, G. Digitalization, Internationalization and Green Innovation in China: An Analysis Based on Threshold and Mediation Effects. J. Technol. Transf. 2024. [Google Scholar] [CrossRef]
  37. Zhao, J.; Zhao, L.; Yan, T. Does Interlocking Directors’ Green Experience Richness Enhance the Green Innovation Efficiency of Chinese Listed Companies? Sustainability 2025, 17, 2122. [Google Scholar] [CrossRef]
  38. Hu, Y.; Li, Z.; Guo, J. Does Independent Directors’ Interlocking Network Position Affect Green Innovation? Sustainability 2024, 16, 1089. [Google Scholar] [CrossRef]
  39. Yousaf, U.B.; Ullah, I.; Jiang, J.; Wang, M. The Role of Board Capital in Driving Green Innovation: Evidence from China. J. Behav. Exp. Financ. 2022, 35, 100714. [Google Scholar] [CrossRef]
  40. Ren, S.; Wang, Y.; Hu, Y.; Yan, J. CEO Hometown Identity and Firm Green Innovation. Bus. Strategy Environ. 2021, 30, 756–774. [Google Scholar] [CrossRef]
  41. Quan, X.; Ke, Y.; Qian, Y.; Zhang, Y. CEO Foreign Experience and Green Innovation: Evidence from China. J. Bus. Ethics 2023, 182, 535–557. [Google Scholar] [CrossRef]
  42. Huang, M.; Li, M.; Liao, Z. Do Politically Connected CEOs Promote Chinese Listed Industrial Firms’ Green Innovation? The Mediating Role of External Governance Environments. J. Clean. Prod. 2021, 278, 123634. [Google Scholar] [CrossRef]
  43. Li, G.; Xue, Q.; Qin, J. Environmental Information Disclosure and Green Technology Innovation: Empirical Evidence from China. Technol. Forecast. Soc. Chang. 2022, 176, 121453. [Google Scholar] [CrossRef]
  44. Feng, E.; Siu, Y.L.; Wong, C.W.; Li, S.; Miao, X. Can Environmental Information Disclosure Spur Corporate Green Innovation? Sci. Total Environ. 2024, 912, 169076. [Google Scholar] [CrossRef]
  45. Liao, Z.; Liu, P.; Bao, P. Environmental Information Disclosure, Environmental Innovation, and Firms’ Growth Performances: The Moderating Role of Media Attention. Sustain. Dev. 2024, 32, 425–437. [Google Scholar] [CrossRef]
  46. Ding, J.; Lu, Z.; Yu, C.-H. Environmental Information Disclosure and Firms’ Green Innovation: Evidence from China. Int. Rev. Econ. Financ. 2022, 81, 147–159. [Google Scholar] [CrossRef]
  47. Rauf, F.; Wanqiu, W.; Naveed, K.; Zhang, Y. Green R & D Investment, ESG Reporting, and Corporate Green Innovation Performance. PLoS ONE 2024, 19, e0299707. [Google Scholar] [CrossRef]
  48. Xu, J.; Liu, F.; Shang, Y. R&D Investment, ESG Performance and Green Innovation Performance: Evidence from China. Kybernetes 2021, 50, 737–756. [Google Scholar] [CrossRef]
  49. Fan, J.; Teo, T. Will China’s R&D Investment Improve Green Innovation Performance? An Empirical Study. Env. Sci. Pollut. Res. 2022, 29, 39331–39344. [Google Scholar] [CrossRef]
  50. Fracassi, C.; Tate, G. External Networking and Internal Firm Governance. J. Financ. 2012, 67, 153–194. [Google Scholar] [CrossRef]
  51. Larcker, D.F.; So, E.C.; Wang, C.C. Boardroom Centrality and Firm Performance. J. Account. Econ. 2013, 55, 225–250. [Google Scholar] [CrossRef]
  52. Conyon, M.J.; Muldoon, M.R. The Small World of Corporate Boards. Bus. Financ. Account. 2006, 33, 1321–1343. [Google Scholar] [CrossRef]
  53. Cai, Y.; Sevilir, M. Board Connections and M&A Transactions. J. Financ. Econ. 2012, 103, 327–349. [Google Scholar] [CrossRef]
  54. Peng, M.W.; Luo, Y. Managerial Ties and Firm Performance in a Transition Economy: The Nature of a Micro-Macro Link. Acad. Manag. J. 2000, 43, 486–501. [Google Scholar] [CrossRef]
  55. Zaheer, A.; Bell, G.G. Benefiting from Network Position: Firm Capabilities, Structural Holes, and Performance. Strateg. Manag. J. 2005, 26, 809–825. [Google Scholar] [CrossRef]
  56. Powell, W.W.; Koput, K.W.; Smith-Doerr, L. Interorganizational Collaboration and the Locus of Innovation: Networks of Learning in Biotechnology. Adm. Sci. Q. 1996, 41, 116–145. [Google Scholar] [CrossRef]
  57. Zhang, J.; Luo, Y. Degree Centrality, Betweenness Centrality, and Closeness Centrality in Social Network. In Proceedings of the 2017 2nd International Conference on Modelling, Simulation and Applied Mathematics (MSAM2017), Bangkok, Thailand, 26–27 March 2017; Atlantis Press: Dordrecht, The Netherlands, 2017; pp. 300–303. [Google Scholar]
  58. Tsai, W. Knowledge transfer in intraorganizational networks: Effects of network position and absorptive capacity on business unit innovation and performance. Acad. Manag. J. 2001, 44, 996–1004. [Google Scholar] [CrossRef]
  59. Freeman, L.C. Centrality in Social Networks: Conceptual Clarification. Soc. Netw. Crit. Concepts Sociol. 2002, 1, 238–263. [Google Scholar] [CrossRef]
  60. Ahuja, G. Collaboration Networks, Structural Holes, and Innovation: A Longitudinal Study. Adm. Sci. Q. 2000, 45, 425–455. [Google Scholar] [CrossRef]
  61. Burt, R.S. The Contingent Value of Social Capital. Adm. Sci. Q. 1997, 42, 339–365. [Google Scholar] [CrossRef]
  62. Burt, R.S. The Social Structure of Competition. In Structural Holes: The Social Structure of Competition; Harvard University Press: Cambridge, MA, USA, 1995. [Google Scholar] [CrossRef]
  63. Zinkhan, G.M.; Reingen, P.H. Book Review: Structural Holes: The Social Structure of Competition; SAGE Publications Sage CA: Los Angeles, CA, USA, 1994. [Google Scholar]
  64. Hua, L.; Yang, Z.; Shao, J. Impact of Network Density on the Efficiency of Innovation Networks: An Agent-Based Simulation Study. PLoS ONE 2022, 17, e0270087. [Google Scholar] [CrossRef]
  65. Wang, C.; Rodan, S.; Fruin, M.; Xu, X. Knowledge Networks, Collaboration Networks, and Exploratory Innovation. Acad. Manag. J. 2014, 57, 484–514. [Google Scholar] [CrossRef]
  66. Gnyawali, D.R.; Madhavan, R. Cooperative Networks and Competitive Dynamics: A Structural Embeddedness Perspective. Acad. Manag. Rev. 2001, 26, 431–445. [Google Scholar] [CrossRef]
  67. Barney, J. Firm Resources and Sustained Competitive Advantage. J. Manag. 1991, 17, 99–120. [Google Scholar] [CrossRef]
  68. Bodin, Ö.; Crona, B.I. The Role of Social Networks in Natural Resource Governance: What Relational Patterns Make a Difference? Glob. Environ. Change 2009, 19, 366–374. [Google Scholar] [CrossRef]
  69. Dangelico, R.M. Green Product Innovation: Where We Are and Where We Are Going. Bus. Strategy Environ. 2016, 25, 560–576. [Google Scholar] [CrossRef]
  70. Song, M.; Yang, M.X.; Zeng, K.J.; Feng, W. Green Knowledge Sharing, Stakeholder Pressure, Absorptive Capacity, and Green Innovation: Evidence from Chinese Manufacturing Firms. Bus. Strategy Environ. 2020, 29, 1517–1531. [Google Scholar] [CrossRef]
  71. Henriksen, L.F.; Ponte, S. Public Orchestration, Social Networks, and Transnational Environmental Governance: Lessons from the Aviation Industry. Regul. Gov. 2018, 12, 23–45. [Google Scholar] [CrossRef]
  72. Nassani, A.A.; Javed, A.; Radulescu, M.; Yousaf, Z.; Secara, C.G.; Tolea, C. Achieving Green Innovation in Energy Industry through Social Networks, Green Dynamic Capabilities, and Green Organizational Culture. Energies 2022, 15, 5925. [Google Scholar] [CrossRef]
  73. Chuluun, T.; Prevost, A.; Upadhyay, A. Firm Network Structure and Innovation. J. Corp. Financ. 2017, 44, 193–214. [Google Scholar] [CrossRef]
  74. Steinfield, C.; Scupola, A.; López-Nicolás, C. Social Capital, ICT Use and Company Performance: Findings from the Medicon Valley Biotech Cluster. Technol. Forecast. Soc. Chang. 2010, 77, 1156–1166. [Google Scholar] [CrossRef]
  75. Kim, H.-S. How a Firm’s Position in a Whole Network Affects Innovation Performance. Technol. Anal. Strateg. Manag. 2019, 31, 155–168. [Google Scholar] [CrossRef]
  76. Mazzola, E.; Perrone, G. A Strategic Needs Perspective on Operations Outsourcing and Other Inter-Firm Relationships. Int. J. Prod. Econ. 2013, 144, 256–267. [Google Scholar] [CrossRef]
  77. Liu, T.; Wang, Q.; Yang, S.; Shi, Q. The Impact of Shareholder and Director Networks on Corporate Technological Innovation: A Multilayer Networks Analysis. Systems 2024, 12, 41. [Google Scholar] [CrossRef]
  78. Ramia, G.; Patulny, R.; Marston, G.; Cassells, K. The Relationship between Governance Networks and Social Networks: Progress, Problems and Prospects. Political Stud. Rev. 2018, 16, 331–341. [Google Scholar] [CrossRef]
  79. González-Moreno, Á.; Triguero, Á.; Sáez-Martínez, F.J. Many or Trusted Partners for Eco-Innovation? The Influence of Breadth and Depth of Firms’ Knowledge Network in the Food Sector. Technol. Forecast. Soc. Chang. 2019, 147, 51–62. [Google Scholar] [CrossRef]
  80. Martin-Rios, C.; Erhardt, N. Small Business Activity and Knowledge Exchange in Informal Interfirm Networks. Int. Small Bus. J. 2017, 35, 285–305. [Google Scholar] [CrossRef]
  81. Burt, R.S.; Kilduff, M.; Tasselli, S. Social Network Analysis: Foundations and Frontiers on Advantage. Annu. Rev. Psychol. 2013, 64, 527–547. [Google Scholar] [CrossRef]
  82. Marlow, S.; McAdam, M. Incubation or Induction? Gendered Identity Work in the Context of Technology Business Incubation. Entrep. Theory Pract. 2015, 39, 791–816. [Google Scholar] [CrossRef]
  83. Thomaz, F.; Swaminathan, V. What Goes around Comes around: The Impact of Marketing Alliances on Firm Risk and the Moderating Role of Network Density. J. Mark. 2015, 79, 63–79. [Google Scholar] [CrossRef]
  84. Tortoriello, M.; McEvily, B.; Krackhardt, D. Being a Catalyst of Innovation: The Role of Knowledge Diversity and Network Closure. Organ. Sci. 2015, 26, 423–438. [Google Scholar] [CrossRef]
  85. Li, X.; Liu, X. The Impact of the Collaborative Innovation Network Embeddedness on Enterprise Green Innovation Performance. Front. Environ. Sci. 2023, 11, 1190697. [Google Scholar] [CrossRef]
  86. Wang, H.; Zhao, J.; Li, Y.; Li, C. Network Centrality, Organizational Innovation, and Performance: A Meta-analysis. Can. J. Adm. Sci. 2015, 32, 146–159. [Google Scholar] [CrossRef]
  87. Bloodgood, J.M.; Hornsby, J.S.; Rutherford, M.; McFarland, R.G. The Role of Network Density and Betweenness Centrality in Diffusing New Venture Legitimacy: An Epidemiological Approach. Int. Entrep. Manag. J. 2017, 13, 525–552. [Google Scholar] [CrossRef]
  88. Swaminathan, V.; Moorman, C. Marketing Alliances, Firm Networks, and Firm Value Creation. J. Mark. 2009, 73, 52–69. [Google Scholar] [CrossRef]
  89. McFadyen, M.A.; Semadeni, M.; Cannella, A.A. Value of Strong Ties to Disconnected Others: Examining Knowledge Creation in Biomedicine. Organ. Sci. 2009, 20, 552–564. [Google Scholar] [CrossRef]
  90. Wen, J.; Qualls, W.J.; Zeng, D. To Explore or Exploit: The Influence of Inter-Firm R&D Network Diversity and Structural Holes on Innovation Outcomes. Technovation 2021, 100, 102178. [Google Scholar] [CrossRef]
  91. Yang, J.; Yu, G.; Liu, M.; Rui, M. Improving Learning Alliance Performance for Manufacturers: Does Knowledge Sharing Matter? Int. J. Prod. Econ. 2016, 171, 301–308. [Google Scholar] [CrossRef]
  92. Parra-Requena, G.; Ruiz-Ortega, M.J.; García-Villaverde, P.M.; Rodrigo-Alarcón, J. The Mediating Role of Knowledge Acquisition on the Relationship Between External Social Capital and Innovativeness. Eur. Manag. Rev. 2015, 12, 149–169. [Google Scholar] [CrossRef]
  93. Roper, S.; Love, J.H.; Bonner, K. Firms’ Knowledge Search and Local Knowledge Externalities in Innovation Performance. Res. Policy 2017, 46, 43–56. [Google Scholar] [CrossRef]
  94. Cheng, C.C.J.; Hsu, S.-H.; Sheu, C. How Can Green Innovation from Manufacturers Benefit from Supplier Networks? SCM 2023, 28, 559–575. [Google Scholar] [CrossRef]
  95. Rogan, M.; Mors, M.L. A Network Perspective on Individual-Level Ambidexterity in Organizations. Organ. Sci. 2014, 25, 1860–1877. [Google Scholar] [CrossRef]
  96. Opper, S.; Burt, R.S. Social Network and Temporal Myopia. AMJ 2021, 64, 741–771. [Google Scholar] [CrossRef]
  97. Coccia, M. What Is the Optimal Rate of R&D Investment to Maximize Productivity Growth? Technol. Forecast. Soc. Chang. 2009, 76, 433–446. [Google Scholar] [CrossRef]
  98. Dalziel, T.; Gentry, R.J.; Bowerman, M. An Integrated Agency–Resource Dependence View of the Influence of Directors’ Human and Relational Capital on Firms’ R&D Spending. J Manag. Stud. 2011, 48, 1217–1242. [Google Scholar] [CrossRef]
  99. Knight, F.H. Risk, Uncertainty, and Profit. In The Economic Nature of the Firm; Cambridge University Press: Cambridge, UK, 2009. [Google Scholar] [CrossRef]
  100. Simon, H.; March, J. Administrative Behavior and Organizations. In Organizational Behavior 2; Routledge: London, UK, 2015; pp. 41–59. [Google Scholar]
  101. Nahapiet, J.; Ghoshal, S. Social Capital, Intellectual Capital, and the Organizational Advantage. Acad. Manag. Rev. 1998, 23, 242. [Google Scholar] [CrossRef]
  102. Rusanen, H.; Halinen, A.; Jaakkola, E. Accessing Resources for Service Innovation–the Critical Role of Network Relationships. J. Serv. Manag. 2014, 25, 2–29. [Google Scholar] [CrossRef]
  103. Inkpen, A.C.; Tsang, E.W.K. Social Capital, Networks, and Knowledge Transfer. AMR 2005, 30, 146–165. [Google Scholar] [CrossRef]
  104. Peng, H.; Shen, N.; Liao, H.; Wang, Q. Multiple Network Embedding, Green Knowledge Integration and Green Supply Chain Performance——Investigation Based on Agglomeration Scenario. J. Clean. Prod. 2020, 259, 120821. [Google Scholar] [CrossRef]
  105. Iyer, S.R.; Sankaran, H.; Hoffman, J. The Relationship between Director Centrality and R&D Investment: High-Tech Firms and Non-High-Tech Firms. Editor. Policy 2020, 32, 255–273. [Google Scholar]
  106. Helmers, C.; Patnam, M.; Rau, P.R. Do Board Interlocks Increase Innovation? Evidence from a Corporate Governance Reform in India. J. Bank. Financ. 2017, 80, 51–70. [Google Scholar] [CrossRef]
  107. Zhang, Y.; Chen, H.; He, Z. Environmental Regulation, R&D Investment, and Green Technology Innovation in China: Based on the PVAR Model. PLoS ONE 2022, 17, e0275498. [Google Scholar] [CrossRef]
  108. Sánchez-Sellero, P.; Bataineh, M.J. How R&D Cooperation, R&D Expenditures, Public Funds and R&D Intensity Affect Green Innovation? Technol. Anal. Strateg. Manag. 2022, 34, 1095–1108. [Google Scholar] [CrossRef]
  109. Sueyoshi, T.; Goto, M. Can Environmental Investment and Expenditure Enhance Financial Performance of US Electric Utility Firms under the Clean Air Act Amendment of 1990? Energy Policy 2009, 37, 4819–4826. [Google Scholar] [CrossRef]
  110. Sánchez-Sellero, P.; Rosell-Martínez, J.; García-Vázquez, J.M. Absorptive Capacity from Foreign Direct Investment in Spanish Manufacturing Firms. Int. Bus. Rev. 2014, 23, 429–439. [Google Scholar] [CrossRef]
  111. Kim, T.H.; Kim, B. Firm’s Environmental Expenditure, R&D Intensity, and Profitability. Sustainability 2018, 10, 2071. [Google Scholar] [CrossRef]
  112. Bronzini, R.; Piselli, P. Determinants of Long-Run Regional Productivity with Geographical Spillovers: The Role of R&D, Human Capital and Public Infrastructure. Reg. Sci. Urban Econ. 2009, 39, 187–199. [Google Scholar] [CrossRef]
  113. Subramaniam, M.; Youndt, M.A. The Influence of Intellectual Capital on the Types of Innovative Capabilities. AMJ 2005, 48, 450–463. [Google Scholar] [CrossRef]
  114. Hora, M.; Klassen, R.D. Learning from Others’ Misfortune: Factors Influencing Knowledge Acquisition to Reduce Operational Risk. J. Oper. Manag. 2013, 31, 52–61. [Google Scholar] [CrossRef]
  115. Cao, Y.; Dhaliwal, D.; Li, Z.; Yang, Y.G. Are All Independent Directors Equally Informed? Evidence Based on Their Trading Returns and Social Networks. Manag. Sci. 2015, 61, 795–813. [Google Scholar] [CrossRef]
  116. Lin, Z.; Yang, H.; Arya, B. Alliance Partners and Firm Performance: Resource Complementarity and Status Association. Strateg. Manag. J. 2009, 30, 921–940. [Google Scholar] [CrossRef]
  117. Polidoro, F.; Ahuja, G.; Mitchell, W. When the Social Structure Overshadows Competitive Incentives: The Effects of Network Embeddedness on Joint Venture Dissolution. AMJ 2011, 54, 203–223. [Google Scholar] [CrossRef]
  118. Ahuja, G.; Polidoro, F.; Mitchell, W. Structural Homophily or Social Asymmetry? The Formation of Alliances by Poorly Embedded Firms. Strateg. Manag. J. 2009, 30, 941–958. [Google Scholar] [CrossRef]
  119. Mazzola, E.; Perrone, G.; Kamuriwo, D.S. Network Embeddedness and New Product Development in the Biopharmaceutical Industry: The Moderating Role of Open Innovation Flow. Int. J. Prod. Econ. 2015, 160, 106–119. [Google Scholar] [CrossRef]
  120. Guler, I.; Guillén, M.F. Home Country Networks and Foreign Expansion: Evidence from the Venture Capital Industry. AMJ 2010, 53, 390–410. [Google Scholar] [CrossRef]
  121. Yang, H.; Lin, Z.; Lin, Y. A Multilevel Framework of Firm Boundaries: Firm Characteristics, Dyadic Differences, and Network Attributes. Strateg. Manag. J. 2010, 31, 237–261. [Google Scholar] [CrossRef]
  122. Jensen, M. The Use of Relational Discrimination to Manage Market Entry: When Do Social Status and Structural Holes Work Against You? AMJ 2008, 51, 723–743. [Google Scholar] [CrossRef]
  123. Koka, B.R.; Prescott, J.E. Designing Alliance Networks: The Influence of Network Position, Environmental Change, and Strategy on Firm Performance. Strateg. Manag. J. 2008, 29, 639–661. [Google Scholar] [CrossRef]
  124. Faems, D.; De Visser, M.; Andries, P.; Van Looy, B. Technology Alliance Portfolios and Financial Performance: Value-Enhancing and Cost-Increasing Effects of Open Innovation. J. Prod. Innov. Manag. 2010, 27, 785–796. [Google Scholar] [CrossRef]
  125. Wassmer, U.; Li, S.; Madhok, A. Resource Ambidexterity through Alliance Portfolios and Firm Performance. Strateg. Manag. J. 2017, 38, 384–394. [Google Scholar] [CrossRef]
  126. Wang, M.; Lin, H.; Huang, Y. Structural Holes and R&D Investment: Evidence from Top Management Teams of China’s A-Share Listed Firms. Appl. Econ. 2021, 53, 4985–4999. [Google Scholar] [CrossRef]
  127. Hao, J.; Li, C.; Yuan, R.; Ahmed, M.; Khan, M.A.; Oláh, J. The Influence of the Knowledge-Based Network Structure Hole on Enterprise Innovation Performance: The Threshold Effect of R&D Investment Intensity. Sustainability 2020, 12, 6155. [Google Scholar] [CrossRef]
  128. Burt, R.S. Structural Holes and Good Ideas. Am. J. Sociol. 2004, 110, 349–399. [Google Scholar] [CrossRef]
  129. Brüderl, J.; Preisendörfer, P.; Ziegler, R. Survival Chances of Newly Founded Business Organizations. Am. Sociol. Rev. 1992, 57, 227–242. [Google Scholar] [CrossRef]
  130. Tortoriello, M. The Social Underpinnings of Absorptive Capacity: The Moderating Effects of Structural Holes on Innovation Generation Based on External Knowledge. Strateg. Manag. J. 2015, 36, 586–597. [Google Scholar] [CrossRef]
  131. Rosenkopf, L.; Almeida, P. Overcoming Local Search Through Alliances and Mobility. Manag. Sci. 2003, 49, 751–766. [Google Scholar] [CrossRef]
  132. Rosenkopf, L.; Nerkar, A. Beyond Local Search: Boundary-spanning, Exploration, and Impact in the Optical Disk Industry. Strateg. Manag. J. 2001, 22, 287–306. [Google Scholar] [CrossRef]
  133. Gilsing, V.; Nooteboom, B.; Vanhaverbeke, W.; Duysters, G.; Van Den Oord, A. Network Embeddedness and the Exploration of Novel Technologies: Technological Distance, Betweenness Centrality and Density. Res. Policy 2008, 37, 1717–1731. [Google Scholar] [CrossRef]
  134. Gilsing, V.; Nooteboom, B. Density and Strength of Ties in Innovation Networks: An Analysis of Multimedia and Biotechnology. Eur. Manag. Rev. 2005, 2, 179–197. [Google Scholar] [CrossRef]
  135. Carnabuci, G.; Operti, E. Where Do Firms’ Recombinant Capabilities Come from? Intraorganizational Networks, Knowledge, and Firms’ Ability to Innovate through Technological Recombination. Strateg. Manag. J. 2013, 34, 1591–1613. [Google Scholar] [CrossRef]
  136. Coleman, J.S. Social Capital in the Creation of Human Capital. Am. J. Sociol. 1988, 94, S95–S120. [Google Scholar] [CrossRef]
  137. Kraatz, M.S. Learning by association? Interorganizational networks and adaptation to environmental change. Acad. Manag. J. 1998, 41, 621–643. [Google Scholar] [CrossRef]
  138. Gulati, R.; Nohria, N.; Zaheer, A. Strategic Networks. Strateg. Manag. J. 2000, 21, 203–215. [Google Scholar] [CrossRef]
  139. Duysters, G.; Lemmens, C. Alliance Group Formation Enabling and Constraining Effects of Embeddedness and Social Capital in Strategic Technology Alliance Networks. Int. Stud. Manag. Organ. 2003, 33, 49–68. [Google Scholar] [CrossRef]
  140. Nooteboom, B. Interfirm Alliances: International Analysis and Design; Routledge: London, UK, 2008. [Google Scholar]
  141. Afuah, A. Are Network Effects Really All about Size? The Role of Structure and Conduct. Strateg. Manag. J. 2013, 34, 257–273. [Google Scholar] [CrossRef]
  142. Oh, H.; Labianca, G.; Chung, M.-H. A Multilevel Model of Group Social Capital. AMR 2006, 31, 569–582. [Google Scholar] [CrossRef]
  143. Batjargal, B.; Hitt, M.A.; Tsui, A.S.; Arregle, J.-L.; Webb, J.W.; Miller, T.L. Institutional Polycentrism, Entrepreneurs’ Social Networks, and New Venture Growth. AMJ 2013, 56, 1024–1049. [Google Scholar] [CrossRef]
  144. Wang, Y.; Delgado, M.S.; Khanna, N.; Bogan, V.L. Good News for Environmental Self-Regulation? Finding the Right Link. J. Environ. Econ. Manag. 2019, 94, 217–235. [Google Scholar] [CrossRef]
  145. Lu, Z.; Li, H. Does Environmental Information Disclosure Affect Green Innovation? Econ. Anal. Policy 2023, 80, 47–59. [Google Scholar] [CrossRef]
  146. Wang, L.; Li, M.; Wang, W.; Gong, Y.; Xiong, Y. Green Innovation Output in the Supply Chain Network with Environmental Information Disclosure: An Empirical Analysis of Chinese Listed Firms. Int. J. Prod. Econ. 2023, 256, 108745. [Google Scholar] [CrossRef]
  147. Fama, E.F.; Jensen, M.C. Separation of Ownership and Control. J. Law Econ. 1983, 26, 301–325. [Google Scholar] [CrossRef]
  148. Zhang, S.; Zhang, M.; Qiao, Y.; Li, X.; Li, S. Does Improvement of Environmental Information Transparency Boost Firms’ Green Innovation? Evidence from the Air Quality Monitoring and Disclosure Program in China. J. Clean. Prod. 2022, 357, 131921. [Google Scholar] [CrossRef]
  149. Zhang, Z.; Su, Z.; Wang, K.; Zhang, Y. Corporate Environmental Information Disclosure and Stock Price Crash Risk: Evidence from Chinese Listed Heavily Polluting Companies. Energy Econ. 2022, 112, 106116. [Google Scholar] [CrossRef]
  150. Xiang, X.; Liu, C.; Yang, M.; Zhao, X. Confession or Justification: The Effects of Environmental Disclosure on Corporate Green Innovation in China. Corp. Soc. Responsib. Environ. Manag. 2020, 27, 2735–2750. [Google Scholar] [CrossRef]
  151. Casciaro, T.; Piskorski, M.J. Power Imbalance, Mutual Dependence, and Constraint Absorption: A Closer Look at Resource Dependence Theory. Adm. Sci. Q. 2005, 50, 167–199. [Google Scholar] [CrossRef]
  152. Kim, Y.; Choi, T.Y.; Yan, T.; Dooley, K. Structural Investigation of Supply Networks: A Social Network Analysis Approach. J. Oper. Manag. 2011, 29, 194–211. [Google Scholar] [CrossRef]
  153. Bellamy, M.A.; Dhanorkar, S.; Subramanian, R. Administrative Environmental Innovations, Supply Network Structure, and Environmental Disclosure. J. Oper. Manag. 2020, 66, 895–932. [Google Scholar] [CrossRef]
  154. Shi, W.; Markoczy, L.; Dess, G.G. The Role of Middle Management in the Strategy Process: Group Affiliation, Structural Holes, and Tertius Iungens. J. Manag. 2009, 35, 1453–1480. [Google Scholar] [CrossRef]
  155. Batjargal, B. The Effects of Network’s Structural Holes: Polycentric Institutions, Product Portfolio, and New Venture Growth in China and Russia. Strateg. Entrep. 2010, 4, 146–163. [Google Scholar] [CrossRef]
  156. Gulati, R.; Dialdin, D.A.; Wang, L. Organizational Networks. In The Blackwell Companion to Organizations; Baum, J.A.C., Ed.; Wiley: Hoboken, NJ, USA, 2017; pp. 281–303. ISBN 978-0-631-21694-0. [Google Scholar]
  157. Zhao, S.; Li, J. Impact of Innovation Network on Regional Innovation Performance: Do Network Density, Network Openness and Network Strength Have Any Influence? J. Sci. Technol. Policy Manag. 2022, 14, 982–999. [Google Scholar] [CrossRef]
  158. GB/T4754-2011; Industrial Classification for National Economic Activities. Chinese Standard: Beijing, China, 2011.
  159. Xia, G.; Kaihua, C. The Complex Network Analysis of the Structure Evolution of Collaborative Innovation Networks: An Example of the Industry-University-Research Collaboration of Chinese ICT Industry. Sci. Res. Manag. 2015, 36, 28. [Google Scholar]
  160. Nepelski, D.; De Prato, G. The Structure and Evolution of ICT Global Innovation Network. Ind. Innov. 2018, 25, 940–965. [Google Scholar] [CrossRef]
  161. Zhang, H.; Xiong, H.; Wang, Q.; Gu, Y. The Impact of Enterprise Niche on Dual Innovation Performance: Moderating Role of Innovation Openness. Eur. J. Innov. Manag. 2023, 26, 1547–1569. [Google Scholar] [CrossRef]
  162. Huang, X.; Liu, W.; Zhang, Z.; Zou, X.; Li, P. Quantity or Quality: Environmental Legislation and Corporate Green Innovations. Ecol. Econ. 2023, 204, 107684. [Google Scholar] [CrossRef]
  163. Fang, Z.; Kong, X.; Sensoy, A.; Cui, X.; Cheng, F. Government’s Awareness of Environmental Protection and Corporate Green Innovation: A Natural Experiment from the New Environmental Protection Law in China. Econ. Anal. Policy 2021, 70, 294–312. [Google Scholar] [CrossRef]
  164. Amore, M.D.; Bennedsen, M. Corporate Governance and Green Innovation. J. Environ. Econ. Manag. 2016, 75, 54–72. [Google Scholar] [CrossRef]
  165. Dosi, G.; Marengo, L.; Pasquali, C. How Much Should Society Fuel the Greed of Innovators?: On the Relations between Appropriability, Opportunities and Rates of Innovation. Res. Policy 2006, 35, 1110–1121. [Google Scholar] [CrossRef]
  166. Hall, B.H.; Harhoff, D. Recent Research on the Economics of Patents. Annu. Rev. Econ. 2012, 4, 541–565. [Google Scholar] [CrossRef]
  167. Bloch, F.; Jackson, M.O.; Tebaldi, P. Centrality Measures in Networks. Soc. Choice Welf. 2023, 61, 413–453. [Google Scholar] [CrossRef]
  168. Cheng, H.; Xu, X.; Li, Z.; Zhang, Z. The Synergy of Inventor Cooperative Network Dual Embeddedness and Firm Innovation: The Mediating Role of Ambidextrous Learning. Technol. Anal. Strateg. Manag. 2024, 36, 89–104. [Google Scholar] [CrossRef]
  169. Martin, G.; Gözübüyük, R.; Becerra, M. Interlocks and Firm Performance: The Role of Uncertainty in the Directorate Interlock-Performance Relationship. Strateg. Manag. J. 2015, 36, 235–253. [Google Scholar] [CrossRef]
  170. Mazzola, E.; Perrone, G.; Handfield, R. Change Is Good, But Not Too Much: Dynamic Positioning in the Interfirm Network and New Product Development. J. Prod. Innov. Manag. 2018, 35, 960–982. [Google Scholar] [CrossRef]
  171. Oliver, C. Strategic Responses to Institutional Processes. Acad. Manag. Rev. 1991, 16, 145–179. [Google Scholar] [CrossRef]
  172. Zhang, S.; Wu, Z.; Dou, W.; Hao, Y. How Does Economic Policy Uncertainty Affect Corporate Green Innovation? Evidence from China. J. Environ. Plan. Manag. 2025, 68, 1363–1389. [Google Scholar] [CrossRef]
  173. Wiseman, J. An Evaluation of Environmental Disclosures Made in Corporate Annual Reports. Account. Organ. Soc. 1982, 7, 53–63. [Google Scholar] [CrossRef]
  174. Wang, S.; Wang, H.; Wang, J.; Yang, F. Does Environmental Information Disclosure Contribute to Improve Firm Financial Performance? An Examination of the Underlying Mechanism. Sci. Total Environ. 2020, 714, 136855. [Google Scholar] [CrossRef]
  175. Zeng, S.X.; Xu, X.D.; Dong, Z.Y.; Tam, V.W. Towards Corporate Environmental Information Disclosure: An Empirical Study in China. J. Clean. Prod. 2010, 18, 1142–1148. [Google Scholar] [CrossRef]
  176. Cho, C.H.; Patten, D.M. The Role of Environmental Disclosures as Tools of Legitimacy: A Research Note. Account. Organ. Soc. 2007, 32, 639–647. [Google Scholar] [CrossRef]
  177. Xu, Q.; Li, X.; Guo, F. Digital Transformation and Environmental Performance: Evidence from Chinese Resource-based Enterprises. Corp. Soc. Responsib. Environ. Manag. 2023, 30, 1816–1840. [Google Scholar] [CrossRef]
  178. ISO 14001:2015; Environmental Management Systems—Requirements with Guidance for Use. ISO: Geneva, Switzerland, 2015.
  179. ISO 9001:2015; Quality Management Systems—Requirements. ISO: Geneva, Switzerland, 2015.
  180. Damanpour, F. An Integration of Research Findings of Effects of Firm Size and Market Competition on Product and Process Innovations. Br. J Manag. 2010, 21, 996–1010. [Google Scholar] [CrossRef]
  181. Coad, A.; Segarra, A.; Teruel, M. Innovation and Firm Growth: Does Firm Age Play a Role? Res. Policy 2016, 45, 387–400. [Google Scholar] [CrossRef]
  182. Huggins, R.; Johnston, A. Knowledge Flow and Inter-Firm Networks: The Influence of Network Resources, Spatial Proximity and Firm Size. Entrep. Reg. Dev. 2010, 22, 457–484. [Google Scholar] [CrossRef]
  183. Balsmeier, B.; Fleming, L.; Manso, G. Independent Boards and Innovation. J. Financ. Econ. 2017, 123, 536–557. [Google Scholar] [CrossRef]
  184. Sierra-Morán, J.; Cabeza-García, L.; González-Álvarez, N.; Botella, J. The Board of Directors and Firm Innovation: A Meta-Analytical Review. BRQ Bus. Res. Q. 2024, 27, 182–207. [Google Scholar] [CrossRef]
  185. Zhai, Y.; Cai, Z.; Lin, H.; Yuan, M.; Mao, Y.; Yu, M. Does Better Environmental, Social, and Governance Induce Better Corporate Green Innovation: The Mediating Role of Financing Constraints. Corp. Soc. Responsib. Environ. Manag. 2022, 29, 1513–1526. [Google Scholar] [CrossRef]
  186. Ferris, S.P.; Javakhadze, D.; Rajkovic, T. The International Effect of Managerial Social Capital on the Cost of Equity. J. Bank. Financ. 2017, 74, 69–84. [Google Scholar] [CrossRef]
  187. Chuluun, T.; Prevost, A.; Puthenpurackal, J. Board Ties and the Cost of Corporate Debt. Financ. Manag. 2014, 43, 533–568. [Google Scholar] [CrossRef]
  188. Feng, Y.; Song, K.; Tian, Y.S. Director Networks and Initial Public Offerings. J. Bank. Financ. 2019, 106, 246–264. [Google Scholar] [CrossRef]
  189. Cohen, W.M.; Levinthal, D.A. Absorptive Capacity: A New Perspective on Learning and Innovation. Adm. Sci. Q. 1990, 35, 128–152. [Google Scholar] [CrossRef]
Figure 1. Social network connection diagram of sample companies. Source: author’s elaboration.
Sustainability 17 03217 g001
Figure 2. The conceptual framework of this research: the impact of corporate social networks on green innovation, with R&D investment as the mediating variable and environmental information disclosure as the moderating variable.
Sustainability 17 03217 g002
Figure 3. Conceptual model with the hypotheses accepted.
Sustainability 17 03217 g003
Table 1. Environmental information disclosure evaluation items and scoring method.
Disclosure TypeDisclosure ItemScore Explanation
Environmental Management DisclosureEnvironmental Protection ConceptDisclosure: 2 points; None: 0 points
Environmental Goals
Environmental Management System
Environmental Education and Training
Environmental Special Actions
Environmental Emergency Mechanism
Environmental Honors or Awards
“Three Simultaneities” System
Environmental Certification DisclosureWhether ISO14001 [178] certification is obtainedYes: 2 points; No: 0 points
Whether ISO9001 [179] certification is obtained
Environmental Information Disclosure MediumListed Company Annual ReportDisclosure: 2 points; None: 0 points
Corporate Social Responsibility Report
Environmental Report
Environmental Liability DisclosureWastewater Discharge VolumeQuantitative and qualitative description: 2 points;
Only qualitative: 1 point; None: 0 points
COD Emissions
SO2 Emissions
CO2 Emissions
Smoke and Dust Emissions
Industrial Solid Waste Emissions
Environmental Performance and Governance DisclosureAir Emission Reduction Governance
Water Emission Reduction Governance
Dust and Smoke Governance
Utilization and Disposal of Solid Waste
Governance of Noise, Light Pollution, Radiation, etc.
Implementation of Clean Production
Table 2. Definition of variables and measurement methods.
Variable TypeVariable NameVariable CodeVariable Definition
Dependent variablesgreen innovationGIln (the number of green patent applications + 1)
Independent variablesdegree centralityDegNumber of directly connected enterprises
structural holesSHDegree of unconstrained “freedom”
network densityDensityObservable actual connections/All potential connections
Mediating variablesR&D expenditureExpenditureThe logarithm of R&D investment amount
R&D personnelPersonnelProportion of R&D personnel
Moderating variablesenvironmental information disclosureEIDMonetized information: quantitative and qualitative description: 2 points; only qualitative: 1 point; none: 0 points
Non-monetized information: disclosure: 2 points; none: 0 points
Control variablesfirm sizeFirNatural logarithm of the total assets of the enterprise for the current year.
independent directorsInd The proportion of independent directors among the board of directors.
firm ageageThe difference between the fiscal year’s end and the company’s founding year.
return on assetsROANet profit/the ending balance of total assets
Table 3. Descriptive statistics of variables. Observing the number of observations and the mean, standard deviation, minimum value, median, maximum value, 25th percentile, and 75th percentile of each variable provides an understanding of the dataset’s characteristics.
VarNameObsMeanSDMinMedianMaxP25P75
GI455613.81443.6971.0004.0001179.0002.00011.000
Deg45560.0030.0020.0000.0020.0120.0010.004
SH45560.6190.282−0.1250.7041.0000.4810.827
Density45560.4840.3300.0000.4001.0000.2280.750
EID45562.2080.8750.0002.3033.8501.6092.890
Personnel455613.58413.0680.00011.55086.1803.53018.130
Expenditure455618.5951.46211.58018.57125.02517.75519.429
Fir455622.7041.28617.95422.56929.30321.80923.425
Ind45560.3750.0580.0000.3330.7140.3330.429
age455620.0756.3574.42020.00043.92015.50024.330
ROA45560.0290.127−2.0710.0326.3650.0120.060
Table 4. Correlation coefficients of the variables.
DegSHDensityGIEIDExpenditurePersonnelFirIndAgeROA
Deg1
SH0.620 ***1
Density−0.511 ***−0.856 ***1
GI0.079 ***0.073 ***−0.081 ***1
EID−0.045 ***−0.039 ***0.060 ***0.133 ***1
Expenditure0.196 ***0.118 ***−0.133 ***0.343 ***0.336 ***1
Personnel0.172 ***0.130 ***−0.156 ***0.059 ***−0.008000.267 ***1
Fir0.00200−0.01100.036 ***0.332 ***0.384 ***0.589 ***−0.044 ***1
Ind−0.0120−0.00600−0.045 ***0.0190−0.02100.039 ***0.024 *0.028 **1
age−0.068 ***−0.064 ***0.072 ***0.061 ***0.160 ***0.095 ***0.089 ***0.274 ***0.038 **1
ROA−0.0100−0.01500.008000.023 *0.043 ***0.044 ***−0.037 ***0.00700−0.0170−0.071 ***1
Standard errors in parentheses * p < 0.1, ** p < 0.05, *** p < 0.01.
Table 5. Regression results of the relationship between corporate social networks and green innovation, with the mediating effect of R&D personnel investment.
(1)(2)(3)(4)(5)(6)(7)(8)(9)
GIPersonnelGIGIPersonnelGIGIPersonnelGI
Deg1610.494 ***1121.244 ***1169.084 ***
(293.715)(76.121)(301.209)
SH 13.349 ***6.217 ***11.043 ***
(2.354)(0.630)(2.424)
Density −13.742 ***−6.205 ***−11.096 ***
(2.020)(0.537)(2.085)
Personnel 0.324 *** 0.334 *** 0.320 ***
(0.059) (0.058) (0.058)
Fir12.712 ***−1.579 ***14.218 ***12.772 ***−1.508 ***14.310 ***12.832 ***−1.483 ***14.333 ***
(0.530)(0.146)(0.570)(0.530)(0.148)(0.569)(0.529)(0.147)(0.568)
Ind5.7203.9238.3964.7183.4897.716−0.3831.0933.481
(11.224)(2.960)(11.433)(11.223)(3.000)(11.425)(11.239)(2.996)(11.447)
age−0.143−0.131 ***−0.153−0.142−0.137 ***−0.148−0.130−0.130 ***−0.138
(0.118)(0.031)(0.119)(0.118)(0.031)(0.119)(0.118)(0.031)(0.119)
ROA9.059−2.6428.7539.011−2.8718.8378.506−2.8698.799
(7.012)(1.910)(7.377)(7.010)(1.935)(7.372)(6.998)(1.927)(7.365)
_cons−278.839 ***47.378 ***−316.594 ***−283.516 ***45.455 ***−322.223 ***−268.323 ***52.466 ***−309.028 ***
(12.501)(3.414)(13.473)(12.569)(3.482)(13.519)(12.497)(3.451)(13.529)
Firm controlsYesYesYesYesYesYesYesYesYes
Year controlsYesYesYesYesYesYesYesYesYes
N455645564556455645564556455645564556
r20.1220.0800.1350.1230.0550.1360.1250.0630.138
r2_a0.1190.0770.1320.1200.0520.1330.1220.0590.135
F126.48675.305112.881126.96050.581113.973130.15457.981115.429
Sobel|Z| = 4.115, p = 0.00003872|Z| = 4.17, p = 0.00003043|Z| = 4.876, p = 0.00266071
Standard errors in parentheses *** p < 0.01.
Table 6. The mediation effect of R&D expenditure investment.
(10)(11)(12)(13)(14)(15)(16)(17)(18)
GIExpenditureGIGIExpenditureGIGIExpenditureGI
Deg1610.494 ***120.510 ***698.231 **
(293.715)(7.707)(300.040)
SH 13.349 ***0.566 ***9.106 ***
(2.354)(0.064)(2.394)
Density −13.742 ***−0.598 ***−8.927 ***
(2.020)(0.055)(2.063)
Expenditure 7.091 *** 7.114 *** 6.997 ***
(0.577) (0.566) (0.568)
Fir12.712 ***0.686 ***8.859 ***12.772 ***0.694 ***8.889 ***12.832 ***0.696 ***9.006 ***
(0.530)(0.015)(0.685)(0.530)(0.015)(0.682)(0.529)(0.015)(0.683)
Ind5.7200.2518.6384.7180.1918.097−0.383−0.0414.683
(11.224)(0.300)(11.353)(11.223)(0.305)(11.340)(11.239)(0.305)(11.366)
age−0.143−0.024 ***−0.010−0.142−0.025 ***−0.003−0.130−0.025 ***0.004
(0.118)(0.003)(0.119)(0.118)(0.003)(0.119)(0.118)(0.003)(0.119)
ROA9.0591.514 ***−2.6819.0111.482 ***−2.5288.5061.485 ***−2.360
(7.012)(0.193)(7.346)(7.010)(0.196)(7.334)(6.998)(0.195)(7.330)
_cons−278.839 ***3.071 ***−324.088 ***−283.516 ***2.950 ***−328.868 ***−268.323 ***3.604 ***−318.266 ***
(12.501)(0.345)(13.202)(12.569)(0.354)(13.260)(12.497)(0.351)(13.237)
Firm controlsYesYesYesYesYesYesYesYesYes
Year controlsYesYesYesYesYesYesYesYesYes
N455645564556455645564556455645564556
r20.1220.3760.1580.1230.3530.1600.1250.3590.161
r2_a0.1190.3740.1550.1200.3500.1570.1220.3560.158
F126.486519.625135.109126.960469.299136.898130.154481.938137.742
Sobel|Z| = 2.54, p = 0.01109756|Z| = 3.581, p = 0.0003419|Z| = 4.102, p = 0.00004094
Standard errors in parentheses ** p < 0.05, *** p < 0.01.
Table 7. The moderating effect of environmental information disclosure.
(19)(20)(21)(22)(23)(24)
GIGIGIGIGIGI
Deg1621.713 ***1552.324 ***
(293.817)(294.557)
EID × Deg 945.898 ***
(327.052)
SH 13.451 ***13.075 ***
(2.355)(2.356)
EID × SH 8.035 ***
(2.686)
Density −13.904 ***−13.364 ***
(2.023)(2.028)
EID × Density −7.564 ***
(2.341)
EID1.0850.9191.1050.9741.2531.071
(0.829)(0.830)(0.829)(0.829)(0.828)(0.829)
Fir12.461 ***12.407 ***12.516 ***12.466 ***12.542 ***12.486 ***
(0.564)(0.564)(0.564)(0.564)(0.563)(0.563)
Ind6.3917.1665.3945.6080.3210.021
(11.235)(11.229)(11.233)(11.224)(11.247)(11.235)
age−0.139−0.171−0.138−0.166−0.126−0.146
(0.118)(0.118)(0.118)(0.118)(0.118)(0.118)
ROA8.3068.2268.2448.0587.6337.735
(7.035)(7.029)(7.033)(7.027)(7.021)(7.013)
_cons−275.855 ***−273.632 ***−280.513 ***−278.272 ***−264.765 ***−262.658 ***
(12.706)(12.719)(12.768)(12.779)(12.715)(12.718)
Firm controlsYesYesYesYesYesYes
Year controlsYesYesYesYesYesYes
N455645564556455645564556
r20.1230.1240.1230.1250.1260.128
r2_a0.1200.1210.1200.1210.1230.125
F105.70791.948106.11492.393108.87395.006
Standard errors in parentheses *** p < 0.01.
Table 8. A robustness test of the mediation effect of R&D personnel. Used to replace the dependent variable approach.
(25)(26)(27)(28)(29)(30)(31)(32)(33)
grantedGIPersonnelgrantedGIgrantedGIPersonnelgrantedGIgrantedGIPersonnelgrantedGI
Deg475.449 ***1121.244 ***273.625
(165.609)(76.121)(169.505)
SH 5.580 ***6.217 ***4.533 ***
(1.326)(0.630)(1.364)
Density −5.999 ***−6.205 ***−4.798 ***
(1.139)(0.537)(1.173)
Personnel 0.123 *** 0.119 *** 0.112 ***
(0.033) (0.033) (0.033)
Fir6.697 ***−1.579 ***7.615 ***6.713 ***−1.508 ***7.628 ***6.739 ***−1.483 ***7.637 ***
(0.299)(0.146)(0.321)(0.299)(0.148)(0.320)(0.298)(0.147)(0.320)
Ind7.5273.9236.6317.1253.4896.4184.8821.0934.580
(6.329)(2.960)(6.434)(6.323)(3.000)(6.427)(6.334)(2.996)(6.441)
age−0.153 **−0.131 ***−0.166 **−0.149 **−0.137 ***−0.162 **−0.144 **−0.130 ***−0.157 **
(0.067)(0.031)(0.067)(0.066)(0.031)(0.067)(0.066)(0.031)(0.067)
ROA5.356−2.6423.9825.431−2.8714.1035.225−2.8694.099
(3.953)(1.910)(4.151)(3.949)(1.935)(4.147)(3.944)(1.927)(4.144)
_cons−145.265 ***47.378 ***−166.379 ***−147.696 ***45.455 ***−168.677 ***−141.222 ***52.466 ***−163.093 ***
(7.049)(3.414)(7.582)(7.081)(3.482)(7.605)(7.044)(3.451)(7.612)
Firm controlsYesYesYesYesYesYesYesYesYes
Year controlsYesYesYesYesYesYesYesYesYes
N455645564556455645564556455645564556
r20.1040.0800.1190.1060.0550.1210.1080.0630.122
r2_a0.1020.0770.1160.1030.0520.1180.1050.0590.119
F105.92575.30597.797108.03450.58199.393110.27557.981100.468
Sobel|Z| = 3.327, p = 0.00087677|Z| = 2.123, p = 0.03377012|Z| = 4.002, p = 0.00006287
Standard errors in parentheses ** p < 0.05, *** p < 0.01.
Table 9. Robustness test of the mediation effect of R&D expenditure: replacing the dependent variable approach.
(34)(35)(36)(37)(38)(39)(40)(41)(42)
grantedGIExpendituregrantedGIgrantedGIExpendituregrantedGIgrantedGIExpendituregrantedGI
Deg475.449 ***120.510 ***−17.198
(165.609)(7.707)(168.882)
SH 5.580 ***0.566 ***3.260 **
(1.326)(0.064)(1.348)
Density −5.999 ***−0.598 ***−3.424 ***
(1.139)(0.055)(1.162)
Expenditure 3.607 *** 3.496 *** 3.444 ***
(0.325) (0.319) (0.320)
Fir6.697 ***0.686 ***4.920 ***6.713 ***0.694 ***4.998 ***6.739 ***0.696 ***5.048 ***
(0.299)(0.015)(0.385)(0.299)(0.015)(0.384)(0.298)(0.015)(0.385)
Ind7.5270.2516.7497.1250.1916.6734.882−0.0415.357
(6.329)(0.300)(6.390)(6.323)(0.305)(6.385)(6.334)(0.305)(6.401)
age−0.153 **−0.024 ***−0.085−0.149 **−0.025 ***−0.081−0.144 **−0.025 ***−0.078
(0.067)(0.003)(0.067)(0.066)(0.003)(0.067)(0.066)(0.003)(0.067)
ROA5.3561.514 ***−1.6325.4311.482 ***−1.2545.2251.485 ***−1.164
(3.953)(0.193)(4.135)(3.949)(0.196)(4.129)(3.944)(0.195)(4.128)
_cons−145.265 ***3.071 ***−171.468 ***−147.696 ***2.950 ***−173.375 ***−141.222 ***3.604 ***−169.444 ***
(7.049)(0.345)(7.431)(7.081)(0.354)(7.466)(7.044)(0.351)(7.455)
Firm controlsYesYesYesYesYesYesYesYesYes
Year controlsYesYesYesYesYesYesYesYesYes
N455645564556455645564556455645564556
r20.1040.3760.1400.1060.3530.1410.1080.3590.142
r2_a0.1020.3740.1370.1030.3500.1380.1050.3560.139
F105.925519.625116.951108.034469.299118.082110.275481.938118.633
Sobel|Z| = 0.2653, p = 0.79078957|Z| = 2.51, p = 0.01208412|Z| = 2.989, p = 0.00279575
Standard errors in parentheses ** p < 0.05, *** p < 0.01.
Table 10. Robustness test of the moderating effect. Replacing the dependent variable approach.
(43)(44)(45)(46)(47)(48)
grantedGIgrantedGIgrantedGIgrantedGIgrantedGIgrantedGI
Deg484.584 ***463.507 ***
(165.633)(166.159)
EID × Deg 287.329
(184.489)
SH 5.664 ***5.508 ***
(1.326)(1.328)
EID × SH 3.339 **
(1.513)
Density −6.126 ***−5.905 ***
(1.140)(1.143)
EID × Density −3.087 **
(1.320)
EID0.883 *0.833 *0.908 *0.854 *0.976 **0.902 *
(0.467)(0.468)(0.467)(0.467)(0.467)(0.468)
Fir6.492 ***6.476 ***6.503 ***6.482 ***6.514 ***6.491 ***
(0.318)(0.318)(0.318)(0.318)(0.317)(0.317)
Ind8.0748.3097.6817.7705.4315.308
(6.334)(6.334)(6.327)(6.325)(6.338)(6.335)
age−0.150 **−0.160 **−0.146 **−0.158 **−0.140 **−0.148 **
(0.067)(0.067)(0.066)(0.067)(0.066)(0.066)
ROA4.7434.7194.8014.7244.5444.586
(3.966)(3.965)(3.961)(3.960)(3.956)(3.954)
_cons−142.835 ***−142.159 ***−145.228 ***−144.297 ***−138.450 ***−137.590 ***
(7.163)(7.175)(7.192)(7.201)(7.165)(7.171)
Firm controlsYesYesYesYesYesYes
Year controlsYesYesYesYesYesYes
N455645564556455645564556
r20.1050.1060.1070.1080.1090.110
r2_a0.1020.1020.1040.1050.1060.107
F88.91676.58490.71478.51792.69380.311
Standard errors in parentheses * p < 0.1, ** p < 0.05, *** p < 0.01.
Table 11. Results of robust test using lagged independent variable regression.
(49)(50)(51)(52)(53)(54)
GIGIGIGIGIGI
L.Deg1837.490 ***
(391.393)
L2.Deg 1889.963 ***
(443.736)
L.SH 17.287 ***
(3.253)
L2.SH 18.751 ***
(3.690)
L.Density −17.568 ***
(2.821)
L2.Density −18.865 ***
(3.184)
Fir16.192 ***17.915 ***16.240 ***17.990 ***16.321 ***18.090 ***
(0.732)(0.838)(0.732)(0.836)(0.731)(0.835)
Ind2.6673.1401.3652.162−4.517−5.117
(15.122)(17.165)(15.107)(17.140)(15.117)(17.156)
age−0.289 *−0.293 *−0.292 *−0.296 *−0.278 *−0.282 *
(0.150)(0.171)(0.149)(0.171)(0.149)(0.171)
ROA9.8026.95710.4677.8519.6716.612
(9.112)(9.840)(9.106)(9.830)(9.088)(9.809)
_cons−353.676 ***−392.929 ***−359.682 ***−400.452 ***−340.571 ***−379.725 ***
(17.118)(19.577)(17.212)(19.682)(17.033)(19.501)
Firm controlsYesYesYesYesYesYes
Year controlsYesYesYesYesYesYes
N3218.0002794.0003218.0002794.0003218.0002794.000
r20.1420.1510.1440.1540.1470.157
r2_a0.1410.1500.1420.1520.1450.155
F106.43599.527107.872101.328110.310103.502
Standard errors in parentheses * p < 0.1, *** p < 0.01.
Table 12. Robustness test of two-stage least squares method.
(55)(56)(57)(58)(59)(60)
First StageSecond StageFirst StageSecond StageFirst StageSecond Stage
VARIABLESDegreeGISHGIDensityGI
Deg 5785.6971 ***
(1642.648)
SH 50.9433 ***
(13.779)
Density −50.7925 ***
(11.314)
avgDeg1.3790 ***
(0.186)
avgSH 0.6612 ***
(0.099)
avgDen 0.4715 ***
(0.082)
FirmNum0.0000 *** 0.0000 *** −0.0000 ***
(0.000) (0.000) (0.000)
Fir0.0001 ***12.4966 ***0.004712.6700 ***−0.000212.8935 ***
(0.000)(0.537)(0.003)(0.538)(0.004)(0.544)
Ind0.00006.13800.05312.3059−0.3990 ***−16.3756
(0.001)(11.462)(0.070)(11.553)(0.081)(12.581)
age−0.0000 ***−0.0984−0.0030 ***−0.10480.0038 ***−0.0682
(0.000)(0.118)(0.001)(0.117)(0.001)(0.118)
ROA−0.000510.6552−0.061710.83290.03568.8091
(0.000)(7.159)(0.043)(7.198)(0.050)(7.216)
Constant−0.0023 ***−287.3889 ***0.3737 ***−304.8774 ***0.2567 **−247.6969 ***
(0.001)(13.272)(0.080)(15.511)(0.112)(13.572)
Observations455345534553455345534553
R-squared0.0380.0860.0350.0760.0450.063
Standard errors in parentheses ** p < 0.05, *** p < 0.01.
Disclaimer/Publisher’s Note: The statements, opinions and data contained in all publications are solely those of the individual author(s) and contributor(s) and not of MDPI and/or the editor(s). MDPI and/or the editor(s) disclaim responsibility for any injury to people or property resulting from any ideas, methods, instructions or products referred to in the content.

